Occidental, CA Map & Demographics
Occidental Map
Occidental Overview
$85,917
PER CAPITA INCOME
$86,042
AVG HOUSEHOLD INCOME
0.50
INEQUALITY / GINI INDEX
1,061
TOTAL POPULATION
592
MALE POPULATION
469
FEMALE POPULATION
126.23
MALES / 100 FEMALES
79.22
FEMALES / 100 MALES
60.3
MEDIAN AGE
2.5
AVG FAMILY SIZE
1.9
AVG HOUSEHOLD SIZE
592
LABOR FORCE [ PEOPLE ]
61.5%
PERCENT IN LABOR FORCE
3.7%
UNEMPLOYMENT RATE
Occidental Zip Codes
Occidental Area Codes
Income in Occidental
Income Overview in Occidental
| Characteristic | Number | Measure |
| Per Capita Income | 1,061 | $85,917 |
| Median Family Income | 260 | $0 |
| Mean Family Income | 260 | $237,526 |
| Median Household Income | 550 | $86,042 |
| Mean Household Income | 550 | $163,756 |
| Income Deficit | 260 | $0 |
| Wage / Income Gap (%) | 1,061 | 0.00% |
| Wage / Income Gap ($) | 1,061 | 100.00¢ per $1 |
| Gini / Inequality Index | 1,061 | 0.50 |
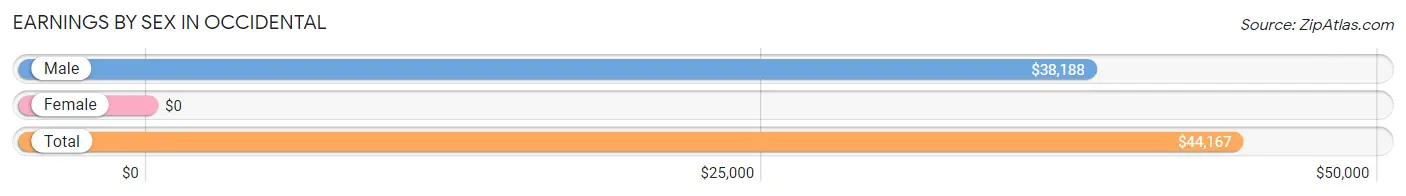
Earnings by Sex in Occidental
| Sex | Number | Average Earnings |
| Male | 364 (60.3%) | $38,188 |
| Female | 240 (39.7%) | $0 |
| Total | 604 (100.0%) | $44,167 |
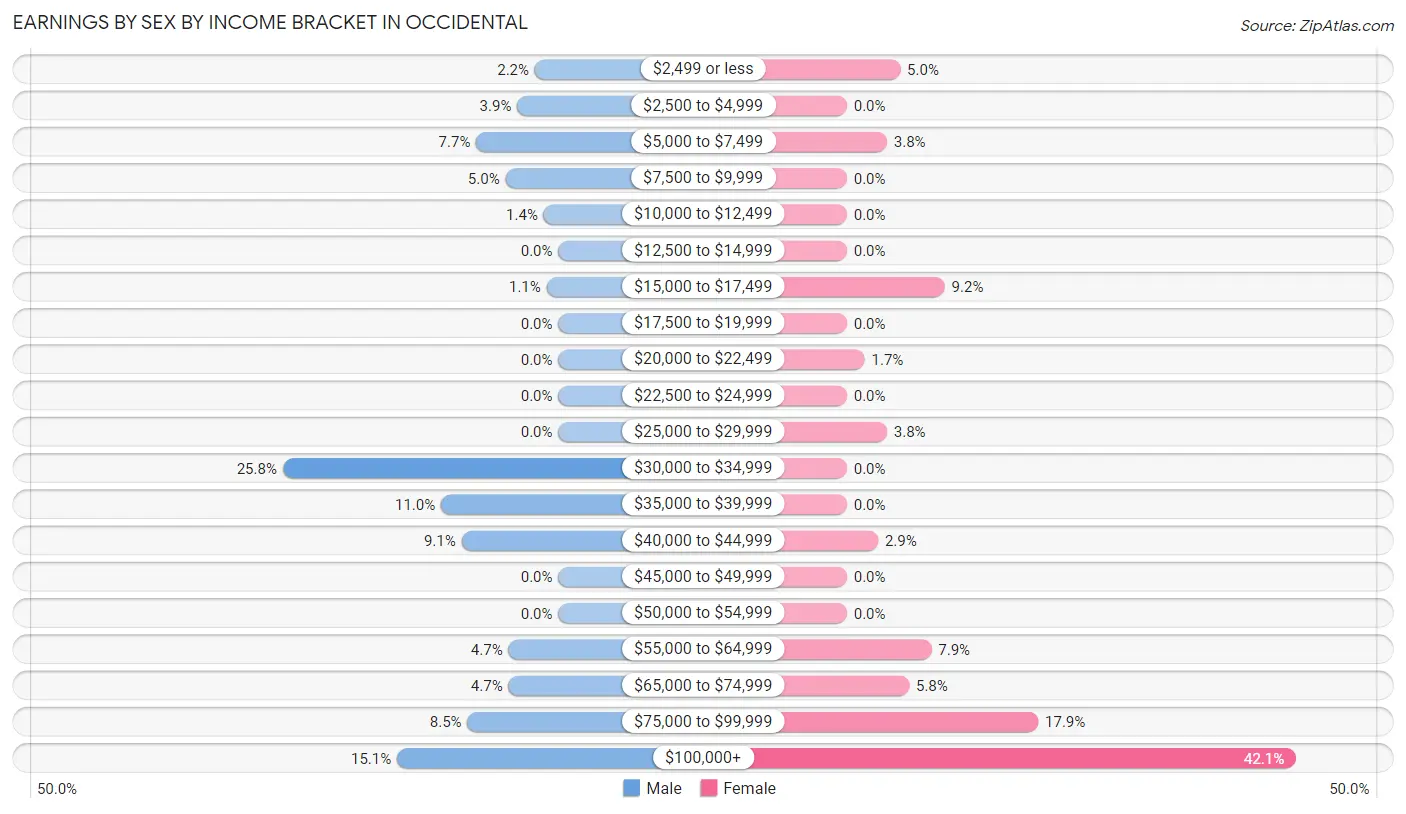
Earnings by Sex by Income Bracket in Occidental
The most common earnings brackets in Occidental are $30,000 to $34,999 for men (94 | 25.8%) and $100,000+ for women (101 | 42.1%).
| Income | Male | Female |
| $2,499 or less | 8 (2.2%) | 12 (5.0%) |
| $2,500 to $4,999 | 14 (3.8%) | 0 (0.0%) |
| $5,000 to $7,499 | 28 (7.7%) | 9 (3.7%) |
| $7,500 to $9,999 | 18 (5.0%) | 0 (0.0%) |
| $10,000 to $12,499 | 5 (1.4%) | 0 (0.0%) |
| $12,500 to $14,999 | 0 (0.0%) | 0 (0.0%) |
| $15,000 to $17,499 | 4 (1.1%) | 22 (9.2%) |
| $17,500 to $19,999 | 0 (0.0%) | 0 (0.0%) |
| $20,000 to $22,499 | 0 (0.0%) | 4 (1.7%) |
| $22,500 to $24,999 | 0 (0.0%) | 0 (0.0%) |
| $25,000 to $29,999 | 0 (0.0%) | 9 (3.7%) |
| $30,000 to $34,999 | 94 (25.8%) | 0 (0.0%) |
| $35,000 to $39,999 | 40 (11.0%) | 0 (0.0%) |
| $40,000 to $44,999 | 33 (9.1%) | 7 (2.9%) |
| $45,000 to $49,999 | 0 (0.0%) | 0 (0.0%) |
| $50,000 to $54,999 | 0 (0.0%) | 0 (0.0%) |
| $55,000 to $64,999 | 17 (4.7%) | 19 (7.9%) |
| $65,000 to $74,999 | 17 (4.7%) | 14 (5.8%) |
| $75,000 to $99,999 | 31 (8.5%) | 43 (17.9%) |
| $100,000+ | 55 (15.1%) | 101 (42.1%) |
| Total | 364 (100.0%) | 240 (100.0%) |
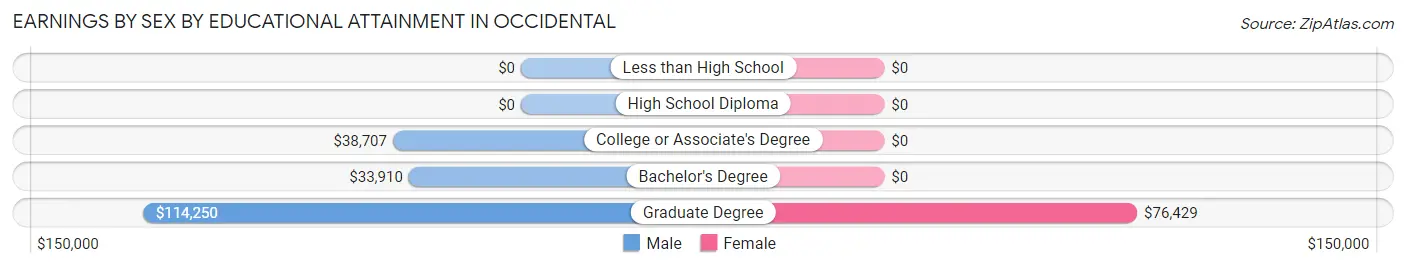
Earnings by Sex by Educational Attainment in Occidental
| Educational Attainment | Male Income | Female Income |
| Less than High School | - | - |
| High School Diploma | - | - |
| College or Associate's Degree | $38,707 | $0 |
| Bachelor's Degree | $33,910 | $0 |
| Graduate Degree | $114,250 | $76,429 |
| Total | $38,625 | $0 |
Family Income in Occidental
Family Income Brackets in Occidental
According to the Occidental family income data, there are 126 families falling into the $200,000+ income range, which is the most common income bracket and makes up 48.5% of all families.
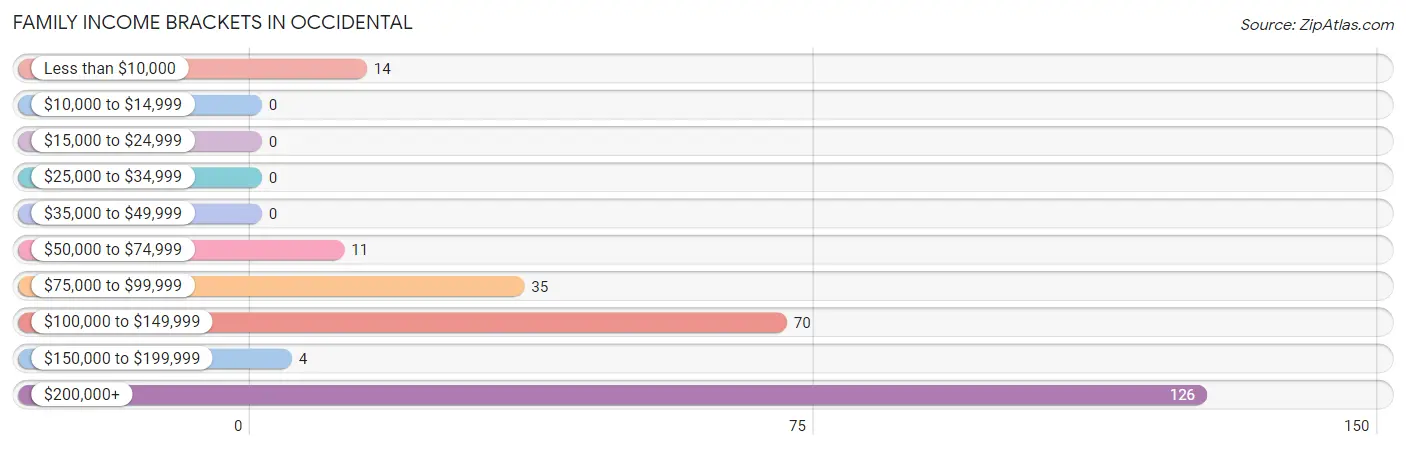
| Income Bracket | # Families | % Families |
| Less than $10,000 | 14 | 5.4% |
| $10,000 to $14,999 | 0 | 0.0% |
| $15,000 to $24,999 | 0 | 0.0% |
| $25,000 to $34,999 | 0 | 0.0% |
| $35,000 to $49,999 | 0 | 0.0% |
| $50,000 to $74,999 | 11 | 4.2% |
| $75,000 to $99,999 | 35 | 13.5% |
| $100,000 to $149,999 | 70 | 26.9% |
| $150,000 to $199,999 | 4 | 1.5% |
| $200,000+ | 126 | 48.5% |
Family Income by Famaliy Size in Occidental
2-person families (204 | 78.5%) account for the highest median family income in Occidental with $250,001 per family, while 2-person families (204 | 78.5%) have the highest median income of $125,000 per family member.
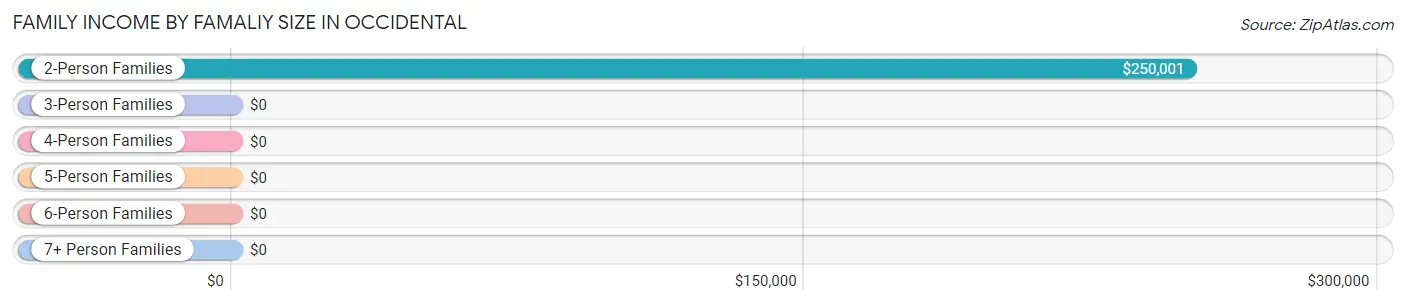
| Income Bracket | # Families | Median Income |
| 2-Person Families | 204 (78.5%) | $250,001 |
| 3-Person Families | 26 (10.0%) | $0 |
| 4-Person Families | 10 (3.8%) | $0 |
| 5-Person Families | 20 (7.7%) | $0 |
| 6-Person Families | 0 (0.0%) | $0 |
| 7+ Person Families | 0 (0.0%) | $0 |
| Total | 260 (100.0%) | $0 |
Family Income by Number of Earners in Occidental
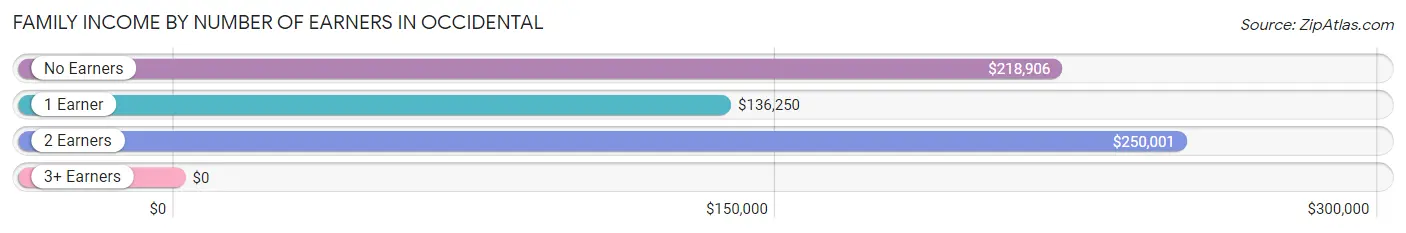
| Number of Earners | # Families | Median Income |
| No Earners | 57 (21.9%) | $218,906 |
| 1 Earner | 65 (25.0%) | $136,250 |
| 2 Earners | 138 (53.1%) | $250,001 |
| 3+ Earners | 0 (0.0%) | $0 |
| Total | 260 (100.0%) | $0 |
Household Income in Occidental
Household Income Brackets in Occidental
With 146 households falling in the category, the $200,000+ income range is the most frequent in Occidental, accounting for 26.6% of all households.
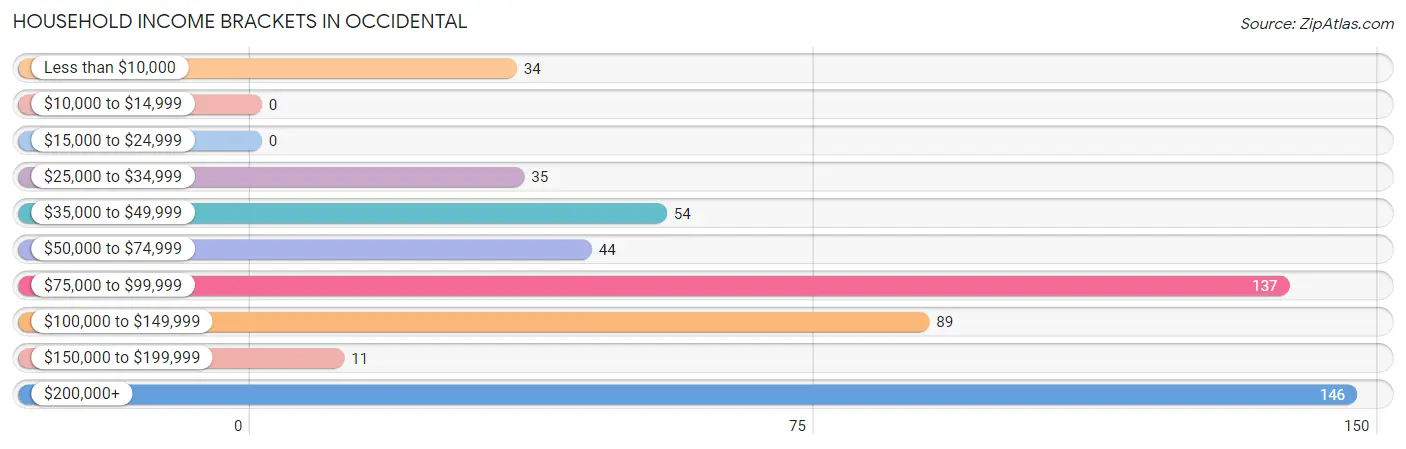
| Income Bracket | # Households | % Households |
| Less than $10,000 | 34 | 6.2% |
| $10,000 to $14,999 | 0 | 0.0% |
| $15,000 to $24,999 | 0 | 0.0% |
| $25,000 to $34,999 | 35 | 6.4% |
| $35,000 to $49,999 | 54 | 9.8% |
| $50,000 to $74,999 | 44 | 8.0% |
| $75,000 to $99,999 | 137 | 24.9% |
| $100,000 to $149,999 | 89 | 16.2% |
| $150,000 to $199,999 | 11 | 2.0% |
| $200,000+ | 146 | 26.5% |
Household Income by Householder Age in Occidental
The median household income in Occidental is $86,042, with the highest median household income of $250,001 found in the 45 to 64 years age bracket for the primary householder. A total of 232 households (42.2%) fall into this category.
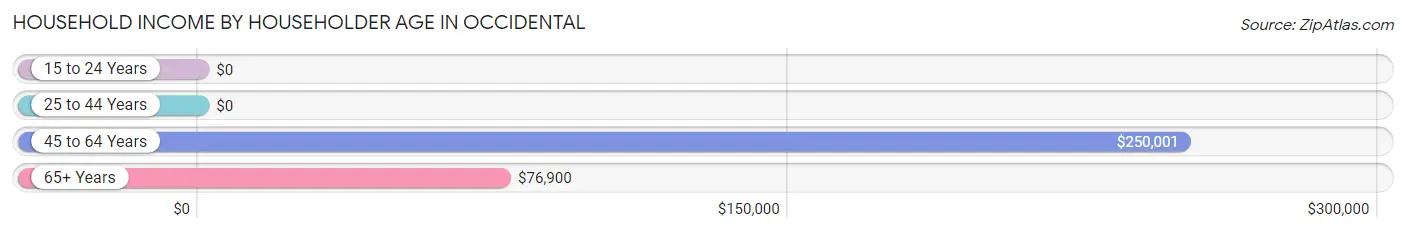
| Income Bracket | # Households | Median Income |
| 15 to 24 Years | 0 (0.0%) | $0 |
| 25 to 44 Years | 68 (12.4%) | $0 |
| 45 to 64 Years | 232 (42.2%) | $250,001 |
| 65+ Years | 250 (45.5%) | $76,900 |
| Total | 550 (100.0%) | $86,042 |
Poverty in Occidental
Income Below Poverty by Sex and Age in Occidental
With 6.2% poverty level for males and 11.3% for females among the residents of Occidental, 35 to 44 year old males and 15 year old females are the most vulnerable to poverty, with 24 males (66.7%) and 10 females (100.0%) in their respective age groups living below the poverty level.
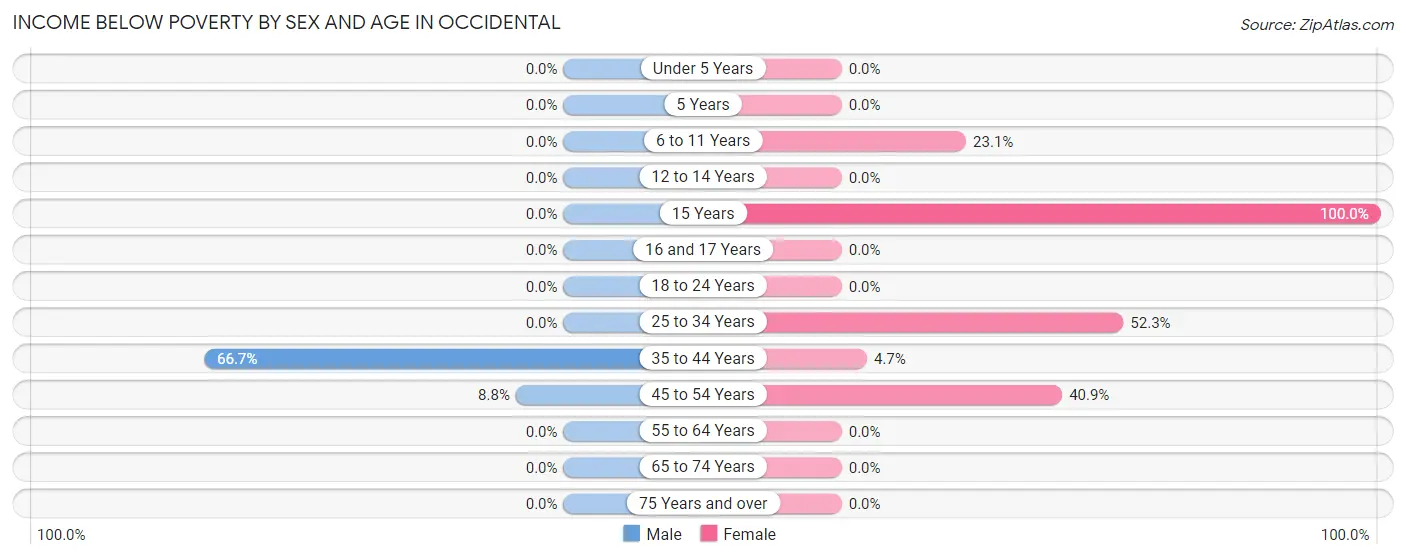
| Age Bracket | Male | Female |
| Under 5 Years | 0 (0.0%) | 0 (0.0%) |
| 5 Years | 0 (0.0%) | 0 (0.0%) |
| 6 to 11 Years | 0 (0.0%) | 6 (23.1%) |
| 12 to 14 Years | 0 (0.0%) | 0 (0.0%) |
| 15 Years | 0 (0.0%) | 10 (100.0%) |
| 16 and 17 Years | 0 (0.0%) | 0 (0.0%) |
| 18 to 24 Years | 0 (0.0%) | 0 (0.0%) |
| 25 to 34 Years | 0 (0.0%) | 23 (52.3%) |
| 35 to 44 Years | 24 (66.7%) | 5 (4.7%) |
| 45 to 54 Years | 13 (8.8%) | 9 (40.9%) |
| 55 to 64 Years | 0 (0.0%) | 0 (0.0%) |
| 65 to 74 Years | 0 (0.0%) | 0 (0.0%) |
| 75 Years and over | 0 (0.0%) | 0 (0.0%) |
| Total | 37 (6.2%) | 53 (11.3%) |
Income Above Poverty by Sex and Age in Occidental
According to the poverty statistics in Occidental, males aged under 5 years and females aged under 5 years are the age groups that are most secure financially, with 100.0% of males and 100.0% of females in these age groups living above the poverty line.
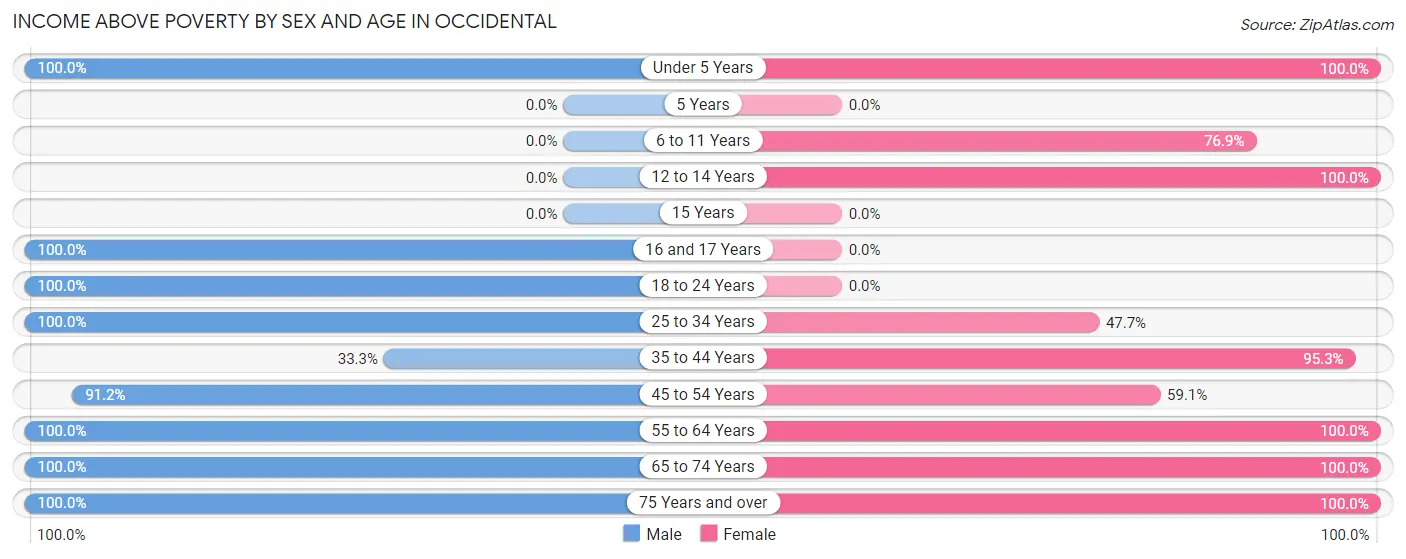
| Age Bracket | Male | Female |
| Under 5 Years | 31 (100.0%) | 28 (100.0%) |
| 5 Years | 0 (0.0%) | 0 (0.0%) |
| 6 to 11 Years | 0 (0.0%) | 20 (76.9%) |
| 12 to 14 Years | 0 (0.0%) | 4 (100.0%) |
| 15 Years | 0 (0.0%) | 0 (0.0%) |
| 16 and 17 Years | 4 (100.0%) | 0 (0.0%) |
| 18 to 24 Years | 22 (100.0%) | 0 (0.0%) |
| 25 to 34 Years | 20 (100.0%) | 21 (47.7%) |
| 35 to 44 Years | 12 (33.3%) | 102 (95.3%) |
| 45 to 54 Years | 134 (91.2%) | 13 (59.1%) |
| 55 to 64 Years | 148 (100.0%) | 112 (100.0%) |
| 65 to 74 Years | 134 (100.0%) | 78 (100.0%) |
| 75 Years and over | 50 (100.0%) | 38 (100.0%) |
| Total | 555 (93.8%) | 416 (88.7%) |
Income Below Poverty Among Married-Couple Families in Occidental
The poverty statistics for married-couple families in Occidental show that 5.8% or 14 of the total 242 families live below the poverty line. Families with 1 or 2 children have the highest poverty rate of 38.9%, comprising of 14 families. On the other hand, families with no children have the lowest poverty rate of 0.0%, which includes 0 families.
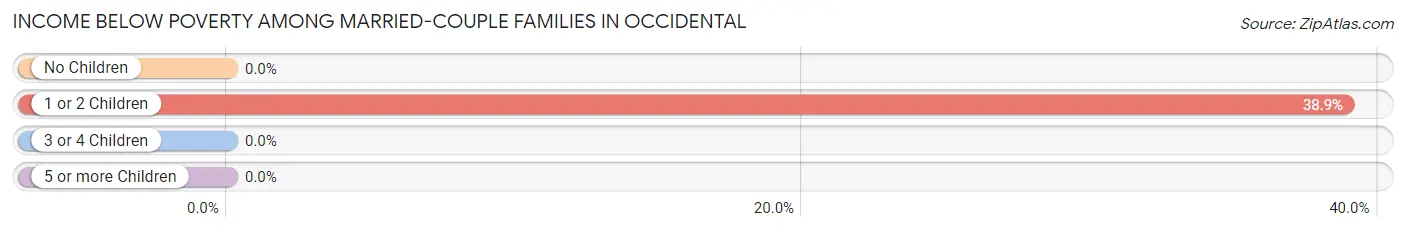
| Children | Above Poverty | Below Poverty |
| No Children | 186 (100.0%) | 0 (0.0%) |
| 1 or 2 Children | 22 (61.1%) | 14 (38.9%) |
| 3 or 4 Children | 20 (100.0%) | 0 (0.0%) |
| 5 or more Children | 0 (0.0%) | 0 (0.0%) |
| Total | 228 (94.2%) | 14 (5.8%) |
Income Below Poverty Among Single-Parent Households in Occidental
| Children | Single Father | Single Mother |
| No Children | 0 (0.0%) | 0 (0.0%) |
| 1 or 2 Children | 0 (0.0%) | 0 (0.0%) |
| 3 or 4 Children | 0 (0.0%) | 0 (0.0%) |
| 5 or more Children | 0 (0.0%) | 0 (0.0%) |
| Total | 0 (0.0%) | 0 (0.0%) |
Income Below Poverty Among Married-Couple vs Single-Parent Households in Occidental
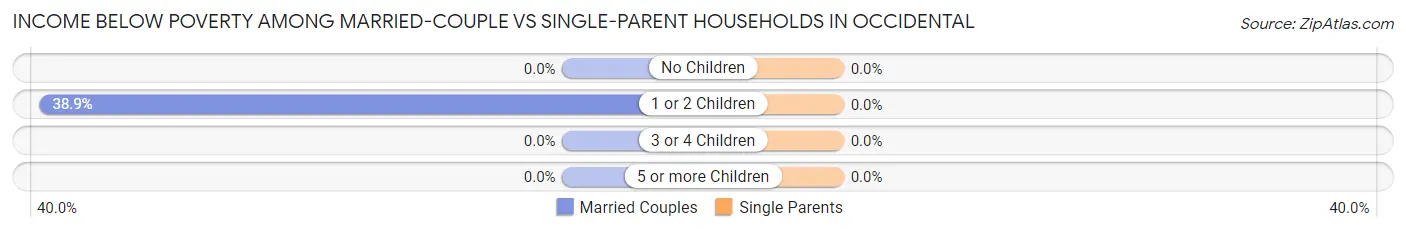
| Children | Married-Couple Families | Single-Parent Households |
| No Children | 0 (0.0%) | 0 (0.0%) |
| 1 or 2 Children | 14 (38.9%) | 0 (0.0%) |
| 3 or 4 Children | 0 (0.0%) | 0 (0.0%) |
| 5 or more Children | 0 (0.0%) | 0 (0.0%) |
| Total | 14 (5.8%) | 0 (0.0%) |
Race in Occidental
The most populous races in Occidental are White / Caucasian (758 | 71.4%), Some other Race (182 | 17.2%), and Two or more Races (97 | 9.1%).
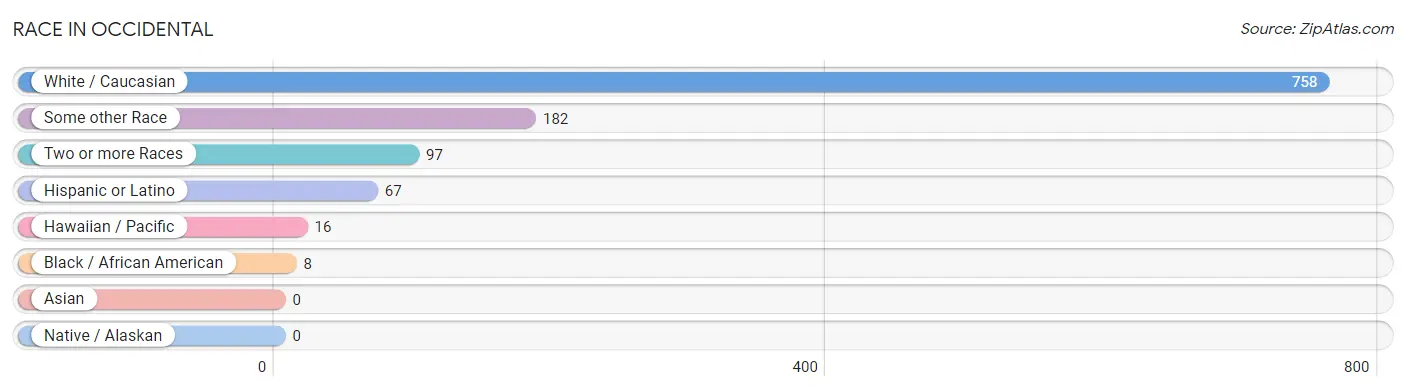
| Race | # Population | % Population |
| Asian | 0 | 0.0% |
| Black / African American | 8 | 0.7% |
| Hawaiian / Pacific | 16 | 1.5% |
| Hispanic or Latino | 67 | 6.3% |
| Native / Alaskan | 0 | 0.0% |
| White / Caucasian | 758 | 71.4% |
| Two or more Races | 97 | 9.1% |
| Some other Race | 182 | 17.2% |
| Total | 1,061 | 100.0% |
Ancestry in Occidental
The most populous ancestries reported in Occidental are German (216 | 20.4%), English (149 | 14.0%), Italian (107 | 10.1%), Hungarian (94 | 8.9%), and Irish (91 | 8.6%), together accounting for 61.9% of all Occidental residents.
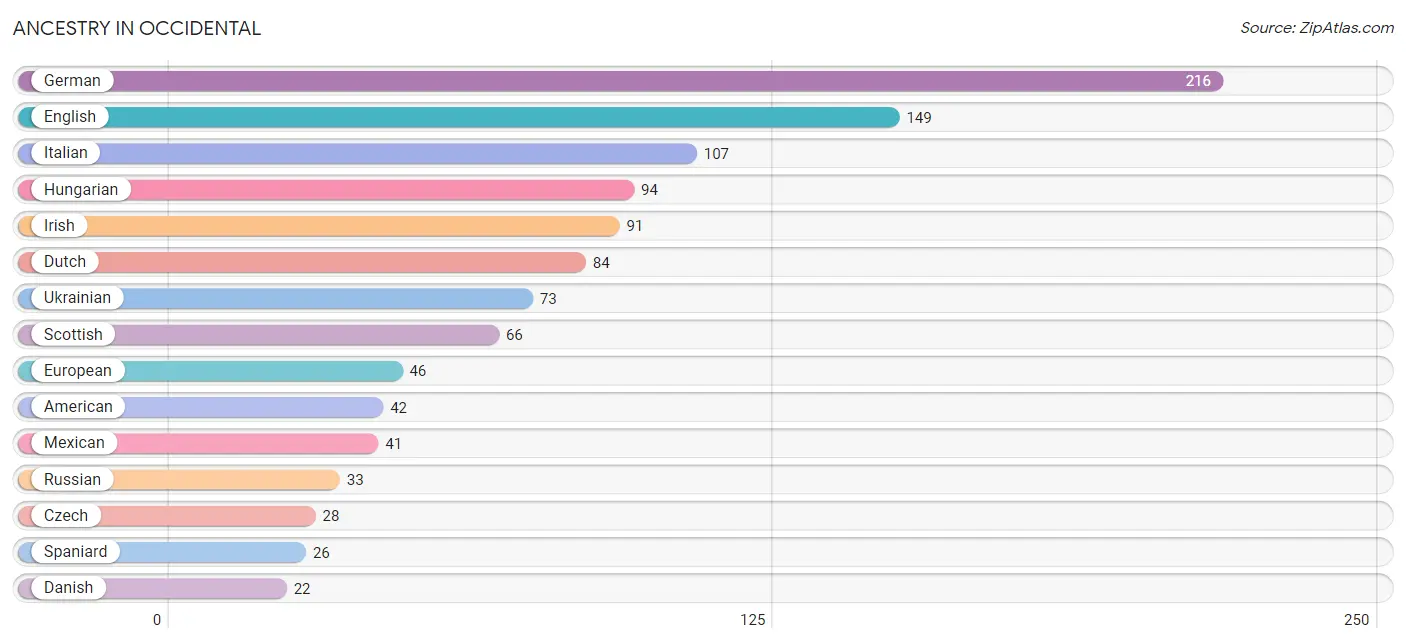
| Ancestry | # Population | % Population |
| American | 42 | 4.0% |
| Armenian | 5 | 0.5% |
| Austrian | 10 | 0.9% |
| British | 16 | 1.5% |
| Bulgarian | 16 | 1.5% |
| Czech | 28 | 2.6% |
| Danish | 22 | 2.1% |
| Dutch | 84 | 7.9% |
| English | 149 | 14.0% |
| European | 46 | 4.3% |
| French | 15 | 1.4% |
| French Canadian | 4 | 0.4% |
| German | 216 | 20.4% |
| Guamanian / Chamorro | 2 | 0.2% |
| Hungarian | 94 | 8.9% |
| Irish | 91 | 8.6% |
| Italian | 107 | 10.1% |
| Laotian | 18 | 1.7% |
| Maltese | 7 | 0.7% |
| Mexican | 41 | 3.9% |
| Norwegian | 5 | 0.5% |
| Portuguese | 8 | 0.7% |
| Russian | 33 | 3.1% |
| Scotch-Irish | 4 | 0.4% |
| Scottish | 66 | 6.2% |
| Spaniard | 26 | 2.5% |
| Swedish | 11 | 1.0% |
| Swiss | 9 | 0.9% |
| Ukrainian | 73 | 6.9% | View All 29 Rows |
Immigrants in Occidental
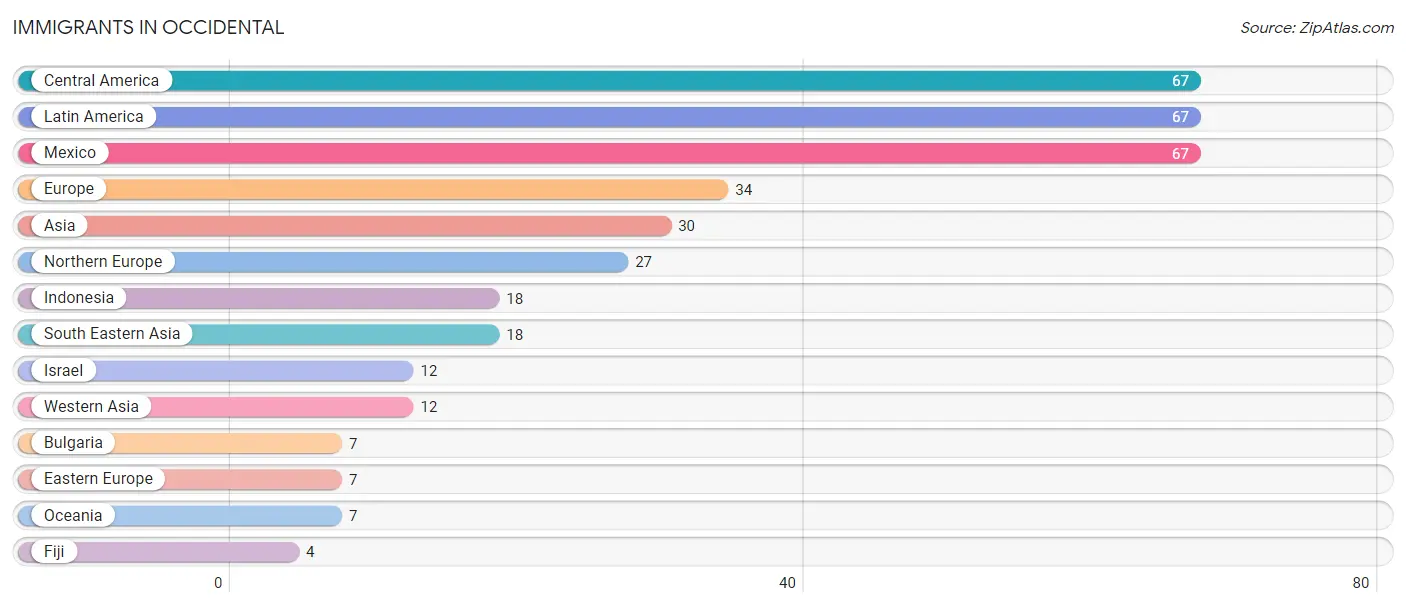
The most numerous immigrant groups reported in Occidental came from Central America (67 | 6.3%), Latin America (67 | 6.3%), Mexico (67 | 6.3%), Europe (34 | 3.2%), and Asia (30 | 2.8%), together accounting for 25.0% of all Occidental residents.
| Immigration Origin | # Population | % Population |
| Asia | 30 | 2.8% |
| Bulgaria | 7 | 0.7% |
| Central America | 67 | 6.3% |
| Eastern Europe | 7 | 0.7% |
| Europe | 34 | 3.2% |
| Fiji | 4 | 0.4% |
| Indonesia | 18 | 1.7% |
| Israel | 12 | 1.1% |
| Latin America | 67 | 6.3% |
| Mexico | 67 | 6.3% |
| Northern Europe | 27 | 2.5% |
| Oceania | 7 | 0.7% |
| South Eastern Asia | 18 | 1.7% |
| Western Asia | 12 | 1.1% | View All 14 Rows |
Sex and Age in Occidental
Sex and Age in Occidental
The most populous age groups in Occidental are 60 to 64 Years (148 | 25.0%) for men and 60 to 64 Years (90 | 19.2%) for women.
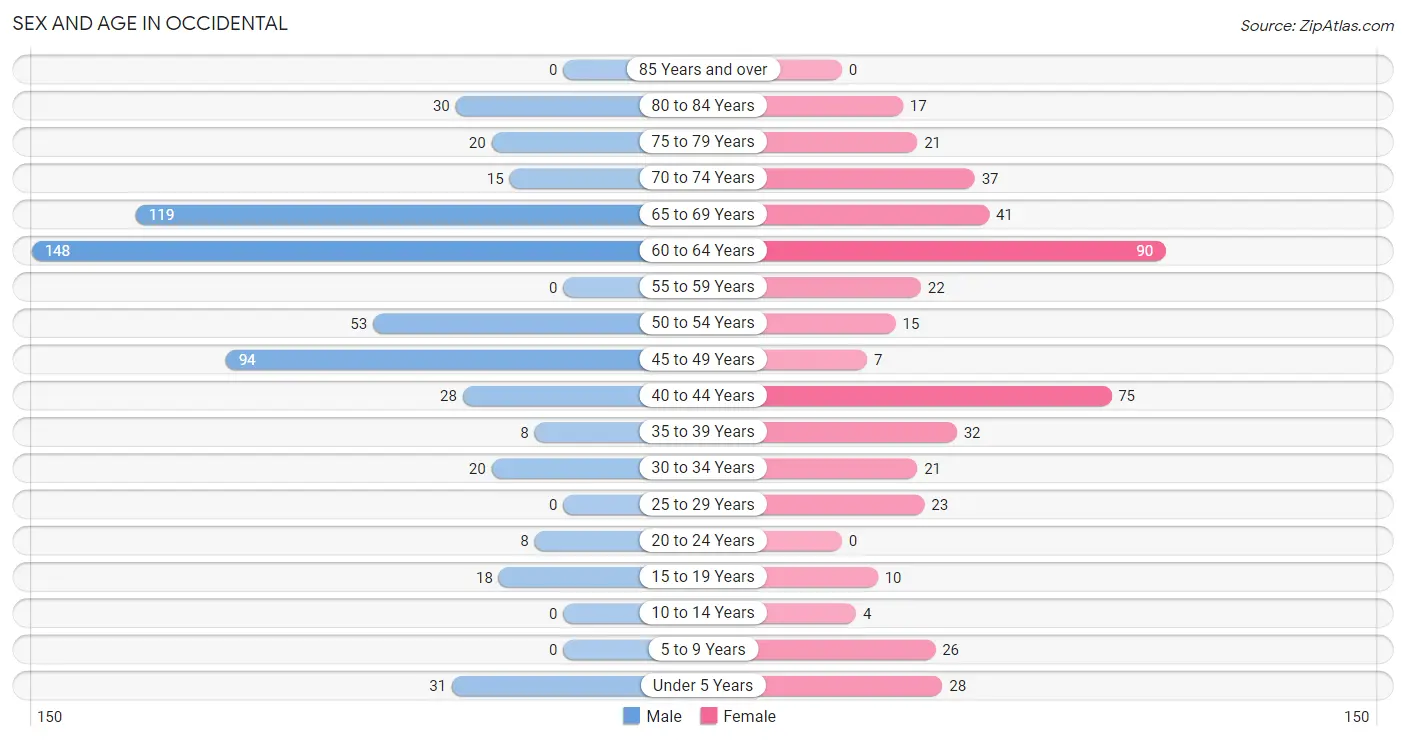
| Age Bracket | Male | Female |
| Under 5 Years | 31 (5.2%) | 28 (6.0%) |
| 5 to 9 Years | 0 (0.0%) | 26 (5.5%) |
| 10 to 14 Years | 0 (0.0%) | 4 (0.9%) |
| 15 to 19 Years | 18 (3.0%) | 10 (2.1%) |
| 20 to 24 Years | 8 (1.3%) | 0 (0.0%) |
| 25 to 29 Years | 0 (0.0%) | 23 (4.9%) |
| 30 to 34 Years | 20 (3.4%) | 21 (4.5%) |
| 35 to 39 Years | 8 (1.3%) | 32 (6.8%) |
| 40 to 44 Years | 28 (4.7%) | 75 (16.0%) |
| 45 to 49 Years | 94 (15.9%) | 7 (1.5%) |
| 50 to 54 Years | 53 (8.9%) | 15 (3.2%) |
| 55 to 59 Years | 0 (0.0%) | 22 (4.7%) |
| 60 to 64 Years | 148 (25.0%) | 90 (19.2%) |
| 65 to 69 Years | 119 (20.1%) | 41 (8.7%) |
| 70 to 74 Years | 15 (2.5%) | 37 (7.9%) |
| 75 to 79 Years | 20 (3.4%) | 21 (4.5%) |
| 80 to 84 Years | 30 (5.1%) | 17 (3.6%) |
| 85 Years and over | 0 (0.0%) | 0 (0.0%) |
| Total | 592 (100.0%) | 469 (100.0%) |
Families and Households in Occidental
Median Family Size in Occidental
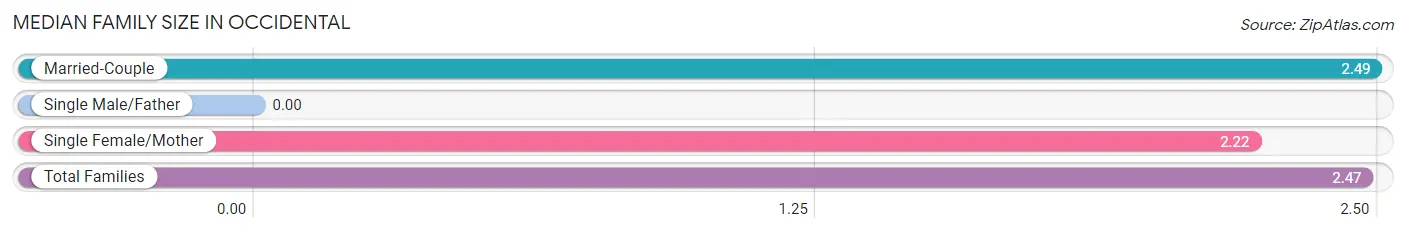
| Family Type | # Families | Family Size |
| Married-Couple | 242 (93.1%) | 2.49 |
| Single Male/Father | 0 (0.0%) | - |
| Single Female/Mother | 18 (6.9%) | 2.22 |
| Total Families | 260 (100.0%) | 2.47 |
Median Household Size in Occidental
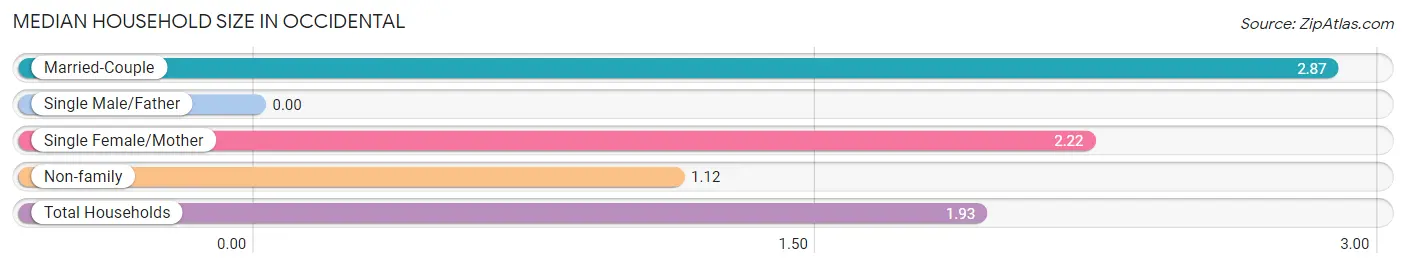
| Household Type | # Households | Household Size |
| Married-Couple | 242 (44.0%) | 2.87 |
| Single Male/Father | 0 (0.0%) | - |
| Single Female/Mother | 18 (3.3%) | 2.22 |
| Non-family | 290 (52.7%) | 1.12 |
| Total Households | 550 (100.0%) | 1.93 |
Household Size by Marriage Status in Occidental
Out of a total of 550 households in Occidental, 260 (47.3%) are family households, while 290 (52.7%) are nonfamily households. The most numerous type of family households are 2-person households, comprising 199, and the most common type of nonfamily households are 1-person households, comprising 259.
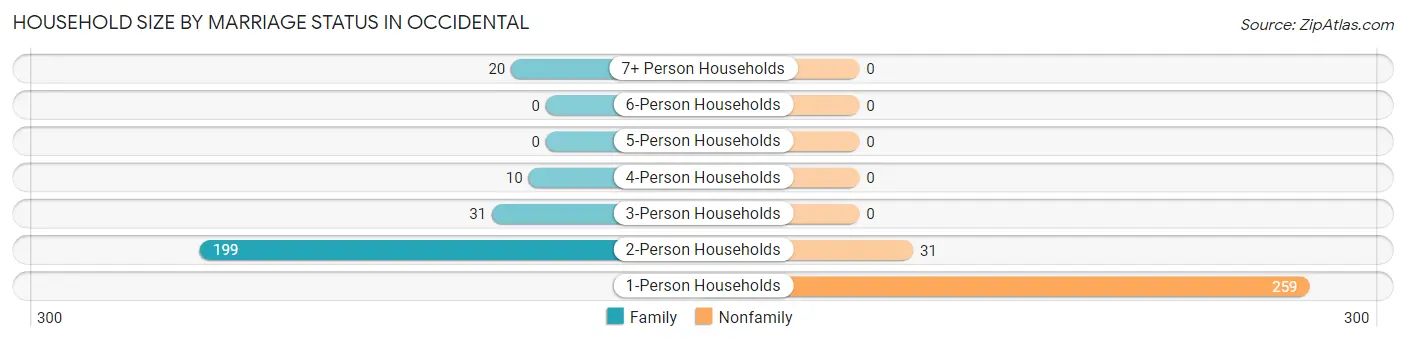
| Household Size | Family Households | Nonfamily Households |
| 1-Person Households | - | 259 (47.1%) |
| 2-Person Households | 199 (36.2%) | 31 (5.6%) |
| 3-Person Households | 31 (5.6%) | 0 (0.0%) |
| 4-Person Households | 10 (1.8%) | 0 (0.0%) |
| 5-Person Households | 0 (0.0%) | 0 (0.0%) |
| 6-Person Households | 0 (0.0%) | 0 (0.0%) |
| 7+ Person Households | 20 (3.6%) | 0 (0.0%) |
| Total | 260 (47.3%) | 290 (52.7%) |
Female Fertility in Occidental
Fertility by Age in Occidental
Average fertility rate in Occidental is 148.0 births per 1,000 women. Women in the age bracket of 35 to 50 years have the highest fertility rate with 209.0 births per 1,000 women. Women in the age bracket of 35 to 50 years acount for 100.0% of all women with births.
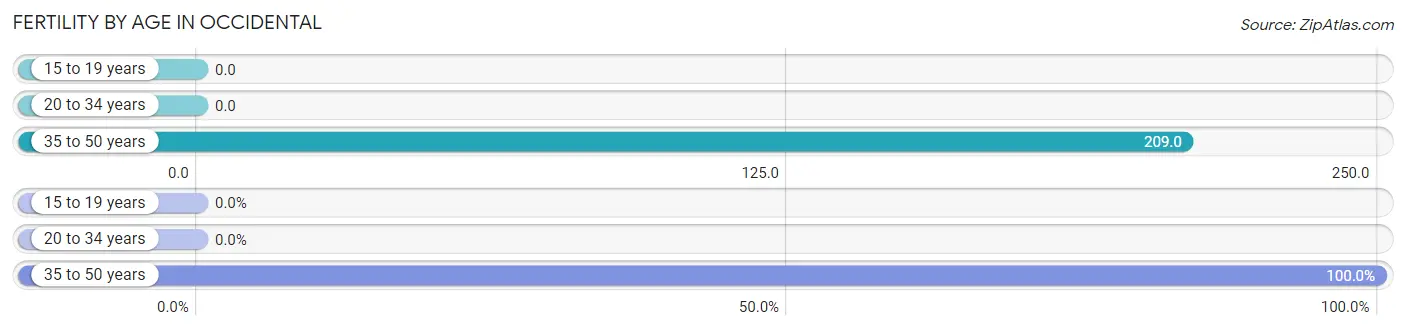
| Age Bracket | Women with Births | Births / 1,000 Women |
| 15 to 19 years | 0 (0.0%) | 0.0 |
| 20 to 34 years | 0 (0.0%) | 0.0 |
| 35 to 50 years | 27 (100.0%) | 209.0 |
| Total | 27 (100.0%) | 148.0 |
Fertility by Age by Marriage Status in Occidental
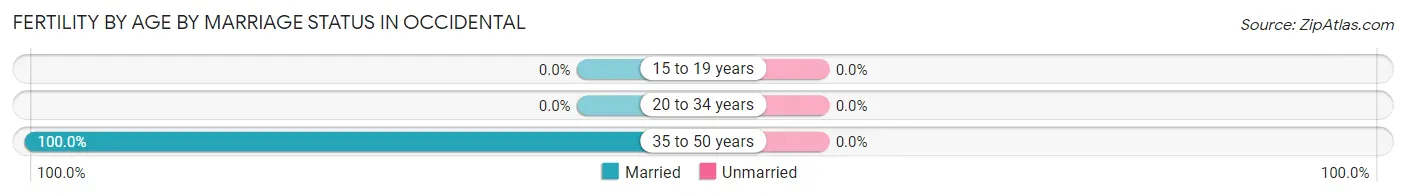
| Age Bracket | Married | Unmarried |
| 15 to 19 years | 0 (0.0%) | 0 (0.0%) |
| 20 to 34 years | 0 (0.0%) | 0 (0.0%) |
| 35 to 50 years | 27 (100.0%) | 0 (0.0%) |
| Total | 27 (100.0%) | 0 (0.0%) |
Fertility by Education in Occidental
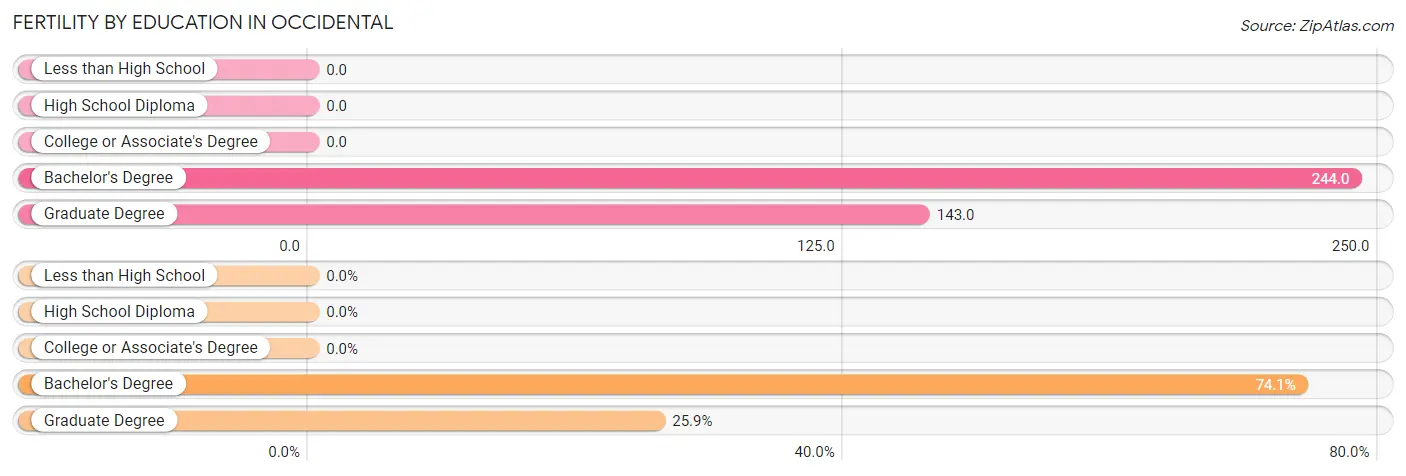
| Educational Attainment | Women with Births | Births / 1,000 Women |
| Less than High School | 0 (0.0%) | 0.0 |
| High School Diploma | 0 (0.0%) | 0.0 |
| College or Associate's Degree | 0 (0.0%) | 0.0 |
| Bachelor's Degree | 20 (74.1%) | 244.0 |
| Graduate Degree | 7 (25.9%) | 143.0 |
| Total | 27 (100.0%) | 148.0 |
Fertility by Education by Marriage Status in Occidental
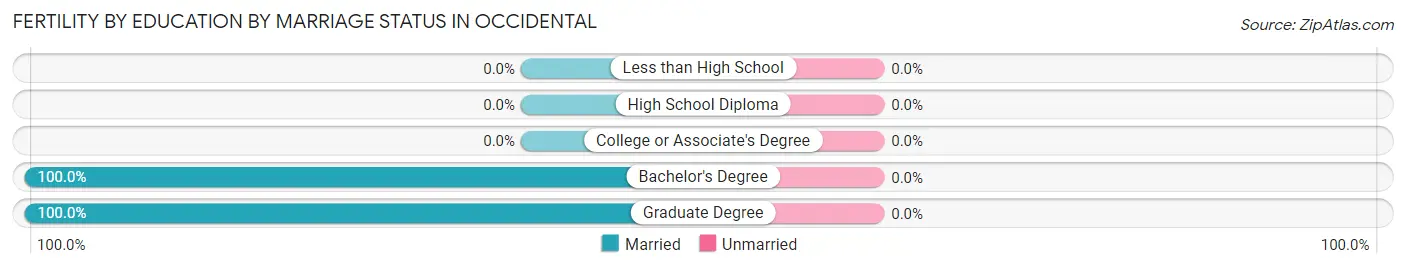
| Educational Attainment | Married | Unmarried |
| Less than High School | 0 (0.0%) | 0 (0.0%) |
| High School Diploma | 0 (0.0%) | 0 (0.0%) |
| College or Associate's Degree | 0 (0.0%) | 0 (0.0%) |
| Bachelor's Degree | 20 (100.0%) | 0 (0.0%) |
| Graduate Degree | 7 (100.0%) | 0 (0.0%) |
| Total | 27 (100.0%) | 0 (0.0%) |
Employment Characteristics in Occidental
Employment by Class of Employer in Occidental
Among the 541 employed individuals in Occidental, self-employed (not incorporated) (242 | 44.7%), private company employees (202 | 37.3%), and state government employees (29 | 5.4%) make up the most common classes of employment.
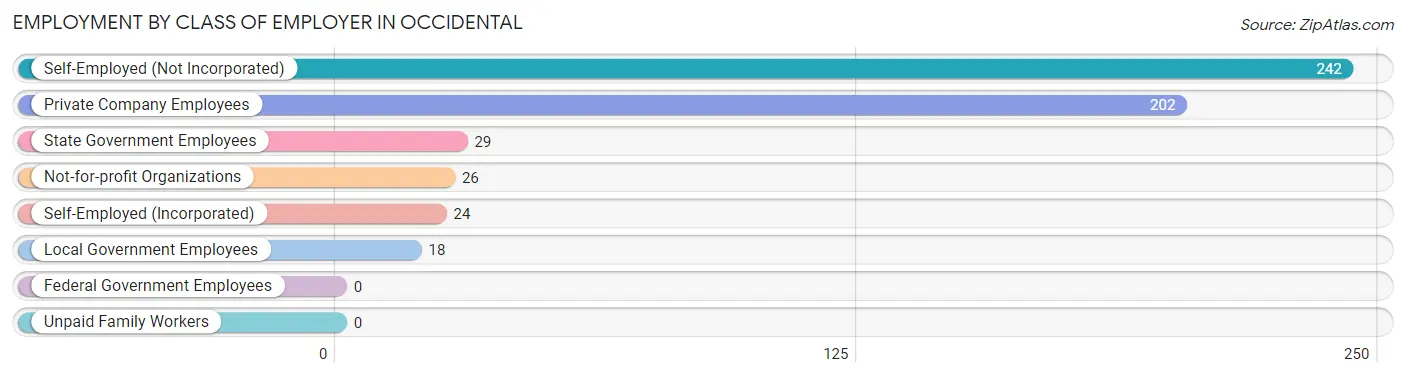
| Employer Class | # Employees | % Employees |
| Private Company Employees | 202 | 37.3% |
| Self-Employed (Incorporated) | 24 | 4.4% |
| Self-Employed (Not Incorporated) | 242 | 44.7% |
| Not-for-profit Organizations | 26 | 4.8% |
| Local Government Employees | 18 | 3.3% |
| State Government Employees | 29 | 5.4% |
| Federal Government Employees | 0 | 0.0% |
| Unpaid Family Workers | 0 | 0.0% |
| Total | 541 | 100.0% |
Employment Status by Age in Occidental
According to the labor force statistics for Occidental, out of the total population over 16 years of age (962), 61.5% or 592 individuals are in the labor force, with 3.7% or 22 of them unemployed. The age group with the highest labor force participation rate is 30 to 34 years, with 100.0% or 41 individuals in the labor force. Within the labor force, the 35 to 44 years age range has the highest percentage of unemployed individuals, with 19.6% or 22 of them being unemployed.
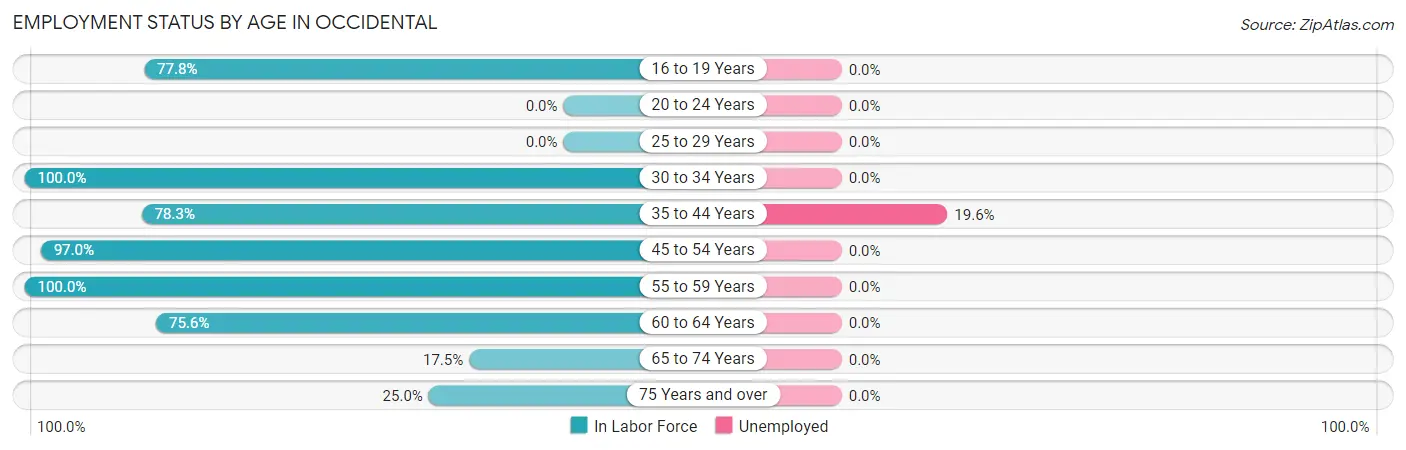
| Age Bracket | In Labor Force | Unemployed |
| 16 to 19 Years | 14 (77.8%) | 0 (0.0%) |
| 20 to 24 Years | 0 (0.0%) | 0 (0.0%) |
| 25 to 29 Years | 0 (0.0%) | 0 (0.0%) |
| 30 to 34 Years | 41 (100.0%) | 0 (0.0%) |
| 35 to 44 Years | 112 (78.3%) | 22 (19.6%) |
| 45 to 54 Years | 164 (97.0%) | 0 (0.0%) |
| 55 to 59 Years | 22 (100.0%) | 0 (0.0%) |
| 60 to 64 Years | 180 (75.6%) | 0 (0.0%) |
| 65 to 74 Years | 37 (17.5%) | 0 (0.0%) |
| 75 Years and over | 22 (25.0%) | 0 (0.0%) |
| Total | 592 (61.5%) | 22 (3.7%) |
Employment Status by Educational Attainment in Occidental
According to labor force statistics for Occidental, 81.6% of individuals (519) out of the total population between 25 and 64 years of age (636) are in the labor force, with 4.2% or 22 of them being unemployed. The group with the highest labor force participation rate are those with the educational attainment of high school diploma, with 100.0% or 60 individuals in the labor force. Within the labor force, individuals with bachelor's degree or higher education have the highest percentage of unemployment, with 5.5% or 22 of them being unemployed.
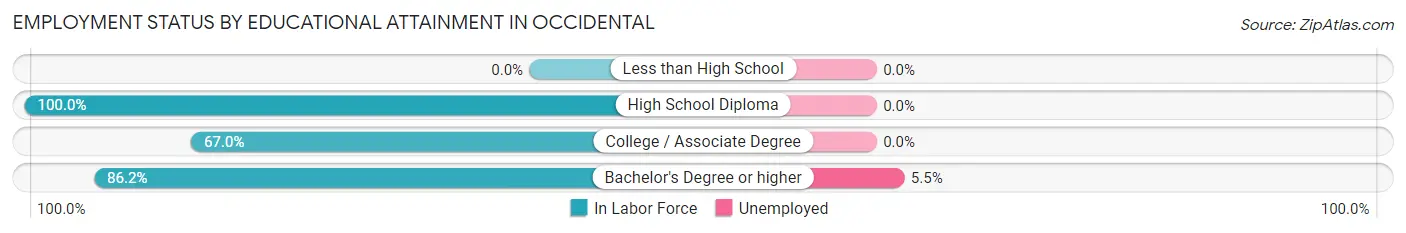
| Educational Attainment | In Labor Force | Unemployed |
| Less than High School | 0 (0.0%) | 0 (0.0%) |
| High School Diploma | 60 (100.0%) | 0 (0.0%) |
| College / Associate Degree | 59 (67.0%) | 0 (0.0%) |
| Bachelor's Degree or higher | 400 (86.2%) | 26 (5.5%) |
| Total | 519 (81.6%) | 27 (4.2%) |
Employment Occupations by Sex in Occidental
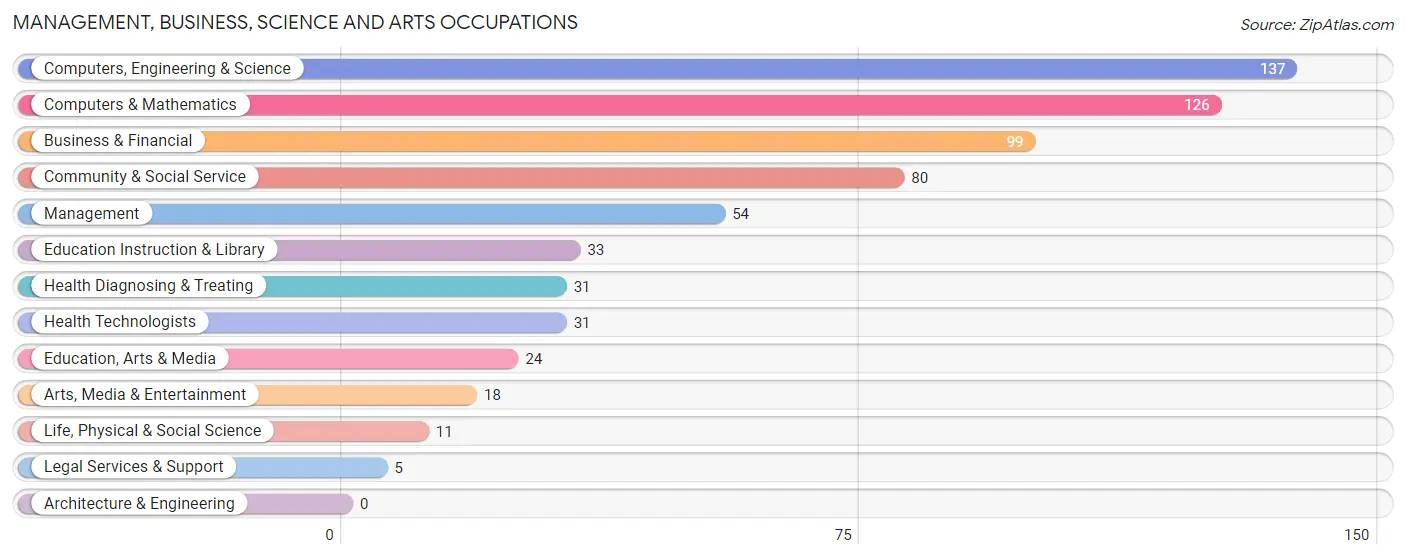
Management, Business, Science and Arts Occupations
The most common Management, Business, Science and Arts occupations in Occidental are Computers, Engineering & Science (137 | 24.0%), Computers & Mathematics (126 | 22.1%), Business & Financial (99 | 17.4%), Community & Social Service (80 | 14.0%), and Management (54 | 9.5%).
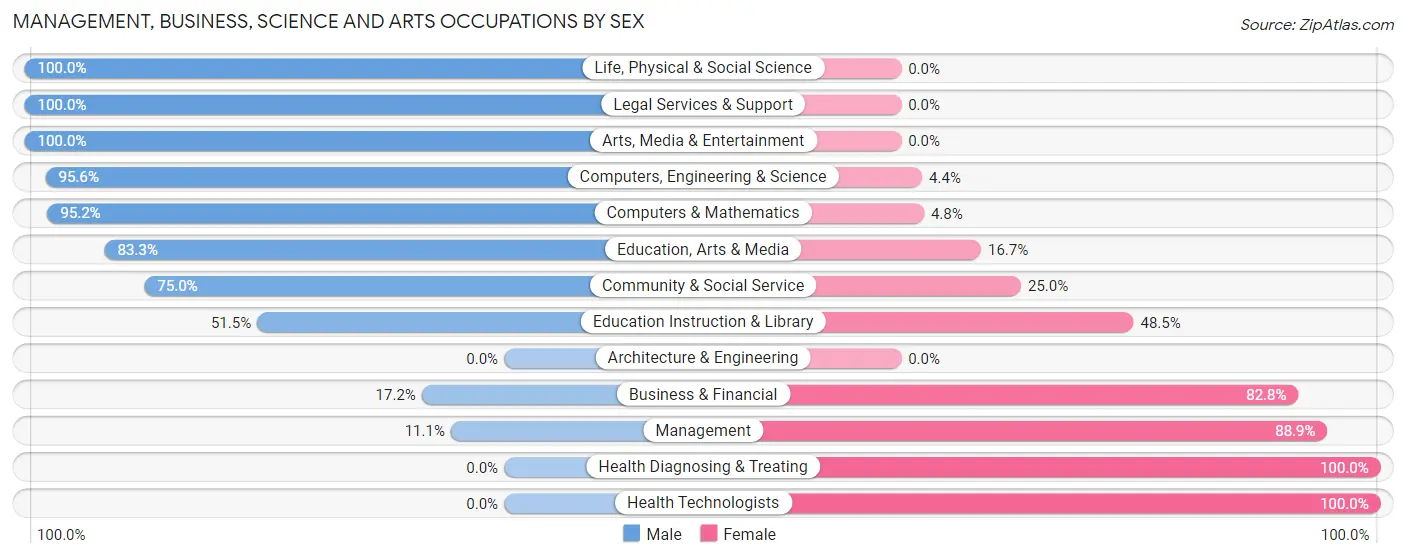
Management, Business, Science and Arts Occupations by Sex
Within the Management, Business, Science and Arts occupations in Occidental, the most male-oriented occupations are Life, Physical & Social Science (100.0%), Legal Services & Support (100.0%), and Arts, Media & Entertainment (100.0%), while the most female-oriented occupations are Health Diagnosing & Treating (100.0%), Health Technologists (100.0%), and Management (88.9%).
| Occupation | Male | Female |
| Management | 6 (11.1%) | 48 (88.9%) |
| Business & Financial | 17 (17.2%) | 82 (82.8%) |
| Computers, Engineering & Science | 131 (95.6%) | 6 (4.4%) |
| Computers & Mathematics | 120 (95.2%) | 6 (4.8%) |
| Architecture & Engineering | 0 (0.0%) | 0 (0.0%) |
| Life, Physical & Social Science | 11 (100.0%) | 0 (0.0%) |
| Community & Social Service | 60 (75.0%) | 20 (25.0%) |
| Education, Arts & Media | 20 (83.3%) | 4 (16.7%) |
| Legal Services & Support | 5 (100.0%) | 0 (0.0%) |
| Education Instruction & Library | 17 (51.5%) | 16 (48.5%) |
| Arts, Media & Entertainment | 18 (100.0%) | 0 (0.0%) |
| Health Diagnosing & Treating | 0 (0.0%) | 31 (100.0%) |
| Health Technologists | 0 (0.0%) | 31 (100.0%) |
| Total (Category) | 214 (53.4%) | 187 (46.6%) |
| Total (Overall) | 364 (63.9%) | 206 (36.1%) |
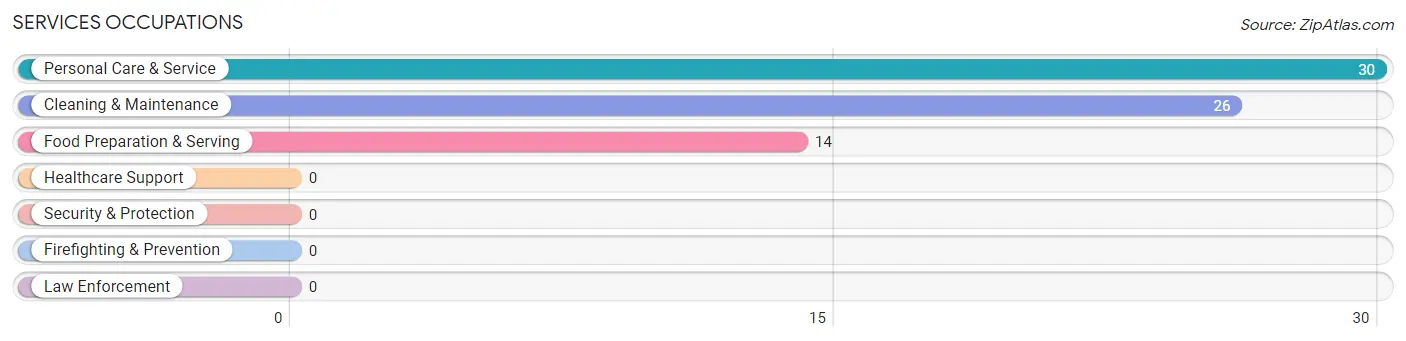
Services Occupations
The most common Services occupations in Occidental are Personal Care & Service (30 | 5.3%), Cleaning & Maintenance (26 | 4.6%), and Food Preparation & Serving (14 | 2.5%).
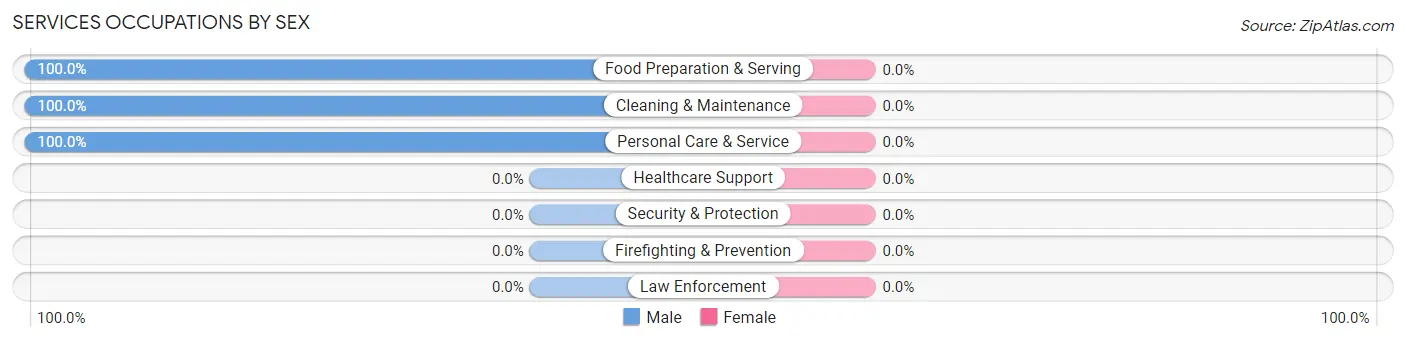
Services Occupations by Sex
| Occupation | Male | Female |
| Healthcare Support | 0 (0.0%) | 0 (0.0%) |
| Security & Protection | 0 (0.0%) | 0 (0.0%) |
| Firefighting & Prevention | 0 (0.0%) | 0 (0.0%) |
| Law Enforcement | 0 (0.0%) | 0 (0.0%) |
| Food Preparation & Serving | 14 (100.0%) | 0 (0.0%) |
| Cleaning & Maintenance | 26 (100.0%) | 0 (0.0%) |
| Personal Care & Service | 30 (100.0%) | 0 (0.0%) |
| Total (Category) | 70 (100.0%) | 0 (0.0%) |
| Total (Overall) | 364 (63.9%) | 206 (36.1%) |
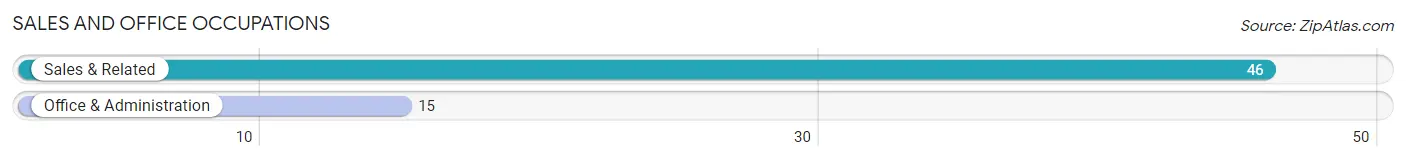
Sales and Office Occupations
The most common Sales and Office occupations in Occidental are Sales & Related (46 | 8.1%), and Office & Administration (15 | 2.6%).
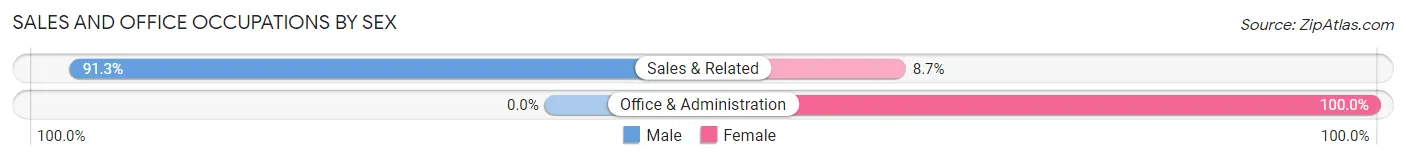
Sales and Office Occupations by Sex
| Occupation | Male | Female |
| Sales & Related | 42 (91.3%) | 4 (8.7%) |
| Office & Administration | 0 (0.0%) | 15 (100.0%) |
| Total (Category) | 42 (68.9%) | 19 (31.1%) |
| Total (Overall) | 364 (63.9%) | 206 (36.1%) |
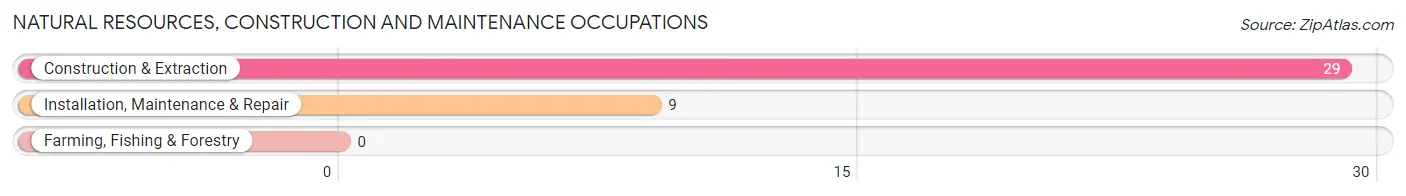
Natural Resources, Construction and Maintenance Occupations
The most common Natural Resources, Construction and Maintenance occupations in Occidental are Construction & Extraction (29 | 5.1%), and Installation, Maintenance & Repair (9 | 1.6%).
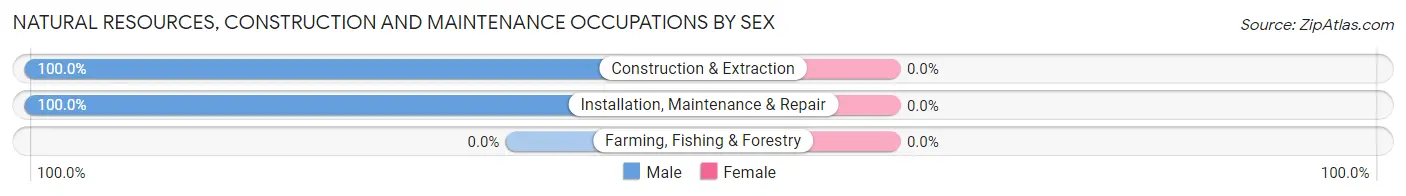
Natural Resources, Construction and Maintenance Occupations by Sex
| Occupation | Male | Female |
| Farming, Fishing & Forestry | 0 (0.0%) | 0 (0.0%) |
| Construction & Extraction | 29 (100.0%) | 0 (0.0%) |
| Installation, Maintenance & Repair | 9 (100.0%) | 0 (0.0%) |
| Total (Category) | 38 (100.0%) | 0 (0.0%) |
| Total (Overall) | 364 (63.9%) | 206 (36.1%) |
Production, Transportation and Moving Occupations
Production, Transportation and Moving Occupations by Sex
| Occupation | Male | Female |
| Production | 0 (0.0%) | 0 (0.0%) |
| Transportation | 0 (0.0%) | 0 (0.0%) |
| Material Moving | 0 (0.0%) | 0 (0.0%) |
| Total (Category) | 0 (0.0%) | 0 (0.0%) |
| Total (Overall) | 364 (63.9%) | 206 (36.1%) |
Employment Industries by Sex in Occidental
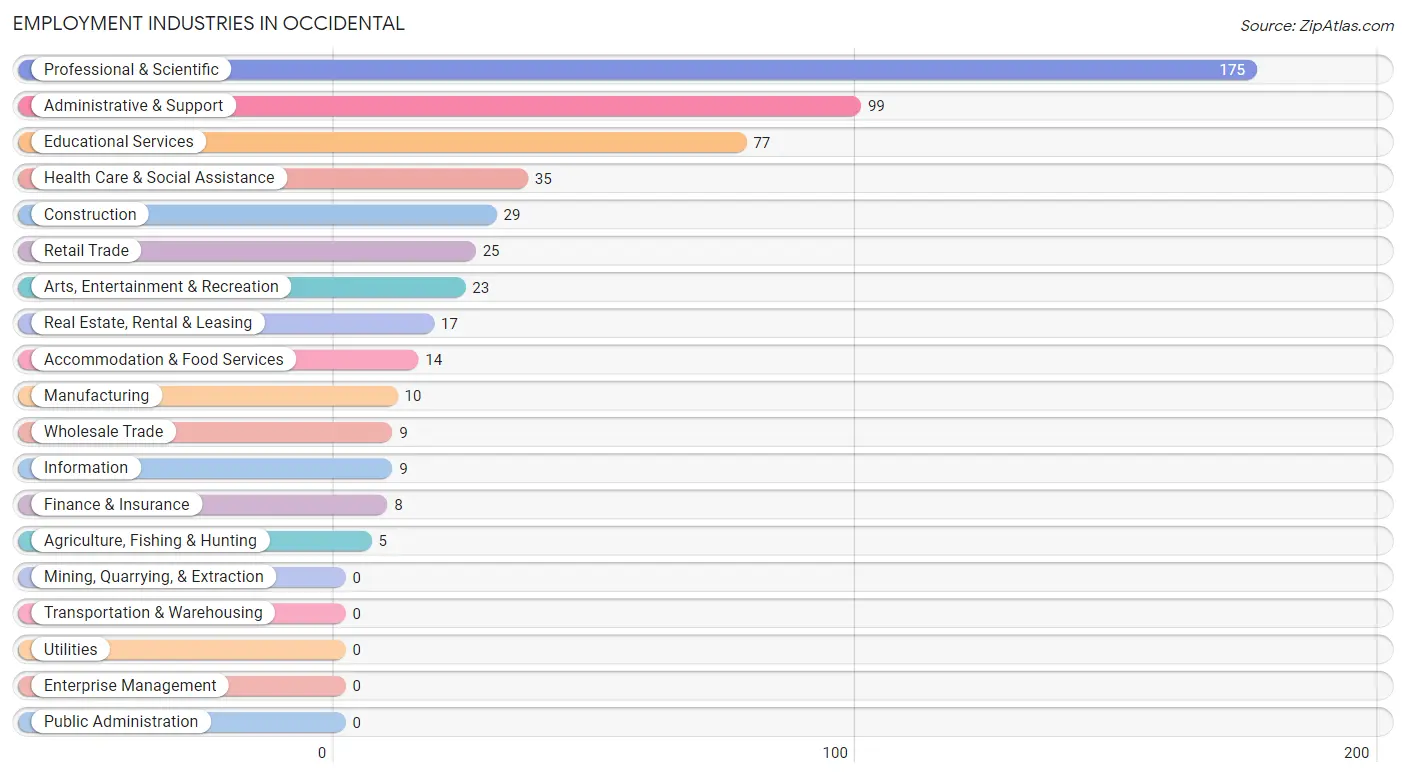
Employment Industries in Occidental
The major employment industries in Occidental include Professional & Scientific (175 | 30.7%), Administrative & Support (99 | 17.4%), Educational Services (77 | 13.5%), Health Care & Social Assistance (35 | 6.1%), and Construction (29 | 5.1%).
Employment Industries by Sex in Occidental
The Occidental industries that see more men than women are Agriculture, Fishing & Hunting (100.0%), Construction (100.0%), and Retail Trade (100.0%), whereas the industries that tend to have a higher number of women are Manufacturing (100.0%), Wholesale Trade (100.0%), and Information (100.0%).
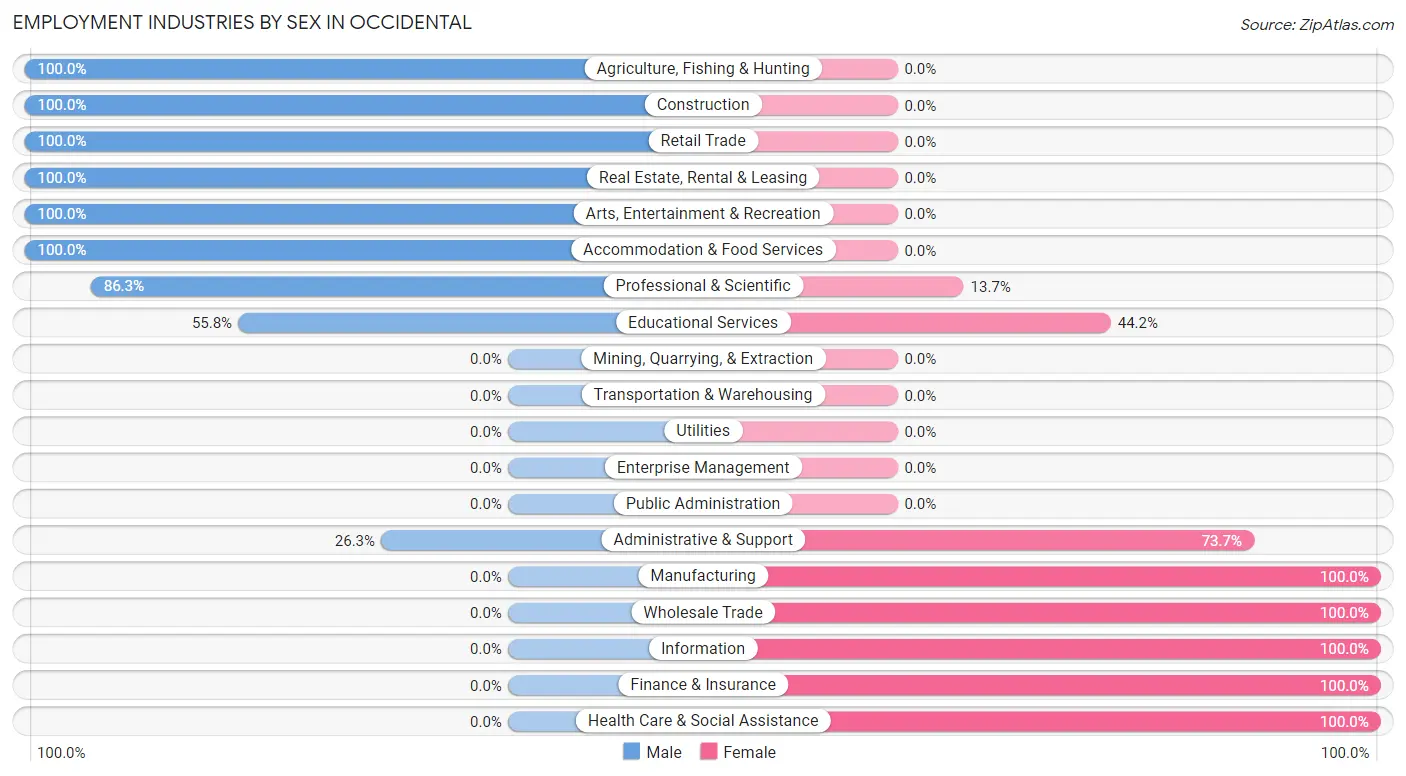
| Industry | Male | Female |
| Agriculture, Fishing & Hunting | 5 (100.0%) | 0 (0.0%) |
| Mining, Quarrying, & Extraction | 0 (0.0%) | 0 (0.0%) |
| Construction | 29 (100.0%) | 0 (0.0%) |
| Manufacturing | 0 (0.0%) | 10 (100.0%) |
| Wholesale Trade | 0 (0.0%) | 9 (100.0%) |
| Retail Trade | 25 (100.0%) | 0 (0.0%) |
| Transportation & Warehousing | 0 (0.0%) | 0 (0.0%) |
| Utilities | 0 (0.0%) | 0 (0.0%) |
| Information | 0 (0.0%) | 9 (100.0%) |
| Finance & Insurance | 0 (0.0%) | 8 (100.0%) |
| Real Estate, Rental & Leasing | 17 (100.0%) | 0 (0.0%) |
| Professional & Scientific | 151 (86.3%) | 24 (13.7%) |
| Enterprise Management | 0 (0.0%) | 0 (0.0%) |
| Administrative & Support | 26 (26.3%) | 73 (73.7%) |
| Educational Services | 43 (55.8%) | 34 (44.2%) |
| Health Care & Social Assistance | 0 (0.0%) | 35 (100.0%) |
| Arts, Entertainment & Recreation | 23 (100.0%) | 0 (0.0%) |
| Accommodation & Food Services | 14 (100.0%) | 0 (0.0%) |
| Public Administration | 0 (0.0%) | 0 (0.0%) |
| Total | 364 (63.9%) | 206 (36.1%) |
Education in Occidental
School Enrollment in Occidental
The most common levels of schooling among the 81 students in Occidental are elementary school (26 | 32.1%), college / undergraduate (26 | 32.1%), and high school (14 | 17.3%).
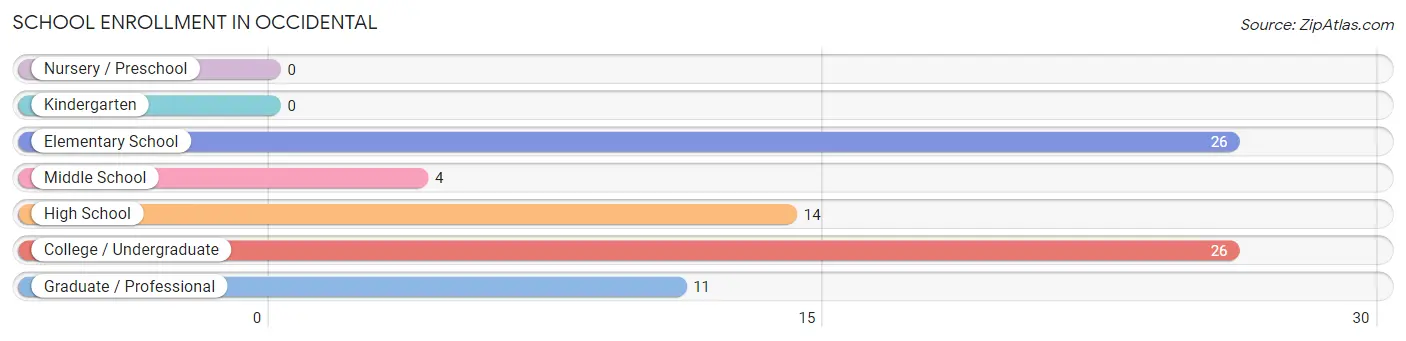
| School Level | # Students | % Students |
| Nursery / Preschool | 0 | 0.0% |
| Kindergarten | 0 | 0.0% |
| Elementary School | 26 | 32.1% |
| Middle School | 4 | 4.9% |
| High School | 14 | 17.3% |
| College / Undergraduate | 26 | 32.1% |
| Graduate / Professional | 11 | 13.6% |
| Total | 81 | 100.0% |
School Enrollment by Age by Funding Source in Occidental
Out of a total of 81 students who are enrolled in schools in Occidental, 4 (4.9%) attend a private institution, while the remaining 77 (95.1%) are enrolled in public schools. The age group of 35 years and over has the highest likelihood of being enrolled in private schools, with 4 (17.4% in the age bracket) enrolled. Conversely, the age group of 5 to 9 year old has the lowest likelihood of being enrolled in a private school, with 26 (100.0% in the age bracket) attending a public institution.
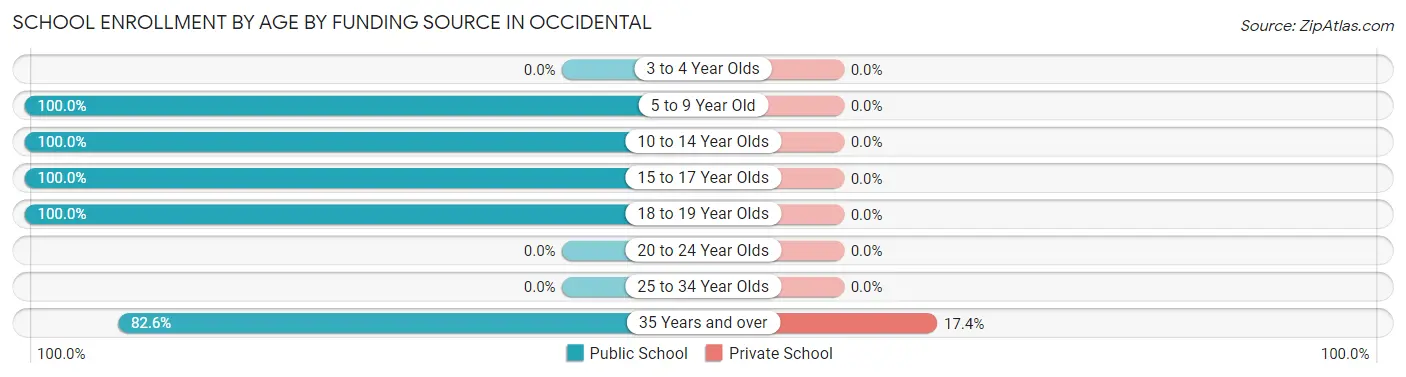
| Age Bracket | Public School | Private School |
| 3 to 4 Year Olds | 0 (0.0%) | 0 (0.0%) |
| 5 to 9 Year Old | 26 (100.0%) | 0 (0.0%) |
| 10 to 14 Year Olds | 4 (100.0%) | 0 (0.0%) |
| 15 to 17 Year Olds | 14 (100.0%) | 0 (0.0%) |
| 18 to 19 Year Olds | 14 (100.0%) | 0 (0.0%) |
| 20 to 24 Year Olds | 0 (0.0%) | 0 (0.0%) |
| 25 to 34 Year Olds | 0 (0.0%) | 0 (0.0%) |
| 35 Years and over | 19 (82.6%) | 4 (17.4%) |
| Total | 77 (95.1%) | 4 (4.9%) |
Educational Attainment by Field of Study in Occidental
Social sciences (103 | 13.3%), computers & mathematics (97 | 12.6%), bio, nature & agricultural (94 | 12.2%), engineering (94 | 12.2%), and business (86 | 11.1%) are the most common fields of study among 772 individuals in Occidental who have obtained a bachelor's degree or higher.
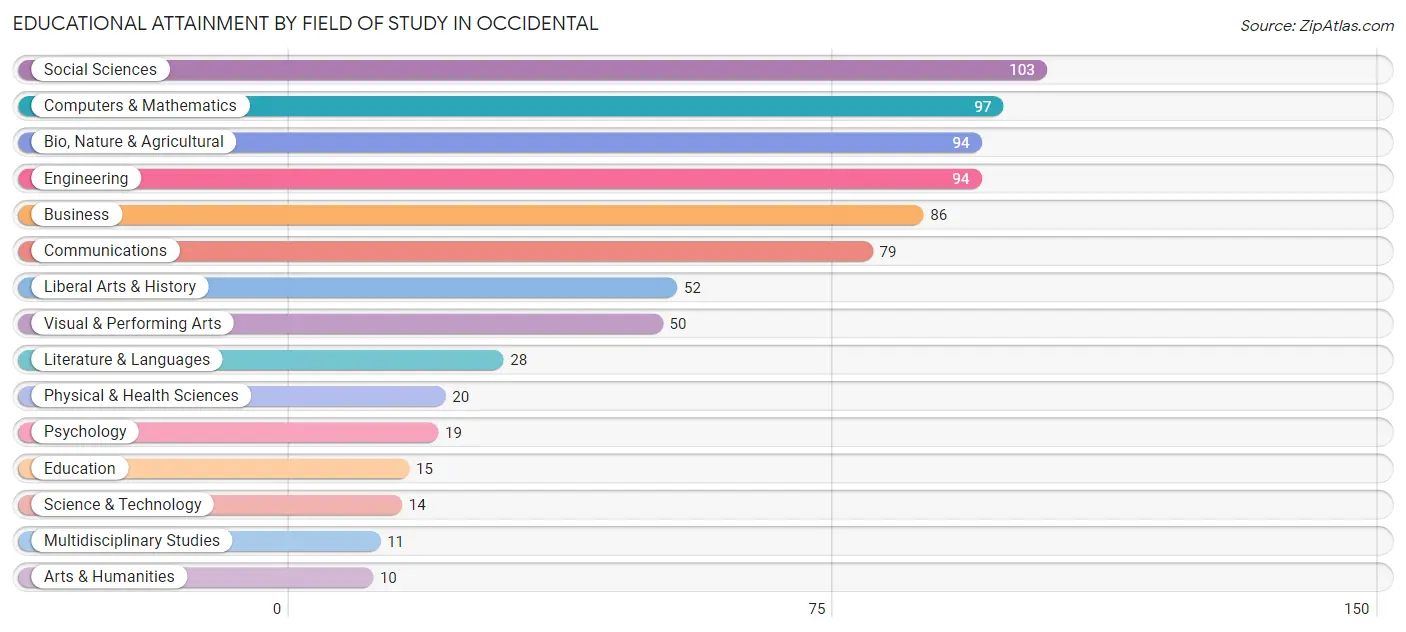
| Field of Study | # Graduates | % Graduates |
| Computers & Mathematics | 97 | 12.6% |
| Bio, Nature & Agricultural | 94 | 12.2% |
| Physical & Health Sciences | 20 | 2.6% |
| Psychology | 19 | 2.5% |
| Social Sciences | 103 | 13.3% |
| Engineering | 94 | 12.2% |
| Multidisciplinary Studies | 11 | 1.4% |
| Science & Technology | 14 | 1.8% |
| Business | 86 | 11.1% |
| Education | 15 | 1.9% |
| Literature & Languages | 28 | 3.6% |
| Liberal Arts & History | 52 | 6.7% |
| Visual & Performing Arts | 50 | 6.5% |
| Communications | 79 | 10.2% |
| Arts & Humanities | 10 | 1.3% |
| Total | 772 | 100.0% |
Transportation & Commute in Occidental
Vehicle Availability by Sex in Occidental
The most prevalent vehicle ownership categories in Occidental are males with 3 vehicles (109, accounting for 32.5%) and females with 3 vehicles (87, making up 52.9%).
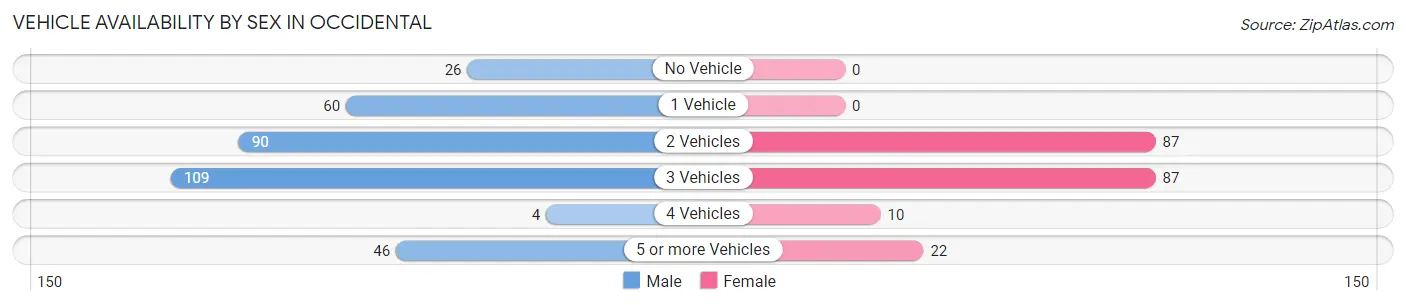
| Vehicles Available | Male | Female |
| No Vehicle | 26 (7.8%) | 0 (0.0%) |
| 1 Vehicle | 60 (17.9%) | 0 (0.0%) |
| 2 Vehicles | 90 (26.9%) | 87 (42.2%) |
| 3 Vehicles | 109 (32.5%) | 87 (42.2%) |
| 4 Vehicles | 4 (1.2%) | 10 (4.9%) |
| 5 or more Vehicles | 46 (13.7%) | 22 (10.7%) |
| Total | 335 (100.0%) | 206 (100.0%) |
Commute Time in Occidental
The most frequently occuring commute durations in Occidental are 15 to 19 minutes (70 commuters, 31.7%), 45 to 59 minutes (35 commuters, 15.8%), and 30 to 34 minutes (31 commuters, 14.0%).
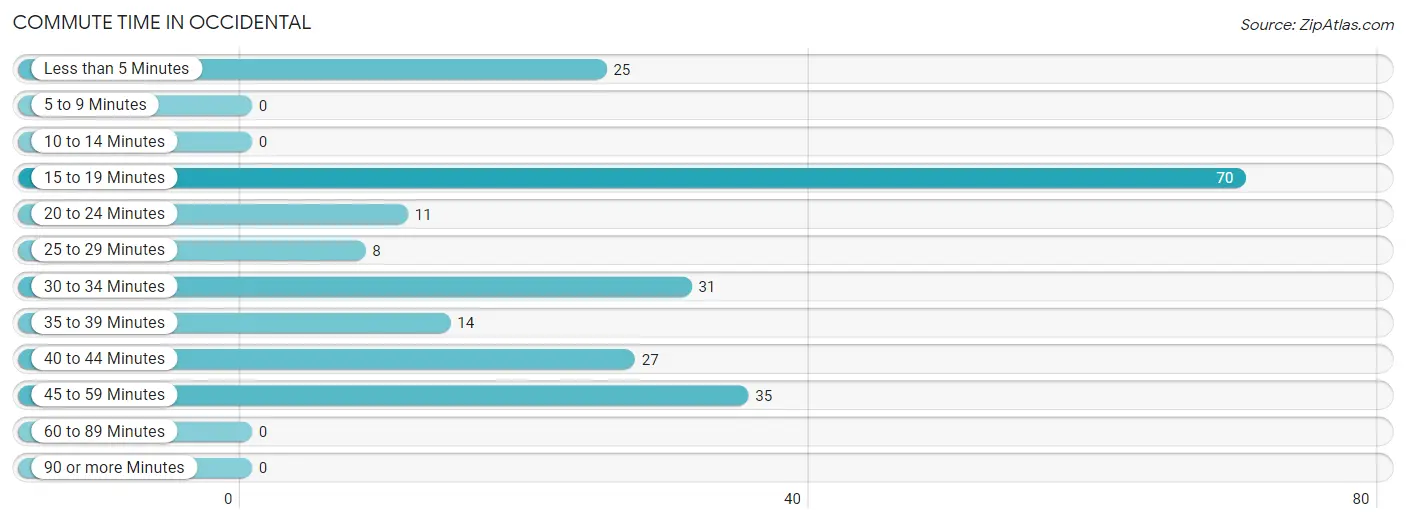
| Commute Time | # Commuters | % Commuters |
| Less than 5 Minutes | 25 | 11.3% |
| 5 to 9 Minutes | 0 | 0.0% |
| 10 to 14 Minutes | 0 | 0.0% |
| 15 to 19 Minutes | 70 | 31.7% |
| 20 to 24 Minutes | 11 | 5.0% |
| 25 to 29 Minutes | 8 | 3.6% |
| 30 to 34 Minutes | 31 | 14.0% |
| 35 to 39 Minutes | 14 | 6.3% |
| 40 to 44 Minutes | 27 | 12.2% |
| 45 to 59 Minutes | 35 | 15.8% |
| 60 to 89 Minutes | 0 | 0.0% |
| 90 or more Minutes | 0 | 0.0% |
Commute Time by Sex in Occidental
The most common commute times in Occidental are 15 to 19 minutes (66 commuters, 46.5%) for males and 40 to 44 minutes (27 commuters, 34.2%) for females.
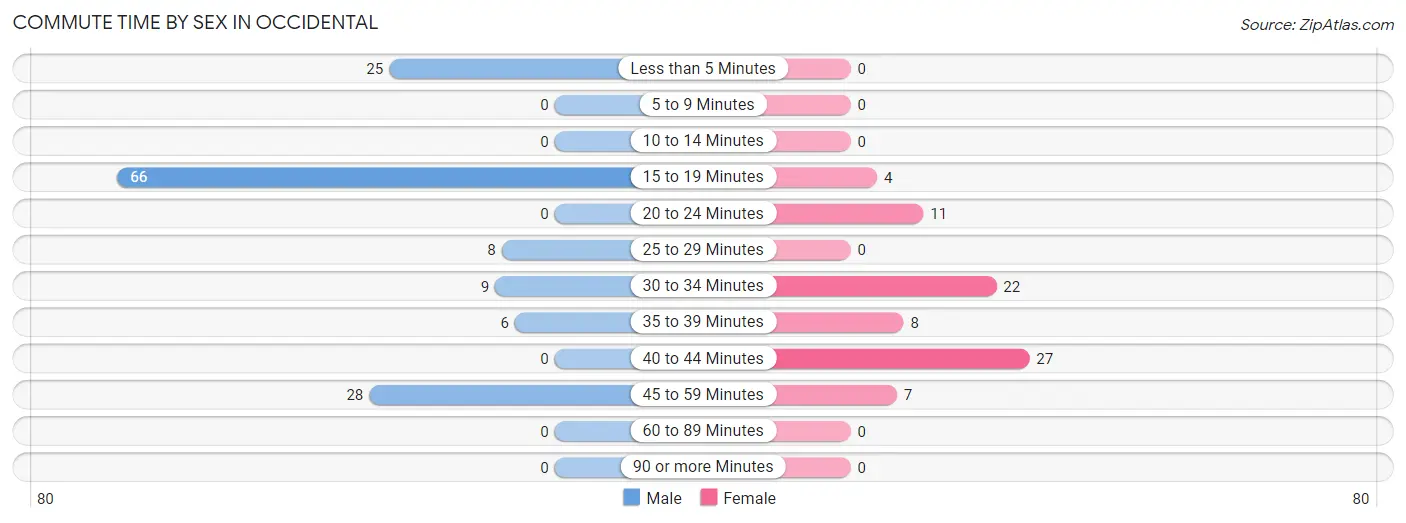
| Commute Time | Male | Female |
| Less than 5 Minutes | 25 (17.6%) | 0 (0.0%) |
| 5 to 9 Minutes | 0 (0.0%) | 0 (0.0%) |
| 10 to 14 Minutes | 0 (0.0%) | 0 (0.0%) |
| 15 to 19 Minutes | 66 (46.5%) | 4 (5.1%) |
| 20 to 24 Minutes | 0 (0.0%) | 11 (13.9%) |
| 25 to 29 Minutes | 8 (5.6%) | 0 (0.0%) |
| 30 to 34 Minutes | 9 (6.3%) | 22 (27.9%) |
| 35 to 39 Minutes | 6 (4.2%) | 8 (10.1%) |
| 40 to 44 Minutes | 0 (0.0%) | 27 (34.2%) |
| 45 to 59 Minutes | 28 (19.7%) | 7 (8.9%) |
| 60 to 89 Minutes | 0 (0.0%) | 0 (0.0%) |
| 90 or more Minutes | 0 (0.0%) | 0 (0.0%) |
Time of Departure to Work by Sex in Occidental
The most frequent times of departure to work in Occidental are 8:30 AM to 8:59 AM (52, 36.6%) for males and 8:30 AM to 8:59 AM (20, 25.3%) for females.
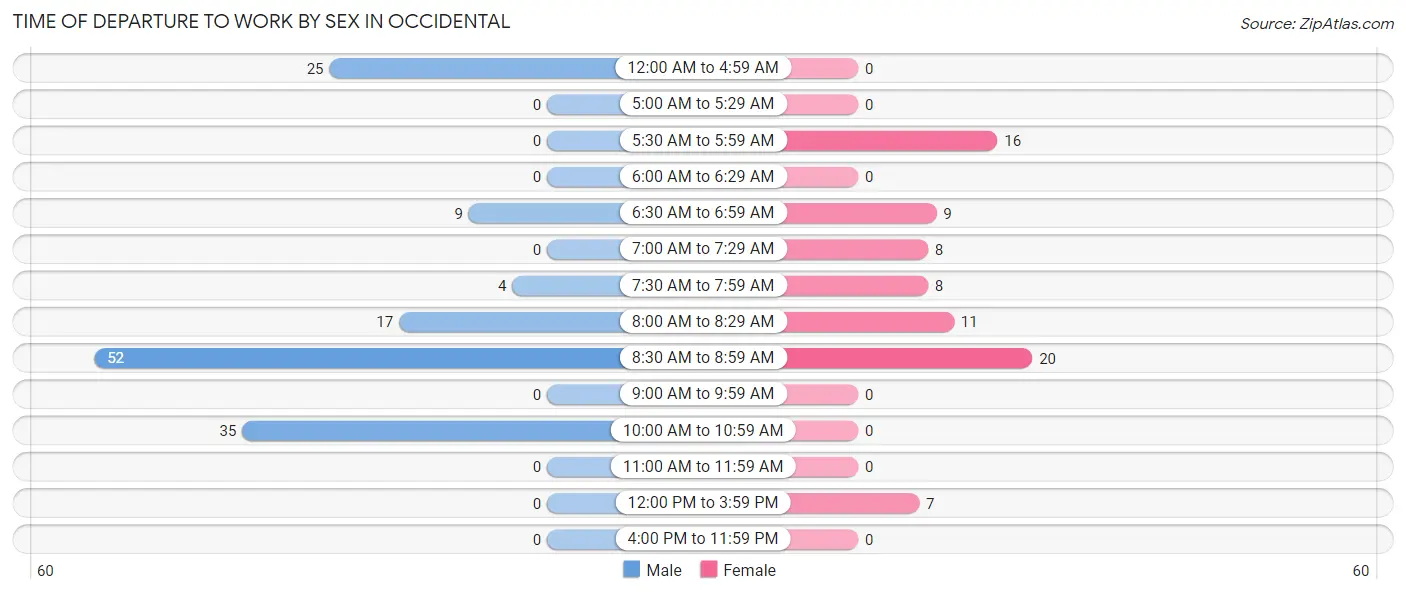
| Time of Departure | Male | Female |
| 12:00 AM to 4:59 AM | 25 (17.6%) | 0 (0.0%) |
| 5:00 AM to 5:29 AM | 0 (0.0%) | 0 (0.0%) |
| 5:30 AM to 5:59 AM | 0 (0.0%) | 16 (20.3%) |
| 6:00 AM to 6:29 AM | 0 (0.0%) | 0 (0.0%) |
| 6:30 AM to 6:59 AM | 9 (6.3%) | 9 (11.4%) |
| 7:00 AM to 7:29 AM | 0 (0.0%) | 8 (10.1%) |
| 7:30 AM to 7:59 AM | 4 (2.8%) | 8 (10.1%) |
| 8:00 AM to 8:29 AM | 17 (12.0%) | 11 (13.9%) |
| 8:30 AM to 8:59 AM | 52 (36.6%) | 20 (25.3%) |
| 9:00 AM to 9:59 AM | 0 (0.0%) | 0 (0.0%) |
| 10:00 AM to 10:59 AM | 35 (24.6%) | 0 (0.0%) |
| 11:00 AM to 11:59 AM | 0 (0.0%) | 0 (0.0%) |
| 12:00 PM to 3:59 PM | 0 (0.0%) | 7 (8.9%) |
| 4:00 PM to 11:59 PM | 0 (0.0%) | 0 (0.0%) |
| Total | 142 (100.0%) | 79 (100.0%) |
Housing Occupancy in Occidental
Occupancy by Ownership in Occidental
Of the total 550 dwellings in Occidental, owner-occupied units account for 351 (63.8%), while renter-occupied units make up 199 (36.2%).
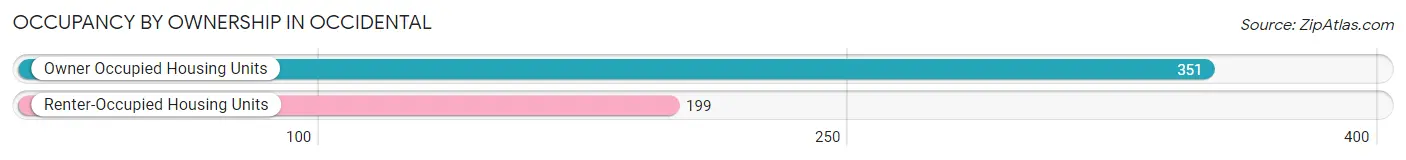
| Occupancy | # Housing Units | % Housing Units |
| Owner Occupied Housing Units | 351 | 63.8% |
| Renter-Occupied Housing Units | 199 | 36.2% |
| Total Occupied Housing Units | 550 | 100.0% |
Occupancy by Household Size in Occidental
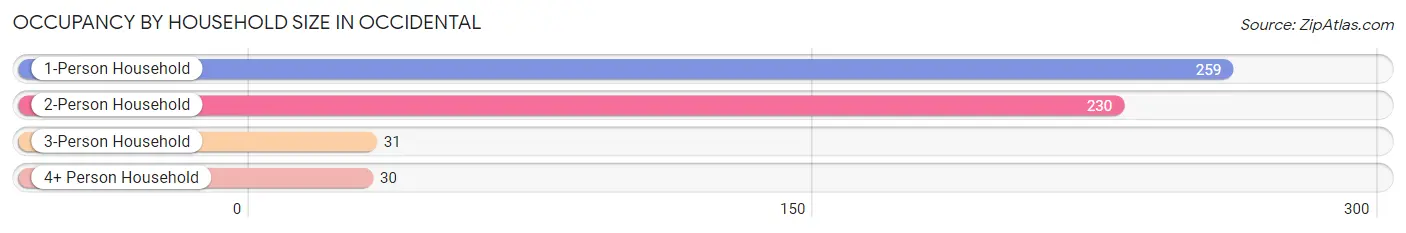
| Household Size | # Housing Units | % Housing Units |
| 1-Person Household | 259 | 47.1% |
| 2-Person Household | 230 | 41.8% |
| 3-Person Household | 31 | 5.6% |
| 4+ Person Household | 30 | 5.4% |
| Total Housing Units | 550 | 100.0% |
Occupancy by Ownership by Household Size in Occidental
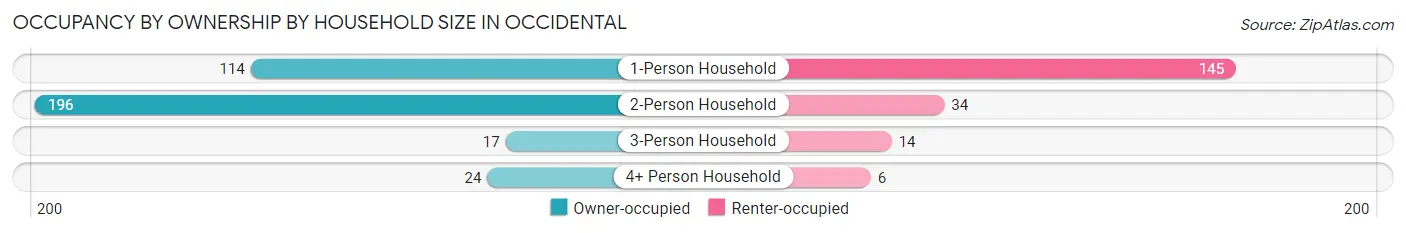
| Household Size | Owner-occupied | Renter-occupied |
| 1-Person Household | 114 (44.0%) | 145 (56.0%) |
| 2-Person Household | 196 (85.2%) | 34 (14.8%) |
| 3-Person Household | 17 (54.8%) | 14 (45.2%) |
| 4+ Person Household | 24 (80.0%) | 6 (20.0%) |
| Total Housing Units | 351 (63.8%) | 199 (36.2%) |
Occupancy by Educational Attainment in Occidental
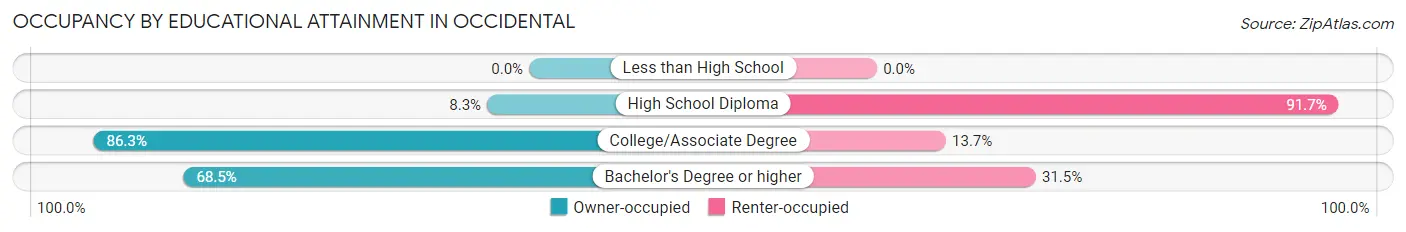
| Household Size | Owner-occupied | Renter-occupied |
| Less than High School | 0 (0.0%) | 0 (0.0%) |
| High School Diploma | 7 (8.3%) | 77 (91.7%) |
| College/Associate Degree | 120 (86.3%) | 19 (13.7%) |
| Bachelor's Degree or higher | 224 (68.5%) | 103 (31.5%) |
Occupancy by Age of Householder in Occidental
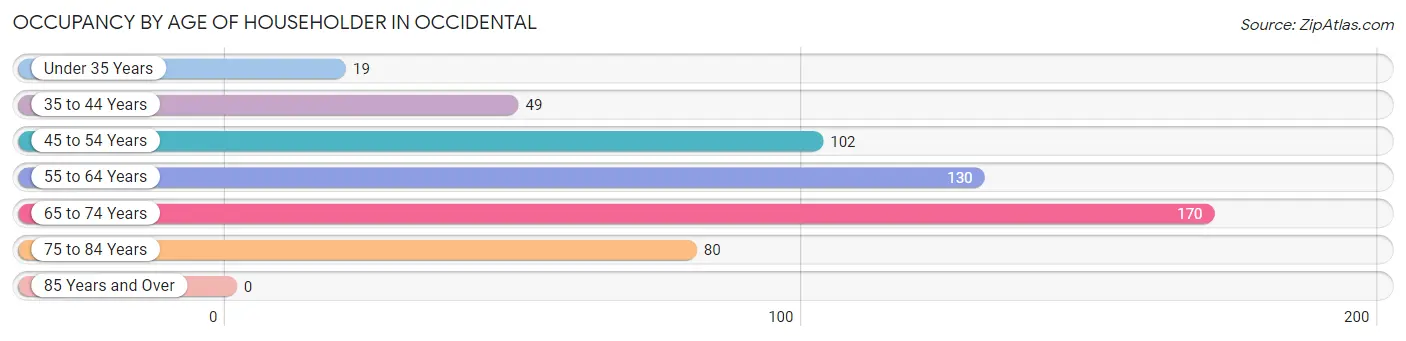
| Age Bracket | # Households | % Households |
| Under 35 Years | 19 | 3.5% |
| 35 to 44 Years | 49 | 8.9% |
| 45 to 54 Years | 102 | 18.5% |
| 55 to 64 Years | 130 | 23.6% |
| 65 to 74 Years | 170 | 30.9% |
| 75 to 84 Years | 80 | 14.5% |
| 85 Years and Over | 0 | 0.0% |
| Total | 550 | 100.0% |
Housing Finances in Occidental
Median Income by Occupancy in Occidental
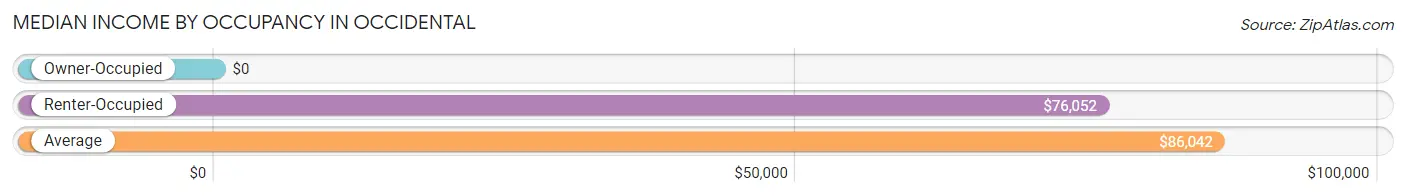
| Occupancy Type | # Households | Median Income |
| Owner-Occupied | 351 (63.8%) | $0 |
| Renter-Occupied | 199 (36.2%) | $76,052 |
| Average | 550 (100.0%) | $86,042 |
Occupancy by Householder Income Bracket in Occidental
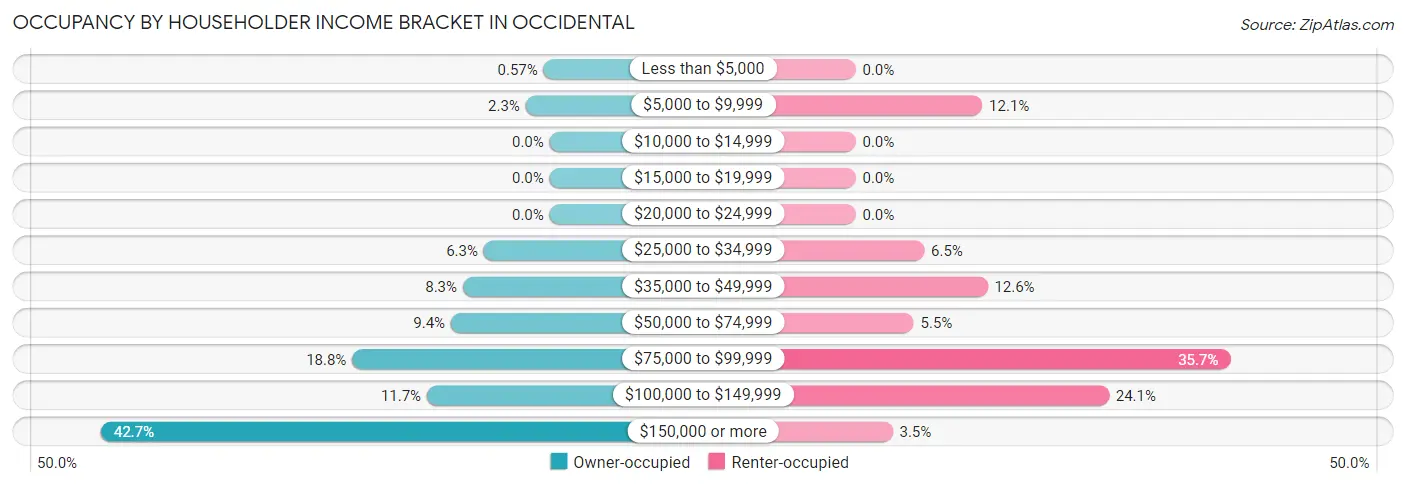
| Income Bracket | Owner-occupied | Renter-occupied |
| Less than $5,000 | 2 (0.6%) | 0 (0.0%) |
| $5,000 to $9,999 | 8 (2.3%) | 24 (12.1%) |
| $10,000 to $14,999 | 0 (0.0%) | 0 (0.0%) |
| $15,000 to $19,999 | 0 (0.0%) | 0 (0.0%) |
| $20,000 to $24,999 | 0 (0.0%) | 0 (0.0%) |
| $25,000 to $34,999 | 22 (6.3%) | 13 (6.5%) |
| $35,000 to $49,999 | 29 (8.3%) | 25 (12.6%) |
| $50,000 to $74,999 | 33 (9.4%) | 11 (5.5%) |
| $75,000 to $99,999 | 66 (18.8%) | 71 (35.7%) |
| $100,000 to $149,999 | 41 (11.7%) | 48 (24.1%) |
| $150,000 or more | 150 (42.7%) | 7 (3.5%) |
| Total | 351 (100.0%) | 199 (100.0%) |
Monthly Housing Cost Tiers in Occidental
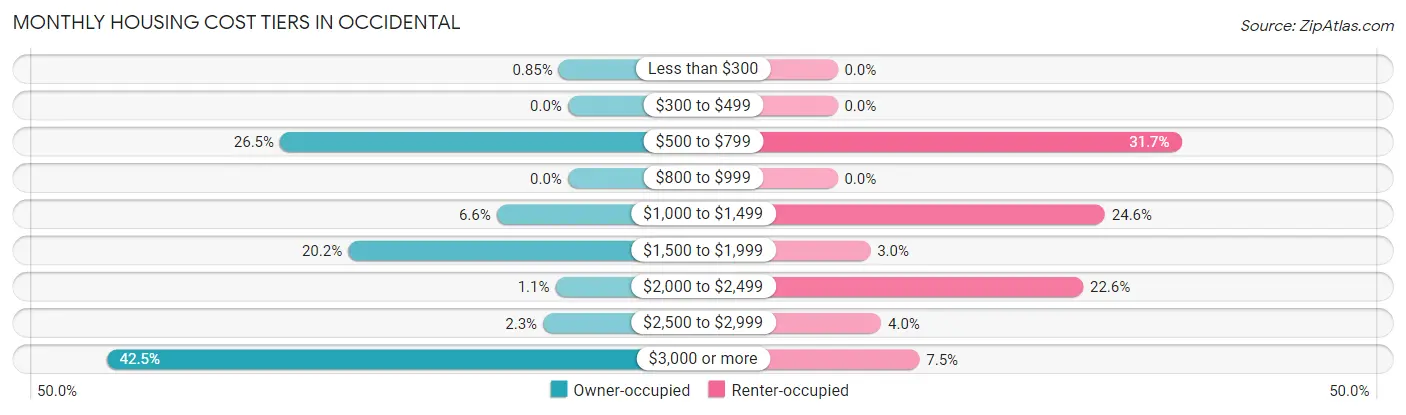
| Monthly Cost | Owner-occupied | Renter-occupied |
| Less than $300 | 3 (0.9%) | 0 (0.0%) |
| $300 to $499 | 0 (0.0%) | 0 (0.0%) |
| $500 to $799 | 93 (26.5%) | 63 (31.7%) |
| $800 to $999 | 0 (0.0%) | 0 (0.0%) |
| $1,000 to $1,499 | 23 (6.6%) | 49 (24.6%) |
| $1,500 to $1,999 | 71 (20.2%) | 6 (3.0%) |
| $2,000 to $2,499 | 4 (1.1%) | 45 (22.6%) |
| $2,500 to $2,999 | 8 (2.3%) | 8 (4.0%) |
| $3,000 or more | 149 (42.4%) | 15 (7.5%) |
| Total | 351 (100.0%) | 199 (100.0%) |
Physical Housing Characteristics in Occidental
Housing Structures in Occidental
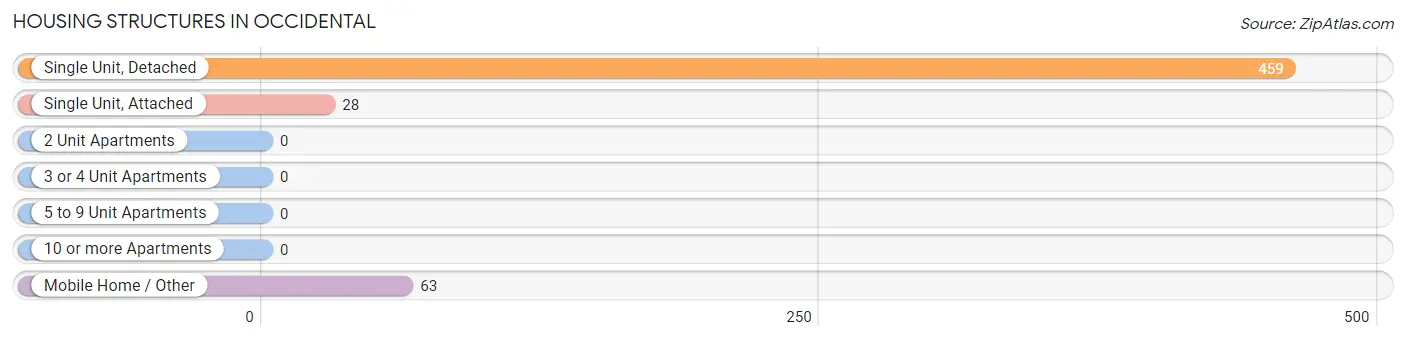
| Structure Type | # Housing Units | % Housing Units |
| Single Unit, Detached | 459 | 83.5% |
| Single Unit, Attached | 28 | 5.1% |
| 2 Unit Apartments | 0 | 0.0% |
| 3 or 4 Unit Apartments | 0 | 0.0% |
| 5 to 9 Unit Apartments | 0 | 0.0% |
| 10 or more Apartments | 0 | 0.0% |
| Mobile Home / Other | 63 | 11.5% |
| Total | 550 | 100.0% |
Housing Structures by Occupancy in Occidental
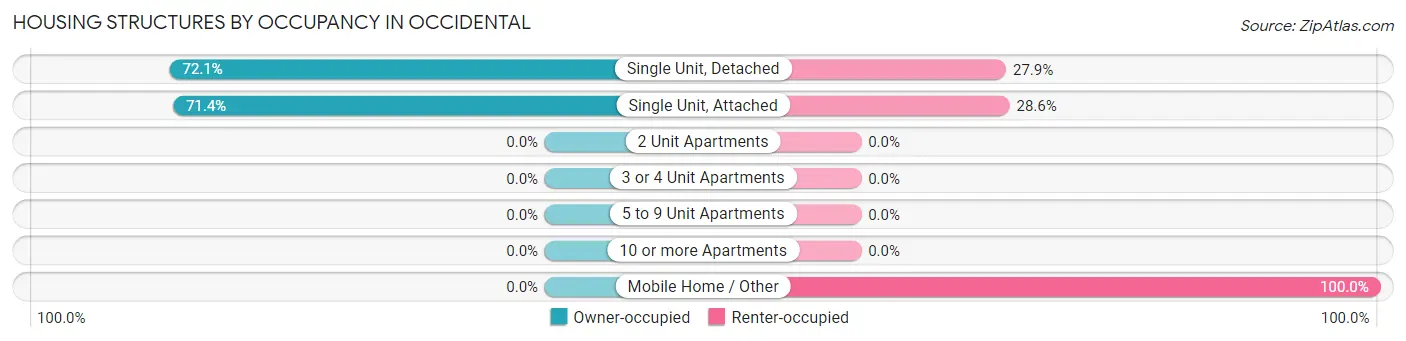
| Structure Type | Owner-occupied | Renter-occupied |
| Single Unit, Detached | 331 (72.1%) | 128 (27.9%) |
| Single Unit, Attached | 20 (71.4%) | 8 (28.6%) |
| 2 Unit Apartments | 0 (0.0%) | 0 (0.0%) |
| 3 or 4 Unit Apartments | 0 (0.0%) | 0 (0.0%) |
| 5 to 9 Unit Apartments | 0 (0.0%) | 0 (0.0%) |
| 10 or more Apartments | 0 (0.0%) | 0 (0.0%) |
| Mobile Home / Other | 0 (0.0%) | 63 (100.0%) |
| Total | 351 (63.8%) | 199 (36.2%) |
Housing Structures by Number of Rooms in Occidental
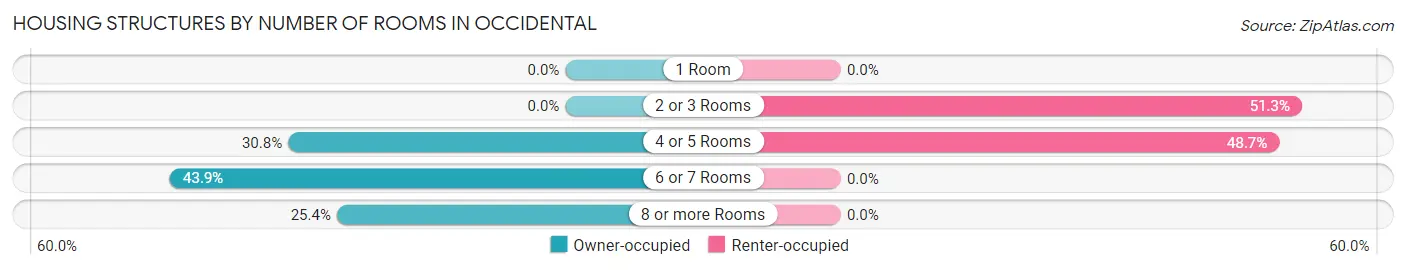
| Number of Rooms | Owner-occupied | Renter-occupied |
| 1 Room | 0 (0.0%) | 0 (0.0%) |
| 2 or 3 Rooms | 0 (0.0%) | 102 (51.3%) |
| 4 or 5 Rooms | 108 (30.8%) | 97 (48.7%) |
| 6 or 7 Rooms | 154 (43.9%) | 0 (0.0%) |
| 8 or more Rooms | 89 (25.4%) | 0 (0.0%) |
| Total | 351 (100.0%) | 199 (100.0%) |
Housing Structure by Heating Type in Occidental
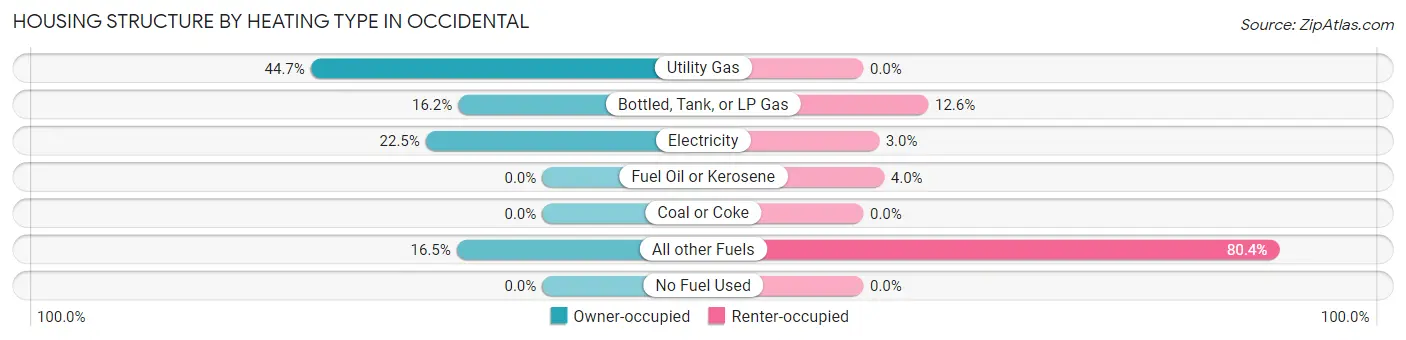
| Heating Type | Owner-occupied | Renter-occupied |
| Utility Gas | 157 (44.7%) | 0 (0.0%) |
| Bottled, Tank, or LP Gas | 57 (16.2%) | 25 (12.6%) |
| Electricity | 79 (22.5%) | 6 (3.0%) |
| Fuel Oil or Kerosene | 0 (0.0%) | 8 (4.0%) |
| Coal or Coke | 0 (0.0%) | 0 (0.0%) |
| All other Fuels | 58 (16.5%) | 160 (80.4%) |
| No Fuel Used | 0 (0.0%) | 0 (0.0%) |
| Total | 351 (100.0%) | 199 (100.0%) |
Household Vehicle Usage in Occidental
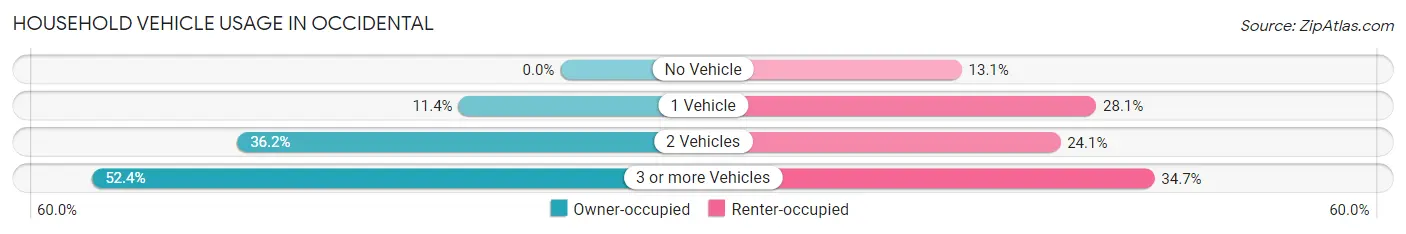
| Vehicles per Household | Owner-occupied | Renter-occupied |
| No Vehicle | 0 (0.0%) | 26 (13.1%) |
| 1 Vehicle | 40 (11.4%) | 56 (28.1%) |
| 2 Vehicles | 127 (36.2%) | 48 (24.1%) |
| 3 or more Vehicles | 184 (52.4%) | 69 (34.7%) |
| Total | 351 (100.0%) | 199 (100.0%) |
Real Estate & Mortgages in Occidental
Real Estate and Mortgage Overview in Occidental
| Characteristic | Without Mortgage | With Mortgage |
| Housing Units | 160 | 191 |
| Median Property Value | $903,800 | $1,681,300 |
| Median Household Income | $80,882 | $125 |
| Monthly Housing Costs | $753 | $149 |
| Real Estate Taxes | $5,636 | $0 |
Property Value by Mortgage Status in Occidental
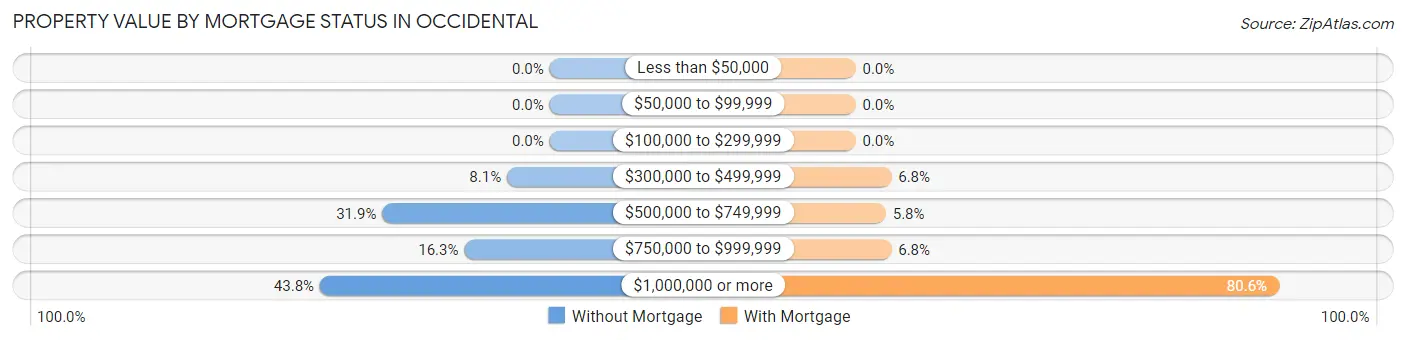
| Property Value | Without Mortgage | With Mortgage |
| Less than $50,000 | 0 (0.0%) | 0 (0.0%) |
| $50,000 to $99,999 | 0 (0.0%) | 0 (0.0%) |
| $100,000 to $299,999 | 0 (0.0%) | 0 (0.0%) |
| $300,000 to $499,999 | 13 (8.1%) | 13 (6.8%) |
| $500,000 to $749,999 | 51 (31.9%) | 11 (5.8%) |
| $750,000 to $999,999 | 26 (16.3%) | 13 (6.8%) |
| $1,000,000 or more | 70 (43.8%) | 154 (80.6%) |
| Total | 160 (100.0%) | 191 (100.0%) |
Household Income by Mortgage Status in Occidental
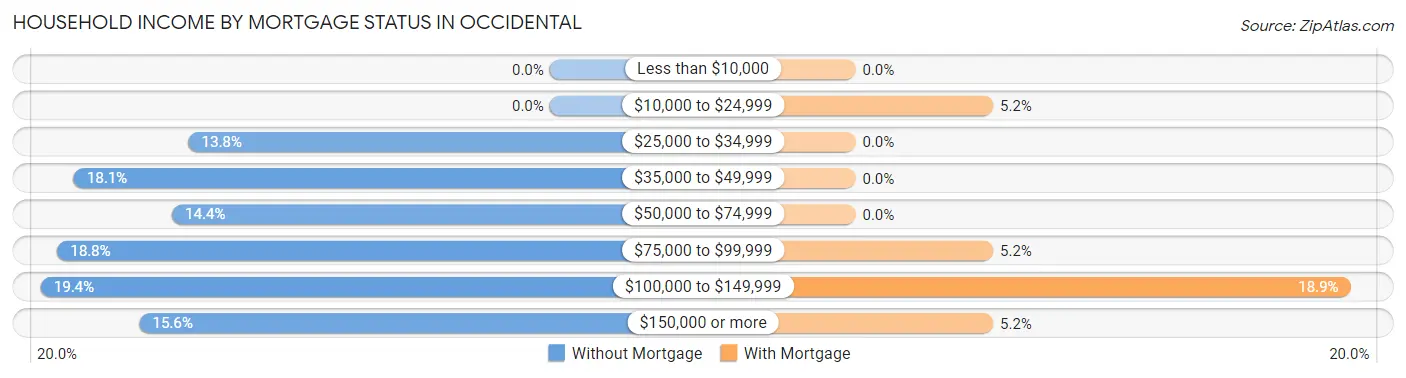
| Household Income | Without Mortgage | With Mortgage |
| Less than $10,000 | 0 (0.0%) | 0 (0.0%) |
| $10,000 to $24,999 | 0 (0.0%) | 10 (5.2%) |
| $25,000 to $34,999 | 22 (13.8%) | 0 (0.0%) |
| $35,000 to $49,999 | 29 (18.1%) | 0 (0.0%) |
| $50,000 to $74,999 | 23 (14.4%) | 0 (0.0%) |
| $75,000 to $99,999 | 30 (18.8%) | 10 (5.2%) |
| $100,000 to $149,999 | 31 (19.4%) | 36 (18.9%) |
| $150,000 or more | 25 (15.6%) | 10 (5.2%) |
| Total | 160 (100.0%) | 191 (100.0%) |
Property Value to Household Income Ratio in Occidental
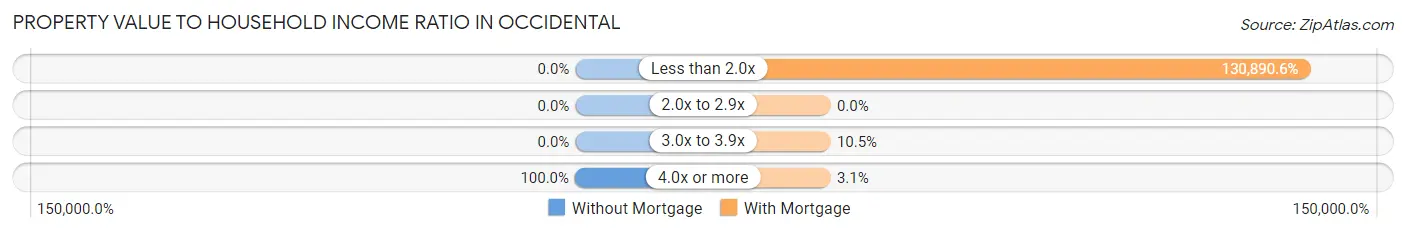
| Value-to-Income Ratio | Without Mortgage | With Mortgage |
| Less than 2.0x | 0 (0.0%) | 250,001 (130,890.6%) |
| 2.0x to 2.9x | 0 (0.0%) | 0 (0.0%) |
| 3.0x to 3.9x | 0 (0.0%) | 20 (10.5%) |
| 4.0x or more | 160 (100.0%) | 6 (3.1%) |
| Total | 160 (100.0%) | 191 (100.0%) |
Real Estate Taxes by Mortgage Status in Occidental
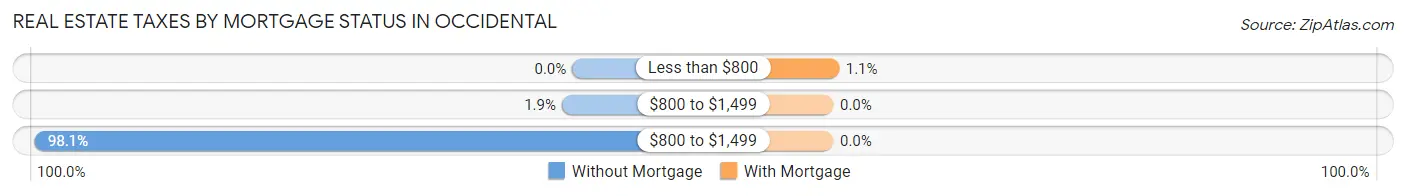
| Property Taxes | Without Mortgage | With Mortgage |
| Less than $800 | 0 (0.0%) | 2 (1.1%) |
| $800 to $1,499 | 3 (1.9%) | 0 (0.0%) |
| $800 to $1,499 | 157 (98.1%) | 0 (0.0%) |
| Total | 160 (100.0%) | 191 (100.0%) |
Health & Disability in Occidental
Health Insurance Coverage by Age in Occidental
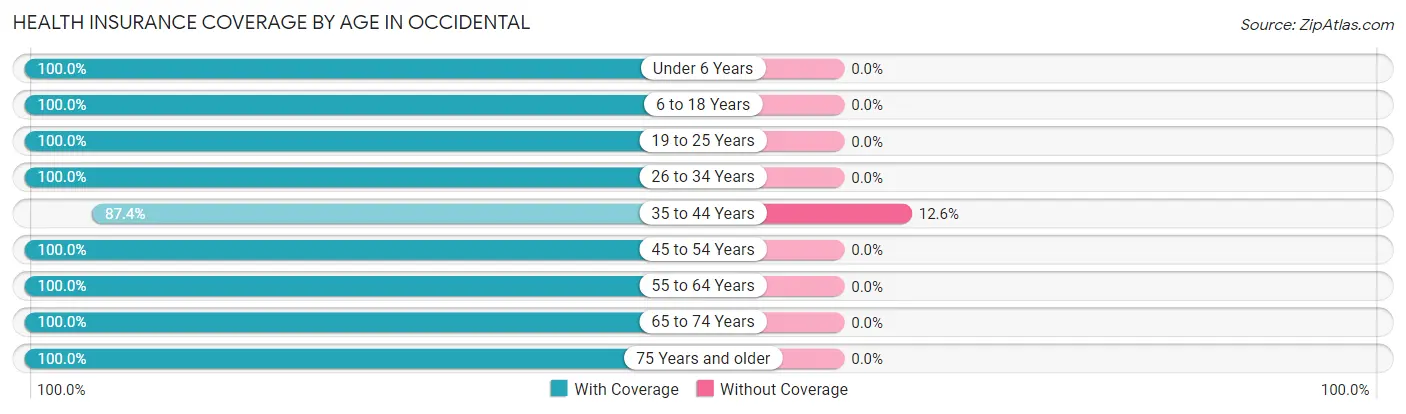
| Age Bracket | With Coverage | Without Coverage |
| Under 6 Years | 59 (100.0%) | 0 (0.0%) |
| 6 to 18 Years | 58 (100.0%) | 0 (0.0%) |
| 19 to 25 Years | 31 (100.0%) | 0 (0.0%) |
| 26 to 34 Years | 41 (100.0%) | 0 (0.0%) |
| 35 to 44 Years | 125 (87.4%) | 18 (12.6%) |
| 45 to 54 Years | 169 (100.0%) | 0 (0.0%) |
| 55 to 64 Years | 260 (100.0%) | 0 (0.0%) |
| 65 to 74 Years | 212 (100.0%) | 0 (0.0%) |
| 75 Years and older | 88 (100.0%) | 0 (0.0%) |
| Total | 1,043 (98.3%) | 18 (1.7%) |
Health Insurance Coverage by Citizenship Status in Occidental
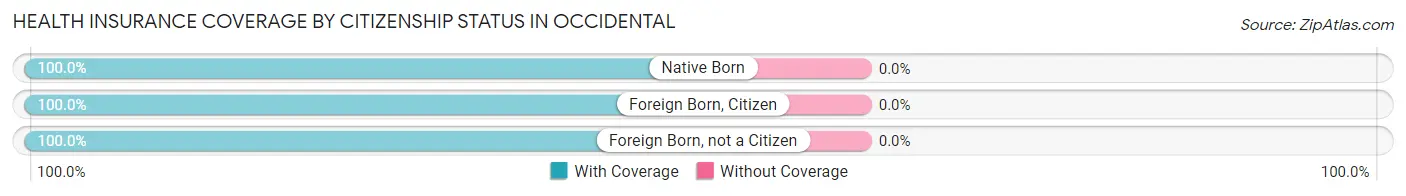
| Citizenship Status | With Coverage | Without Coverage |
| Native Born | 59 (100.0%) | 0 (0.0%) |
| Foreign Born, Citizen | 58 (100.0%) | 0 (0.0%) |
| Foreign Born, not a Citizen | 31 (100.0%) | 0 (0.0%) |
Health Insurance Coverage by Household Income in Occidental
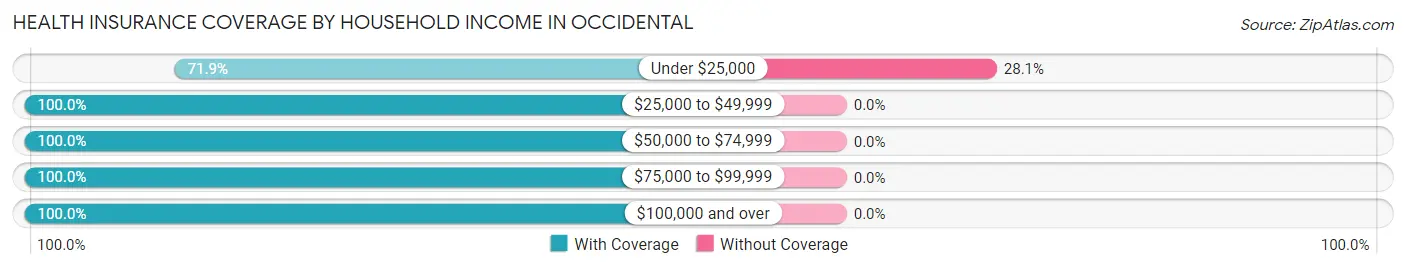
| Household Income | With Coverage | Without Coverage |
| Under $25,000 | 46 (71.9%) | 18 (28.1%) |
| $25,000 to $49,999 | 89 (100.0%) | 0 (0.0%) |
| $50,000 to $74,999 | 56 (100.0%) | 0 (0.0%) |
| $75,000 to $99,999 | 205 (100.0%) | 0 (0.0%) |
| $100,000 and over | 647 (100.0%) | 0 (0.0%) |
Public vs Private Health Insurance Coverage by Age in Occidental
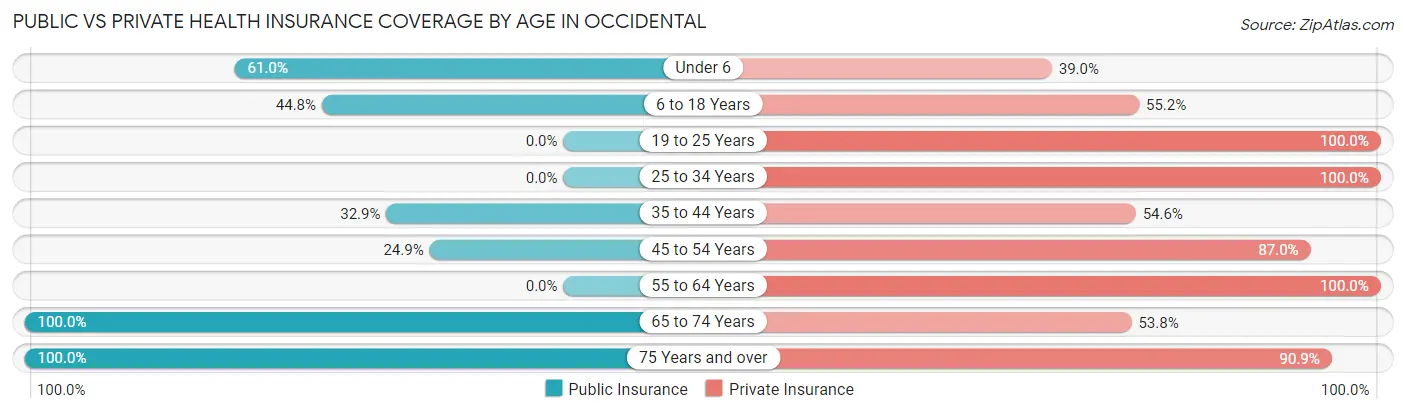
| Age Bracket | Public Insurance | Private Insurance |
| Under 6 | 36 (61.0%) | 23 (39.0%) |
| 6 to 18 Years | 26 (44.8%) | 32 (55.2%) |
| 19 to 25 Years | 0 (0.0%) | 31 (100.0%) |
| 25 to 34 Years | 0 (0.0%) | 41 (100.0%) |
| 35 to 44 Years | 47 (32.9%) | 78 (54.5%) |
| 45 to 54 Years | 42 (24.8%) | 147 (87.0%) |
| 55 to 64 Years | 0 (0.0%) | 260 (100.0%) |
| 65 to 74 Years | 212 (100.0%) | 114 (53.8%) |
| 75 Years and over | 88 (100.0%) | 80 (90.9%) |
| Total | 451 (42.5%) | 806 (76.0%) |
Disability Status by Sex by Age in Occidental

| Age Bracket | Male | Female |
| Under 5 Years | 0 (0.0%) | 0 (0.0%) |
| 5 to 17 Years | 0 (0.0%) | 0 (0.0%) |
| 18 to 34 Years | 0 (0.0%) | 0 (0.0%) |
| 35 to 64 Years | 0 (0.0%) | 0 (0.0%) |
| 65 to 74 Years | 26 (19.4%) | 0 (0.0%) |
| 75 Years and over | 11 (22.0%) | 0 (0.0%) |
Disability Class by Sex by Age in Occidental
Disability Class: Hearing Difficulty
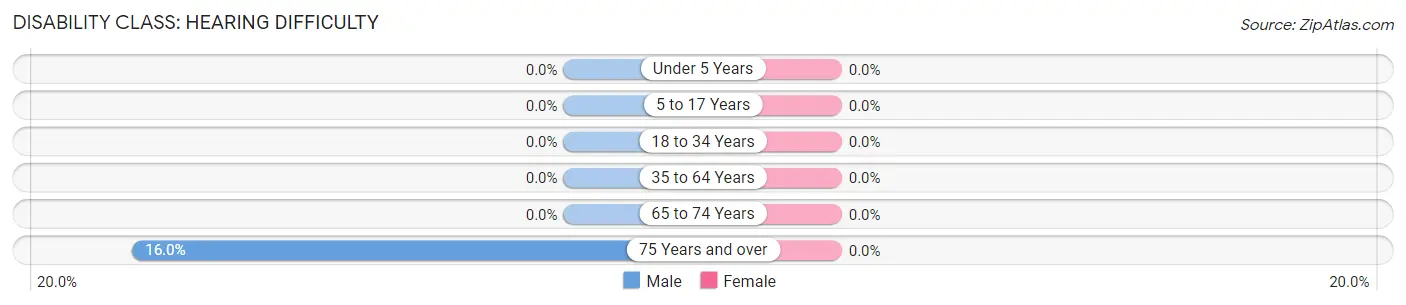
| Age Bracket | Male | Female |
| Under 5 Years | 0 (0.0%) | 0 (0.0%) |
| 5 to 17 Years | 0 (0.0%) | 0 (0.0%) |
| 18 to 34 Years | 0 (0.0%) | 0 (0.0%) |
| 35 to 64 Years | 0 (0.0%) | 0 (0.0%) |
| 65 to 74 Years | 0 (0.0%) | 0 (0.0%) |
| 75 Years and over | 8 (16.0%) | 0 (0.0%) |
Disability Class: Vision Difficulty
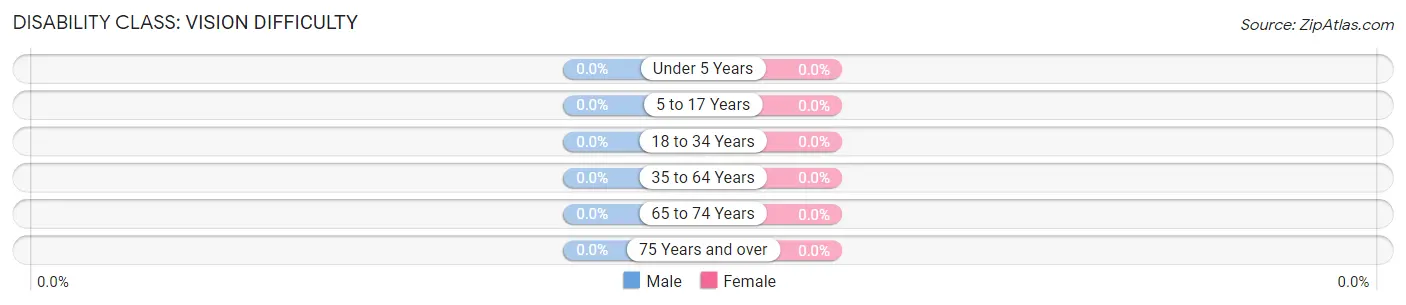
| Age Bracket | Male | Female |
| Under 5 Years | 0 (0.0%) | 0 (0.0%) |
| 5 to 17 Years | 0 (0.0%) | 0 (0.0%) |
| 18 to 34 Years | 0 (0.0%) | 0 (0.0%) |
| 35 to 64 Years | 0 (0.0%) | 0 (0.0%) |
| 65 to 74 Years | 0 (0.0%) | 0 (0.0%) |
| 75 Years and over | 0 (0.0%) | 0 (0.0%) |
Disability Class: Cognitive Difficulty
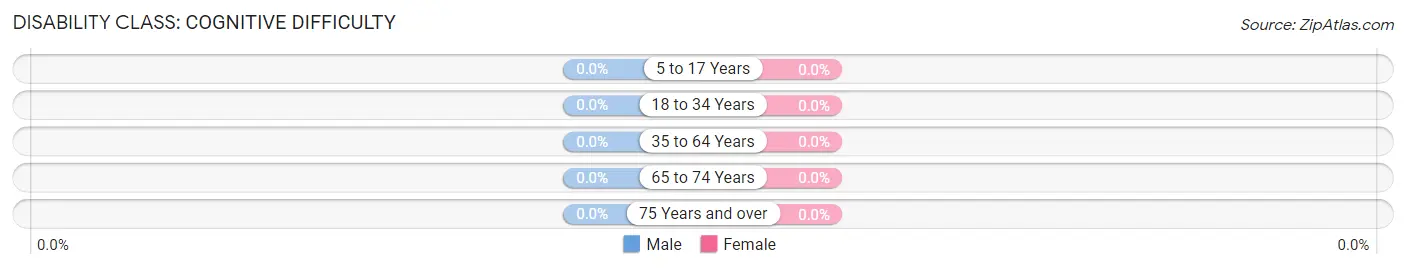
| Age Bracket | Male | Female |
| 5 to 17 Years | 0 (0.0%) | 0 (0.0%) |
| 18 to 34 Years | 0 (0.0%) | 0 (0.0%) |
| 35 to 64 Years | 0 (0.0%) | 0 (0.0%) |
| 65 to 74 Years | 0 (0.0%) | 0 (0.0%) |
| 75 Years and over | 0 (0.0%) | 0 (0.0%) |
Disability Class: Ambulatory Difficulty
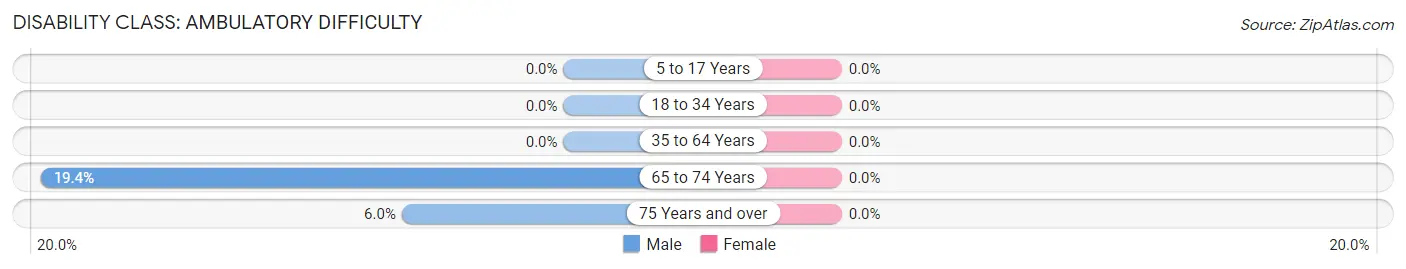
| Age Bracket | Male | Female |
| 5 to 17 Years | 0 (0.0%) | 0 (0.0%) |
| 18 to 34 Years | 0 (0.0%) | 0 (0.0%) |
| 35 to 64 Years | 0 (0.0%) | 0 (0.0%) |
| 65 to 74 Years | 26 (19.4%) | 0 (0.0%) |
| 75 Years and over | 3 (6.0%) | 0 (0.0%) |
Disability Class: Self-Care Difficulty
| Age Bracket | Male | Female |
| 5 to 17 Years | 0 (0.0%) | 0 (0.0%) |
| 18 to 34 Years | 0 (0.0%) | 0 (0.0%) |
| 35 to 64 Years | 0 (0.0%) | 0 (0.0%) |
| 65 to 74 Years | 0 (0.0%) | 0 (0.0%) |
| 75 Years and over | 0 (0.0%) | 0 (0.0%) |
Technology Access in Occidental
Computing Device Access in Occidental
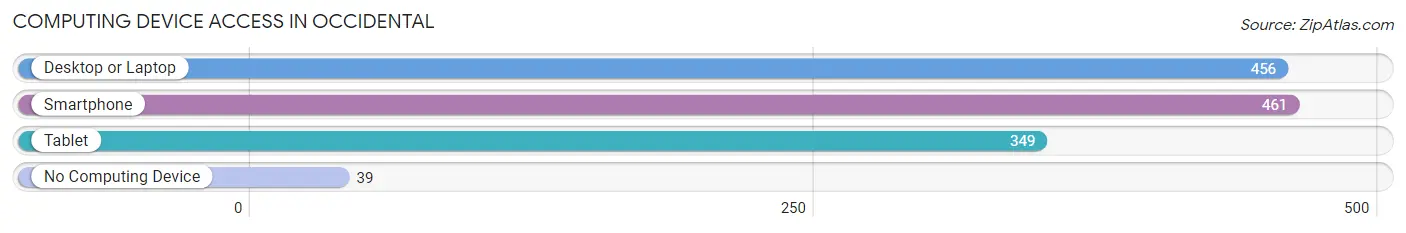
| Device Type | # Households | % Households |
| Desktop or Laptop | 456 | 82.9% |
| Smartphone | 461 | 83.8% |
| Tablet | 349 | 63.4% |
| No Computing Device | 39 | 7.1% |
| Total | 550 | 100.0% |
Internet Access in Occidental
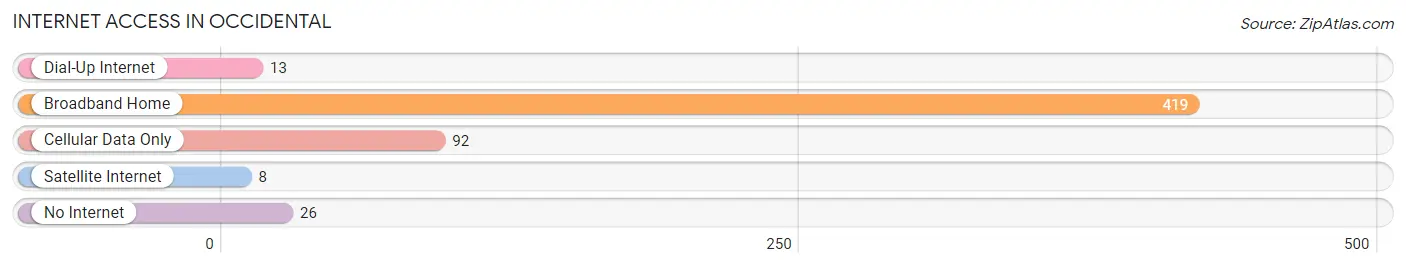
| Internet Type | # Households | % Households |
| Dial-Up Internet | 13 | 2.4% |
| Broadband Home | 419 | 76.2% |
| Cellular Data Only | 92 | 16.7% |
| Satellite Internet | 8 | 1.5% |
| No Internet | 26 | 4.7% |
| Total | 550 | 100.0% |
Occidental Summary
History
The history of Occidental, California dates back to the mid-1800s when the area was first settled by Europeans. The first settlers were a group of Spanish missionaries who established a mission in the area in 1823. The mission was named San Francisco de Asis and was the first of its kind in the region. The mission was eventually abandoned in 1834, but the area remained largely undeveloped until the late 19th century.
In 1876, a group of settlers from the East Coast arrived in the area and established a small community. The community was named Occidental after the nearby Occidental Creek. The settlers built a sawmill and a general store, and the area began to grow. By the early 1900s, Occidental had become a popular tourist destination, with many visitors coming to enjoy the area's natural beauty.
In the 1920s, Occidental began to experience a period of rapid growth. The population increased from just over 500 in 1920 to over 1,000 by 1930. This growth was largely due to the development of the Occidental Hotel, which was built in 1924 and quickly became a popular destination for tourists.
In the 1950s, Occidental experienced a period of decline as the population began to decline and the economy shifted away from tourism. However, in the late 1970s, the area began to experience a resurgence as the population began to increase and new businesses began to open. Today, Occidental is a small but vibrant community with a population of just over 1,000.
Geography
Occidental is located in Sonoma County, California, approximately 50 miles north of San Francisco. The town is situated in the foothills of the Mayacamas Mountains, and is surrounded by rolling hills and lush forests. The area is known for its mild climate and picturesque scenery.
The town is located on the banks of the Occidental Creek, which flows through the center of town. The creek is a popular destination for fishing and swimming. The town is also home to several parks, including the Occidental Community Park, which features a playground, picnic areas, and a walking trail.
Economy
The economy of Occidental is largely based on tourism and agriculture. The town is home to several wineries, and the surrounding area is known for its vineyards and wineries. The town is also home to several restaurants, cafes, and shops, which cater to both locals and tourists.
The town is also home to several small businesses, including a hardware store, a grocery store, and a pharmacy. The town is also home to a number of art galleries, which feature the work of local artists.
Demographics
As of the 2010 census, the population of Occidental was 1,072. The racial makeup of the town was 94.3% White, 0.7% African American, 0.3% Native American, 0.7% Asian, 0.1% Pacific Islander, 1.3% from other races, and 2.0% from two or more races. Hispanic or Latino of any race were 5.2% of the population.
The median household income in Occidental was $60,938, and the median family income was $71,250. The per capita income for the town was $31,945. About 8.3% of families and 11.2% of the population were below the poverty line, including 16.2% of those under age 18 and 4.2% of those age 65 or over.
Common Questions
What is Per Capita Income in Occidental?
Per Capita income in Occidental is $85,917.
What is the Median Household income in Occidental?
Median Household Income in Occidental is $86,042.
What is Inequality or Gini Index in Occidental?
Inequality or Gini Index in Occidental is 0.50.
What is the Total Population of Occidental?
Total Population of Occidental is 1,061.
What is the Total Male Population of Occidental?
Total Male Population of Occidental is 592.
What is the Total Female Population of Occidental?
Total Female Population of Occidental is 469.
What is the Ratio of Males per 100 Females in Occidental?
There are 126.23 Males per 100 Females in Occidental.
What is the Ratio of Females per 100 Males in Occidental?
There are 79.22 Females per 100 Males in Occidental.
What is the Median Population Age in Occidental?
Median Population Age in Occidental is 60.3 Years.
What is the Average Family Size in Occidental
Average Family Size in Occidental is 2.5 People.
What is the Average Household Size in Occidental
Average Household Size in Occidental is 1.9 People.
How Large is the Labor Force in Occidental?
There are 592 People in the Labor Forcein in Occidental.
What is the Percentage of People in the Labor Force in Occidental?
61.5% of People are in the Labor Force in Occidental.
What is the Unemployment Rate in Occidental?
Unemployment Rate in Occidental is 3.7%.