Cities with the Highest Percentage of Population Employed in Computer, Engineering & Science in Oklahoma
RELATED REPORTS & OPTIONS
Computer, Engineering & Science
Oklahoma
Compare Cities
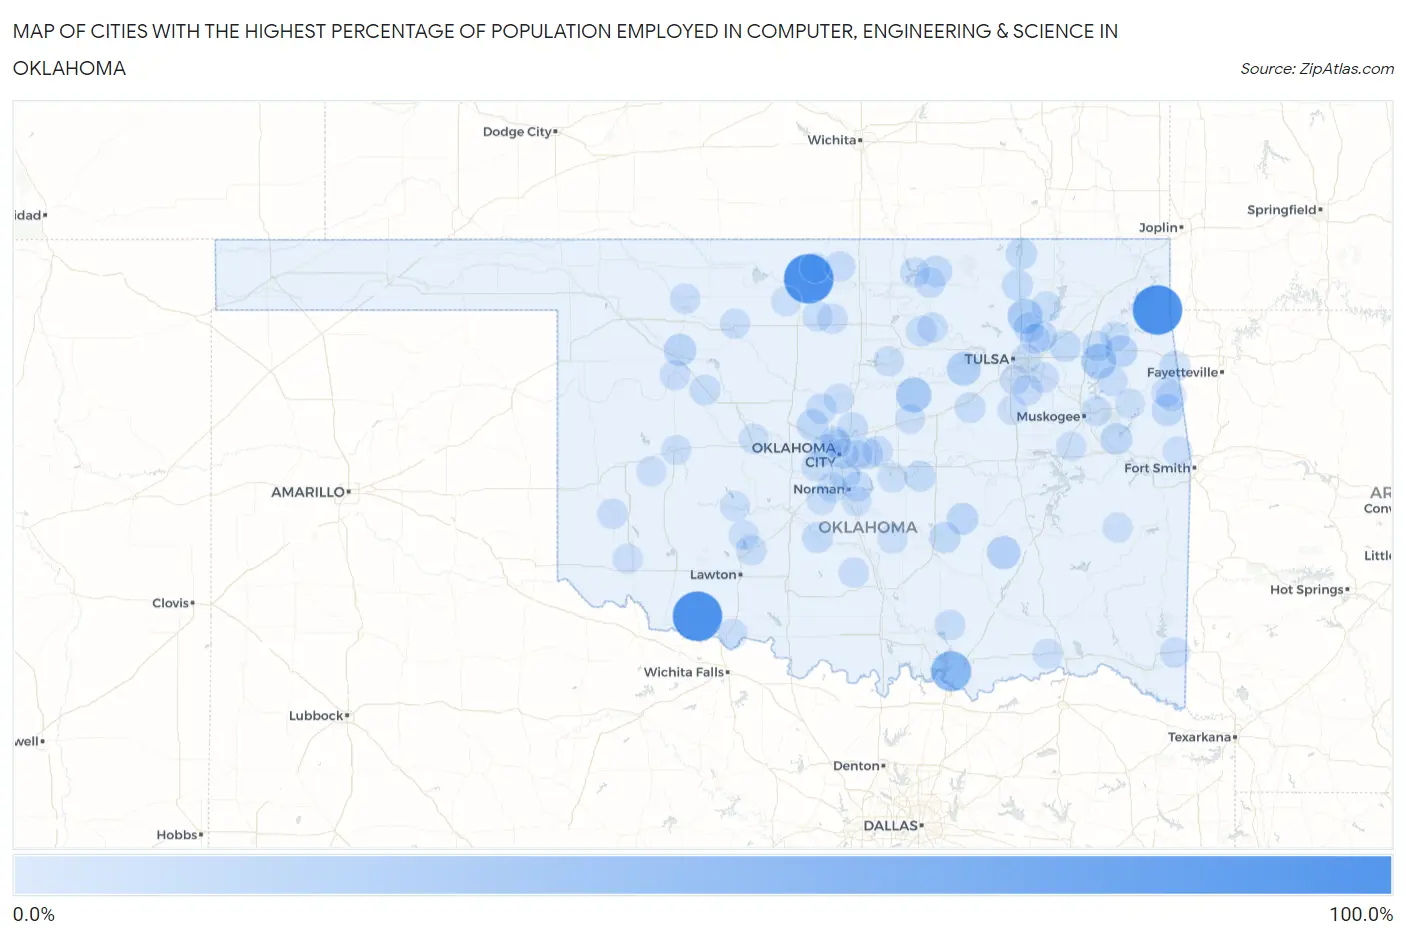
Map of Cities with the Highest Percentage of Population Employed in Computer, Engineering & Science in Oklahoma
0.0%
100.0%
Cities with the Highest Percentage of Population Employed in Computer, Engineering & Science in Oklahoma
| City | % Employed | vs State | vs National | |
| 1. | White Water | 100.0% | 4.9%(+95.1)#1 | 6.8%(+93.2)#13 |
| 2. | Jefferson | 100.0% | 4.9%(+95.1)#2 | 6.8%(+93.2)#22 |
| 3. | Loveland | 100.0% | 4.9%(+95.1)#3 | 6.8%(+93.2)#23 |
| 4. | Platter | 52.9% | 4.9%(+48.0)#4 | 6.8%(+46.2)#63 |
| 5. | Lawtonka Acres | 28.9% | 4.9%(+24.0)#5 | 6.8%(+22.2)#239 |
| 6. | Agra | 28.4% | 4.9%(+23.5)#6 | 6.8%(+21.7)#254 |
| 7. | Vera | 28.0% | 4.9%(+23.0)#7 | 6.8%(+21.2)#263 |
| 8. | Murphy | 27.7% | 4.9%(+22.7)#8 | 6.8%(+20.9)#269 |
| 9. | Lawrence Creek | 23.1% | 4.9%(+18.2)#9 | 6.8%(+16.3)#395 |
| 10. | Hochatown | 22.5% | 4.9%(+17.6)#10 | 6.8%(+15.8)#422 |
| 11. | Ashland | 21.1% | 4.9%(+16.1)#11 | 6.8%(+14.3)#502 |
| 12. | Sportmans Shores | 16.7% | 4.9%(+11.7)#12 | 6.8%(+9.90)#874 |
| 13. | Chester | 16.7% | 4.9%(+11.7)#13 | 6.8%(+9.90)#876 |
| 14. | Middleberg | 15.2% | 4.9%(+10.2)#14 | 6.8%(+8.39)#1,109 |
| 15. | Rose | 14.3% | 4.9%(+9.36)#15 | 6.8%(+7.52)#1,268 |
| 16. | Spaulding | 13.7% | 4.9%(+8.80)#16 | 6.8%(+6.96)#1,415 |
| 17. | Zion | 13.3% | 4.9%(+8.41)#17 | 6.8%(+6.57)#1,541 |
| 18. | Notchietown | 12.9% | 4.9%(+7.95)#18 | 6.8%(+6.11)#1,668 |
| 19. | Little Ponderosa | 12.8% | 4.9%(+7.92)#19 | 6.8%(+6.08)#1,678 |
| 20. | Piedmont | 12.5% | 4.9%(+7.55)#20 | 6.8%(+5.71)#1,784 |
| 21. | Tiawah | 12.0% | 4.9%(+7.03)#21 | 6.8%(+5.19)#1,953 |
| 22. | Francis | 11.8% | 4.9%(+6.88)#22 | 6.8%(+5.04)#2,004 |
| 23. | Shidler | 11.6% | 4.9%(+6.72)#23 | 6.8%(+4.88)#2,058 |
| 24. | Copan | 11.3% | 4.9%(+6.40)#24 | 6.8%(+4.56)#2,209 |
| 25. | Limestone | 11.3% | 4.9%(+6.39)#25 | 6.8%(+4.55)#2,212 |
| 26. | Watts | 10.5% | 4.9%(+5.60)#26 | 6.8%(+3.76)#2,623 |
| 27. | Bartlesville | 9.7% | 4.9%(+4.80)#27 | 6.8%(+2.96)#3,134 |
| 28. | Bradley | 9.7% | 4.9%(+4.75)#28 | 6.8%(+2.91)#3,174 |
| 29. | Greenville | 9.6% | 4.9%(+4.69)#29 | 6.8%(+2.85)#3,224 |
| 30. | Woodlawn Park | 9.4% | 4.9%(+4.51)#30 | 6.8%(+2.67)#3,363 |
| 31. | Earlsboro | 9.4% | 4.9%(+4.45)#31 | 6.8%(+2.61)#3,411 |
| 32. | Moore | 9.2% | 4.9%(+4.27)#32 | 6.8%(+2.43)#3,549 |
| 33. | Elgin | 8.8% | 4.9%(+3.85)#33 | 6.8%(+2.01)#3,921 |
| 34. | Slick | 8.8% | 4.9%(+3.85)#34 | 6.8%(+2.01)#3,925 |
| 35. | Rocky Point | 8.6% | 4.9%(+3.66)#35 | 6.8%(+1.82)#4,084 |
| 36. | Oakwood | 8.6% | 4.9%(+3.65)#36 | 6.8%(+1.81)#4,107 |
| 37. | Cashion | 8.4% | 4.9%(+3.50)#37 | 6.8%(+1.66)#4,238 |
| 38. | Burbank | 8.3% | 4.9%(+3.41)#38 | 6.8%(+1.57)#4,334 |
| 39. | Edmond | 8.3% | 4.9%(+3.37)#39 | 6.8%(+1.53)#4,377 |
| 40. | Choctaw | 8.3% | 4.9%(+3.33)#40 | 6.8%(+1.49)#4,412 |
| 41. | Deer Creek | 8.1% | 4.9%(+3.18)#41 | 6.8%(+1.34)#4,575 |
| 42. | Pawnee | 8.0% | 4.9%(+3.06)#42 | 6.8%(+1.22)#4,724 |
| 43. | Sportsmen Acres | 7.8% | 4.9%(+2.92)#43 | 6.8%(+1.08)#4,890 |
| 44. | Collinsville | 7.8% | 4.9%(+2.89)#44 | 6.8%(+1.05)#4,921 |
| 45. | Norman | 7.8% | 4.9%(+2.83)#45 | 6.8%(+0.987)#5,003 |
| 46. | Bixby | 7.7% | 4.9%(+2.78)#46 | 6.8%(+0.943)#5,055 |
| 47. | Milburn | 7.6% | 4.9%(+2.69)#47 | 6.8%(+0.854)#5,171 |
| 48. | The Village | 7.3% | 4.9%(+2.38)#48 | 6.8%(+0.536)#5,533 |
| 49. | Harrah | 7.2% | 4.9%(+2.26)#49 | 6.8%(+0.425)#5,668 |
| 50. | Willow | 7.1% | 4.9%(+2.22)#50 | 6.8%(+0.378)#5,749 |
| 51. | Skedee | 7.1% | 4.9%(+2.22)#51 | 6.8%(+0.378)#5,758 |
| 52. | Eagletown | 7.1% | 4.9%(+2.18)#52 | 6.8%(+0.336)#5,812 |
| 53. | Newcastle | 7.0% | 4.9%(+2.10)#53 | 6.8%(+0.257)#5,928 |
| 54. | Waynoka | 7.0% | 4.9%(+2.09)#54 | 6.8%(+0.253)#5,931 |
| 55. | Garber | 7.0% | 4.9%(+2.08)#55 | 6.8%(+0.238)#5,949 |
| 56. | Lost City | 6.9% | 4.9%(+1.97)#56 | 6.8%(+0.132)#6,103 |
| 57. | Broken Arrow | 6.9% | 4.9%(+1.95)#57 | 6.8%(+0.106)#6,153 |
| 58. | Jenks | 6.8% | 4.9%(+1.91)#58 | 6.8%(+0.066)#6,211 |
| 59. | Elmore City | 6.8% | 4.9%(+1.83)#59 | 6.8%(-0.014)#6,333 |
| 60. | Oklahoma City | 6.7% | 4.9%(+1.76)#60 | 6.8%(-0.083)#6,423 |
| 61. | Owasso | 6.7% | 4.9%(+1.73)#61 | 6.8%(-0.107)#6,472 |
| 62. | Peavine | 6.6% | 4.9%(+1.64)#62 | 6.8%(-0.195)#6,590 |
| 63. | Welty | 6.4% | 4.9%(+1.46)#63 | 6.8%(-0.382)#6,887 |
| 64. | Taloga | 6.3% | 4.9%(+1.42)#64 | 6.8%(-0.416)#6,949 |
| 65. | Stillwater | 6.3% | 4.9%(+1.37)#65 | 6.8%(-0.473)#7,055 |
| 66. | Breckenridge | 6.2% | 4.9%(+1.33)#66 | 6.8%(-0.515)#7,131 |
| 67. | Mustang | 6.2% | 4.9%(+1.28)#67 | 6.8%(-0.564)#7,210 |
| 68. | Cedar Valley | 6.1% | 4.9%(+1.15)#68 | 6.8%(-0.687)#7,430 |
| 69. | Cleo Springs | 6.0% | 4.9%(+1.06)#69 | 6.8%(-0.782)#7,622 |
| 70. | Fort Gibson | 5.9% | 4.9%(+1.02)#70 | 6.8%(-0.819)#7,694 |
| 71. | Kaw City | 5.9% | 4.9%(+1.02)#71 | 6.8%(-0.824)#7,706 |
| 72. | Midwest City | 5.9% | 4.9%(+1.01)#72 | 6.8%(-0.830)#7,713 |
| 73. | Rentiesville | 5.9% | 4.9%(+0.958)#73 | 6.8%(-0.882)#7,830 |
| 74. | Long | 5.8% | 4.9%(+0.844)#74 | 6.8%(-0.995)#8,043 |
| 75. | Chandler | 5.6% | 4.9%(+0.711)#75 | 6.8%(-1.13)#8,276 |
| 76. | West Peavine | 5.6% | 4.9%(+0.709)#76 | 6.8%(-1.13)#8,281 |
| 77. | Geary | 5.6% | 4.9%(+0.700)#77 | 6.8%(-1.14)#8,295 |
| 78. | Randlett | 5.6% | 4.9%(+0.662)#78 | 6.8%(-1.18)#8,363 |
| 79. | White Eagle | 5.6% | 4.9%(+0.631)#79 | 6.8%(-1.21)#8,406 |
| 80. | Soper | 5.6% | 4.9%(+0.631)#80 | 6.8%(-1.21)#8,413 |
| 81. | Red Oak | 5.5% | 4.9%(+0.563)#81 | 6.8%(-1.28)#8,550 |
| 82. | Medford | 5.5% | 4.9%(+0.551)#82 | 6.8%(-1.29)#8,570 |
| 83. | Martha | 5.5% | 4.9%(+0.530)#83 | 6.8%(-1.31)#8,624 |
| 84. | Clinton | 5.4% | 4.9%(+0.486)#84 | 6.8%(-1.35)#8,711 |
| 85. | Bethel Acres | 5.4% | 4.9%(+0.481)#85 | 6.8%(-1.36)#8,723 |
| 86. | Hillsdale | 5.4% | 4.9%(+0.481)#86 | 6.8%(-1.36)#8,732 |
| 87. | Winchester | 5.4% | 4.9%(+0.467)#87 | 6.8%(-1.37)#8,752 |
| 88. | Nichols Hills | 5.4% | 4.9%(+0.458)#88 | 6.8%(-1.38)#8,776 |
| 89. | Blanchard | 5.4% | 4.9%(+0.438)#89 | 6.8%(-1.40)#8,829 |
| 90. | Apache | 5.4% | 4.9%(+0.437)#90 | 6.8%(-1.40)#8,832 |
| 91. | Burns Flat | 5.4% | 4.9%(+0.430)#91 | 6.8%(-1.41)#8,848 |
| 92. | Bentley | 5.3% | 4.9%(+0.338)#92 | 6.8%(-1.50)#9,021 |
| 93. | Tulsa | 5.2% | 4.9%(+0.301)#93 | 6.8%(-1.54)#9,077 |
| 94. | Talala | 5.2% | 4.9%(+0.299)#94 | 6.8%(-1.54)#9,082 |
| 95. | Byars | 5.2% | 4.9%(+0.248)#95 | 6.8%(-1.59)#9,188 |
| 96. | Noble | 5.2% | 4.9%(+0.236)#96 | 6.8%(-1.60)#9,212 |
| 97. | Wickliffe | 5.1% | 4.9%(+0.217)#97 | 6.8%(-1.62)#9,255 |
| 98. | Fort Cobb | 5.1% | 4.9%(+0.215)#98 | 6.8%(-1.62)#9,258 |
| 99. | Keefton | 5.1% | 4.9%(+0.212)#99 | 6.8%(-1.63)#9,266 |
| 100. | Park Hill | 5.1% | 4.9%(+0.192)#100 | 6.8%(-1.65)#9,302 |
Common Questions
What are the Top 10 Cities with the Highest Percentage of Population Employed in Computer, Engineering & Science in Oklahoma?
Top 10 Cities with the Highest Percentage of Population Employed in Computer, Engineering & Science in Oklahoma are:
#1
100.0%
#2
100.0%
#3
100.0%
#4
52.9%
#5
28.4%
#6
28.0%
#7
27.7%
#8
23.1%
#9
21.1%
#10
16.7%
What city has the Highest Percentage of Population Employed in Computer, Engineering & Science in Oklahoma?
White Water has the Highest Percentage of Population Employed in Computer, Engineering & Science in Oklahoma with 100.0%.
What is the Percentage of Population Employed in Computer, Engineering & Science in the State of Oklahoma?
Percentage of Population Employed in Computer, Engineering & Science in Oklahoma is 4.9%.
What is the Percentage of Population Employed in Computer, Engineering & Science in the United States?
Percentage of Population Employed in Computer, Engineering & Science in the United States is 6.8%.