Cities with the Highest Percentage of Population Employed in Computer, Engineering & Science in Puerto Rico
RELATED REPORTS & OPTIONS
Computer, Engineering & Science
Puerto Rico
Compare Cities
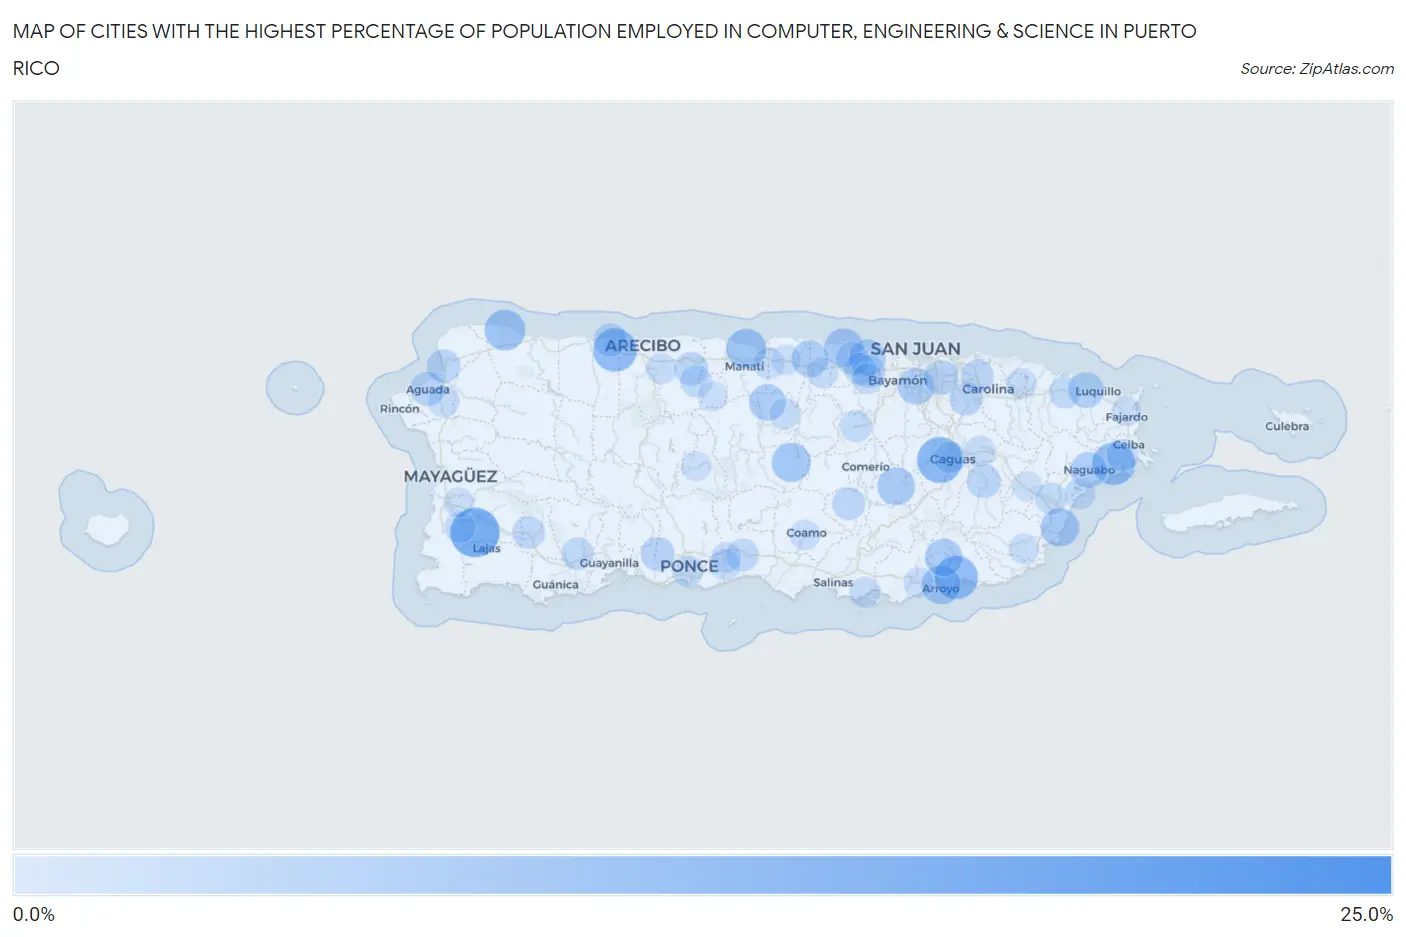
Map of Cities with the Highest Percentage of Population Employed in Computer, Engineering & Science in Puerto Rico
0.0%
25.0%
Cities with the Highest Percentage of Population Employed in Computer, Engineering & Science in Puerto Rico
| City | % Employed | vs State | vs National | |
| 1. | Pueblito Del Rio | 24.2% | 3.5%(+20.7)#1 | 6.8%(+17.4)#355 |
| 2. | Las Gaviotas | 15.9% | 3.5%(+12.4)#2 | 6.8%(+9.09)#983 |
| 3. | Sabana Eneas | 15.8% | 3.5%(+12.3)#3 | 6.8%(+9.04)#989 |
| 4. | Los Prados | 13.1% | 3.5%(+9.59)#4 | 6.8%(+6.31)#1,608 |
| 5. | Rincon | 12.8% | 3.5%(+9.31)#5 | 6.8%(+6.04)#1,695 |
| 6. | Buena Vista Comunidad Humacao Municipio | 11.9% | 3.5%(+8.44)#6 | 6.8%(+5.16)#1,972 |
| 7. | Corcovado | 11.5% | 3.5%(+8.05)#7 | 6.8%(+4.77)#2,098 |
| 8. | Palmas | 11.5% | 3.5%(+7.98)#8 | 6.8%(+4.70)#2,139 |
| 9. | Daguao | 11.0% | 3.5%(+7.52)#9 | 6.8%(+4.24)#2,377 |
| 10. | Bufalo | 10.2% | 3.5%(+6.71)#10 | 6.8%(+3.43)#2,815 |
| 11. | Isabela | 9.5% | 3.5%(+5.98)#11 | 6.8%(+2.70)#3,334 |
| 12. | Honduras | 9.3% | 3.5%(+5.80)#12 | 6.8%(+2.52)#3,476 |
| 13. | Tierras Nuevas Poniente | 8.9% | 3.5%(+5.37)#13 | 6.8%(+2.09)#3,854 |
| 14. | Arroyo | 8.3% | 3.5%(+4.78)#14 | 6.8%(+1.50)#4,392 |
| 15. | Orocovis | 8.2% | 3.5%(+4.72)#15 | 6.8%(+1.44)#4,463 |
| 16. | Dorado | 7.9% | 3.5%(+4.43)#16 | 6.8%(+1.15)#4,803 |
| 17. | Imbery | 7.9% | 3.5%(+4.38)#17 | 6.8%(+1.10)#4,861 |
| 18. | San Sebastian | 7.8% | 3.5%(+4.36)#18 | 6.8%(+1.08)#4,881 |
| 19. | Marueno | 7.8% | 3.5%(+4.36)#19 | 6.8%(+1.08)#4,886 |
| 20. | Palmas Del Mar | 7.8% | 3.5%(+4.29)#20 | 6.8%(+1.02)#4,965 |
| 21. | San Antonio Comunidad Dorado Municipio | 7.4% | 3.5%(+3.93)#21 | 6.8%(+0.650)#5,391 |
| 22. | Cidra | 7.3% | 3.5%(+3.83)#22 | 6.8%(+0.552)#5,517 |
| 23. | Yaurel | 7.2% | 3.5%(+3.74)#23 | 6.8%(+0.464)#5,615 |
| 24. | Las Marías | 7.2% | 3.5%(+3.67)#24 | 6.8%(+0.392)#5,719 |
| 25. | Comerio | 6.8% | 3.5%(+3.27)#25 | 6.8%(-0.013)#6,332 |
| 26. | Ceiba | 6.6% | 3.5%(+3.09)#26 | 6.8%(-0.193)#6,588 |
| 27. | Guaynabo | 6.5% | 3.5%(+3.06)#27 | 6.8%(-0.222)#6,630 |
| 28. | Barahona | 6.5% | 3.5%(+3.04)#28 | 6.8%(-0.236)#6,660 |
| 29. | Boqueron Comunidad Las Piedras Municipio | 6.2% | 3.5%(+2.74)#29 | 6.8%(-0.538)#7,163 |
| 30. | Ingenio | 6.2% | 3.5%(+2.71)#30 | 6.8%(-0.574)#7,224 |
| 31. | Naguabo | 6.2% | 3.5%(+2.69)#31 | 6.8%(-0.587)#7,253 |
| 32. | Rincón | 6.0% | 3.5%(+2.47)#32 | 6.8%(-0.804)#7,671 |
| 33. | Playa Fortuna | 5.9% | 3.5%(+2.46)#33 | 6.8%(-0.816)#7,690 |
| 34. | Canovanas | 5.8% | 3.5%(+2.32)#34 | 6.8%(-0.960)#7,986 |
| 35. | Rosa Sanchez | 5.8% | 3.5%(+2.28)#35 | 6.8%(-0.995)#8,040 |
| 36. | Penuelas | 5.5% | 3.5%(+1.99)#36 | 6.8%(-1.29)#8,572 |
| 37. | Rio Canas Abajo | 5.2% | 3.5%(+1.75)#37 | 6.8%(-1.53)#9,062 |
| 38. | San Juan | 5.1% | 3.5%(+1.59)#38 | 6.8%(-1.69)#9,393 |
| 39. | Aguada | 4.9% | 3.5%(+1.44)#39 | 6.8%(-1.84)#9,728 |
| 40. | Rio Lajas | 4.8% | 3.5%(+1.32)#40 | 6.8%(-1.96)#10,009 |
| 41. | Quebrada Del Agua | 4.6% | 3.5%(+1.14)#41 | 6.8%(-2.14)#10,402 |
| 42. | Palomas Comunidad Yauco Municipio | 4.6% | 3.5%(+1.13)#42 | 6.8%(-2.15)#10,431 |
| 43. | San Lorenzo | 4.5% | 3.5%(+1.05)#43 | 6.8%(-2.23)#10,638 |
| 44. | Aguadilla | 4.4% | 3.5%(+0.953)#44 | 6.8%(-2.33)#10,842 |
| 45. | Manati | 4.4% | 3.5%(+0.872)#45 | 6.8%(-2.41)#11,030 |
| 46. | Sabana Hoyos | 4.3% | 3.5%(+0.835)#46 | 6.8%(-2.44)#11,121 |
| 47. | Carrizales | 4.3% | 3.5%(+0.828)#47 | 6.8%(-2.45)#11,141 |
| 48. | Trujillo Alto | 4.3% | 3.5%(+0.809)#48 | 6.8%(-2.47)#11,191 |
| 49. | Yeguada | 4.3% | 3.5%(+0.785)#49 | 6.8%(-2.49)#11,254 |
| 50. | Toa Baja | 4.2% | 3.5%(+0.731)#50 | 6.8%(-2.55)#11,402 |
| 51. | Candelaria Arenas | 4.1% | 3.5%(+0.603)#51 | 6.8%(-2.68)#11,735 |
| 52. | Bayamon | 4.0% | 3.5%(+0.515)#52 | 6.8%(-2.76)#11,956 |
| 53. | Aibonito | 3.9% | 3.5%(+0.420)#53 | 6.8%(-2.86)#12,236 |
| 54. | Del Carmen | 3.9% | 3.5%(+0.413)#54 | 6.8%(-2.87)#12,255 |
| 55. | Carolina | 3.9% | 3.5%(+0.399)#55 | 6.8%(-2.88)#12,287 |
| 56. | Piedra Aguza | 3.9% | 3.5%(+0.386)#56 | 6.8%(-2.89)#12,339 |
| 57. | Hacienda San Jose | 3.8% | 3.5%(+0.311)#57 | 6.8%(-2.97)#12,547 |
| 58. | Sabana Grande | 3.7% | 3.5%(+0.239)#58 | 6.8%(-3.04)#12,737 |
| 59. | Brenas | 3.7% | 3.5%(+0.218)#59 | 6.8%(-3.06)#12,794 |
| 60. | Bayamón | 3.7% | 3.5%(+0.216)#60 | 6.8%(-3.06)#12,827 |
| 61. | Yauco | 3.6% | 3.5%(+0.105)#61 | 6.8%(-3.17)#13,118 |
| 62. | Guanica | 3.5% | 3.5%(+0.041)#62 | 6.8%(-3.24)#13,314 |
| 63. | Mansión Del Mar | 3.4% | 3.5%(-0.045)#63 | 6.8%(-3.32)#13,583 |
| 64. | Aguas Claras | 3.4% | 3.5%(-0.047)#64 | 6.8%(-3.33)#13,587 |
| 65. | Campanilla | 3.4% | 3.5%(-0.060)#65 | 6.8%(-3.34)#13,632 |
| 66. | La Alianza | 3.4% | 3.5%(-0.102)#66 | 6.8%(-3.38)#13,752 |
| 67. | Humacao | 3.2% | 3.5%(-0.247)#67 | 6.8%(-3.53)#14,213 |
| 68. | Hato Candal | 3.2% | 3.5%(-0.260)#68 | 6.8%(-3.54)#14,240 |
| 69. | Naranjito | 3.2% | 3.5%(-0.271)#69 | 6.8%(-3.55)#14,290 |
| 70. | Rafael Gonzalez | 3.2% | 3.5%(-0.280)#70 | 6.8%(-3.56)#14,313 |
| 71. | Caguas | 3.1% | 3.5%(-0.349)#71 | 6.8%(-3.63)#14,515 |
| 72. | Catano | 3.1% | 3.5%(-0.353)#72 | 6.8%(-3.63)#14,532 |
| 73. | Mayaguez | 3.1% | 3.5%(-0.365)#73 | 6.8%(-3.64)#14,570 |
| 74. | Ponce | 3.0% | 3.5%(-0.499)#74 | 6.8%(-3.78)#14,962 |
| 75. | Luyando | 2.9% | 3.5%(-0.617)#75 | 6.8%(-3.90)#15,300 |
| 76. | Vega Alta | 2.7% | 3.5%(-0.742)#76 | 6.8%(-4.02)#15,677 |
| 77. | Mariano Colon | 2.7% | 3.5%(-0.757)#77 | 6.8%(-4.04)#15,724 |
| 78. | Morovis | 2.7% | 3.5%(-0.789)#78 | 6.8%(-4.07)#15,856 |
| 79. | Coto Norte | 2.7% | 3.5%(-0.791)#79 | 6.8%(-4.07)#15,862 |
| 80. | Capitanejo | 2.6% | 3.5%(-0.839)#80 | 6.8%(-4.12)#16,023 |
| 81. | Monte Grande | 2.6% | 3.5%(-0.852)#81 | 6.8%(-4.13)#16,046 |
| 82. | Central Aguirre | 2.6% | 3.5%(-0.854)#82 | 6.8%(-4.13)#16,054 |
| 83. | Gurabo | 2.6% | 3.5%(-0.866)#83 | 6.8%(-4.15)#16,095 |
| 84. | San Isidro | 2.6% | 3.5%(-0.886)#84 | 6.8%(-4.16)#16,167 |
| 85. | Juana Diaz | 2.6% | 3.5%(-0.927)#85 | 6.8%(-4.21)#16,299 |
| 86. | Bajadero | 2.5% | 3.5%(-0.945)#86 | 6.8%(-4.22)#16,357 |
| 87. | Candelaria | 2.5% | 3.5%(-0.994)#87 | 6.8%(-4.27)#16,520 |
| 88. | Punta Santiago | 2.5% | 3.5%(-1.03)#88 | 6.8%(-4.31)#16,623 |
| 89. | Coamo | 2.3% | 3.5%(-1.20)#89 | 6.8%(-4.47)#17,125 |
| 90. | Loiza | 2.3% | 3.5%(-1.21)#90 | 6.8%(-4.49)#17,153 |
| 91. | Yabucoa | 2.2% | 3.5%(-1.27)#91 | 6.8%(-4.55)#17,377 |
| 92. | Boqueron Comunidad Cabo Rojo Municipio | 2.1% | 3.5%(-1.36)#92 | 6.8%(-4.64)#17,658 |
| 93. | Guayama | 2.1% | 3.5%(-1.39)#93 | 6.8%(-4.66)#17,736 |
| 94. | Aguilita | 2.1% | 3.5%(-1.42)#94 | 6.8%(-4.70)#17,853 |
| 95. | Las Piedras | 2.0% | 3.5%(-1.47)#95 | 6.8%(-4.75)#17,992 |
| 96. | Jayuya | 2.0% | 3.5%(-1.47)#96 | 6.8%(-4.75)#18,008 |
| 97. | Hormigueros | 2.0% | 3.5%(-1.50)#97 | 6.8%(-4.78)#18,093 |
| 98. | Vega Baja | 1.9% | 3.5%(-1.63)#98 | 6.8%(-4.91)#18,442 |
| 99. | Florida | 1.8% | 3.5%(-1.64)#99 | 6.8%(-4.92)#18,480 |
| 100. | Fajardo | 1.8% | 3.5%(-1.65)#100 | 6.8%(-4.93)#18,497 |
Common Questions
What are the Top 10 Cities with the Highest Percentage of Population Employed in Computer, Engineering & Science in Puerto Rico?
Top 10 Cities with the Highest Percentage of Population Employed in Computer, Engineering & Science in Puerto Rico are:
#1
15.8%
#2
13.1%
#3
11.5%
#4
11.5%
#5
11.0%
#6
9.5%
#7
8.9%
#8
8.3%
#9
8.2%
#10
7.9%
What city has the Highest Percentage of Population Employed in Computer, Engineering & Science in Puerto Rico?
Sabana Eneas has the Highest Percentage of Population Employed in Computer, Engineering & Science in Puerto Rico with 15.8%.
What is the Percentage of Population Employed in Computer, Engineering & Science in the State of Puerto Rico?
Percentage of Population Employed in Computer, Engineering & Science in Puerto Rico is 3.5%.
What is the Percentage of Population Employed in Computer, Engineering & Science in the United States?
Percentage of Population Employed in Computer, Engineering & Science in the United States is 6.8%.