Cities with the Highest Percentage of Population Employed in Computer, Engineering & Science in Nevada
RELATED REPORTS & OPTIONS
Computer, Engineering & Science
Nevada
Compare Cities
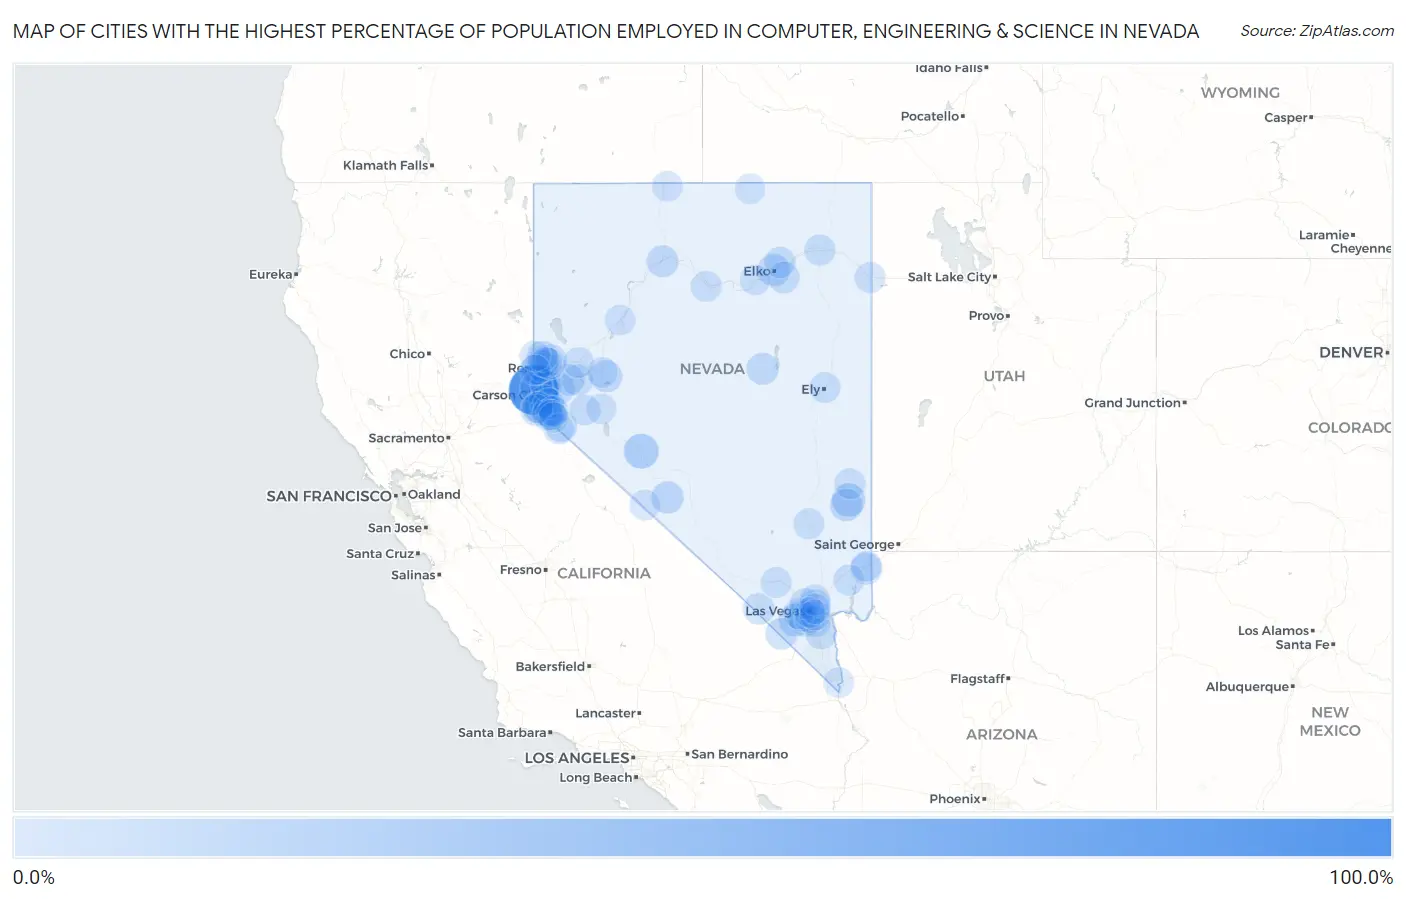
Map of Cities with the Highest Percentage of Population Employed in Computer, Engineering & Science in Nevada
0.0%
100.0%
Cities with the Highest Percentage of Population Employed in Computer, Engineering & Science in Nevada
| City | % Employed | vs State | vs National | |
| 1. | Crystal Bay | 100.0% | 4.5%(+95.5)#1 | 6.8%(+93.2)#4 |
| 2. | Mina | 22.9% | 4.5%(+18.4)#2 | 6.8%(+16.1)#408 |
| 3. | Bennett Springs | 15.6% | 4.5%(+11.1)#3 | 6.8%(+8.86)#1,019 |
| 4. | East Valley | 13.0% | 4.5%(+8.48)#4 | 6.8%(+6.21)#1,635 |
| 5. | Blue Diamond | 11.8% | 4.5%(+7.31)#5 | 6.8%(+5.04)#2,005 |
| 6. | Caliente | 10.7% | 4.5%(+6.20)#6 | 6.8%(+3.93)#2,526 |
| 7. | Elko | 10.4% | 4.5%(+5.93)#7 | 6.8%(+3.66)#2,675 |
| 8. | Silver Peak | 9.9% | 4.5%(+5.44)#8 | 6.8%(+3.17)#2,986 |
| 9. | Kingsbury | 9.3% | 4.5%(+4.83)#9 | 6.8%(+2.56)#3,450 |
| 10. | Incline Village | 9.2% | 4.5%(+4.66)#10 | 6.8%(+2.39)#3,577 |
| 11. | Fallon Station | 9.1% | 4.5%(+4.64)#11 | 6.8%(+2.37)#3,598 |
| 12. | Minden | 8.8% | 4.5%(+4.27)#12 | 6.8%(+2.00)#3,929 |
| 13. | Eureka | 8.6% | 4.5%(+4.10)#13 | 6.8%(+1.82)#4,078 |
| 14. | Winnemucca | 8.5% | 4.5%(+4.04)#14 | 6.8%(+1.77)#4,140 |
| 15. | Bunkerville | 7.8% | 4.5%(+3.33)#15 | 6.8%(+1.05)#4,912 |
| 16. | Dayton | 7.4% | 4.5%(+2.92)#16 | 6.8%(+0.651)#5,389 |
| 17. | Spring Creek | 7.2% | 4.5%(+2.75)#17 | 6.8%(+0.480)#5,604 |
| 18. | Indian Hills | 7.0% | 4.5%(+2.53)#18 | 6.8%(+0.257)#5,925 |
| 19. | Reno | 6.8% | 4.5%(+2.30)#19 | 6.8%(+0.027)#6,279 |
| 20. | Topaz Ranch Estates | 6.8% | 4.5%(+2.27)#20 | 6.8%(-0.006)#6,316 |
| 21. | Sandy Valley | 6.6% | 4.5%(+2.07)#21 | 6.8%(-0.205)#6,599 |
| 22. | Gardnerville | 6.4% | 4.5%(+1.95)#22 | 6.8%(-0.324)#6,798 |
| 23. | Silver Springs | 6.4% | 4.5%(+1.91)#23 | 6.8%(-0.357)#6,850 |
| 24. | Washoe Valley | 6.2% | 4.5%(+1.67)#24 | 6.8%(-0.603)#7,284 |
| 25. | Stagecoach | 6.1% | 4.5%(+1.65)#25 | 6.8%(-0.620)#7,316 |
| 26. | Stateline | 6.1% | 4.5%(+1.63)#26 | 6.8%(-0.642)#7,345 |
| 27. | Pahrump | 6.1% | 4.5%(+1.61)#27 | 6.8%(-0.663)#7,385 |
| 28. | Mogul | 6.0% | 4.5%(+1.47)#28 | 6.8%(-0.797)#7,658 |
| 29. | Osino | 5.8% | 4.5%(+1.28)#29 | 6.8%(-0.989)#8,026 |
| 30. | Carson | 5.5% | 4.5%(+1.00)#30 | 6.8%(-1.27)#8,528 |
| 31. | Enterprise | 5.5% | 4.5%(+0.975)#31 | 6.8%(-1.30)#8,597 |
| 32. | Spanish Springs | 5.4% | 4.5%(+0.934)#32 | 6.8%(-1.34)#8,673 |
| 33. | Wells | 5.3% | 4.5%(+0.789)#33 | 6.8%(-1.48)#8,966 |
| 34. | Nellis Afb | 5.0% | 4.5%(+0.543)#34 | 6.8%(-1.73)#9,482 |
| 35. | Henderson | 5.0% | 4.5%(+0.534)#35 | 6.8%(-1.74)#9,503 |
| 36. | Sparks | 4.9% | 4.5%(+0.372)#36 | 6.8%(-1.90)#9,870 |
| 37. | Johnson Lane | 4.8% | 4.5%(+0.269)#37 | 6.8%(-2.00)#10,089 |
| 38. | Gardnerville Ranchos | 4.4% | 4.5%(-0.101)#38 | 6.8%(-2.37)#10,954 |
| 39. | Round Hill Village | 4.3% | 4.5%(-0.176)#39 | 6.8%(-2.45)#11,132 |
| 40. | Spring Valley | 4.3% | 4.5%(-0.201)#40 | 6.8%(-2.47)#11,198 |
| 41. | Golden Valley | 4.3% | 4.5%(-0.223)#41 | 6.8%(-2.50)#11,259 |
| 42. | Ely | 4.1% | 4.5%(-0.387)#42 | 6.8%(-2.66)#11,691 |
| 43. | Summerlin South | 4.1% | 4.5%(-0.432)#43 | 6.8%(-2.70)#11,811 |
| 44. | Alamo | 3.9% | 4.5%(-0.567)#44 | 6.8%(-2.84)#12,174 |
| 45. | Las Vegas | 3.9% | 4.5%(-0.637)#45 | 6.8%(-2.91)#12,372 |
| 46. | Paradise | 3.8% | 4.5%(-0.652)#46 | 6.8%(-2.92)#12,420 |
| 47. | Boulder City | 3.7% | 4.5%(-0.818)#47 | 6.8%(-3.09)#12,881 |
| 48. | Lemmon Valley | 3.6% | 4.5%(-0.910)#48 | 6.8%(-3.18)#13,140 |
| 49. | Indian Springs | 3.5% | 4.5%(-0.989)#49 | 6.8%(-3.26)#13,382 |
| 50. | Sun Valley | 3.5% | 4.5%(-1.01)#50 | 6.8%(-3.28)#13,426 |
| 51. | Moapa Valley | 3.4% | 4.5%(-1.08)#51 | 6.8%(-3.36)#13,677 |
| 52. | Yerington | 3.4% | 4.5%(-1.10)#52 | 6.8%(-3.37)#13,712 |
| 53. | North Las Vegas | 3.3% | 4.5%(-1.15)#53 | 6.8%(-3.42)#13,890 |
| 54. | Pioche | 3.2% | 4.5%(-1.29)#54 | 6.8%(-3.56)#14,315 |
| 55. | Battle Mountain | 3.2% | 4.5%(-1.29)#55 | 6.8%(-3.56)#14,324 |
| 56. | West Wendover | 3.1% | 4.5%(-1.35)#56 | 6.8%(-3.62)#14,492 |
| 57. | Cold Springs | 3.0% | 4.5%(-1.51)#57 | 6.8%(-3.78)#14,976 |
| 58. | Topaz Lake | 2.9% | 4.5%(-1.64)#58 | 6.8%(-3.91)#15,338 |
| 59. | Dyer | 2.8% | 4.5%(-1.72)#59 | 6.8%(-3.99)#15,579 |
| 60. | Winchester | 2.7% | 4.5%(-1.77)#60 | 6.8%(-4.04)#15,765 |
| 61. | Fernley | 2.7% | 4.5%(-1.80)#61 | 6.8%(-4.07)#15,878 |
| 62. | Whitney | 2.6% | 4.5%(-1.90)#62 | 6.8%(-4.17)#16,195 |
| 63. | Sunrise Manor | 2.3% | 4.5%(-2.22)#63 | 6.8%(-4.49)#17,157 |
| 64. | Verdi | 2.2% | 4.5%(-2.28)#64 | 6.8%(-4.55)#17,372 |
| 65. | Carlin | 1.9% | 4.5%(-2.55)#65 | 6.8%(-4.82)#18,196 |
| 66. | Mesquite | 1.9% | 4.5%(-2.59)#66 | 6.8%(-4.86)#18,299 |
| 67. | Lovelock | 1.9% | 4.5%(-2.61)#67 | 6.8%(-4.88)#18,356 |
| 68. | Fort Mcdermitt | 1.8% | 4.5%(-2.71)#68 | 6.8%(-4.98)#18,649 |
| 69. | Fallon | 1.6% | 4.5%(-2.87)#69 | 6.8%(-5.14)#19,119 |
| 70. | Fish Springs | 1.4% | 4.5%(-3.08)#70 | 6.8%(-5.35)#19,750 |
| 71. | Owyhee | 1.3% | 4.5%(-3.22)#71 | 6.8%(-5.49)#20,151 |
| 72. | Ruhenstroth | 1.2% | 4.5%(-3.33)#72 | 6.8%(-5.60)#20,490 |
| 73. | Laughlin | 1.1% | 4.5%(-3.43)#73 | 6.8%(-5.71)#20,762 |
| 74. | Carter Springs | 0.92% | 4.5%(-3.57)#74 | 6.8%(-5.84)#21,099 |
| 75. | Schurz | 0.65% | 4.5%(-3.84)#75 | 6.8%(-6.12)#21,760 |
1
2Common Questions
What are the Top 10 Cities with the Highest Percentage of Population Employed in Computer, Engineering & Science in Nevada?
Top 10 Cities with the Highest Percentage of Population Employed in Computer, Engineering & Science in Nevada are:
#1
100.0%
#2
22.9%
#3
15.6%
#4
13.0%
#5
11.8%
#6
10.7%
#7
10.4%
#8
9.9%
#9
9.3%
#10
9.2%
What city has the Highest Percentage of Population Employed in Computer, Engineering & Science in Nevada?
Crystal Bay has the Highest Percentage of Population Employed in Computer, Engineering & Science in Nevada with 100.0%.
What is the Percentage of Population Employed in Computer, Engineering & Science in the State of Nevada?
Percentage of Population Employed in Computer, Engineering & Science in Nevada is 4.5%.
What is the Percentage of Population Employed in Computer, Engineering & Science in the United States?
Percentage of Population Employed in Computer, Engineering & Science in the United States is 6.8%.