Cities with the Highest Percentage of Population Employed in Computer, Engineering & Science in North Carolina
RELATED REPORTS & OPTIONS
Computer, Engineering & Science
North Carolina
Compare Cities
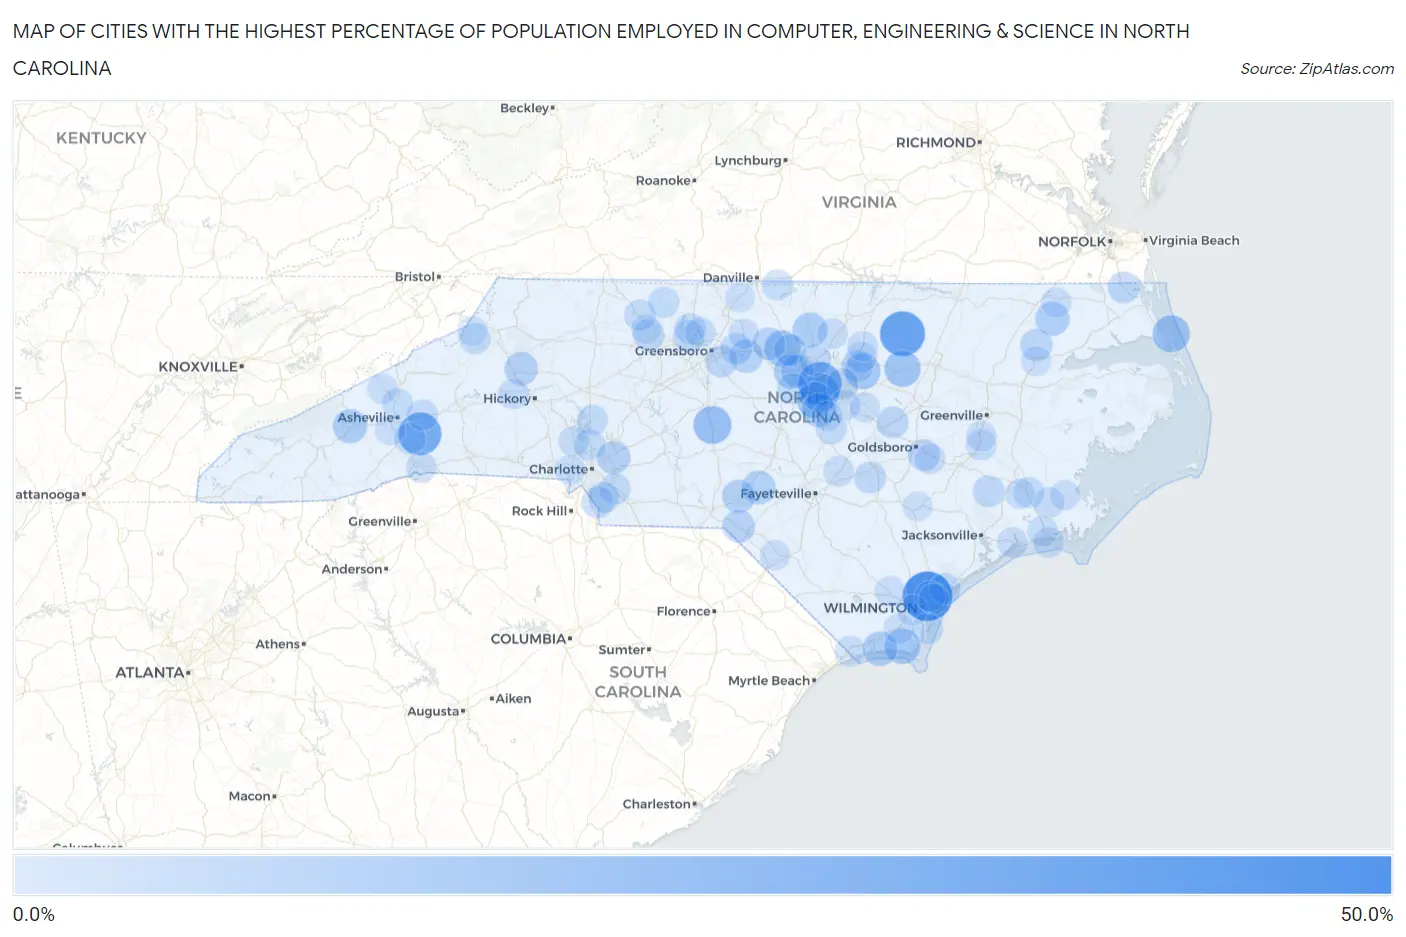
Map of Cities with the Highest Percentage of Population Employed in Computer, Engineering & Science in North Carolina
0.0%
50.0%
Cities with the Highest Percentage of Population Employed in Computer, Engineering & Science in North Carolina
| City | % Employed | vs State | vs National | |
| 1. | Blue Clay Farms | 42.9% | 6.5%(+36.4)#1 | 6.8%(+36.1)#99 |
| 2. | Centerville | 34.5% | 6.5%(+28.0)#2 | 6.8%(+27.8)#156 |
| 3. | Morrisville | 31.3% | 6.5%(+24.8)#3 | 6.8%(+24.6)#195 |
| 4. | Gerton | 30.8% | 6.5%(+24.3)#4 | 6.8%(+24.0)#210 |
| 5. | Cary | 22.5% | 6.5%(+16.0)#5 | 6.8%(+15.8)#423 |
| 6. | Seagrove | 21.8% | 6.5%(+15.3)#6 | 6.8%(+15.0)#459 |
| 7. | Duck | 20.4% | 6.5%(+13.9)#7 | 6.8%(+13.7)#538 |
| 8. | Jackson Springs | 20.4% | 6.5%(+13.9)#8 | 6.8%(+13.6)#539 |
| 9. | Efland | 19.4% | 6.5%(+12.9)#9 | 6.8%(+12.6)#601 |
| 10. | Apex | 19.2% | 6.5%(+12.7)#10 | 6.8%(+12.5)#613 |
| 11. | Spring Hope | 19.1% | 6.5%(+12.6)#11 | 6.8%(+12.3)#624 |
| 12. | Rolesville | 18.3% | 6.5%(+11.8)#12 | 6.8%(+11.6)#699 |
| 13. | St James | 18.0% | 6.5%(+11.5)#13 | 6.8%(+11.3)#727 |
| 14. | Governors | 16.8% | 6.5%(+10.3)#14 | 6.8%(+10.0)#862 |
| 15. | Carrboro | 16.5% | 6.5%(+9.97)#15 | 6.8%(+9.71)#894 |
| 16. | Rougemont | 16.2% | 6.5%(+9.68)#16 | 6.8%(+9.42)#936 |
| 17. | Holden Beach | 15.9% | 6.5%(+9.38)#17 | 6.8%(+9.11)#978 |
| 18. | Lake Junaluska | 15.5% | 6.5%(+8.97)#18 | 6.8%(+8.70)#1,045 |
| 19. | Harrellsville | 15.3% | 6.5%(+8.79)#19 | 6.8%(+8.53)#1,087 |
| 20. | Ashley Heights | 14.8% | 6.5%(+8.29)#20 | 6.8%(+8.03)#1,178 |
| 21. | Holly Springs | 14.6% | 6.5%(+8.07)#21 | 6.8%(+7.80)#1,222 |
| 22. | Cedar Rock | 14.1% | 6.5%(+7.55)#22 | 6.8%(+7.29)#1,321 |
| 23. | Alamance | 13.9% | 6.5%(+7.38)#23 | 6.8%(+7.12)#1,366 |
| 24. | Harrisburg | 13.8% | 6.5%(+7.32)#24 | 6.8%(+7.05)#1,392 |
| 25. | Hoffman | 13.7% | 6.5%(+7.23)#25 | 6.8%(+6.97)#1,412 |
| 26. | Woodlawn | 13.1% | 6.5%(+6.65)#26 | 6.8%(+6.38)#1,590 |
| 27. | Laurel Hill | 13.1% | 6.5%(+6.60)#27 | 6.8%(+6.34)#1,599 |
| 28. | Chapel Hill | 13.1% | 6.5%(+6.59)#28 | 6.8%(+6.32)#1,605 |
| 29. | Askewville | 12.2% | 6.5%(+5.66)#29 | 6.8%(+5.40)#1,905 |
| 30. | Forest Oaks | 11.9% | 6.5%(+5.43)#30 | 6.8%(+5.16)#1,967 |
| 31. | Hillsborough | 11.7% | 6.5%(+5.22)#31 | 6.8%(+4.96)#2,036 |
| 32. | Briar Chapel | 11.7% | 6.5%(+5.18)#32 | 6.8%(+4.92)#2,048 |
| 33. | Micro | 11.6% | 6.5%(+5.10)#33 | 6.8%(+4.84)#2,070 |
| 34. | Elroy | 11.6% | 6.5%(+5.07)#34 | 6.8%(+4.81)#2,080 |
| 35. | Moyock | 11.5% | 6.5%(+4.99)#35 | 6.8%(+4.73)#2,121 |
| 36. | Durham | 11.2% | 6.5%(+4.73)#36 | 6.8%(+4.46)#2,259 |
| 37. | Vann Crossroads | 11.2% | 6.5%(+4.72)#37 | 6.8%(+4.45)#2,264 |
| 38. | Oak Ridge | 11.1% | 6.5%(+4.61)#38 | 6.8%(+4.35)#2,306 |
| 39. | Whitsett | 11.1% | 6.5%(+4.61)#39 | 6.8%(+4.35)#2,309 |
| 40. | Trenton | 11.1% | 6.5%(+4.61)#40 | 6.8%(+4.35)#2,315 |
| 41. | Wake Forest | 11.0% | 6.5%(+4.51)#41 | 6.8%(+4.25)#2,371 |
| 42. | Marvin | 10.9% | 6.5%(+4.41)#42 | 6.8%(+4.15)#2,408 |
| 43. | Raleigh | 10.9% | 6.5%(+4.39)#43 | 6.8%(+4.12)#2,427 |
| 44. | Bethania | 10.9% | 6.5%(+4.35)#44 | 6.8%(+4.09)#2,443 |
| 45. | Hoopers Creek | 10.7% | 6.5%(+4.23)#45 | 6.8%(+3.97)#2,499 |
| 46. | Stokesdale | 10.6% | 6.5%(+4.09)#46 | 6.8%(+3.82)#2,589 |
| 47. | Fearrington Village | 10.5% | 6.5%(+4.02)#47 | 6.8%(+3.75)#2,631 |
| 48. | Lake Park | 10.5% | 6.5%(+4.00)#48 | 6.8%(+3.74)#2,637 |
| 49. | Pinnacle | 10.4% | 6.5%(+3.94)#49 | 6.8%(+3.67)#2,669 |
| 50. | Weddington | 10.4% | 6.5%(+3.91)#50 | 6.8%(+3.64)#2,690 |
| 51. | Angier | 10.4% | 6.5%(+3.88)#51 | 6.8%(+3.62)#2,709 |
| 52. | Hampstead | 10.3% | 6.5%(+3.78)#52 | 6.8%(+3.52)#2,768 |
| 53. | Youngsville | 10.2% | 6.5%(+3.66)#53 | 6.8%(+3.39)#2,846 |
| 54. | Banner Elk | 10.1% | 6.5%(+3.64)#54 | 6.8%(+3.38)#2,856 |
| 55. | Huntersville | 10.1% | 6.5%(+3.58)#55 | 6.8%(+3.32)#2,892 |
| 56. | Black Mountain | 10.1% | 6.5%(+3.56)#56 | 6.8%(+3.30)#2,910 |
| 57. | Sea Breeze | 10.0% | 6.5%(+3.53)#57 | 6.8%(+3.27)#2,926 |
| 58. | Weaverville | 10.0% | 6.5%(+3.50)#58 | 6.8%(+3.24)#2,938 |
| 59. | Milton | 9.8% | 6.5%(+3.34)#59 | 6.8%(+3.07)#3,051 |
| 60. | James City | 9.8% | 6.5%(+3.29)#60 | 6.8%(+3.03)#3,080 |
| 61. | Danbury | 9.8% | 6.5%(+3.29)#61 | 6.8%(+3.03)#3,082 |
| 62. | Mooresville | 9.7% | 6.5%(+3.24)#62 | 6.8%(+2.97)#3,119 |
| 63. | Pine Knoll Shores | 9.7% | 6.5%(+3.19)#63 | 6.8%(+2.92)#3,165 |
| 64. | Grifton | 9.6% | 6.5%(+3.13)#64 | 6.8%(+2.87)#3,209 |
| 65. | Garner | 9.6% | 6.5%(+3.12)#65 | 6.8%(+2.85)#3,218 |
| 66. | Minnesott Beach | 9.6% | 6.5%(+3.12)#66 | 6.8%(+2.85)#3,221 |
| 67. | Carolina Shores | 9.6% | 6.5%(+3.09)#67 | 6.8%(+2.82)#3,246 |
| 68. | Cherry Branch | 9.6% | 6.5%(+3.08)#68 | 6.8%(+2.82)#3,250 |
| 69. | Summerfield | 9.5% | 6.5%(+2.97)#69 | 6.8%(+2.71)#3,331 |
| 70. | Godwin | 9.4% | 6.5%(+2.88)#70 | 6.8%(+2.61)#3,416 |
| 71. | Walnut Creek | 9.3% | 6.5%(+2.83)#71 | 6.8%(+2.56)#3,443 |
| 72. | Swansboro | 9.3% | 6.5%(+2.82)#72 | 6.8%(+2.55)#3,453 |
| 73. | Belville | 9.3% | 6.5%(+2.78)#73 | 6.8%(+2.52)#3,482 |
| 74. | Newport | 9.3% | 6.5%(+2.78)#74 | 6.8%(+2.51)#3,484 |
| 75. | Lowesville | 9.3% | 6.5%(+2.75)#75 | 6.8%(+2.49)#3,510 |
| 76. | Rutherford College | 9.2% | 6.5%(+2.71)#76 | 6.8%(+2.45)#3,537 |
| 77. | Saluda | 9.2% | 6.5%(+2.71)#77 | 6.8%(+2.44)#3,539 |
| 78. | Stem | 9.2% | 6.5%(+2.67)#78 | 6.8%(+2.41)#3,564 |
| 79. | Bolivia | 9.1% | 6.5%(+2.59)#79 | 6.8%(+2.33)#3,635 |
| 80. | Marshall | 9.1% | 6.5%(+2.56)#80 | 6.8%(+2.29)#3,662 |
| 81. | Riegelwood | 9.0% | 6.5%(+2.47)#81 | 6.8%(+2.21)#3,736 |
| 82. | Cypress Landing | 8.9% | 6.5%(+2.40)#82 | 6.8%(+2.14)#3,804 |
| 83. | Oriental | 8.9% | 6.5%(+2.36)#83 | 6.8%(+2.10)#3,846 |
| 84. | Gatesville | 8.8% | 6.5%(+2.35)#84 | 6.8%(+2.08)#3,860 |
| 85. | Altamahaw | 8.8% | 6.5%(+2.27)#85 | 6.8%(+2.00)#3,931 |
| 86. | Bent Creek | 8.7% | 6.5%(+2.24)#86 | 6.8%(+1.98)#3,947 |
| 87. | Franklinton | 8.7% | 6.5%(+2.22)#87 | 6.8%(+1.95)#3,964 |
| 88. | Northchase | 8.7% | 6.5%(+2.16)#88 | 6.8%(+1.89)#4,016 |
| 89. | Clayton | 8.6% | 6.5%(+2.15)#89 | 6.8%(+1.88)#4,027 |
| 90. | Elrod | 8.6% | 6.5%(+2.14)#90 | 6.8%(+1.88)#4,028 |
| 91. | Fuquay Varina | 8.6% | 6.5%(+2.12)#91 | 6.8%(+1.86)#4,041 |
| 92. | Ayden | 8.6% | 6.5%(+2.07)#92 | 6.8%(+1.81)#4,093 |
| 93. | Murraysville | 8.6% | 6.5%(+2.06)#93 | 6.8%(+1.79)#4,120 |
| 94. | Belmont | 8.5% | 6.5%(+2.04)#94 | 6.8%(+1.78)#4,130 |
| 95. | Kenansville | 8.4% | 6.5%(+1.89)#95 | 6.8%(+1.63)#4,281 |
| 96. | Windsor | 8.3% | 6.5%(+1.85)#96 | 6.8%(+1.58)#4,316 |
| 97. | Tobaccoville | 8.3% | 6.5%(+1.80)#97 | 6.8%(+1.54)#4,368 |
| 98. | Brices Creek | 8.3% | 6.5%(+1.80)#98 | 6.8%(+1.53)#4,372 |
| 99. | Ruffin | 8.3% | 6.5%(+1.77)#99 | 6.8%(+1.50)#4,395 |
| 100. | Beech Mountain | 8.2% | 6.5%(+1.75)#100 | 6.8%(+1.48)#4,422 |
Common Questions
What are the Top 10 Cities with the Highest Percentage of Population Employed in Computer, Engineering & Science in North Carolina?
Top 10 Cities with the Highest Percentage of Population Employed in Computer, Engineering & Science in North Carolina are:
#1
42.9%
#2
34.5%
#3
31.3%
#4
30.8%
#5
22.5%
#6
21.8%
#7
20.4%
#8
19.4%
#9
19.2%
#10
19.1%
What city has the Highest Percentage of Population Employed in Computer, Engineering & Science in North Carolina?
Blue Clay Farms has the Highest Percentage of Population Employed in Computer, Engineering & Science in North Carolina with 42.9%.
What is the Percentage of Population Employed in Computer, Engineering & Science in the State of North Carolina?
Percentage of Population Employed in Computer, Engineering & Science in North Carolina is 6.5%.
What is the Percentage of Population Employed in Computer, Engineering & Science in the United States?
Percentage of Population Employed in Computer, Engineering & Science in the United States is 6.8%.