Cities with the Highest Percentage of Population Employed in Computer, Engineering & Science in the United States
RELATED REPORTS & OPTIONS
Computer, Engineering & Science
United States
Compare Cities
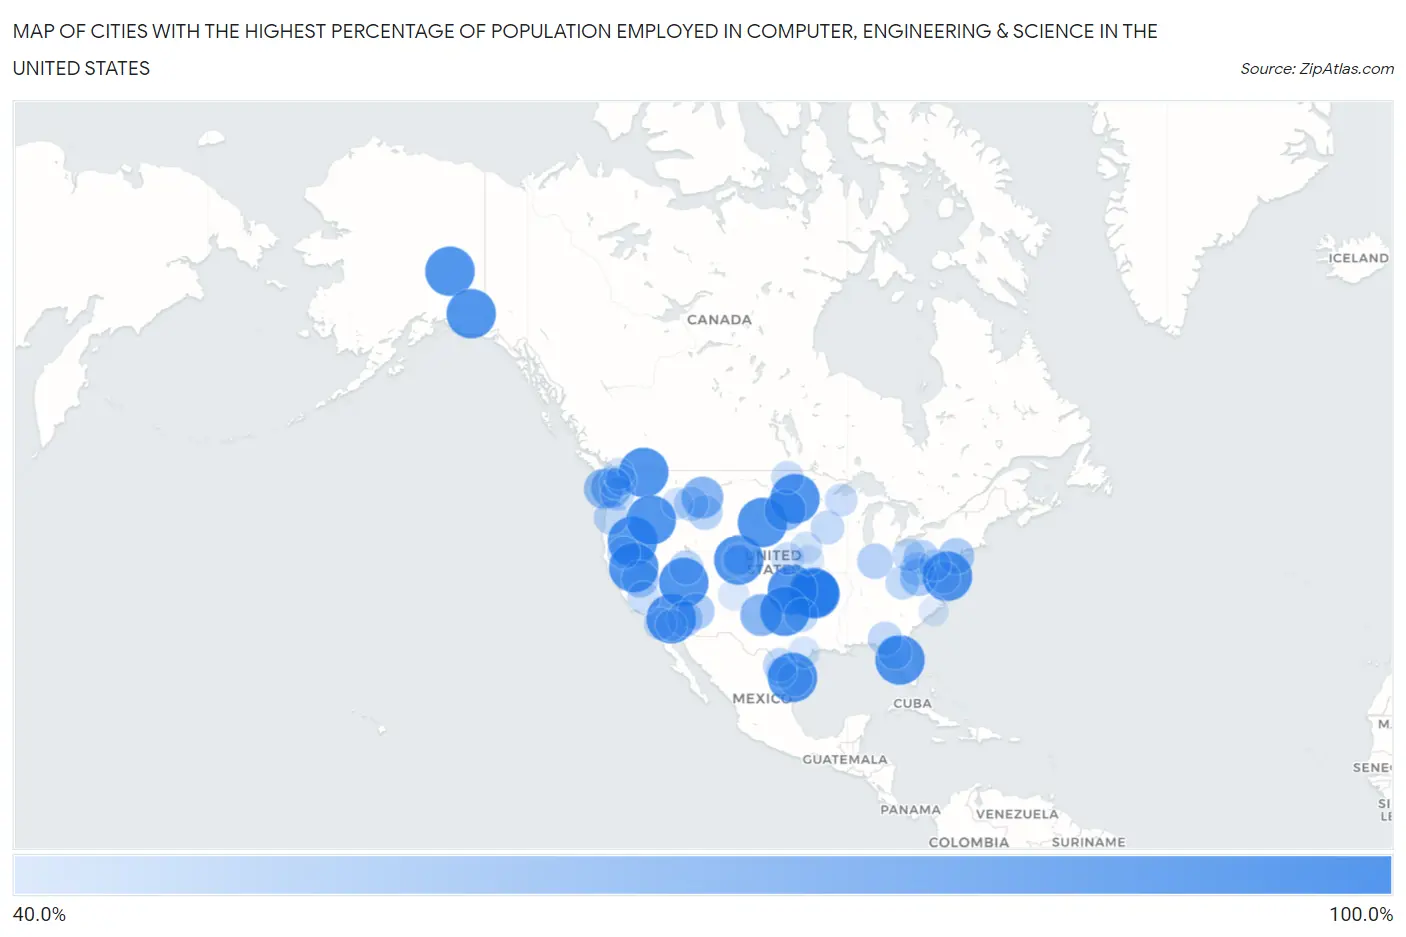
Map of Cities with the Highest Percentage of Population Employed in Computer, Engineering & Science in the United States
0.0%
100.0%
Cities with the Highest Percentage of Population Employed in Computer, Engineering & Science in the United States
| City | % Employed | vs State | vs National | |
| 1. | New Pine Creek | 100.0% | 7.5%(+92.5)#1 | 6.8%(+93.2)#1 |
| 2. | Wheeler | 100.0% | 10.2%(+89.8)#1 | 6.8%(+93.2)#2 |
| 3. | Aripeka | 100.0% | 5.2%(+94.8)#1 | 6.8%(+93.2)#3 |
| 4. | Crystal Bay | 100.0% | 4.5%(+95.5)#1 | 6.8%(+93.2)#4 |
| 5. | Seven Hills | 100.0% | 9.0%(+91.0)#1 | 6.8%(+93.2)#5 |
| 6. | Browntown | 100.0% | 5.3%(+94.7)#1 | 6.8%(+93.2)#6 |
| 7. | Palo Verde | 100.0% | 8.0%(+92.0)#1 | 6.8%(+93.2)#7 |
| 8. | Cottonwood | 100.0% | 4.8%(+95.2)#1 | 6.8%(+93.2)#8 |
| 9. | Yznaga | 100.0% | 6.5%(+93.5)#1 | 6.8%(+93.2)#9 |
| 10. | Goodmanville | 100.0% | 8.0%(+92.0)#2 | 6.8%(+93.2)#10 |
| 11. | Red Banks | 100.0% | 3.5%(+96.5)#1 | 6.8%(+93.2)#11 |
| 12. | Whitestone | 100.0% | 6.3%(+93.7)#1 | 6.8%(+93.2)#12 |
| 13. | White Water | 100.0% | 4.9%(+95.1)#1 | 6.8%(+93.2)#13 |
| 14. | Cherokee City | 100.0% | 4.1%(+95.9)#1 | 6.8%(+93.2)#14 |
| 15. | Beacon View | 100.0% | 5.7%(+94.3)#1 | 6.8%(+93.2)#15 |
| 16. | Malo | 100.0% | 10.2%(+89.8)#2 | 6.8%(+93.2)#16 |
| 17. | Elliott | 100.0% | 10.7%(+89.3)#1 | 6.8%(+93.2)#17 |
| 18. | De Lamere | 100.0% | 4.7%(+95.3)#1 | 6.8%(+93.2)#18 |
| 19. | Sandusky | 100.0% | 5.5%(+94.5)#1 | 6.8%(+93.2)#19 |
| 20. | Cedar Highlands | 100.0% | 7.7%(+92.3)#1 | 6.8%(+93.2)#20 |
| 21. | Brogan | 100.0% | 7.5%(+92.5)#2 | 6.8%(+93.2)#21 |
| 22. | Jefferson | 100.0% | 4.9%(+95.1)#2 | 6.8%(+93.2)#22 |
| 23. | Loveland | 100.0% | 4.9%(+95.1)#3 | 6.8%(+93.2)#23 |
| 24. | Mccarthy | 100.0% | 6.3%(+93.7)#2 | 6.8%(+93.2)#24 |
| 25. | Bolivar | 95.8% | 3.5%(+92.3)#2 | 6.8%(+89.1)#25 |
| 26. | Pinebrook | 83.2% | 6.5%(+76.7)#2 | 6.8%(+76.4)#26 |
| 27. | Furley | 78.6% | 6.0%(+72.6)#1 | 6.8%(+71.8)#27 |
| 28. | Spade | 77.4% | 6.5%(+70.9)#3 | 6.8%(+70.7)#28 |
| 29. | Martinsdale | 76.7% | 5.4%(+71.3)#1 | 6.8%(+69.9)#29 |
| 30. | Chelsea | 75.7% | 4.8%(+70.9)#2 | 6.8%(+68.9)#30 |
| 31. | Hoodsport | 73.0% | 10.2%(+62.8)#3 | 6.8%(+66.2)#31 |
| 32. | Moclips | 70.5% | 10.2%(+60.4)#4 | 6.8%(+63.7)#32 |
| 33. | East Columbia | 69.1% | 6.5%(+62.6)#4 | 6.8%(+62.3)#33 |
| 34. | Lake Cicott | 67.6% | 5.5%(+62.2)#2 | 6.8%(+60.9)#34 |
| 35. | Princeton | 64.2% | 5.7%(+58.5)#2 | 6.8%(+57.4)#35 |
| 36. | Huntersville | 63.6% | 4.4%(+59.2)#1 | 6.8%(+56.9)#36 |
| 37. | Mossville | 63.3% | 6.4%(+56.9)#1 | 6.8%(+56.6)#37 |
| 38. | Mono City | 63.1% | 8.0%(+55.1)#3 | 6.8%(+56.3)#38 |
| 39. | Whispering Pines | 60.9% | 6.8%(+54.1)#1 | 6.8%(+54.1)#39 |
| 40. | Blawenburg | 60.6% | 7.7%(+52.9)#1 | 6.8%(+53.8)#40 |
| 41. | New Market | 59.2% | 5.9%(+53.3)#1 | 6.8%(+52.4)#41 |
| 42. | Wintersburg | 58.6% | 6.8%(+51.8)#2 | 6.8%(+51.8)#42 |
| 43. | North Crows Nest | 58.1% | 5.5%(+52.7)#3 | 6.8%(+51.4)#43 |
| 44. | Harrison City | 57.1% | 6.5%(+50.6)#1 | 6.8%(+50.4)#44 |
| 45. | Ludell | 57.1% | 6.0%(+51.2)#2 | 6.8%(+50.4)#45 |
| 46. | Huntington Center | 57.0% | 6.0%(+51.0)#1 | 6.8%(+50.2)#46 |
| 47. | Silver Gate | 56.9% | 5.4%(+51.5)#2 | 6.8%(+50.1)#47 |
| 48. | Benton | 56.8% | 3.5%(+53.2)#3 | 6.8%(+50.0)#48 |
| 49. | Orason | 56.7% | 6.5%(+50.2)#5 | 6.8%(+49.9)#49 |
| 50. | Peoria | 56.2% | 7.5%(+48.7)#3 | 6.8%(+49.5)#50 |
| 51. | Garten | 55.8% | 4.4%(+51.4)#2 | 6.8%(+49.0)#51 |
| 52. | Cardwell | 55.6% | 5.4%(+50.1)#3 | 6.8%(+48.8)#52 |
| 53. | Oasis | 55.0% | 7.7%(+47.3)#2 | 6.8%(+48.2)#53 |
| 54. | Tall Timber | 54.8% | 9.0%(+45.8)#2 | 6.8%(+48.0)#54 |
| 55. | Alder | 54.5% | 10.2%(+44.4)#5 | 6.8%(+47.8)#55 |
| 56. | Century | 54.2% | 4.4%(+49.7)#3 | 6.8%(+47.4)#56 |
| 57. | Mentor | 53.8% | 6.0%(+47.9)#3 | 6.8%(+47.1)#57 |
| 58. | Boykin | 53.8% | 6.4%(+47.5)#1 | 6.8%(+47.1)#58 |
| 59. | Botines | 53.8% | 6.5%(+47.3)#6 | 6.8%(+47.1)#59 |
| 60. | Belfry | 53.3% | 4.6%(+48.7)#1 | 6.8%(+46.6)#60 |
| 61. | Horseshoe Beach | 53.3% | 5.2%(+48.2)#2 | 6.8%(+46.6)#61 |
| 62. | Toeterville | 53.3% | 5.4%(+47.9)#1 | 6.8%(+46.6)#62 |
| 63. | Platter | 52.9% | 4.9%(+48.0)#4 | 6.8%(+46.2)#63 |
| 64. | Linnsburg | 52.6% | 5.5%(+47.2)#4 | 6.8%(+45.9)#64 |
| 65. | Sandyville | 51.3% | 6.1%(+45.2)#1 | 6.8%(+44.5)#65 |
| 66. | Magnolia Beach | 51.2% | 6.5%(+44.7)#7 | 6.8%(+44.4)#66 |
| 67. | Chimney Point | 51.1% | 7.2%(+43.9)#1 | 6.8%(+44.4)#67 |
| 68. | Tall Timbers | 50.4% | 10.7%(+39.7)#2 | 6.8%(+43.6)#68 |
| 69. | Mount Laguna | 50.0% | 8.0%(+42.0)#4 | 6.8%(+43.2)#69 |
| 70. | Hat Creek | 50.0% | 8.0%(+42.0)#5 | 6.8%(+43.2)#70 |
| 71. | Clam Lake | 50.0% | 6.4%(+43.6)#1 | 6.8%(+43.2)#71 |
| 72. | California Hot Springs | 50.0% | 8.0%(+42.0)#6 | 6.8%(+43.2)#72 |
| 73. | Lawton | 50.0% | 4.7%(+45.3)#2 | 6.8%(+43.2)#73 |
| 74. | Cowles | 50.0% | 5.7%(+44.3)#3 | 6.8%(+43.2)#74 |
| 75. | Richards | 48.8% | 6.5%(+42.3)#8 | 6.8%(+42.0)#75 |
| 76. | Mercersville | 48.2% | 10.7%(+37.5)#3 | 6.8%(+41.4)#76 |
| 77. | Culp | 48.1% | 6.5%(+41.6)#2 | 6.8%(+41.4)#77 |
| 78. | Sula | 47.8% | 5.4%(+42.4)#4 | 6.8%(+41.1)#78 |
| 79. | Acme | 47.8% | 10.2%(+37.6)#6 | 6.8%(+41.0)#79 |
| 80. | Harperville | 47.6% | 3.5%(+44.1)#4 | 6.8%(+40.9)#80 |
| 81. | Drysdale | 47.4% | 6.8%(+40.6)#3 | 6.8%(+40.6)#81 |
| 82. | Weston | 47.4% | 5.4%(+41.9)#2 | 6.8%(+40.6)#82 |
| 83. | Elyria | 46.7% | 6.0%(+40.8)#4 | 6.8%(+40.0)#83 |
| 84. | Hungerford | 46.6% | 6.5%(+40.1)#9 | 6.8%(+39.8)#84 |
| 85. | Las Palmas | 46.2% | 6.5%(+39.7)#10 | 6.8%(+39.4)#85 |
| 86. | Keyport | 46.0% | 10.2%(+35.8)#7 | 6.8%(+39.2)#86 |
| 87. | North Bay | 45.8% | 5.8%(+39.9)#1 | 6.8%(+39.0)#87 |
| 88. | Verlot | 45.7% | 10.2%(+35.6)#8 | 6.8%(+38.9)#88 |
| 89. | Lyons | 45.7% | 6.5%(+39.2)#11 | 6.8%(+38.9)#89 |
| 90. | Canyon Creek | 45.5% | 5.4%(+40.0)#5 | 6.8%(+38.7)#90 |
| 91. | Forsgate | 45.3% | 7.7%(+37.6)#2 | 6.8%(+38.5)#91 |
| 92. | Canova | 44.9% | 6.7%(+38.3)#1 | 6.8%(+38.2)#92 |
| 93. | Winterville | 44.4% | 3.5%(+40.9)#5 | 6.8%(+37.7)#93 |
| 94. | Preston | 44.4% | 5.7%(+38.7)#4 | 6.8%(+37.7)#94 |
| 95. | Green Meadows | 44.4% | 7.5%(+36.8)#4 | 6.8%(+37.6)#95 |
| 96. | Fort Klamath | 43.8% | 7.5%(+36.2)#5 | 6.8%(+37.0)#96 |
| 97. | Topstone | 43.1% | 7.2%(+35.8)#2 | 6.8%(+36.3)#97 |
| 98. | New Boston | 42.9% | 8.3%(+34.6)#1 | 6.8%(+36.1)#98 |
| 99. | Blue Clay Farms | 42.9% | 6.5%(+36.4)#1 | 6.8%(+36.1)#99 |
| 100. | Glendale | 42.9% | 9.0%(+33.9)#3 | 6.8%(+36.1)#100 |
Common Questions
What are the Top 10 Cities with the Highest Percentage of Population Employed in Computer, Engineering & Science in the United States?
Top 10 Cities with the Highest Percentage of Population Employed in Computer, Engineering & Science in the United States are:
#1
100.0%
#2
100.0%
#3
100.0%
#4
100.0%
#5
100.0%
#6
100.0%
#7
100.0%
#8
100.0%
#9
100.0%
#10
100.0%
What city has the Highest Percentage of Population Employed in Computer, Engineering & Science in the United States?
New Pine Creek has the Highest Percentage of Population Employed in Computer, Engineering & Science in the United States with 100.0%.
What is the Percentage of Population Employed in Computer, Engineering & Science in the United States?
Percentage of Population Employed in Computer, Engineering & Science in the United States is 6.8%.