Cities with the Highest Percentage of Population Employed in Computer, Engineering & Science in Kansas
RELATED REPORTS & OPTIONS
Computer, Engineering & Science
Kansas
Compare Cities
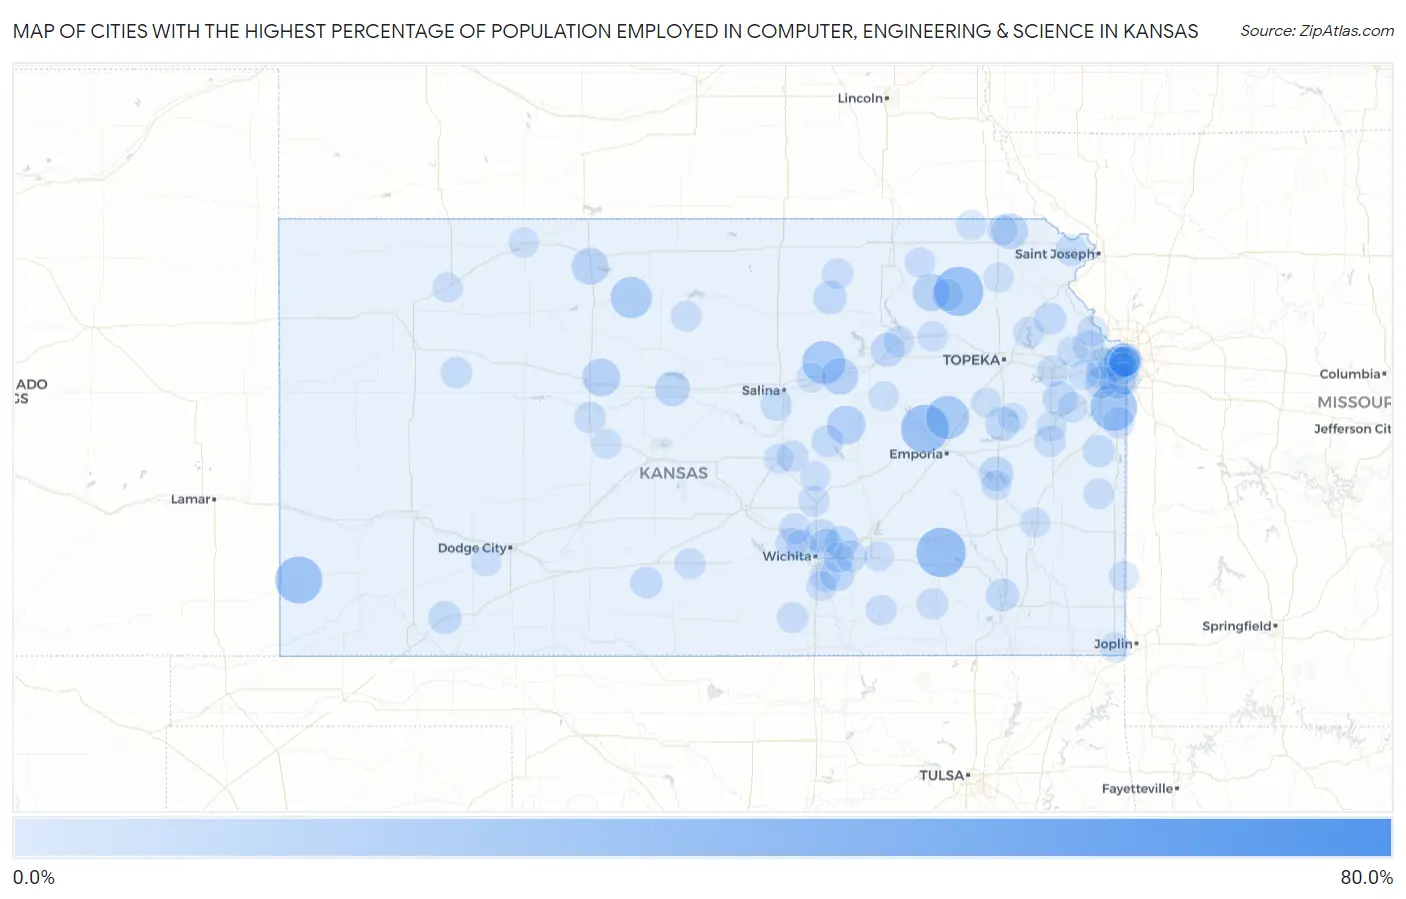
Map of Cities with the Highest Percentage of Population Employed in Computer, Engineering & Science in Kansas
0.0%
80.0%
Cities with the Highest Percentage of Population Employed in Computer, Engineering & Science in Kansas
| City | % Employed | vs State | vs National | |
| 1. | Furley | 78.6% | 6.0%(+72.6)#1 | 6.8%(+71.8)#27 |
| 2. | Ludell | 57.1% | 6.0%(+51.2)#2 | 6.8%(+50.4)#45 |
| 3. | Mentor | 53.8% | 6.0%(+47.9)#3 | 6.8%(+47.1)#57 |
| 4. | Elyria | 46.7% | 6.0%(+40.8)#4 | 6.8%(+40.0)#83 |
| 5. | Climax | 33.3% | 6.0%(+27.4)#5 | 6.8%(+26.6)#167 |
| 6. | Havensville | 33.0% | 6.0%(+27.0)#6 | 6.8%(+26.2)#170 |
| 7. | Dunlap | 31.0% | 6.0%(+25.1)#7 | 6.8%(+24.3)#203 |
| 8. | Manter | 30.0% | 6.0%(+24.0)#8 | 6.8%(+23.2)#220 |
| 9. | Bucyrus | 29.5% | 6.0%(+23.6)#9 | 6.8%(+22.8)#229 |
| 10. | Allen | 24.5% | 6.0%(+18.5)#10 | 6.8%(+17.7)#346 |
| 11. | Talmage | 24.1% | 6.0%(+18.2)#11 | 6.8%(+17.4)#359 |
| 12. | Alton | 21.6% | 6.0%(+15.7)#12 | 6.8%(+14.9)#469 |
| 13. | Ramona | 18.0% | 6.0%(+12.0)#13 | 6.8%(+11.2)#732 |
| 14. | Wabaunsee | 17.4% | 6.0%(+11.4)#14 | 6.8%(+10.6)#788 |
| 15. | Catharine | 16.9% | 6.0%(+10.9)#15 | 6.8%(+10.1)#856 |
| 16. | Wheaton | 16.3% | 6.0%(+10.4)#16 | 6.8%(+9.56)#914 |
| 17. | Glade | 15.6% | 6.0%(+9.66)#17 | 6.8%(+8.86)#1,021 |
| 18. | Detroit | 15.4% | 6.0%(+9.42)#18 | 6.8%(+8.62)#1,059 |
| 19. | Hamlin | 14.3% | 6.0%(+8.32)#19 | 6.8%(+7.52)#1,279 |
| 20. | Westwood Hills | 13.5% | 6.0%(+7.51)#20 | 6.8%(+6.70)#1,491 |
| 21. | Roeland Park | 13.3% | 6.0%(+7.37)#21 | 6.8%(+6.57)#1,530 |
| 22. | Overland Park | 12.8% | 6.0%(+6.85)#22 | 6.8%(+6.05)#1,690 |
| 23. | Merriam | 12.8% | 6.0%(+6.81)#23 | 6.8%(+6.01)#1,704 |
| 24. | Dorrance | 12.7% | 6.0%(+6.78)#24 | 6.8%(+5.98)#1,712 |
| 25. | Lyndon | 12.4% | 6.0%(+6.42)#25 | 6.8%(+5.62)#1,812 |
| 26. | Baldwin City | 12.3% | 6.0%(+6.35)#26 | 6.8%(+5.55)#1,836 |
| 27. | New Strawn | 12.0% | 6.0%(+6.04)#27 | 6.8%(+5.24)#1,937 |
| 28. | Rose Hill | 11.7% | 6.0%(+5.69)#28 | 6.8%(+4.89)#2,056 |
| 29. | Ogden | 11.6% | 6.0%(+5.62)#29 | 6.8%(+4.82)#2,075 |
| 30. | Kechi | 11.5% | 6.0%(+5.51)#30 | 6.8%(+4.71)#2,134 |
| 31. | Morganville | 10.9% | 6.0%(+4.91)#31 | 6.8%(+4.10)#2,434 |
| 32. | Benton | 10.6% | 6.0%(+4.68)#32 | 6.8%(+3.88)#2,551 |
| 33. | Neodesha | 10.3% | 6.0%(+4.38)#33 | 6.8%(+3.57)#2,737 |
| 34. | Plains | 10.3% | 6.0%(+4.35)#34 | 6.8%(+3.55)#2,745 |
| 35. | Lenexa | 10.1% | 6.0%(+4.18)#35 | 6.8%(+3.37)#2,857 |
| 36. | Mission | 9.9% | 6.0%(+3.97)#36 | 6.8%(+3.16)#2,989 |
| 37. | Bel Aire | 9.8% | 6.0%(+3.84)#37 | 6.8%(+3.03)#3,074 |
| 38. | Olathe | 9.7% | 6.0%(+3.70)#38 | 6.8%(+2.90)#3,183 |
| 39. | Westwood | 9.5% | 6.0%(+3.50)#39 | 6.8%(+2.70)#3,339 |
| 40. | Winchester | 9.2% | 6.0%(+3.24)#40 | 6.8%(+2.44)#3,542 |
| 41. | Fontana | 9.1% | 6.0%(+3.13)#41 | 6.8%(+2.33)#3,628 |
| 42. | Coats | 9.1% | 6.0%(+3.13)#42 | 6.8%(+2.33)#3,637 |
| 43. | Durham | 9.1% | 6.0%(+3.13)#43 | 6.8%(+2.33)#3,642 |
| 44. | Onaga | 9.0% | 6.0%(+3.09)#44 | 6.8%(+2.29)#3,667 |
| 45. | Colwich | 8.8% | 6.0%(+2.81)#45 | 6.8%(+2.00)#3,927 |
| 46. | Shawnee | 8.8% | 6.0%(+2.80)#46 | 6.8%(+2.00)#3,937 |
| 47. | Leawood | 8.6% | 6.0%(+2.68)#47 | 6.8%(+1.88)#4,029 |
| 48. | Smolan | 8.6% | 6.0%(+2.64)#48 | 6.8%(+1.84)#4,062 |
| 49. | Prairie Village | 8.6% | 6.0%(+2.60)#49 | 6.8%(+1.80)#4,115 |
| 50. | Basehor | 8.5% | 6.0%(+2.52)#50 | 6.8%(+1.72)#4,196 |
| 51. | Galva | 8.4% | 6.0%(+2.41)#51 | 6.8%(+1.61)#4,292 |
| 52. | Lawrence | 8.3% | 6.0%(+2.30)#52 | 6.8%(+1.50)#4,399 |
| 53. | Troy | 8.1% | 6.0%(+2.17)#53 | 6.8%(+1.37)#4,550 |
| 54. | Gove City | 8.1% | 6.0%(+2.10)#54 | 6.8%(+1.30)#4,614 |
| 55. | Augusta | 8.1% | 6.0%(+2.09)#55 | 6.8%(+1.29)#4,623 |
| 56. | Princeton | 8.0% | 6.0%(+2.07)#56 | 6.8%(+1.27)#4,659 |
| 57. | Liebenthal | 8.0% | 6.0%(+2.04)#57 | 6.8%(+1.24)#4,703 |
| 58. | Louisburg | 7.9% | 6.0%(+1.89)#58 | 6.8%(+1.09)#4,880 |
| 59. | Moline | 7.8% | 6.0%(+1.86)#59 | 6.8%(+1.06)#4,902 |
| 60. | Ozawkie | 7.7% | 6.0%(+1.73)#60 | 6.8%(+0.928)#5,070 |
| 61. | Mayfield | 7.7% | 6.0%(+1.73)#61 | 6.8%(+0.928)#5,088 |
| 62. | Bentley | 7.7% | 6.0%(+1.69)#62 | 6.8%(+0.888)#5,129 |
| 63. | North Newton | 7.6% | 6.0%(+1.68)#63 | 6.8%(+0.873)#5,149 |
| 64. | Palmer | 7.6% | 6.0%(+1.61)#64 | 6.8%(+0.811)#5,213 |
| 65. | Fairway | 7.4% | 6.0%(+1.45)#65 | 6.8%(+0.644)#5,397 |
| 66. | Manhattan | 7.4% | 6.0%(+1.44)#66 | 6.8%(+0.636)#5,411 |
| 67. | Tonganoxie | 7.4% | 6.0%(+1.44)#67 | 6.8%(+0.633)#5,414 |
| 68. | Tipton | 7.2% | 6.0%(+1.28)#68 | 6.8%(+0.482)#5,600 |
| 69. | Maize | 7.1% | 6.0%(+1.14)#69 | 6.8%(+0.340)#5,809 |
| 70. | Cunningham | 7.1% | 6.0%(+1.14)#70 | 6.8%(+0.339)#5,810 |
| 71. | Mound City | 7.0% | 6.0%(+1.08)#71 | 6.8%(+0.273)#5,906 |
| 72. | Derby | 7.0% | 6.0%(+1.03)#72 | 6.8%(+0.226)#5,970 |
| 73. | Burden | 6.9% | 6.0%(+0.964)#73 | 6.8%(+0.162)#6,066 |
| 74. | Lansing | 6.9% | 6.0%(+0.963)#74 | 6.8%(+0.160)#6,068 |
| 75. | Andover | 6.9% | 6.0%(+0.927)#75 | 6.8%(+0.124)#6,126 |
| 76. | Morrill | 6.8% | 6.0%(+0.795)#76 | 6.8%(-0.008)#6,323 |
| 77. | Frankfort | 6.7% | 6.0%(+0.776)#77 | 6.8%(-0.026)#6,348 |
| 78. | Wamego | 6.7% | 6.0%(+0.738)#78 | 6.8%(-0.065)#6,402 |
| 79. | Ensign | 6.7% | 6.0%(+0.705)#79 | 6.8%(-0.098)#6,457 |
| 80. | Bern | 6.7% | 6.0%(+0.705)#80 | 6.8%(-0.098)#6,458 |
| 81. | Timken | 6.7% | 6.0%(+0.705)#81 | 6.8%(-0.098)#6,463 |
| 82. | De Soto | 6.6% | 6.0%(+0.661)#82 | 6.8%(-0.142)#6,509 |
| 83. | Ottawa | 6.6% | 6.0%(+0.658)#83 | 6.8%(-0.145)#6,520 |
| 84. | Wellsville | 6.6% | 6.0%(+0.625)#84 | 6.8%(-0.177)#6,565 |
| 85. | Goessel | 6.5% | 6.0%(+0.516)#85 | 6.8%(-0.287)#6,742 |
| 86. | Mulberry | 6.5% | 6.0%(+0.513)#86 | 6.8%(-0.290)#6,747 |
| 87. | White City | 6.5% | 6.0%(+0.490)#87 | 6.8%(-0.313)#6,779 |
| 88. | Netawaka | 6.5% | 6.0%(+0.490)#88 | 6.8%(-0.313)#6,780 |
| 89. | Burlingame | 6.4% | 6.0%(+0.402)#89 | 6.8%(-0.401)#6,915 |
| 90. | Lowell | 6.3% | 6.0%(+0.387)#90 | 6.8%(-0.416)#6,948 |
| 91. | Norton | 6.3% | 6.0%(+0.327)#91 | 6.8%(-0.476)#7,061 |
| 92. | Burlington | 6.3% | 6.0%(+0.322)#92 | 6.8%(-0.481)#7,071 |
| 93. | Mulvane | 6.3% | 6.0%(+0.319)#93 | 6.8%(-0.484)#7,079 |
| 94. | Iola | 6.3% | 6.0%(+0.304)#94 | 6.8%(-0.499)#7,093 |
| 95. | Mcpherson | 6.3% | 6.0%(+0.295)#95 | 6.8%(-0.508)#7,107 |
| 96. | Leon | 6.2% | 6.0%(+0.224)#96 | 6.8%(-0.579)#7,234 |
| 97. | Selden | 6.2% | 6.0%(+0.218)#97 | 6.8%(-0.585)#7,249 |
| 98. | Mission Woods | 6.2% | 6.0%(+0.211)#98 | 6.8%(-0.592)#7,261 |
| 99. | Vassar | 6.1% | 6.0%(+0.160)#99 | 6.8%(-0.642)#7,346 |
| 100. | Solomon | 6.1% | 6.0%(+0.105)#100 | 6.8%(-0.697)#7,451 |
Common Questions
What are the Top 10 Cities with the Highest Percentage of Population Employed in Computer, Engineering & Science in Kansas?
Top 10 Cities with the Highest Percentage of Population Employed in Computer, Engineering & Science in Kansas are:
What city has the Highest Percentage of Population Employed in Computer, Engineering & Science in Kansas?
Climax has the Highest Percentage of Population Employed in Computer, Engineering & Science in Kansas with 33.3%.
What is the Percentage of Population Employed in Computer, Engineering & Science in the State of Kansas?
Percentage of Population Employed in Computer, Engineering & Science in Kansas is 6.0%.
What is the Percentage of Population Employed in Computer, Engineering & Science in the United States?
Percentage of Population Employed in Computer, Engineering & Science in the United States is 6.8%.