Cities with the Highest Percentage of Population Employed in Computer, Engineering & Science in West Virginia
RELATED REPORTS & OPTIONS
Computer, Engineering & Science
West Virginia
Compare Cities
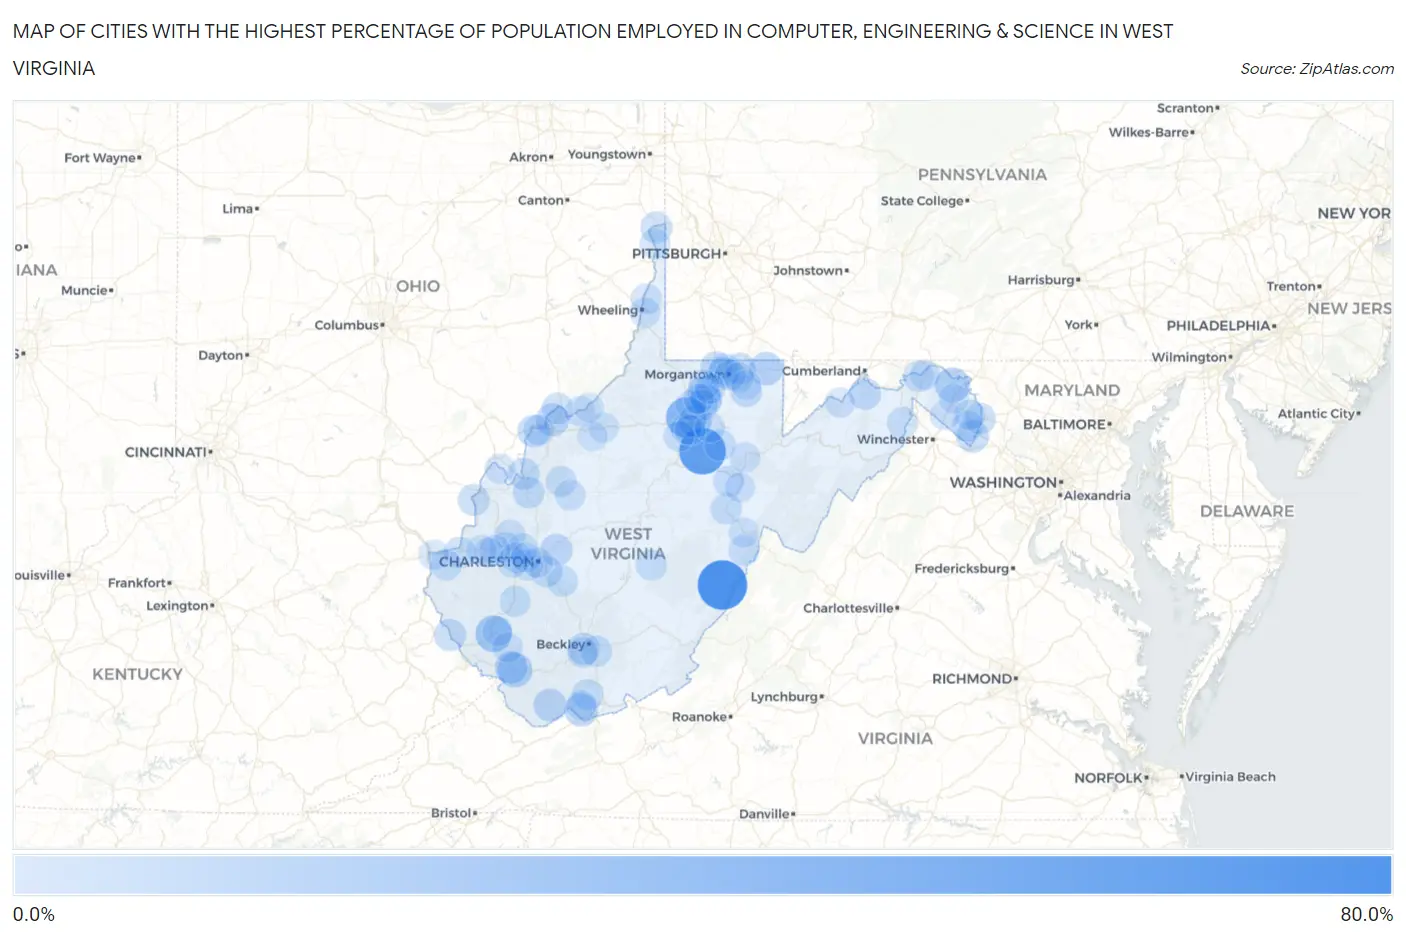
Map of Cities with the Highest Percentage of Population Employed in Computer, Engineering & Science in West Virginia
0.0%
80.0%
Cities with the Highest Percentage of Population Employed in Computer, Engineering & Science in West Virginia
| City | % Employed | vs State | vs National | |
| 1. | Huntersville | 63.6% | 4.4%(+59.2)#1 | 6.8%(+56.9)#36 |
| 2. | Garten | 55.8% | 4.4%(+51.4)#2 | 6.8%(+49.0)#51 |
| 3. | Century | 54.2% | 4.4%(+49.7)#3 | 6.8%(+47.4)#56 |
| 4. | Hepzibah | 35.4% | 4.4%(+31.0)#4 | 6.8%(+28.7)#152 |
| 5. | Mount Gay Shamrock | 22.9% | 4.4%(+18.5)#5 | 6.8%(+16.2)#402 |
| 6. | Hedgesville | 18.1% | 4.4%(+13.7)#6 | 6.8%(+11.4)#717 |
| 7. | Justice | 17.5% | 4.4%(+13.1)#7 | 6.8%(+10.7)#774 |
| 8. | Crooked Creek | 15.1% | 4.4%(+10.7)#8 | 6.8%(+8.35)#1,119 |
| 9. | Brandonville | 13.9% | 4.4%(+9.43)#9 | 6.8%(+7.10)#1,372 |
| 10. | Bridgeport | 13.6% | 4.4%(+9.16)#10 | 6.8%(+6.82)#1,458 |
| 11. | Bluewell | 13.4% | 4.4%(+8.95)#11 | 6.8%(+6.61)#1,524 |
| 12. | Gary | 12.2% | 4.4%(+7.79)#12 | 6.8%(+5.46)#1,874 |
| 13. | North Hills | 12.2% | 4.4%(+7.77)#13 | 6.8%(+5.43)#1,891 |
| 14. | East View | 11.9% | 4.4%(+7.49)#14 | 6.8%(+5.15)#1,974 |
| 15. | Gilbert | 11.6% | 4.4%(+7.20)#15 | 6.8%(+4.86)#2,061 |
| 16. | Shannondale | 11.3% | 4.4%(+6.84)#16 | 6.8%(+4.50)#2,232 |
| 17. | Elkview | 10.9% | 4.4%(+6.45)#17 | 6.8%(+4.12)#2,429 |
| 18. | Barrackville | 10.8% | 4.4%(+6.41)#18 | 6.8%(+4.07)#2,450 |
| 19. | Washington | 10.7% | 4.4%(+6.29)#19 | 6.8%(+3.95)#2,509 |
| 20. | Star City | 10.3% | 4.4%(+5.87)#20 | 6.8%(+3.53)#2,754 |
| 21. | Cassville | 10.1% | 4.4%(+5.65)#21 | 6.8%(+3.31)#2,898 |
| 22. | Crab Orchard | 9.6% | 4.4%(+5.18)#22 | 6.8%(+2.84)#3,227 |
| 23. | Fort Ashby | 9.5% | 4.4%(+5.12)#23 | 6.8%(+2.78)#3,276 |
| 24. | Kermit | 9.5% | 4.4%(+5.10)#24 | 6.8%(+2.76)#3,294 |
| 25. | Gallipolis Ferry | 9.3% | 4.4%(+4.87)#25 | 6.8%(+2.54)#3,463 |
| 26. | Ravenswood | 9.2% | 4.4%(+4.76)#26 | 6.8%(+2.42)#3,557 |
| 27. | Newell | 9.1% | 4.4%(+4.64)#27 | 6.8%(+2.30)#3,657 |
| 28. | Reedsville | 9.0% | 4.4%(+4.53)#28 | 6.8%(+2.20)#3,744 |
| 29. | Rand | 8.9% | 4.4%(+4.51)#29 | 6.8%(+2.17)#3,765 |
| 30. | Williamstown | 8.7% | 4.4%(+4.29)#30 | 6.8%(+1.96)#3,959 |
| 31. | Cheat Lake | 8.7% | 4.4%(+4.27)#31 | 6.8%(+1.94)#3,976 |
| 32. | Ripley | 8.5% | 4.4%(+4.06)#32 | 6.8%(+1.72)#4,189 |
| 33. | Lashmeet | 8.1% | 4.4%(+3.71)#33 | 6.8%(+1.37)#4,546 |
| 34. | Bolivar | 8.0% | 4.4%(+3.61)#34 | 6.8%(+1.28)#4,650 |
| 35. | Daniels | 8.0% | 4.4%(+3.58)#35 | 6.8%(+1.25)#4,685 |
| 36. | Pea Ridge | 8.0% | 4.4%(+3.53)#36 | 6.8%(+1.19)#4,758 |
| 37. | Fairmont | 7.9% | 4.4%(+3.46)#37 | 6.8%(+1.12)#4,840 |
| 38. | Philippi | 7.8% | 4.4%(+3.35)#38 | 6.8%(+1.01)#4,970 |
| 39. | Pleasant Valley | 7.7% | 4.4%(+3.26)#39 | 6.8%(+0.928)#5,065 |
| 40. | Huttonsville | 7.7% | 4.4%(+3.26)#40 | 6.8%(+0.928)#5,079 |
| 41. | Westover | 7.5% | 4.4%(+3.05)#41 | 6.8%(+0.715)#5,321 |
| 42. | Craigsville | 7.3% | 4.4%(+2.87)#42 | 6.8%(+0.535)#5,535 |
| 43. | Charles Town | 7.3% | 4.4%(+2.84)#43 | 6.8%(+0.504)#5,575 |
| 44. | Ranson Corporation | 7.0% | 4.4%(+2.60)#44 | 6.8%(+0.259)#5,922 |
| 45. | White Hall | 7.0% | 4.4%(+2.56)#45 | 6.8%(+0.226)#5,969 |
| 46. | Morgantown | 7.0% | 4.4%(+2.53)#46 | 6.8%(+0.198)#6,006 |
| 47. | South Charleston | 7.0% | 4.4%(+2.53)#47 | 6.8%(+0.190)#6,016 |
| 48. | Great Cacapon | 6.9% | 4.4%(+2.50)#48 | 6.8%(+0.166)#6,054 |
| 49. | Institute | 6.9% | 4.4%(+2.50)#49 | 6.8%(+0.162)#6,065 |
| 50. | Teays Valley | 6.7% | 4.4%(+2.27)#50 | 6.8%(-0.063)#6,399 |
| 51. | Lavalette | 6.7% | 4.4%(+2.24)#51 | 6.8%(-0.098)#6,446 |
| 52. | Danville | 6.6% | 4.4%(+2.16)#52 | 6.8%(-0.171)#6,561 |
| 53. | Womelsdorf Coalton | 6.6% | 4.4%(+2.13)#53 | 6.8%(-0.207)#6,606 |
| 54. | Capon Bridge | 6.6% | 4.4%(+2.12)#54 | 6.8%(-0.214)#6,619 |
| 55. | Tornado | 6.5% | 4.4%(+2.09)#55 | 6.8%(-0.243)#6,668 |
| 56. | Glasgow | 6.5% | 4.4%(+2.08)#56 | 6.8%(-0.251)#6,693 |
| 57. | Winfield | 6.4% | 4.4%(+1.93)#57 | 6.8%(-0.404)#6,927 |
| 58. | Cross Lanes | 6.3% | 4.4%(+1.90)#58 | 6.8%(-0.437)#6,998 |
| 59. | St Albans | 6.3% | 4.4%(+1.86)#59 | 6.8%(-0.471)#7,052 |
| 60. | Sophia | 6.2% | 4.4%(+1.82)#60 | 6.8%(-0.515)#7,114 |
| 61. | Green Bank | 6.2% | 4.4%(+1.82)#61 | 6.8%(-0.515)#7,137 |
| 62. | Blennerhassett | 6.1% | 4.4%(+1.72)#62 | 6.8%(-0.617)#7,308 |
| 63. | Reedy | 6.1% | 4.4%(+1.63)#63 | 6.8%(-0.704)#7,471 |
| 64. | Spencer | 6.0% | 4.4%(+1.57)#64 | 6.8%(-0.765)#7,585 |
| 65. | Clearview | 6.0% | 4.4%(+1.57)#65 | 6.8%(-0.765)#7,590 |
| 66. | Grant Town | 5.9% | 4.4%(+1.45)#66 | 6.8%(-0.882)#7,818 |
| 67. | New Cumberland | 5.8% | 4.4%(+1.41)#67 | 6.8%(-0.927)#7,924 |
| 68. | Nutter Fort | 5.8% | 4.4%(+1.36)#68 | 6.8%(-0.975)#8,005 |
| 69. | Enterprise | 5.8% | 4.4%(+1.35)#69 | 6.8%(-0.983)#8,020 |
| 70. | Charleston | 5.7% | 4.4%(+1.30)#70 | 6.8%(-1.03)#8,125 |
| 71. | Shenandoah Junction | 5.6% | 4.4%(+1.18)#71 | 6.8%(-1.15)#8,319 |
| 72. | Hurricane | 5.5% | 4.4%(+1.04)#72 | 6.8%(-1.29)#8,583 |
| 73. | West Milford | 5.4% | 4.4%(+0.987)#73 | 6.8%(-1.35)#8,702 |
| 74. | Stonewood | 5.4% | 4.4%(+0.943)#74 | 6.8%(-1.39)#8,799 |
| 75. | Ceredo | 5.3% | 4.4%(+0.915)#75 | 6.8%(-1.42)#8,861 |
| 76. | New Haven | 5.1% | 4.4%(+0.677)#76 | 6.8%(-1.66)#9,327 |
| 77. | Bethlehem | 5.1% | 4.4%(+0.675)#77 | 6.8%(-1.66)#9,333 |
| 78. | Montrose | 5.1% | 4.4%(+0.656)#78 | 6.8%(-1.68)#9,376 |
| 79. | Belmont | 5.1% | 4.4%(+0.642)#79 | 6.8%(-1.69)#9,409 |
| 80. | Man | 5.0% | 4.4%(+0.599)#80 | 6.8%(-1.74)#9,500 |
| 81. | Monongah | 4.9% | 4.4%(+0.468)#81 | 6.8%(-1.87)#9,793 |
| 82. | Rivesville | 4.8% | 4.4%(+0.401)#82 | 6.8%(-1.94)#9,948 |
| 83. | Bath Berkeley Springs | 4.8% | 4.4%(+0.333)#83 | 6.8%(-2.00)#10,097 |
| 84. | Keyser | 4.7% | 4.4%(+0.227)#84 | 6.8%(-2.11)#10,340 |
| 85. | Milton | 4.6% | 4.4%(+0.164)#85 | 6.8%(-2.17)#10,480 |
| 86. | Durbin | 4.6% | 4.4%(+0.152)#86 | 6.8%(-2.18)#10,508 |
| 87. | Ellenboro | 4.5% | 4.4%(+0.117)#87 | 6.8%(-2.22)#10,595 |
| 88. | Brookhaven | 4.5% | 4.4%(+0.108)#88 | 6.8%(-2.23)#10,632 |
| 89. | Inwood | 4.5% | 4.4%(+0.078)#89 | 6.8%(-2.26)#10,688 |
| 90. | Dunbar | 4.5% | 4.4%(+0.035)#90 | 6.8%(-2.30)#10,782 |
| 91. | Beverly | 4.3% | 4.4%(-0.104)#91 | 6.8%(-2.44)#11,113 |
| 92. | Flemington | 4.3% | 4.4%(-0.128)#92 | 6.8%(-2.46)#11,174 |
| 93. | Montcalm | 4.3% | 4.4%(-0.148)#93 | 6.8%(-2.48)#11,225 |
| 94. | Culloden | 4.2% | 4.4%(-0.215)#94 | 6.8%(-2.55)#11,415 |
| 95. | Booth | 4.2% | 4.4%(-0.218)#95 | 6.8%(-2.55)#11,421 |
| 96. | Masontown | 4.1% | 4.4%(-0.335)#96 | 6.8%(-2.67)#11,725 |
| 97. | Martinsburg | 4.0% | 4.4%(-0.417)#97 | 6.8%(-2.75)#11,934 |
| 98. | Cairo | 4.0% | 4.4%(-0.429)#98 | 6.8%(-2.76)#11,974 |
| 99. | West Logan | 4.0% | 4.4%(-0.455)#99 | 6.8%(-2.79)#12,044 |
| 100. | St Marys | 3.9% | 4.4%(-0.549)#100 | 6.8%(-2.88)#12,306 |
Common Questions
What are the Top 10 Cities with the Highest Percentage of Population Employed in Computer, Engineering & Science in West Virginia?
Top 10 Cities with the Highest Percentage of Population Employed in Computer, Engineering & Science in West Virginia are:
#1
63.6%
#2
54.2%
#3
35.4%
#4
22.9%
#5
18.1%
#6
17.5%
#7
13.9%
#8
13.6%
#9
13.4%
#10
12.2%
What city has the Highest Percentage of Population Employed in Computer, Engineering & Science in West Virginia?
Huntersville has the Highest Percentage of Population Employed in Computer, Engineering & Science in West Virginia with 63.6%.
What is the Percentage of Population Employed in Computer, Engineering & Science in the State of West Virginia?
Percentage of Population Employed in Computer, Engineering & Science in West Virginia is 4.4%.
What is the Percentage of Population Employed in Computer, Engineering & Science in the United States?
Percentage of Population Employed in Computer, Engineering & Science in the United States is 6.8%.