Cities with the Highest Percentage of Population Employed in Computer, Engineering & Science in Pennsylvania
RELATED REPORTS & OPTIONS
Computer, Engineering & Science
Pennsylvania
Compare Cities
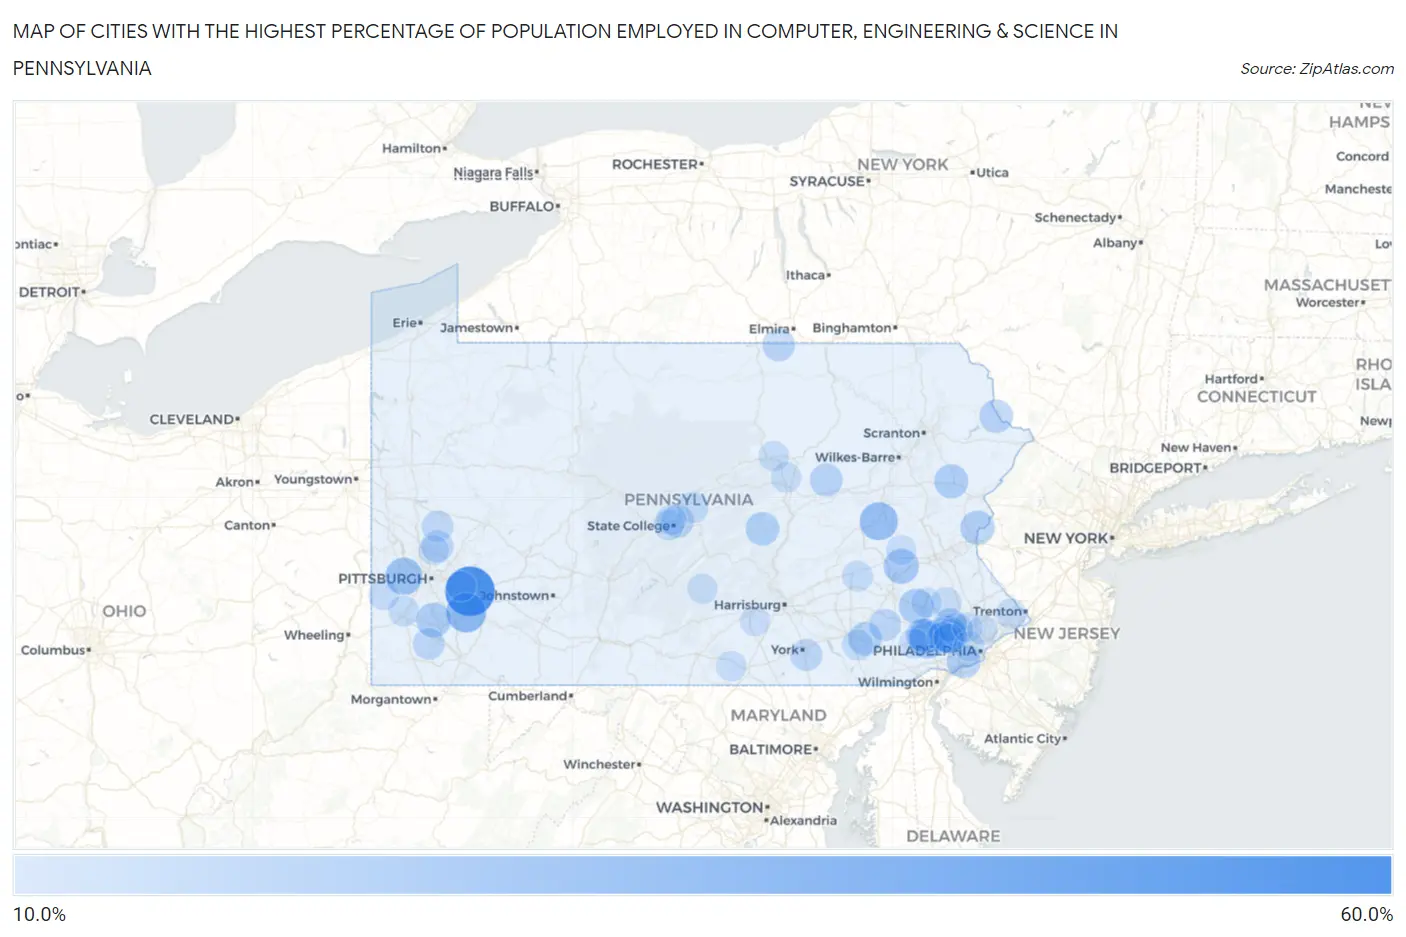
Map of Cities with the Highest Percentage of Population Employed in Computer, Engineering & Science in Pennsylvania
0.0%
60.0%
Cities with the Highest Percentage of Population Employed in Computer, Engineering & Science in Pennsylvania
| City | % Employed | vs State | vs National | |
| 1. | Harrison City | 57.1% | 6.5%(+50.6)#1 | 6.8%(+50.4)#44 |
| 2. | Culp | 48.1% | 6.5%(+41.6)#2 | 6.8%(+41.4)#77 |
| 3. | Fort Fetter | 35.0% | 6.5%(+28.5)#3 | 6.8%(+28.2)#154 |
| 4. | Yukon | 34.4% | 6.5%(+27.8)#4 | 6.8%(+27.6)#159 |
| 5. | Grier City | 30.4% | 6.5%(+23.9)#5 | 6.8%(+23.7)#213 |
| 6. | Curryville | 30.0% | 6.5%(+23.5)#6 | 6.8%(+23.2)#223 |
| 7. | Enlow | 28.3% | 6.5%(+21.7)#7 | 6.8%(+21.5)#255 |
| 8. | Exton | 27.8% | 6.5%(+21.2)#8 | 6.8%(+21.0)#268 |
| 9. | Friesville | 27.3% | 6.5%(+20.7)#9 | 6.8%(+20.5)#278 |
| 10. | Chesterbrook | 26.0% | 6.5%(+19.5)#10 | 6.8%(+19.3)#308 |
| 11. | Virginville | 24.1% | 6.5%(+17.6)#11 | 6.8%(+17.3)#360 |
| 12. | Frazer | 23.2% | 6.5%(+16.6)#12 | 6.8%(+16.4)#387 |
| 13. | Lionville | 23.1% | 6.5%(+16.6)#13 | 6.8%(+16.4)#388 |
| 14. | Van Voorhis | 23.1% | 6.5%(+16.5)#14 | 6.8%(+16.3)#392 |
| 15. | Douglassville | 23.1% | 6.5%(+16.5)#15 | 6.8%(+16.3)#393 |
| 16. | Emerald Lakes | 21.8% | 6.5%(+15.2)#16 | 6.8%(+15.0)#461 |
| 17. | Martins Creek | 21.6% | 6.5%(+15.1)#17 | 6.8%(+14.9)#467 |
| 18. | Alverda | 21.6% | 6.5%(+15.1)#18 | 6.8%(+14.9)#468 |
| 19. | Prospect Park | 21.2% | 6.5%(+14.7)#19 | 6.8%(+14.5)#485 |
| 20. | Devon | 21.0% | 6.5%(+14.4)#20 | 6.8%(+14.2)#507 |
| 21. | Paxtonville | 20.5% | 6.5%(+14.0)#21 | 6.8%(+13.8)#532 |
| 22. | Bird In Hand | 20.3% | 6.5%(+13.8)#22 | 6.8%(+13.6)#540 |
| 23. | King Of Prussia | 20.3% | 6.5%(+13.7)#23 | 6.8%(+13.5)#545 |
| 24. | Masthope | 20.2% | 6.5%(+13.6)#24 | 6.8%(+13.4)#548 |
| 25. | Audubon | 19.9% | 6.5%(+13.3)#25 | 6.8%(+13.1)#559 |
| 26. | Fairview Borough | 19.7% | 6.5%(+13.1)#26 | 6.8%(+12.9)#572 |
| 27. | Eagleview | 19.5% | 6.5%(+13.0)#27 | 6.8%(+12.8)#589 |
| 28. | Eyers Grove | 19.0% | 6.5%(+12.5)#28 | 6.8%(+12.3)#630 |
| 29. | Malvern Borough | 19.0% | 6.5%(+12.5)#29 | 6.8%(+12.3)#633 |
| 30. | Houserville | 18.8% | 6.5%(+12.2)#30 | 6.8%(+12.0)#658 |
| 31. | Jenkintown Borough | 18.7% | 6.5%(+12.1)#31 | 6.8%(+11.9)#666 |
| 32. | Millerton | 18.5% | 6.5%(+11.9)#32 | 6.8%(+11.7)#681 |
| 33. | Wall Borough | 18.3% | 6.5%(+11.8)#33 | 6.8%(+11.5)#700 |
| 34. | Swarthmore Borough | 18.0% | 6.5%(+11.5)#34 | 6.8%(+11.2)#729 |
| 35. | Churchill Borough | 18.0% | 6.5%(+11.5)#35 | 6.8%(+11.2)#730 |
| 36. | Chadds Ford | 17.6% | 6.5%(+11.1)#36 | 6.8%(+10.9)#762 |
| 37. | Glen Campbell Borough | 17.4% | 6.5%(+10.9)#37 | 6.8%(+10.6)#786 |
| 38. | Goodville | 17.3% | 6.5%(+10.8)#38 | 6.8%(+10.6)#793 |
| 39. | Camp Hill Borough | 17.0% | 6.5%(+10.5)#39 | 6.8%(+10.2)#832 |
| 40. | Tyler Run | 16.9% | 6.5%(+10.3)#40 | 6.8%(+10.1)#853 |
| 41. | Bakerstown | 16.9% | 6.5%(+10.3)#41 | 6.8%(+10.1)#855 |
| 42. | North Wales Borough | 16.7% | 6.5%(+10.2)#42 | 6.8%(+9.97)#866 |
| 43. | Fredericktown | 16.7% | 6.5%(+10.1)#43 | 6.8%(+9.90)#872 |
| 44. | Driftwood Borough | 16.7% | 6.5%(+10.1)#44 | 6.8%(+9.90)#878 |
| 45. | Nixon | 16.2% | 6.5%(+9.69)#45 | 6.8%(+9.47)#927 |
| 46. | North Bend | 16.2% | 6.5%(+9.68)#46 | 6.8%(+9.45)#930 |
| 47. | Blawnox Borough | 16.1% | 6.5%(+9.52)#47 | 6.8%(+9.29)#953 |
| 48. | Oswayo Borough | 16.0% | 6.5%(+9.46)#48 | 6.8%(+9.24)#962 |
| 49. | Paoli | 15.9% | 6.5%(+9.40)#49 | 6.8%(+9.18)#965 |
| 50. | Zion | 15.8% | 6.5%(+9.22)#50 | 6.8%(+9.00)#994 |
| 51. | Juniata Gap | 15.7% | 6.5%(+9.16)#51 | 6.8%(+8.93)#1,005 |
| 52. | Clintondale | 15.4% | 6.5%(+8.84)#52 | 6.8%(+8.62)#1,060 |
| 53. | New Buffalo Borough | 15.4% | 6.5%(+8.84)#53 | 6.8%(+8.62)#1,061 |
| 54. | Franklintown Borough | 15.3% | 6.5%(+8.79)#54 | 6.8%(+8.56)#1,082 |
| 55. | Eagleville Cdp Centre County | 15.2% | 6.5%(+8.69)#55 | 6.8%(+8.47)#1,096 |
| 56. | Sadsburyville | 15.1% | 6.5%(+8.52)#56 | 6.8%(+8.29)#1,127 |
| 57. | Ulysses Borough | 15.0% | 6.5%(+8.42)#57 | 6.8%(+8.20)#1,146 |
| 58. | Rehrersburg | 15.0% | 6.5%(+8.42)#58 | 6.8%(+8.20)#1,147 |
| 59. | Liberty Borough Allegheny County | 14.8% | 6.5%(+8.27)#59 | 6.8%(+8.05)#1,171 |
| 60. | Lampeter | 14.7% | 6.5%(+8.17)#60 | 6.8%(+7.94)#1,193 |
| 61. | Little Meadows Borough | 14.6% | 6.5%(+8.02)#61 | 6.8%(+7.80)#1,223 |
| 62. | Phoenixville Borough | 14.5% | 6.5%(+8.01)#62 | 6.8%(+7.78)#1,227 |
| 63. | Meadowlands | 14.5% | 6.5%(+8.01)#63 | 6.8%(+7.78)#1,228 |
| 64. | Park Forest Village | 14.5% | 6.5%(+7.97)#64 | 6.8%(+7.75)#1,233 |
| 65. | Valencia Borough | 14.5% | 6.5%(+7.94)#65 | 6.8%(+7.72)#1,240 |
| 66. | Woodbourne | 14.1% | 6.5%(+7.60)#66 | 6.8%(+7.37)#1,302 |
| 67. | Ben Avon Borough | 14.0% | 6.5%(+7.48)#67 | 6.8%(+7.26)#1,329 |
| 68. | Holters Crossing | 13.9% | 6.5%(+7.38)#68 | 6.8%(+7.16)#1,353 |
| 69. | Cross Creek | 13.9% | 6.5%(+7.37)#69 | 6.8%(+7.15)#1,356 |
| 70. | Dewart | 13.9% | 6.5%(+7.35)#70 | 6.8%(+7.12)#1,360 |
| 71. | Berwyn | 13.9% | 6.5%(+7.35)#71 | 6.8%(+7.12)#1,363 |
| 72. | St. Davids | 13.8% | 6.5%(+7.29)#72 | 6.8%(+7.06)#1,388 |
| 73. | Faxon | 13.8% | 6.5%(+7.22)#73 | 6.8%(+6.99)#1,406 |
| 74. | Spring Mount | 13.8% | 6.5%(+7.21)#74 | 6.8%(+6.99)#1,408 |
| 75. | Morea | 13.7% | 6.5%(+7.19)#75 | 6.8%(+6.96)#1,416 |
| 76. | Orrtanna | 13.6% | 6.5%(+7.10)#76 | 6.8%(+6.87)#1,445 |
| 77. | Toftrees | 13.6% | 6.5%(+7.08)#77 | 6.8%(+6.86)#1,449 |
| 78. | Shippensburg Borough | 13.6% | 6.5%(+7.05)#78 | 6.8%(+6.83)#1,457 |
| 79. | East Waterford | 13.6% | 6.5%(+7.02)#79 | 6.8%(+6.79)#1,467 |
| 80. | Gibsonia | 13.5% | 6.5%(+7.01)#80 | 6.8%(+6.79)#1,469 |
| 81. | Chalfont Borough | 13.5% | 6.5%(+6.96)#81 | 6.8%(+6.73)#1,479 |
| 82. | Glenmoore | 13.5% | 6.5%(+6.96)#82 | 6.8%(+6.73)#1,482 |
| 83. | Emsworth Borough | 13.5% | 6.5%(+6.92)#83 | 6.8%(+6.70)#1,493 |
| 84. | Halfway House | 13.3% | 6.5%(+6.79)#84 | 6.8%(+6.57)#1,543 |
| 85. | Thorndale | 13.3% | 6.5%(+6.71)#85 | 6.8%(+6.49)#1,563 |
| 86. | Level Green | 13.2% | 6.5%(+6.68)#86 | 6.8%(+6.46)#1,569 |
| 87. | Penn Wynne | 13.2% | 6.5%(+6.67)#87 | 6.8%(+6.44)#1,571 |
| 88. | Plymouth Meeting | 13.2% | 6.5%(+6.64)#88 | 6.8%(+6.42)#1,579 |
| 89. | Kempton | 13.1% | 6.5%(+6.56)#89 | 6.8%(+6.33)#1,603 |
| 90. | Athens Borough | 13.1% | 6.5%(+6.55)#90 | 6.8%(+6.32)#1,606 |
| 91. | Franklin Park Borough | 13.0% | 6.5%(+6.51)#91 | 6.8%(+6.28)#1,614 |
| 92. | Boiling Springs | 12.9% | 6.5%(+6.41)#92 | 6.8%(+6.18)#1,642 |
| 93. | Wyncote | 12.9% | 6.5%(+6.40)#93 | 6.8%(+6.18)#1,644 |
| 94. | Avalon Borough | 12.9% | 6.5%(+6.40)#94 | 6.8%(+6.18)#1,647 |
| 95. | Pennsbury Village Borough | 12.9% | 6.5%(+6.37)#95 | 6.8%(+6.15)#1,659 |
| 96. | Conshohocken Borough | 12.8% | 6.5%(+6.30)#96 | 6.8%(+6.08)#1,681 |
| 97. | Edgewood Borough | 12.7% | 6.5%(+6.14)#97 | 6.8%(+5.91)#1,733 |
| 98. | Connoquenessing Borough | 12.5% | 6.5%(+5.96)#98 | 6.8%(+5.74)#1,767 |
| 99. | Kimberton | 12.5% | 6.5%(+5.96)#99 | 6.8%(+5.74)#1,768 |
| 100. | Narberth Borough | 12.5% | 6.5%(+5.95)#100 | 6.8%(+5.73)#1,778 |
Common Questions
What are the Top 10 Cities with the Highest Percentage of Population Employed in Computer, Engineering & Science in Pennsylvania?
Top 10 Cities with the Highest Percentage of Population Employed in Computer, Engineering & Science in Pennsylvania are:
#1
57.1%
#2
34.4%
#3
30.4%
#4
28.3%
#5
27.8%
#6
26.0%
#7
24.1%
#8
23.1%
#9
23.1%
#10
23.1%
What city has the Highest Percentage of Population Employed in Computer, Engineering & Science in Pennsylvania?
Harrison City has the Highest Percentage of Population Employed in Computer, Engineering & Science in Pennsylvania with 57.1%.
What is the Percentage of Population Employed in Computer, Engineering & Science in the State of Pennsylvania?
Percentage of Population Employed in Computer, Engineering & Science in Pennsylvania is 6.5%.
What is the Percentage of Population Employed in Computer, Engineering & Science in the United States?
Percentage of Population Employed in Computer, Engineering & Science in the United States is 6.8%.