Cities with the Highest Percentage of Population Employed in Computer, Engineering & Science in Texas
RELATED REPORTS & OPTIONS
Computer, Engineering & Science
Texas
Compare Cities
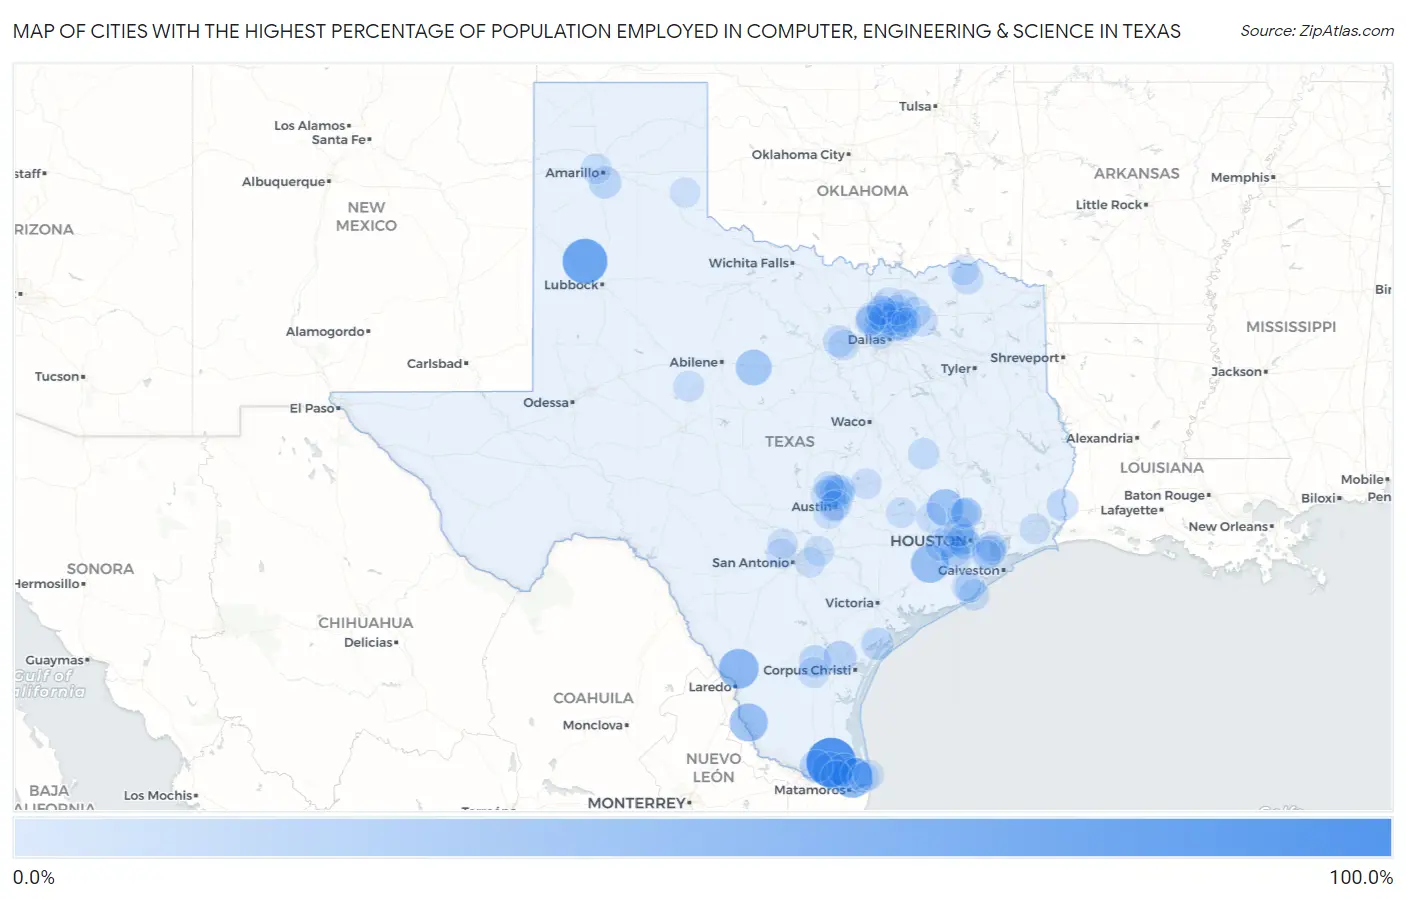
Map of Cities with the Highest Percentage of Population Employed in Computer, Engineering & Science in Texas
0.0%
100.0%
Cities with the Highest Percentage of Population Employed in Computer, Engineering & Science in Texas
| City | % Employed | vs State | vs National | |
| 1. | Yznaga | 100.0% | 6.5%(+93.5)#1 | 6.8%(+93.2)#9 |
| 2. | Pinebrook | 83.2% | 6.5%(+76.7)#2 | 6.8%(+76.4)#26 |
| 3. | Spade | 77.4% | 6.5%(+70.9)#3 | 6.8%(+70.7)#28 |
| 4. | East Columbia | 69.1% | 6.5%(+62.6)#4 | 6.8%(+62.3)#33 |
| 5. | Orason | 56.7% | 6.5%(+50.2)#5 | 6.8%(+49.9)#49 |
| 6. | Botines | 53.8% | 6.5%(+47.3)#6 | 6.8%(+47.1)#59 |
| 7. | Magnolia Beach | 51.2% | 6.5%(+44.7)#7 | 6.8%(+44.4)#66 |
| 8. | Richards | 48.8% | 6.5%(+42.3)#8 | 6.8%(+42.0)#75 |
| 9. | Hungerford | 46.6% | 6.5%(+40.1)#9 | 6.8%(+39.8)#84 |
| 10. | Las Palmas | 46.2% | 6.5%(+39.7)#10 | 6.8%(+39.4)#85 |
| 11. | Lyons | 45.7% | 6.5%(+39.2)#11 | 6.8%(+38.9)#89 |
| 12. | Todd Mission | 40.7% | 6.5%(+34.2)#12 | 6.8%(+34.0)#109 |
| 13. | Ratamosa | 36.7% | 6.5%(+30.2)#13 | 6.8%(+29.9)#138 |
| 14. | Putnam | 36.4% | 6.5%(+29.9)#14 | 6.8%(+29.6)#141 |
| 15. | Ben Arnold | 27.3% | 6.5%(+20.8)#15 | 6.8%(+20.5)#280 |
| 16. | Edroy | 24.6% | 6.5%(+18.1)#16 | 6.8%(+17.8)#343 |
| 17. | Arroyo Colorado Estates | 24.3% | 6.5%(+17.8)#17 | 6.8%(+17.6)#349 |
| 18. | Muniz | 22.5% | 6.5%(+16.0)#18 | 6.8%(+15.7)#426 |
| 19. | Palisades | 21.2% | 6.5%(+14.7)#19 | 6.8%(+14.5)#486 |
| 20. | Praesel | 21.0% | 6.5%(+14.5)#20 | 6.8%(+14.2)#509 |
| 21. | Holiday Beach | 20.9% | 6.5%(+14.4)#21 | 6.8%(+14.2)#512 |
| 22. | Taylor Lake Village | 20.7% | 6.5%(+14.2)#22 | 6.8%(+13.9)#526 |
| 23. | Brushy Creek | 20.5% | 6.5%(+14.0)#23 | 6.8%(+13.8)#533 |
| 24. | Fulshear | 19.9% | 6.5%(+13.4)#24 | 6.8%(+13.1)#557 |
| 25. | Amargosa | 19.7% | 6.5%(+13.2)#25 | 6.8%(+13.0)#571 |
| 26. | Murphy | 18.7% | 6.5%(+12.2)#26 | 6.8%(+12.0)#661 |
| 27. | Cinco Ranch | 18.7% | 6.5%(+12.2)#27 | 6.8%(+11.9)#663 |
| 28. | Hudson Oaks | 18.1% | 6.5%(+11.6)#28 | 6.8%(+11.3)#719 |
| 29. | Deweyville | 18.0% | 6.5%(+11.5)#29 | 6.8%(+11.3)#725 |
| 30. | Mcleod | 17.8% | 6.5%(+11.3)#30 | 6.8%(+11.0)#746 |
| 31. | Hebron | 17.7% | 6.5%(+11.2)#31 | 6.8%(+11.0)#754 |
| 32. | Wells Branch | 17.4% | 6.5%(+10.9)#32 | 6.8%(+10.7)#783 |
| 33. | Bayview | 17.3% | 6.5%(+10.8)#33 | 6.8%(+10.6)#795 |
| 34. | Cedar Park | 17.1% | 6.5%(+10.6)#34 | 6.8%(+10.3)#820 |
| 35. | Rangerville | 17.0% | 6.5%(+10.5)#35 | 6.8%(+10.2)#834 |
| 36. | Bunker Hill Village | 16.9% | 6.5%(+10.4)#36 | 6.8%(+10.1)#844 |
| 37. | Frisco | 16.7% | 6.5%(+10.2)#37 | 6.8%(+9.89)#881 |
| 38. | Oak Ridge North | 16.4% | 6.5%(+9.92)#38 | 6.8%(+9.65)#902 |
| 39. | Farmersville | 16.4% | 6.5%(+9.88)#39 | 6.8%(+9.62)#909 |
| 40. | Hilltop Lakes | 16.2% | 6.5%(+9.72)#40 | 6.8%(+9.46)#928 |
| 41. | Melissa | 16.2% | 6.5%(+9.70)#41 | 6.8%(+9.43)#933 |
| 42. | Sun Valley | 15.9% | 6.5%(+9.41)#42 | 6.8%(+9.14)#973 |
| 43. | Belterra | 15.9% | 6.5%(+9.37)#43 | 6.8%(+9.11)#979 |
| 44. | Bellaire | 15.5% | 6.5%(+8.99)#44 | 6.8%(+8.72)#1,037 |
| 45. | Coppell | 15.4% | 6.5%(+8.94)#45 | 6.8%(+8.68)#1,048 |
| 46. | Plano | 15.3% | 6.5%(+8.83)#46 | 6.8%(+8.57)#1,078 |
| 47. | Hilshire Village | 15.2% | 6.5%(+8.68)#47 | 6.8%(+8.42)#1,102 |
| 48. | Quintana | 15.2% | 6.5%(+8.65)#48 | 6.8%(+8.39)#1,112 |
| 49. | Coyote Acres | 15.0% | 6.5%(+8.46)#49 | 6.8%(+8.20)#1,145 |
| 50. | Blackwell | 14.7% | 6.5%(+8.21)#50 | 6.8%(+7.94)#1,195 |
| 51. | Allen | 14.1% | 6.5%(+7.60)#51 | 6.8%(+7.33)#1,310 |
| 52. | Thompsons | 14.1% | 6.5%(+7.59)#52 | 6.8%(+7.33)#1,312 |
| 53. | Sachse | 14.0% | 6.5%(+7.54)#53 | 6.8%(+7.27)#1,324 |
| 54. | Aledo | 14.0% | 6.5%(+7.49)#54 | 6.8%(+7.23)#1,340 |
| 55. | Lantana | 13.9% | 6.5%(+7.37)#55 | 6.8%(+7.10)#1,368 |
| 56. | Sugar Land | 13.9% | 6.5%(+7.36)#56 | 6.8%(+7.10)#1,371 |
| 57. | Bishop Hills | 13.8% | 6.5%(+7.29)#57 | 6.8%(+7.03)#1,399 |
| 58. | Round Rock | 13.8% | 6.5%(+7.26)#58 | 6.8%(+6.99)#1,407 |
| 59. | Burton | 13.7% | 6.5%(+7.24)#59 | 6.8%(+6.98)#1,410 |
| 60. | Irving | 13.7% | 6.5%(+7.16)#60 | 6.8%(+6.90)#1,432 |
| 61. | Lakewood Village | 13.6% | 6.5%(+7.14)#61 | 6.8%(+6.87)#1,437 |
| 62. | Lucas | 13.6% | 6.5%(+7.12)#62 | 6.8%(+6.86)#1,448 |
| 63. | Volente | 13.6% | 6.5%(+7.06)#63 | 6.8%(+6.79)#1,466 |
| 64. | Jersey Village | 13.5% | 6.5%(+7.03)#64 | 6.8%(+6.77)#1,472 |
| 65. | Fannett | 13.5% | 6.5%(+6.95)#65 | 6.8%(+6.69)#1,500 |
| 66. | Austin | 13.4% | 6.5%(+6.88)#66 | 6.8%(+6.62)#1,521 |
| 67. | Little Elm | 13.3% | 6.5%(+6.79)#67 | 6.8%(+6.53)#1,553 |
| 68. | Morgan S Point | 13.3% | 6.5%(+6.76)#68 | 6.8%(+6.50)#1,558 |
| 69. | Thorndale | 13.2% | 6.5%(+6.72)#69 | 6.8%(+6.45)#1,570 |
| 70. | Mound | 13.2% | 6.5%(+6.68)#70 | 6.8%(+6.41)#1,580 |
| 71. | Rollingwood | 13.0% | 6.5%(+6.53)#71 | 6.8%(+6.27)#1,622 |
| 72. | Shoreacres | 13.0% | 6.5%(+6.49)#72 | 6.8%(+6.23)#1,632 |
| 73. | Laguna Heights | 12.9% | 6.5%(+6.42)#73 | 6.8%(+6.16)#1,652 |
| 74. | Steiner Ranch | 12.9% | 6.5%(+6.42)#74 | 6.8%(+6.16)#1,654 |
| 75. | Caddo Mills | 12.8% | 6.5%(+6.31)#75 | 6.8%(+6.05)#1,691 |
| 76. | The Woodlands | 12.8% | 6.5%(+6.30)#76 | 6.8%(+6.04)#1,693 |
| 77. | South Padre Island | 12.7% | 6.5%(+6.22)#77 | 6.8%(+5.95)#1,721 |
| 78. | Helotes | 12.7% | 6.5%(+6.22)#78 | 6.8%(+5.95)#1,722 |
| 79. | St Hedwig | 12.7% | 6.5%(+6.18)#79 | 6.8%(+5.91)#1,732 |
| 80. | Flower Mound | 12.4% | 6.5%(+5.91)#80 | 6.8%(+5.65)#1,807 |
| 81. | The Colony | 12.4% | 6.5%(+5.88)#81 | 6.8%(+5.62)#1,811 |
| 82. | Shady Hollow | 12.3% | 6.5%(+5.79)#82 | 6.8%(+5.52)#1,847 |
| 83. | Powderly | 12.3% | 6.5%(+5.77)#83 | 6.8%(+5.51)#1,851 |
| 84. | Hempstead | 12.3% | 6.5%(+5.75)#84 | 6.8%(+5.49)#1,855 |
| 85. | Mcqueeney | 12.2% | 6.5%(+5.73)#85 | 6.8%(+5.47)#1,863 |
| 86. | Celina | 12.2% | 6.5%(+5.70)#86 | 6.8%(+5.44)#1,888 |
| 87. | Leander | 12.1% | 6.5%(+5.55)#87 | 6.8%(+5.29)#1,924 |
| 88. | Nassau Bay | 11.6% | 6.5%(+5.11)#88 | 6.8%(+4.84)#2,067 |
| 89. | Richardson | 11.5% | 6.5%(+5.05)#89 | 6.8%(+4.78)#2,095 |
| 90. | Hamshire | 11.5% | 6.5%(+5.00)#90 | 6.8%(+4.74)#2,112 |
| 91. | Mckinney | 11.4% | 6.5%(+4.89)#91 | 6.8%(+4.63)#2,166 |
| 92. | Paloma Creek South | 11.4% | 6.5%(+4.88)#92 | 6.8%(+4.62)#2,178 |
| 93. | Seis Lagos | 11.4% | 6.5%(+4.87)#93 | 6.8%(+4.61)#2,184 |
| 94. | Scenic Oaks | 11.4% | 6.5%(+4.86)#94 | 6.8%(+4.59)#2,195 |
| 95. | Shenandoah | 11.3% | 6.5%(+4.80)#95 | 6.8%(+4.54)#2,218 |
| 96. | Clute | 11.2% | 6.5%(+4.67)#96 | 6.8%(+4.41)#2,280 |
| 97. | Wylie | 11.2% | 6.5%(+4.66)#97 | 6.8%(+4.40)#2,288 |
| 98. | Quail | 11.1% | 6.5%(+4.61)#98 | 6.8%(+4.35)#2,326 |
| 99. | Double Oak | 11.1% | 6.5%(+4.59)#99 | 6.8%(+4.33)#2,330 |
| 100. | Lake Jackson | 11.1% | 6.5%(+4.59)#100 | 6.8%(+4.32)#2,335 |
Common Questions
What are the Top 10 Cities with the Highest Percentage of Population Employed in Computer, Engineering & Science in Texas?
Top 10 Cities with the Highest Percentage of Population Employed in Computer, Engineering & Science in Texas are:
#1
100.0%
#2
77.4%
#3
56.7%
#4
53.8%
#5
46.6%
#6
46.2%
#7
40.7%
#8
36.7%
#9
36.4%
#10
24.6%
What city has the Highest Percentage of Population Employed in Computer, Engineering & Science in Texas?
Yznaga has the Highest Percentage of Population Employed in Computer, Engineering & Science in Texas with 100.0%.
What is the Percentage of Population Employed in Computer, Engineering & Science in the State of Texas?
Percentage of Population Employed in Computer, Engineering & Science in Texas is 6.5%.
What is the Percentage of Population Employed in Computer, Engineering & Science in the United States?
Percentage of Population Employed in Computer, Engineering & Science in the United States is 6.8%.