Spaulding, CA Map & Demographics
Spaulding Map
Spaulding Overview
$32,011
PER CAPITA INCOME
$23,378
AVG HOUSEHOLD INCOME
0.66
INEQUALITY / GINI INDEX
233
TOTAL POPULATION
155
MALE POPULATION
78
FEMALE POPULATION
198.72
MALES / 100 FEMALES
50.32
FEMALES / 100 MALES
66.4
MEDIAN AGE
2.5
AVG FAMILY SIZE
1.6
AVG HOUSEHOLD SIZE
98
LABOR FORCE [ PEOPLE ]
42.1%
PERCENT IN LABOR FORCE
43.9%
UNEMPLOYMENT RATE
Income in Spaulding
Income Overview in Spaulding
| Characteristic | Number | Measure |
| Per Capita Income | 233 | $32,011 |
| Median Family Income | 48 | $0 |
| Mean Family Income | 48 | $30,108 |
| Median Household Income | 145 | $23,378 |
| Mean Household Income | 145 | $50,277 |
| Income Deficit | 48 | $0 |
| Wage / Income Gap (%) | 233 | 0.00% |
| Wage / Income Gap ($) | 233 | 100.00¢ per $1 |
| Gini / Inequality Index | 233 | 0.66 |
Earnings by Sex in Spaulding
| Sex | Number | Average Earnings |
| Male | 41 (74.6%) | $0 |
| Female | 14 (25.5%) | $0 |
| Total | 55 (100.0%) | $0 |
Earnings by Sex by Income Bracket in Spaulding
The most common earnings brackets in Spaulding are $2,500 to $4,999 for men (27 | 65.8%) and $100,000+ for women (14 | 100.0%).
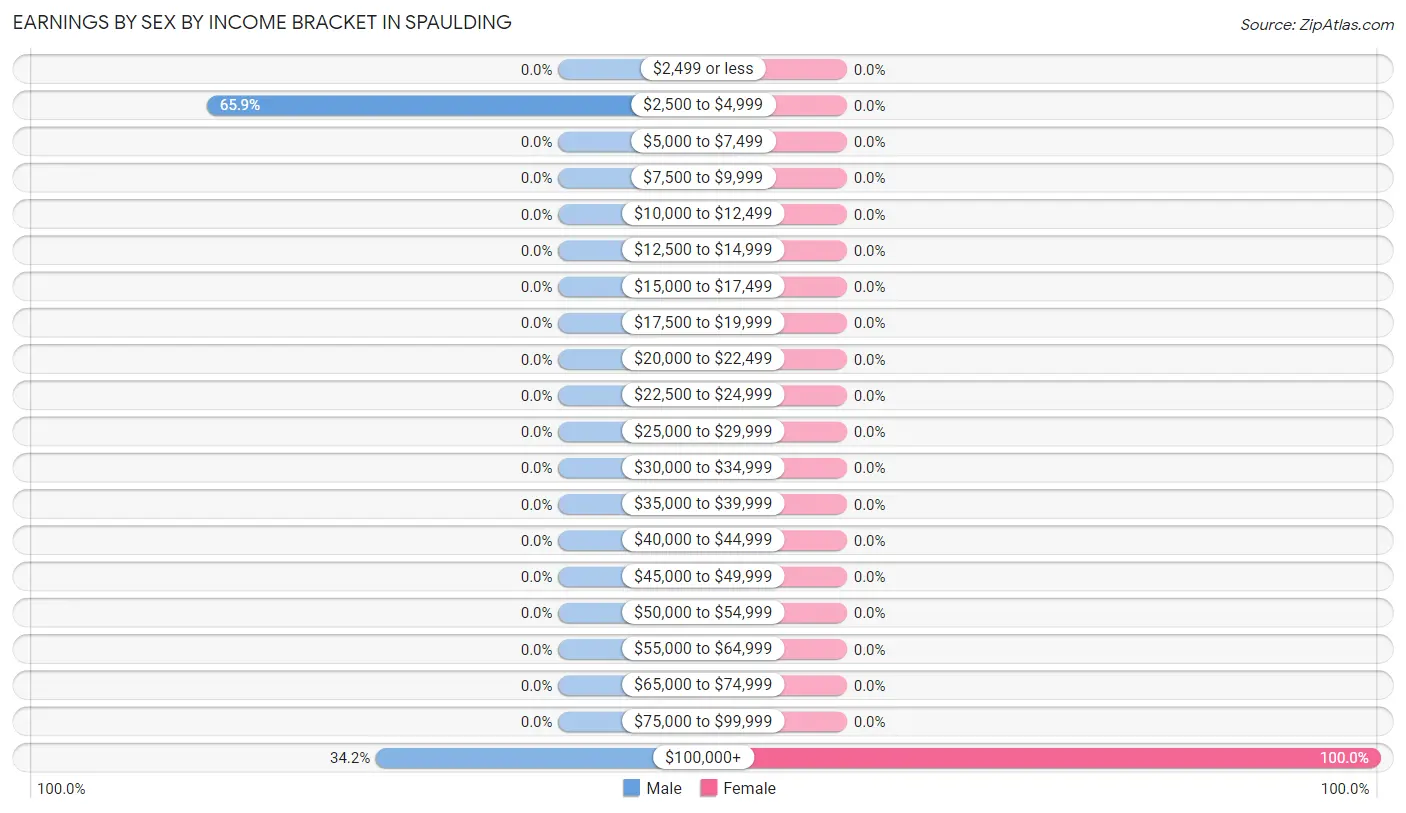
| Income | Male | Female |
| $2,499 or less | 0 (0.0%) | 0 (0.0%) |
| $2,500 to $4,999 | 27 (65.8%) | 0 (0.0%) |
| $5,000 to $7,499 | 0 (0.0%) | 0 (0.0%) |
| $7,500 to $9,999 | 0 (0.0%) | 0 (0.0%) |
| $10,000 to $12,499 | 0 (0.0%) | 0 (0.0%) |
| $12,500 to $14,999 | 0 (0.0%) | 0 (0.0%) |
| $15,000 to $17,499 | 0 (0.0%) | 0 (0.0%) |
| $17,500 to $19,999 | 0 (0.0%) | 0 (0.0%) |
| $20,000 to $22,499 | 0 (0.0%) | 0 (0.0%) |
| $22,500 to $24,999 | 0 (0.0%) | 0 (0.0%) |
| $25,000 to $29,999 | 0 (0.0%) | 0 (0.0%) |
| $30,000 to $34,999 | 0 (0.0%) | 0 (0.0%) |
| $35,000 to $39,999 | 0 (0.0%) | 0 (0.0%) |
| $40,000 to $44,999 | 0 (0.0%) | 0 (0.0%) |
| $45,000 to $49,999 | 0 (0.0%) | 0 (0.0%) |
| $50,000 to $54,999 | 0 (0.0%) | 0 (0.0%) |
| $55,000 to $64,999 | 0 (0.0%) | 0 (0.0%) |
| $65,000 to $74,999 | 0 (0.0%) | 0 (0.0%) |
| $75,000 to $99,999 | 0 (0.0%) | 0 (0.0%) |
| $100,000+ | 14 (34.2%) | 14 (100.0%) |
| Total | 41 (100.0%) | 14 (100.0%) |
Earnings by Sex by Educational Attainment in Spaulding
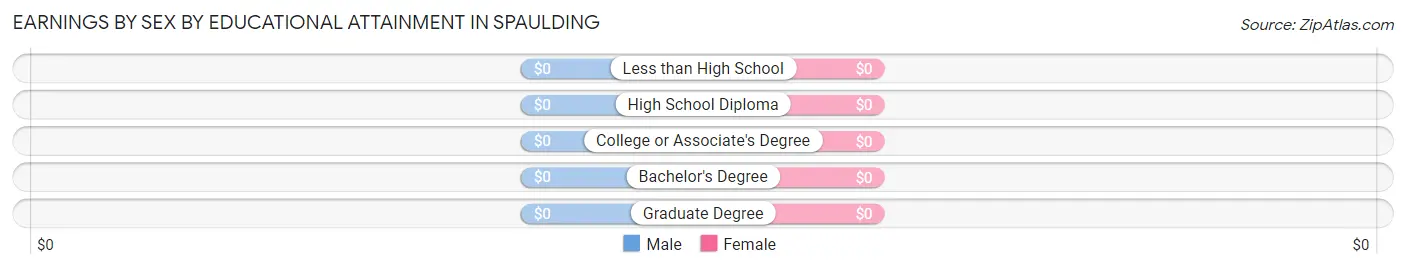
| Educational Attainment | Male Income | Female Income |
| Less than High School | - | - |
| High School Diploma | - | - |
| College or Associate's Degree | - | - |
| Bachelor's Degree | - | - |
| Graduate Degree | - | - |
| Total | - | - |
Family Income in Spaulding
Family Income Brackets in Spaulding
According to the Spaulding family income data, there are 29 families falling into the less than $10,000 income range, which is the most common income bracket and makes up 60.4% of all families.
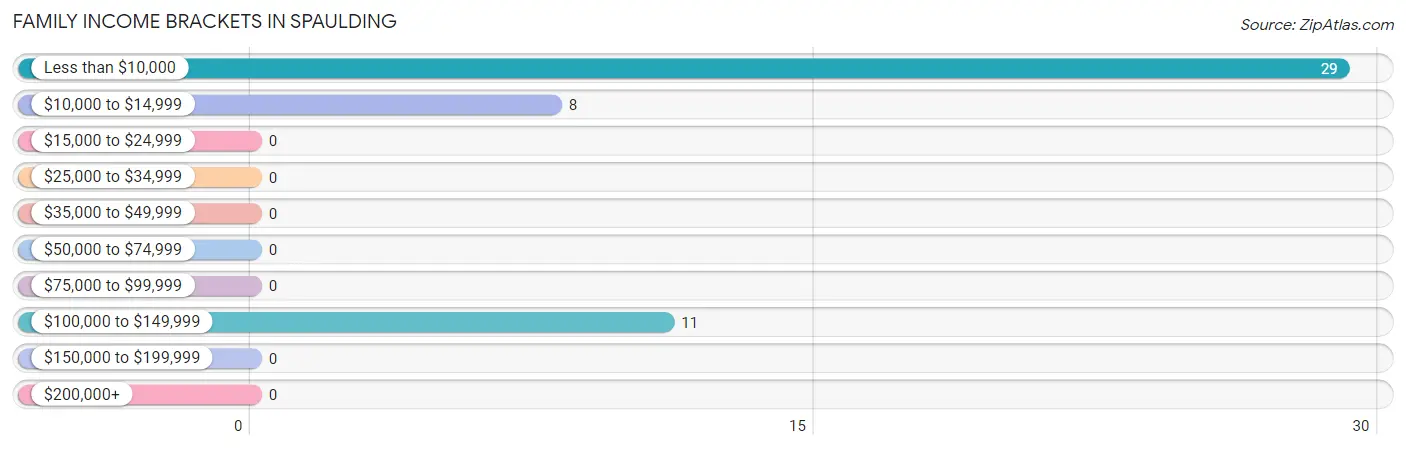
| Income Bracket | # Families | % Families |
| Less than $10,000 | 29 | 60.4% |
| $10,000 to $14,999 | 8 | 16.7% |
| $15,000 to $24,999 | 0 | 0.0% |
| $25,000 to $34,999 | 0 | 0.0% |
| $35,000 to $49,999 | 0 | 0.0% |
| $50,000 to $74,999 | 0 | 0.0% |
| $75,000 to $99,999 | 0 | 0.0% |
| $100,000 to $149,999 | 11 | 22.9% |
| $150,000 to $199,999 | 0 | 0.0% |
| $200,000+ | 0 | 0.0% |
Family Income by Famaliy Size in Spaulding
| Income Bracket | # Families | Median Income |
| 2-Person Families | 31 (64.6%) | $0 |
| 3-Person Families | 17 (35.4%) | $0 |
| 4-Person Families | 0 (0.0%) | $0 |
| 5-Person Families | 0 (0.0%) | $0 |
| 6-Person Families | 0 (0.0%) | $0 |
| 7+ Person Families | 0 (0.0%) | $0 |
| Total | 48 (100.0%) | $0 |
Family Income by Number of Earners in Spaulding
| Number of Earners | # Families | Median Income |
| No Earners | 36 (75.0%) | $0 |
| 1 Earner | 12 (25.0%) | $0 |
| 2 Earners | 0 (0.0%) | $0 |
| 3+ Earners | 0 (0.0%) | $0 |
| Total | 48 (100.0%) | $0 |
Household Income in Spaulding
Household Income Brackets in Spaulding
With 48 households falling in the category, the less than $10,000 income range is the most frequent in Spaulding, accounting for 33.1% of all households.
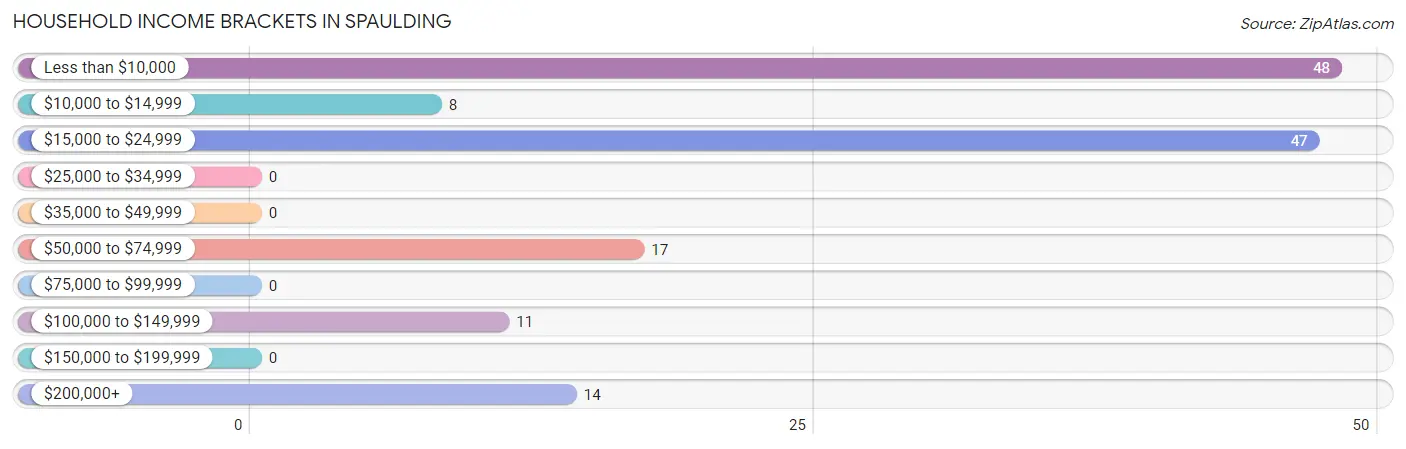
| Income Bracket | # Households | % Households |
| Less than $10,000 | 48 | 33.1% |
| $10,000 to $14,999 | 8 | 5.5% |
| $15,000 to $24,999 | 47 | 32.4% |
| $25,000 to $34,999 | 0 | 0.0% |
| $35,000 to $49,999 | 0 | 0.0% |
| $50,000 to $74,999 | 17 | 11.7% |
| $75,000 to $99,999 | 0 | 0.0% |
| $100,000 to $149,999 | 11 | 7.6% |
| $150,000 to $199,999 | 0 | 0.0% |
| $200,000+ | 14 | 9.7% |
Household Income by Householder Age in Spaulding
The median household income in Spaulding is $23,378, with the highest median household income of $23,697 found in the 65+ years age bracket for the primary householder. A total of 99 households (68.3%) fall into this category.
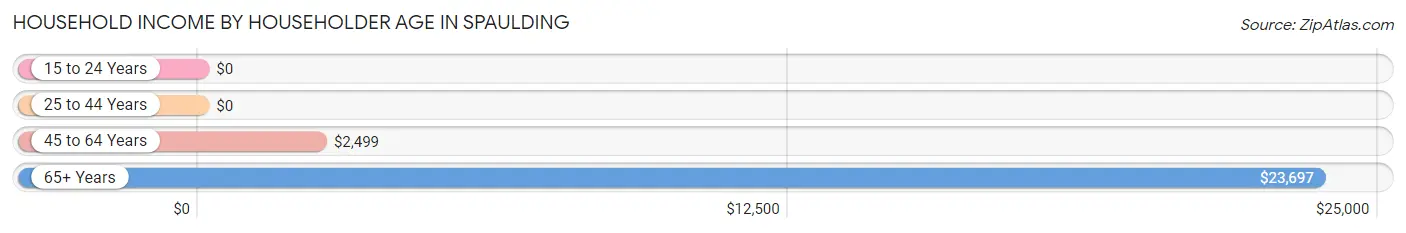
| Income Bracket | # Households | Median Income |
| 15 to 24 Years | 0 (0.0%) | $0 |
| 25 to 44 Years | 14 (9.7%) | $0 |
| 45 to 64 Years | 32 (22.1%) | $2,499 |
| 65+ Years | 99 (68.3%) | $23,697 |
| Total | 145 (100.0%) | $23,378 |
Poverty in Spaulding
Income Below Poverty by Sex and Age in Spaulding
With 52.3% poverty level for males and 47.4% for females among the residents of Spaulding, 18 to 24 year old males and 45 to 54 year old females are the most vulnerable to poverty, with 17 males (100.0%) and 9 females (100.0%) in their respective age groups living below the poverty level.
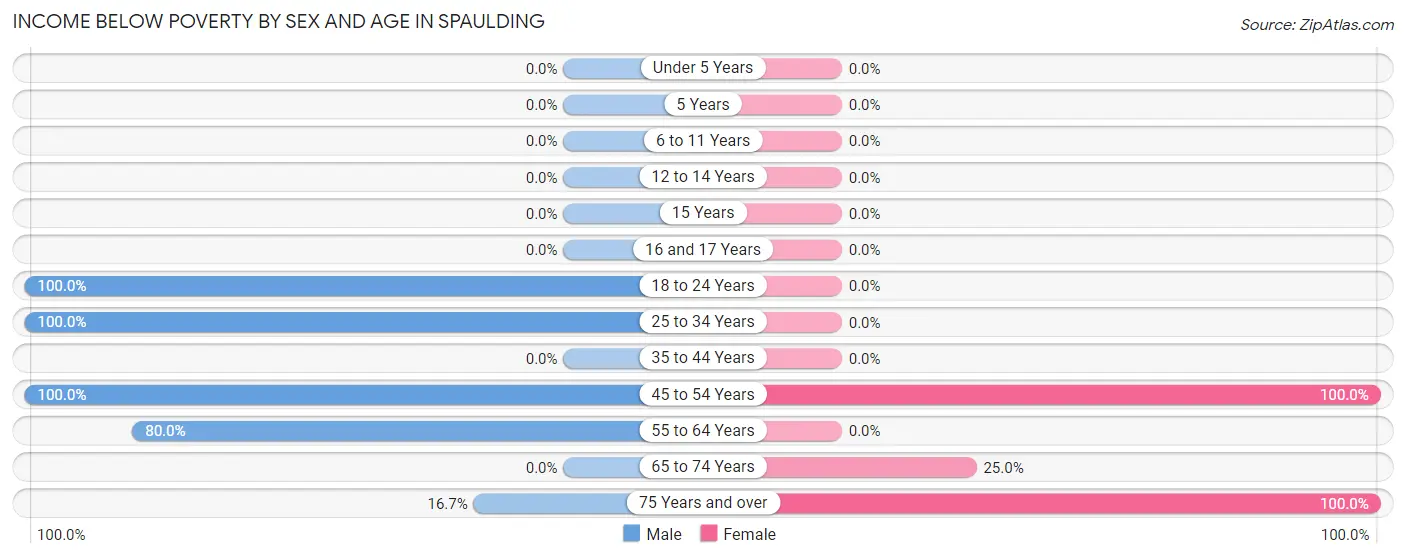
| Age Bracket | Male | Female |
| Under 5 Years | 0 (0.0%) | 0 (0.0%) |
| 5 Years | 0 (0.0%) | 0 (0.0%) |
| 6 to 11 Years | 0 (0.0%) | 0 (0.0%) |
| 12 to 14 Years | 0 (0.0%) | 0 (0.0%) |
| 15 Years | 0 (0.0%) | 0 (0.0%) |
| 16 and 17 Years | 0 (0.0%) | 0 (0.0%) |
| 18 to 24 Years | 17 (100.0%) | 0 (0.0%) |
| 25 to 34 Years | 27 (100.0%) | 0 (0.0%) |
| 35 to 44 Years | 0 (0.0%) | 0 (0.0%) |
| 45 to 54 Years | 17 (100.0%) | 9 (100.0%) |
| 55 to 64 Years | 12 (80.0%) | 0 (0.0%) |
| 65 to 74 Years | 0 (0.0%) | 9 (25.0%) |
| 75 Years and over | 8 (16.7%) | 19 (100.0%) |
| Total | 81 (52.3%) | 37 (47.4%) |
Income Above Poverty by Sex and Age in Spaulding
According to the poverty statistics in Spaulding, males aged 35 to 44 years and females aged 35 to 44 years are the age groups that are most secure financially, with 100.0% of males and 100.0% of females in these age groups living above the poverty line.
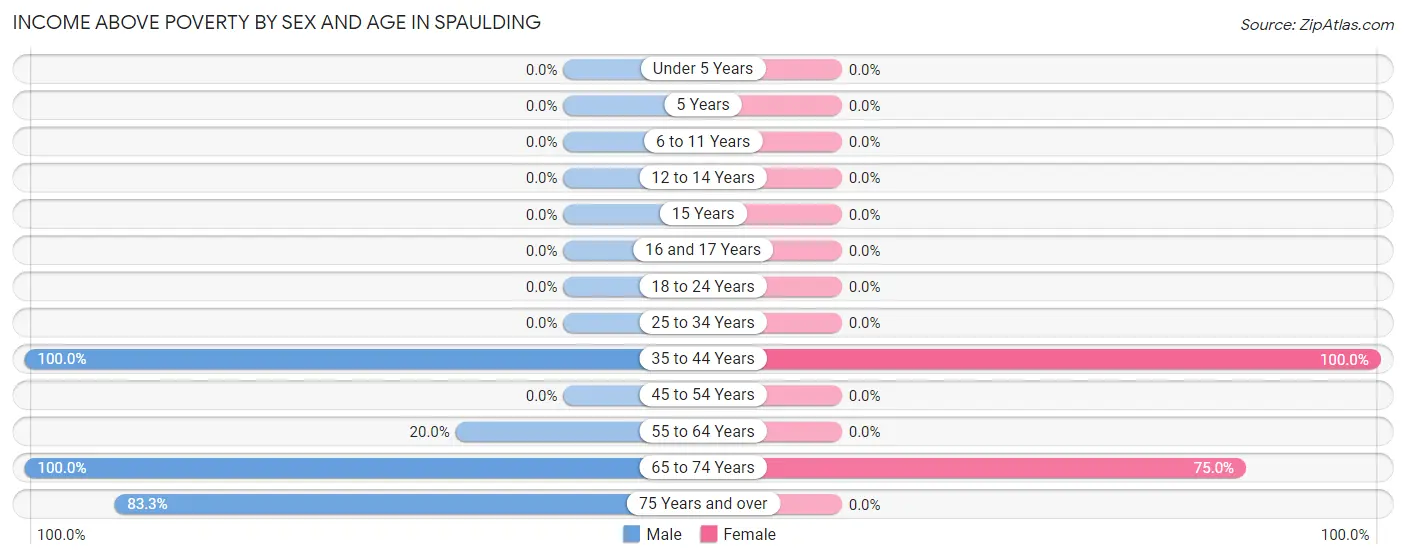
| Age Bracket | Male | Female |
| Under 5 Years | 0 (0.0%) | 0 (0.0%) |
| 5 Years | 0 (0.0%) | 0 (0.0%) |
| 6 to 11 Years | 0 (0.0%) | 0 (0.0%) |
| 12 to 14 Years | 0 (0.0%) | 0 (0.0%) |
| 15 Years | 0 (0.0%) | 0 (0.0%) |
| 16 and 17 Years | 0 (0.0%) | 0 (0.0%) |
| 18 to 24 Years | 0 (0.0%) | 0 (0.0%) |
| 25 to 34 Years | 0 (0.0%) | 0 (0.0%) |
| 35 to 44 Years | 14 (100.0%) | 14 (100.0%) |
| 45 to 54 Years | 0 (0.0%) | 0 (0.0%) |
| 55 to 64 Years | 3 (20.0%) | 0 (0.0%) |
| 65 to 74 Years | 17 (100.0%) | 27 (75.0%) |
| 75 Years and over | 40 (83.3%) | 0 (0.0%) |
| Total | 74 (47.7%) | 41 (52.6%) |
Income Below Poverty Among Married-Couple Families in Spaulding
The poverty statistics for married-couple families in Spaulding show that 69.4% or 25 of the total 36 families live below the poverty line. Families with no children have the highest poverty rate of 69.4%, comprising of 25 families. On the other hand, families with no children have the lowest poverty rate of 69.4%, which includes 25 families.
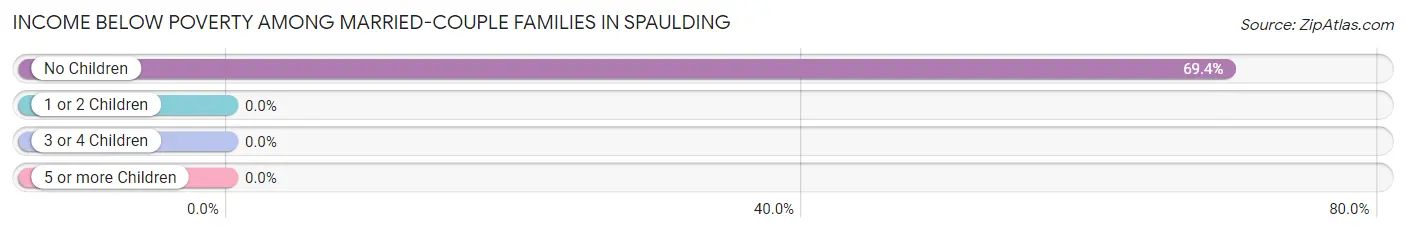
| Children | Above Poverty | Below Poverty |
| No Children | 11 (30.6%) | 25 (69.4%) |
| 1 or 2 Children | 0 (0.0%) | 0 (0.0%) |
| 3 or 4 Children | 0 (0.0%) | 0 (0.0%) |
| 5 or more Children | 0 (0.0%) | 0 (0.0%) |
| Total | 11 (30.6%) | 25 (69.4%) |
Income Below Poverty Among Single-Parent Households in Spaulding
| Children | Single Father | Single Mother |
| No Children | 12 (100.0%) | 0 (0.0%) |
| 1 or 2 Children | 0 (0.0%) | 0 (0.0%) |
| 3 or 4 Children | 0 (0.0%) | 0 (0.0%) |
| 5 or more Children | 0 (0.0%) | 0 (0.0%) |
| Total | 12 (100.0%) | 0 (0.0%) |
Income Below Poverty Among Married-Couple vs Single-Parent Households in Spaulding
The poverty data for Spaulding shows that 25 of the married-couple family households (69.4%) and 12 of the single-parent households (100.0%) are living below the poverty level. Within the married-couple family households, those with no children have the highest poverty rate, with 25 households (69.4%) falling below the poverty line. Among the single-parent households, those with no children have the highest poverty rate, with 12 household (100.0%) living below poverty.
| Children | Married-Couple Families | Single-Parent Households |
| No Children | 25 (69.4%) | 12 (100.0%) |
| 1 or 2 Children | 0 (0.0%) | 0 (0.0%) |
| 3 or 4 Children | 0 (0.0%) | 0 (0.0%) |
| 5 or more Children | 0 (0.0%) | 0 (0.0%) |
| Total | 25 (69.4%) | 12 (100.0%) |
Race in Spaulding
The most populous races in Spaulding are , and White / Caucasian (233 | 100.0%).
| Race | # Population | % Population |
| Asian | 0 | 0.0% |
| Black / African American | 0 | 0.0% |
| Hawaiian / Pacific | 0 | 0.0% |
| Hispanic or Latino | 0 | 0.0% |
| Native / Alaskan | 0 | 0.0% |
| White / Caucasian | 233 | 100.0% |
| Two or more Races | 0 | 0.0% |
| Some other Race | 0 | 0.0% |
| Total | 233 | 100.0% |
Ancestry in Spaulding
The most populous ancestries reported in Spaulding are English (70 | 30.0%), Irish (56 | 24.0%), Iranian (43 | 18.4%), German (40 | 17.2%), and Portuguese (35 | 15.0%), together accounting for 104.7% of all Spaulding residents.
| Ancestry | # Population | % Population |
| Dutch | 9 | 3.9% |
| English | 70 | 30.0% |
| German | 40 | 17.2% |
| Iranian | 43 | 18.4% |
| Irish | 56 | 24.0% |
| Italian | 11 | 4.7% |
| Norwegian | 14 | 6.0% |
| Polish | 3 | 1.3% |
| Portuguese | 35 | 15.0% | View All 9 Rows |
Immigrants in Spaulding
The most numerous immigrant groups reported in Spaulding came from Asia (43 | 18.4%), Iran (43 | 18.4%), and South Central Asia (43 | 18.4%), together accounting for 55.3% of all Spaulding residents.
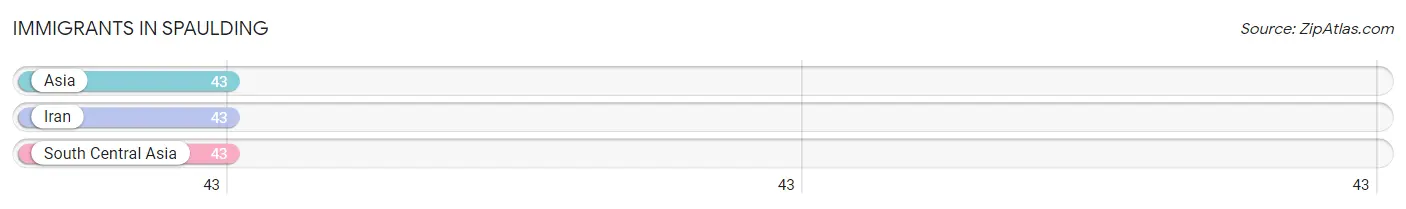
| Immigration Origin | # Population | % Population |
| Asia | 43 | 18.4% |
| Iran | 43 | 18.4% |
| South Central Asia | 43 | 18.4% | View All 3 Rows |
Sex and Age in Spaulding
Sex and Age in Spaulding
The most populous age groups in Spaulding are 80 to 84 Years (31 | 20.0%) for men and 65 to 69 Years (25 | 32.1%) for women.
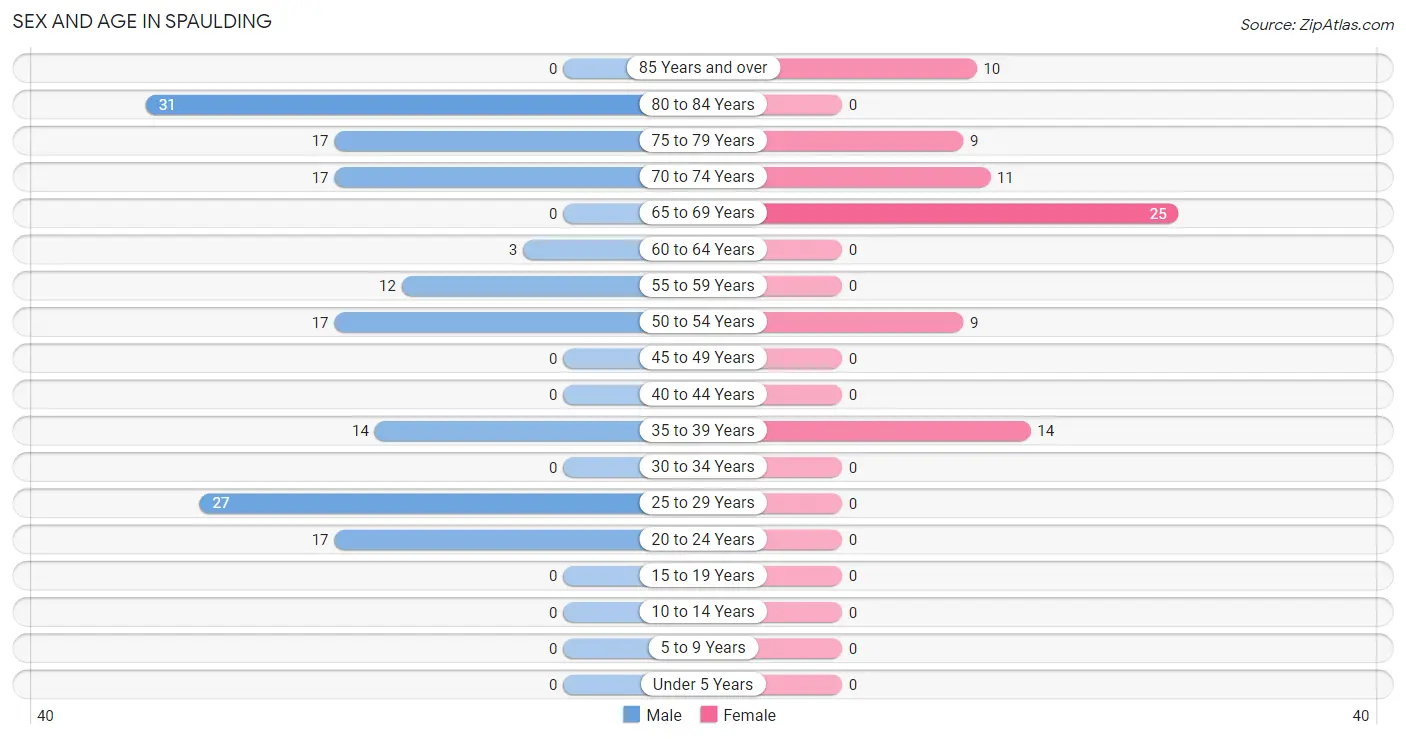
| Age Bracket | Male | Female |
| Under 5 Years | 0 (0.0%) | 0 (0.0%) |
| 5 to 9 Years | 0 (0.0%) | 0 (0.0%) |
| 10 to 14 Years | 0 (0.0%) | 0 (0.0%) |
| 15 to 19 Years | 0 (0.0%) | 0 (0.0%) |
| 20 to 24 Years | 17 (11.0%) | 0 (0.0%) |
| 25 to 29 Years | 27 (17.4%) | 0 (0.0%) |
| 30 to 34 Years | 0 (0.0%) | 0 (0.0%) |
| 35 to 39 Years | 14 (9.0%) | 14 (17.9%) |
| 40 to 44 Years | 0 (0.0%) | 0 (0.0%) |
| 45 to 49 Years | 0 (0.0%) | 0 (0.0%) |
| 50 to 54 Years | 17 (11.0%) | 9 (11.5%) |
| 55 to 59 Years | 12 (7.7%) | 0 (0.0%) |
| 60 to 64 Years | 3 (1.9%) | 0 (0.0%) |
| 65 to 69 Years | 0 (0.0%) | 25 (32.1%) |
| 70 to 74 Years | 17 (11.0%) | 11 (14.1%) |
| 75 to 79 Years | 17 (11.0%) | 9 (11.5%) |
| 80 to 84 Years | 31 (20.0%) | 0 (0.0%) |
| 85 Years and over | 0 (0.0%) | 10 (12.8%) |
| Total | 155 (100.0%) | 78 (100.0%) |
Families and Households in Spaulding
Median Family Size in Spaulding
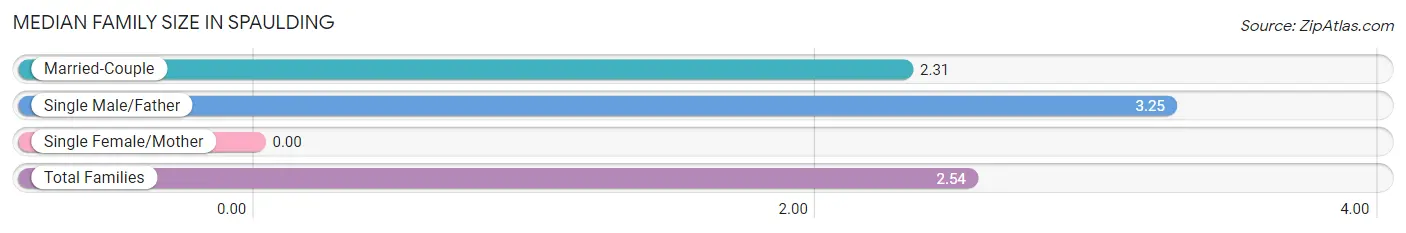
| Family Type | # Families | Family Size |
| Married-Couple | 36 (75.0%) | 2.31 |
| Single Male/Father | 12 (25.0%) | 3.25 |
| Single Female/Mother | 0 (0.0%) | - |
| Total Families | 48 (100.0%) | 2.54 |
Median Household Size in Spaulding
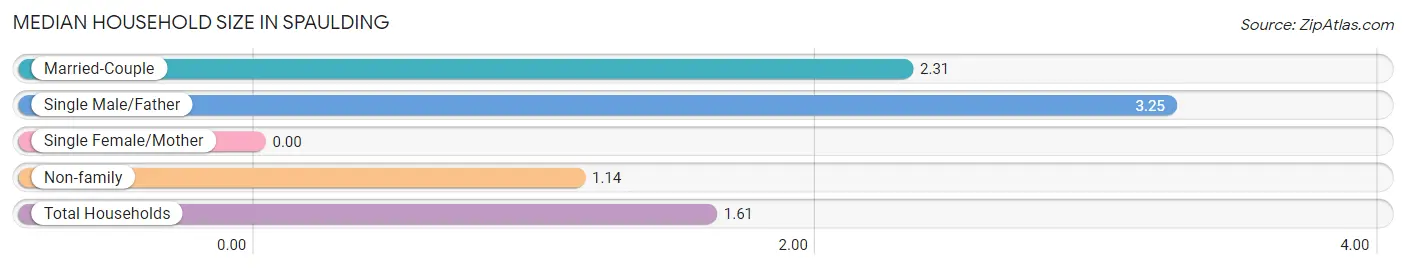
| Household Type | # Households | Household Size |
| Married-Couple | 36 (24.8%) | 2.31 |
| Single Male/Father | 12 (8.3%) | 3.25 |
| Single Female/Mother | 0 (0.0%) | - |
| Non-family | 97 (66.9%) | 1.14 |
| Total Households | 145 (100.0%) | 1.61 |
Household Size by Marriage Status in Spaulding
Out of a total of 145 households in Spaulding, 48 (33.1%) are family households, while 97 (66.9%) are nonfamily households. The most numerous type of family households are 2-person households, comprising 31, and the most common type of nonfamily households are 1-person households, comprising 83.
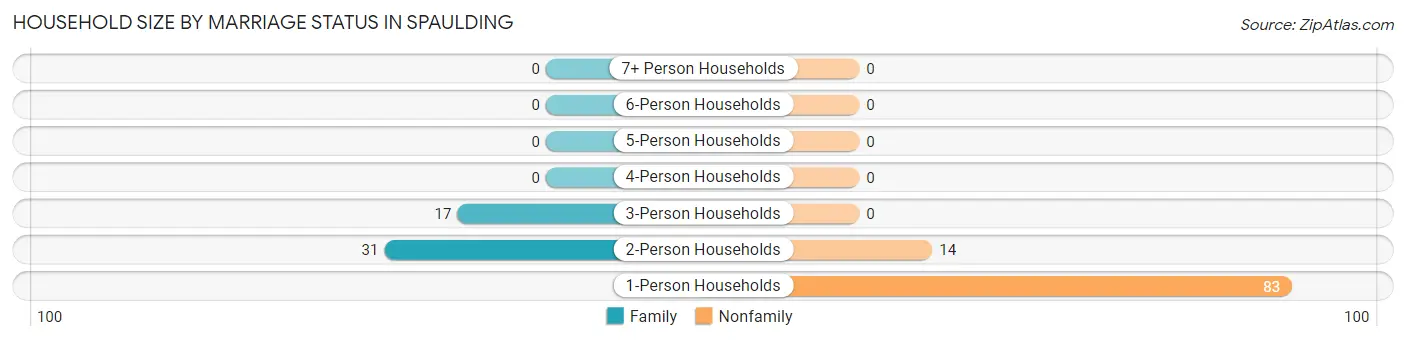
| Household Size | Family Households | Nonfamily Households |
| 1-Person Households | - | 83 (57.2%) |
| 2-Person Households | 31 (21.4%) | 14 (9.7%) |
| 3-Person Households | 17 (11.7%) | 0 (0.0%) |
| 4-Person Households | 0 (0.0%) | 0 (0.0%) |
| 5-Person Households | 0 (0.0%) | 0 (0.0%) |
| 6-Person Households | 0 (0.0%) | 0 (0.0%) |
| 7+ Person Households | 0 (0.0%) | 0 (0.0%) |
| Total | 48 (33.1%) | 97 (66.9%) |
Female Fertility in Spaulding
Fertility by Age in Spaulding
| Age Bracket | Women with Births | Births / 1,000 Women |
| 15 to 19 years | 0 (0.0%) | 0.0 |
| 20 to 34 years | 0 (0.0%) | 0.0 |
| 35 to 50 years | 0 (0.0%) | 0.0 |
| Total | 0 (0.0%) | 0.0 |
Fertility by Age by Marriage Status in Spaulding
| Age Bracket | Married | Unmarried |
| 15 to 19 years | 0 (0.0%) | 0 (0.0%) |
| 20 to 34 years | 0 (0.0%) | 0 (0.0%) |
| 35 to 50 years | 0 (0.0%) | 0 (0.0%) |
| Total | 0 (0.0%) | 0 (0.0%) |
Fertility by Education in Spaulding
| Educational Attainment | Women with Births | Births / 1,000 Women |
| Less than High School | 0 (0.0%) | 0.0 |
| High School Diploma | 0 (0.0%) | 0.0 |
| College or Associate's Degree | 0 (0.0%) | 0.0 |
| Bachelor's Degree | 0 (0.0%) | 0.0 |
| Graduate Degree | 0 (0.0%) | 0.0 |
| Total | 0 (0.0%) | 0.0 |
Fertility by Education by Marriage Status in Spaulding
| Educational Attainment | Married | Unmarried |
| Less than High School | 0 (0.0%) | 0 (0.0%) |
| High School Diploma | 0 (0.0%) | 0 (0.0%) |
| College or Associate's Degree | 0 (0.0%) | 0 (0.0%) |
| Bachelor's Degree | 0 (0.0%) | 0 (0.0%) |
| Graduate Degree | 0 (0.0%) | 0 (0.0%) |
| Total | 0 (0.0%) | 0 (0.0%) |
Employment Characteristics in Spaulding
Employment by Class of Employer in Spaulding
Among the 55 employed individuals in Spaulding, private company employees (28 | 50.9%), and self-employed (not incorporated) (27 | 49.1%) make up the most common classes of employment.
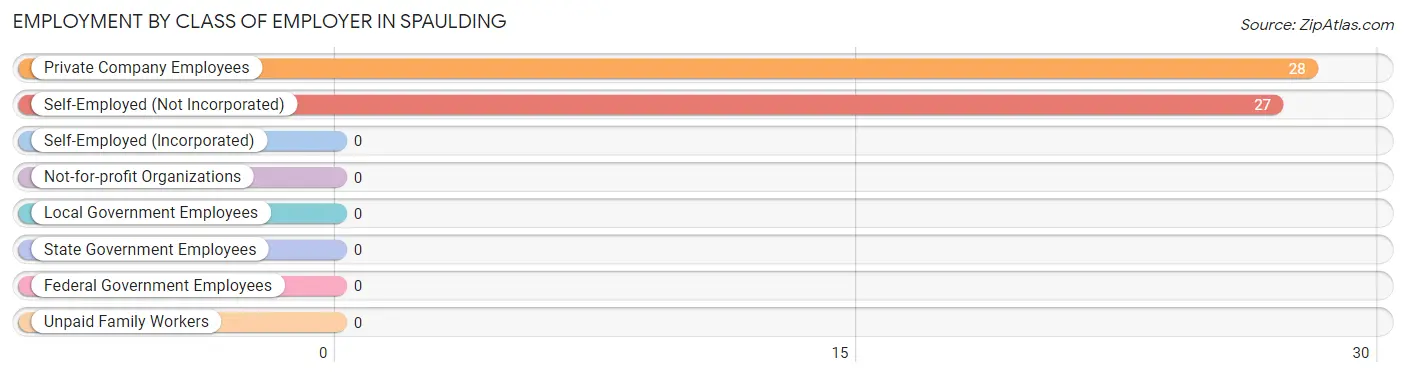
| Employer Class | # Employees | % Employees |
| Private Company Employees | 28 | 50.9% |
| Self-Employed (Incorporated) | 0 | 0.0% |
| Self-Employed (Not Incorporated) | 27 | 49.1% |
| Not-for-profit Organizations | 0 | 0.0% |
| Local Government Employees | 0 | 0.0% |
| State Government Employees | 0 | 0.0% |
| Federal Government Employees | 0 | 0.0% |
| Unpaid Family Workers | 0 | 0.0% |
| Total | 55 | 100.0% |
Employment Status by Age in Spaulding
According to the labor force statistics for Spaulding, out of the total population over 16 years of age (233), 42.1% or 98 individuals are in the labor force, with 43.9% or 43 of them unemployed. The age group with the highest labor force participation rate is 20 to 24 years, with 100.0% or 17 individuals in the labor force. Within the labor force, the 20 to 24 years age range has the highest percentage of unemployed individuals, with 100.0% or 17 of them being unemployed.
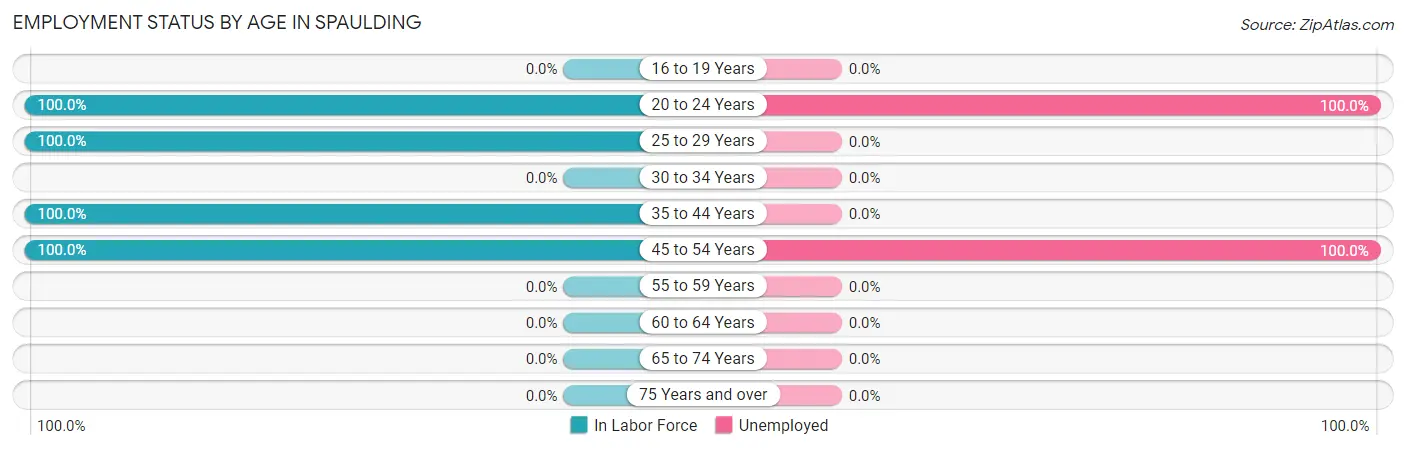
| Age Bracket | In Labor Force | Unemployed |
| 16 to 19 Years | 0 (0.0%) | 0 (0.0%) |
| 20 to 24 Years | 17 (100.0%) | 17 (100.0%) |
| 25 to 29 Years | 27 (100.0%) | 0 (0.0%) |
| 30 to 34 Years | 0 (0.0%) | 0 (0.0%) |
| 35 to 44 Years | 28 (100.0%) | 0 (0.0%) |
| 45 to 54 Years | 26 (100.0%) | 26 (100.0%) |
| 55 to 59 Years | 0 (0.0%) | 0 (0.0%) |
| 60 to 64 Years | 0 (0.0%) | 0 (0.0%) |
| 65 to 74 Years | 0 (0.0%) | 0 (0.0%) |
| 75 Years and over | 0 (0.0%) | 0 (0.0%) |
| Total | 98 (42.1%) | 43 (43.9%) |
Employment Status by Educational Attainment in Spaulding
According to labor force statistics for Spaulding, 84.4% of individuals (81) out of the total population between 25 and 64 years of age (96) are in the labor force, with 32.1% or 26 of them being unemployed. The group with the highest labor force participation rate are those with the educational attainment of bachelor's degree or higher, with 100.0% or 28 individuals in the labor force. Within the labor force, individuals with high school diploma education have the highest percentage of unemployment, with 100.0% or 26 of them being unemployed.
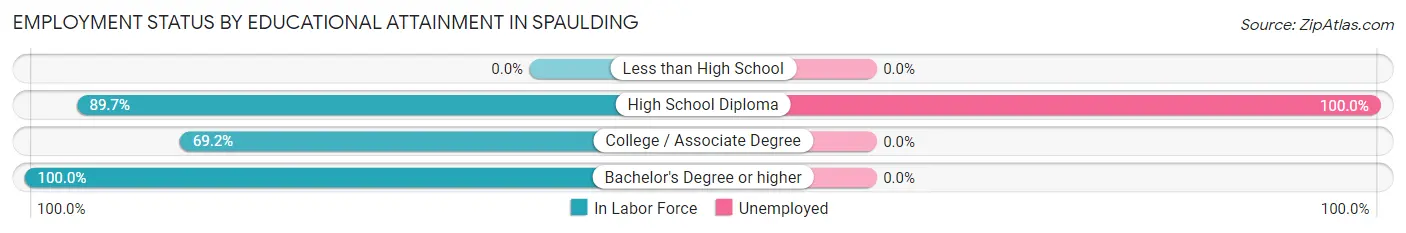
| Educational Attainment | In Labor Force | Unemployed |
| Less than High School | 0 (0.0%) | 0 (0.0%) |
| High School Diploma | 26 (89.7%) | 29 (100.0%) |
| College / Associate Degree | 27 (69.2%) | 0 (0.0%) |
| Bachelor's Degree or higher | 28 (100.0%) | 0 (0.0%) |
| Total | 81 (84.4%) | 31 (32.1%) |
Employment Occupations by Sex in Spaulding
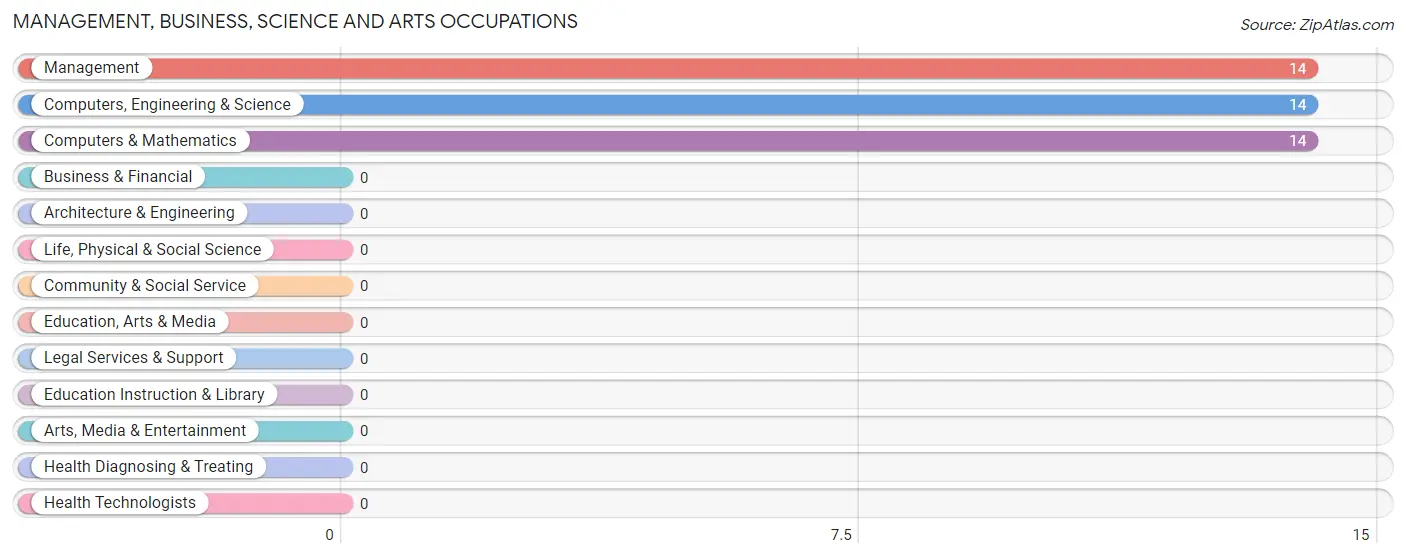
Management, Business, Science and Arts Occupations
The most common Management, Business, Science and Arts occupations in Spaulding are Management (14 | 25.5%), Computers, Engineering & Science (14 | 25.5%), and Computers & Mathematics (14 | 25.5%).
Management, Business, Science and Arts Occupations by Sex
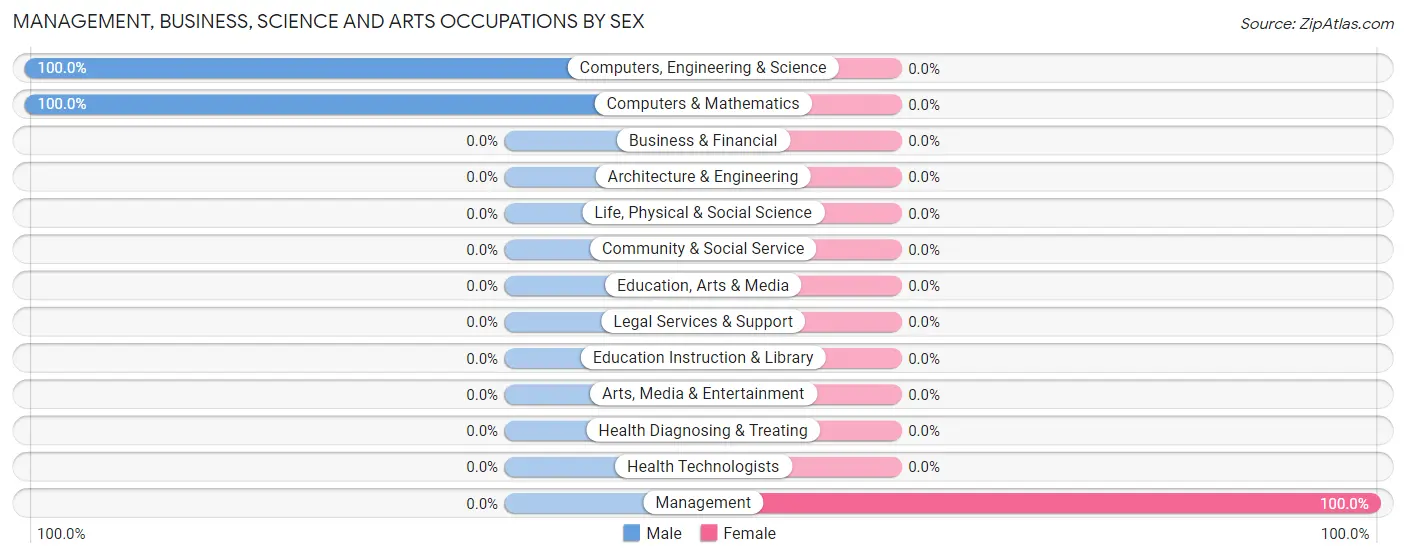
| Occupation | Male | Female |
| Management | 0 (0.0%) | 14 (100.0%) |
| Business & Financial | 0 (0.0%) | 0 (0.0%) |
| Computers, Engineering & Science | 14 (100.0%) | 0 (0.0%) |
| Computers & Mathematics | 14 (100.0%) | 0 (0.0%) |
| Architecture & Engineering | 0 (0.0%) | 0 (0.0%) |
| Life, Physical & Social Science | 0 (0.0%) | 0 (0.0%) |
| Community & Social Service | 0 (0.0%) | 0 (0.0%) |
| Education, Arts & Media | 0 (0.0%) | 0 (0.0%) |
| Legal Services & Support | 0 (0.0%) | 0 (0.0%) |
| Education Instruction & Library | 0 (0.0%) | 0 (0.0%) |
| Arts, Media & Entertainment | 0 (0.0%) | 0 (0.0%) |
| Health Diagnosing & Treating | 0 (0.0%) | 0 (0.0%) |
| Health Technologists | 0 (0.0%) | 0 (0.0%) |
| Total (Category) | 14 (50.0%) | 14 (50.0%) |
| Total (Overall) | 41 (74.6%) | 14 (25.5%) |
Services Occupations
Services Occupations by Sex
| Occupation | Male | Female |
| Healthcare Support | 0 (0.0%) | 0 (0.0%) |
| Security & Protection | 0 (0.0%) | 0 (0.0%) |
| Firefighting & Prevention | 0 (0.0%) | 0 (0.0%) |
| Law Enforcement | 0 (0.0%) | 0 (0.0%) |
| Food Preparation & Serving | 0 (0.0%) | 0 (0.0%) |
| Cleaning & Maintenance | 0 (0.0%) | 0 (0.0%) |
| Personal Care & Service | 0 (0.0%) | 0 (0.0%) |
| Total (Category) | 0 (0.0%) | 0 (0.0%) |
| Total (Overall) | 41 (74.6%) | 14 (25.5%) |
Sales and Office Occupations
The most common Sales and Office occupations in Spaulding are , and Office & Administration (27 | 49.1%).
Sales and Office Occupations by Sex

| Occupation | Male | Female |
| Sales & Related | 0 (0.0%) | 0 (0.0%) |
| Office & Administration | 27 (100.0%) | 0 (0.0%) |
| Total (Category) | 27 (100.0%) | 0 (0.0%) |
| Total (Overall) | 41 (74.6%) | 14 (25.5%) |
Natural Resources, Construction and Maintenance Occupations
Natural Resources, Construction and Maintenance Occupations by Sex
| Occupation | Male | Female |
| Farming, Fishing & Forestry | 0 (0.0%) | 0 (0.0%) |
| Construction & Extraction | 0 (0.0%) | 0 (0.0%) |
| Installation, Maintenance & Repair | 0 (0.0%) | 0 (0.0%) |
| Total (Category) | 0 (0.0%) | 0 (0.0%) |
| Total (Overall) | 41 (74.6%) | 14 (25.5%) |
Production, Transportation and Moving Occupations
Production, Transportation and Moving Occupations by Sex
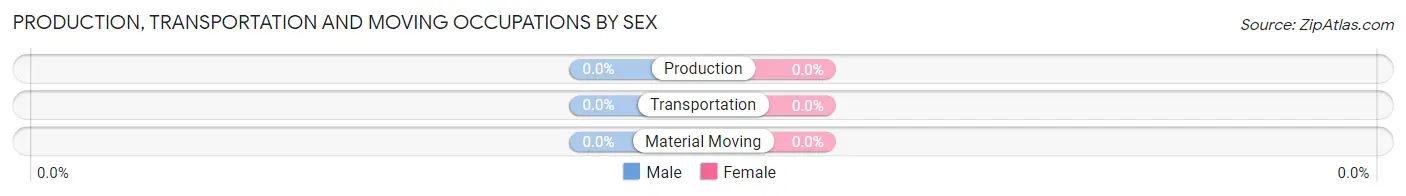
| Occupation | Male | Female |
| Production | 0 (0.0%) | 0 (0.0%) |
| Transportation | 0 (0.0%) | 0 (0.0%) |
| Material Moving | 0 (0.0%) | 0 (0.0%) |
| Total (Category) | 0 (0.0%) | 0 (0.0%) |
| Total (Overall) | 41 (74.6%) | 14 (25.5%) |
Employment Industries by Sex in Spaulding
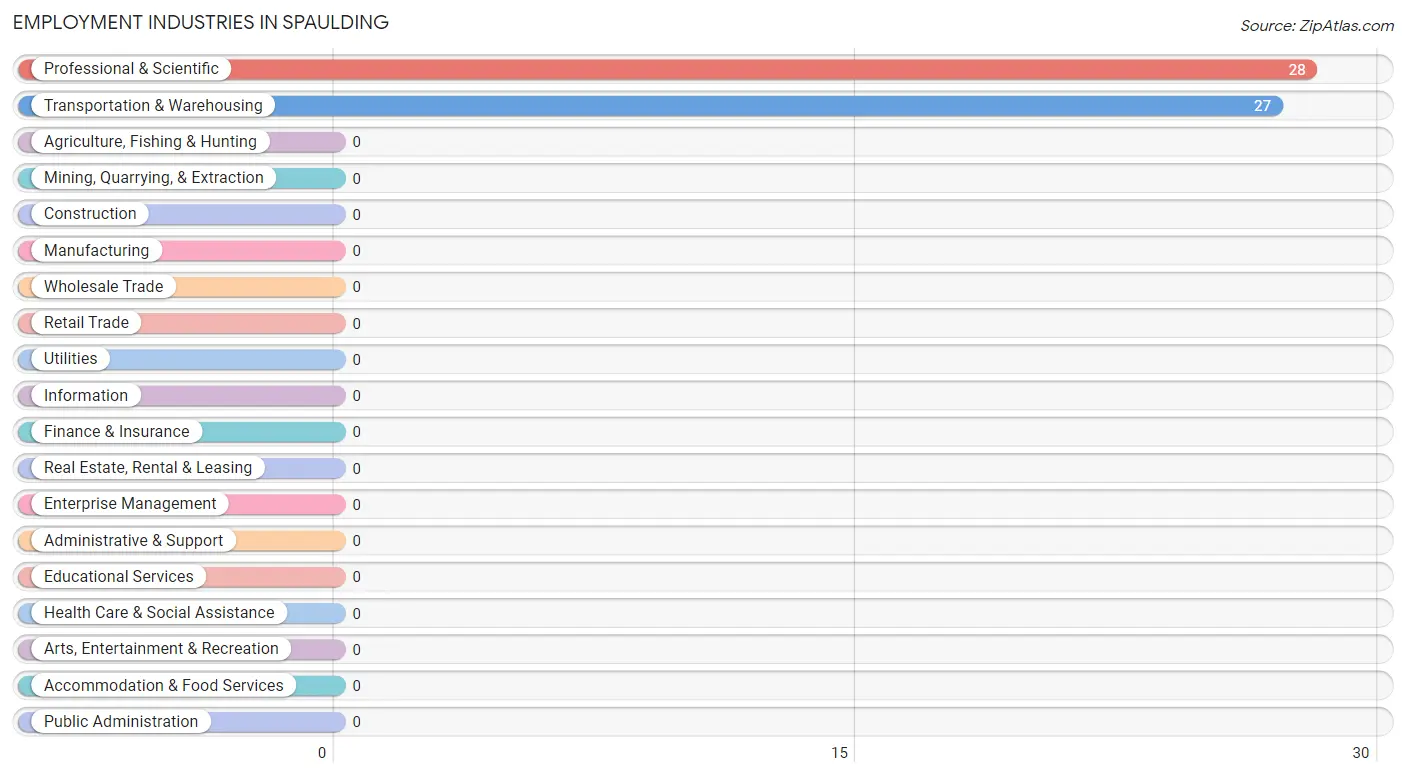
Employment Industries in Spaulding
The major employment industries in Spaulding include Professional & Scientific (28 | 50.9%), and Transportation & Warehousing (27 | 49.1%).
Employment Industries by Sex in Spaulding
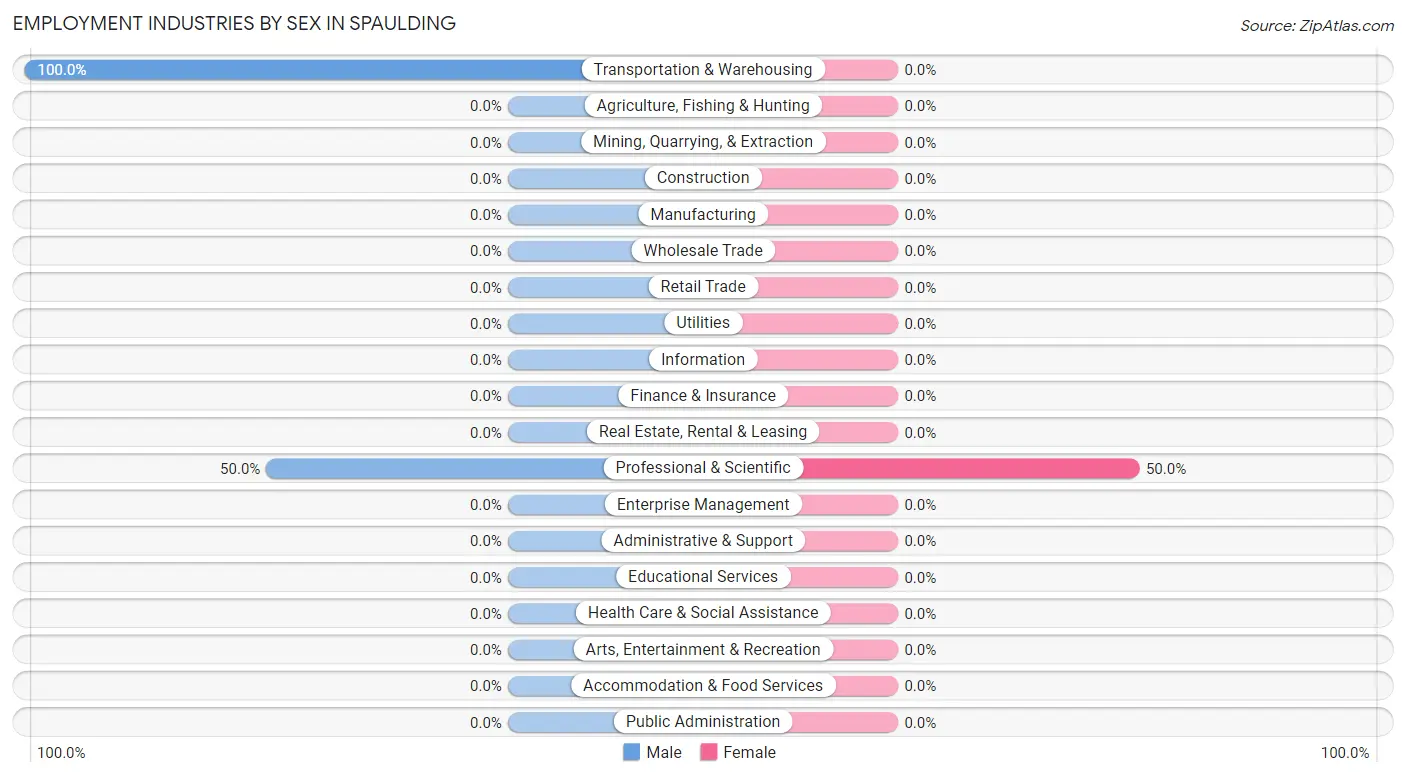
| Industry | Male | Female |
| Agriculture, Fishing & Hunting | 0 (0.0%) | 0 (0.0%) |
| Mining, Quarrying, & Extraction | 0 (0.0%) | 0 (0.0%) |
| Construction | 0 (0.0%) | 0 (0.0%) |
| Manufacturing | 0 (0.0%) | 0 (0.0%) |
| Wholesale Trade | 0 (0.0%) | 0 (0.0%) |
| Retail Trade | 0 (0.0%) | 0 (0.0%) |
| Transportation & Warehousing | 27 (100.0%) | 0 (0.0%) |
| Utilities | 0 (0.0%) | 0 (0.0%) |
| Information | 0 (0.0%) | 0 (0.0%) |
| Finance & Insurance | 0 (0.0%) | 0 (0.0%) |
| Real Estate, Rental & Leasing | 0 (0.0%) | 0 (0.0%) |
| Professional & Scientific | 14 (50.0%) | 14 (50.0%) |
| Enterprise Management | 0 (0.0%) | 0 (0.0%) |
| Administrative & Support | 0 (0.0%) | 0 (0.0%) |
| Educational Services | 0 (0.0%) | 0 (0.0%) |
| Health Care & Social Assistance | 0 (0.0%) | 0 (0.0%) |
| Arts, Entertainment & Recreation | 0 (0.0%) | 0 (0.0%) |
| Accommodation & Food Services | 0 (0.0%) | 0 (0.0%) |
| Public Administration | 0 (0.0%) | 0 (0.0%) |
| Total | 41 (74.6%) | 14 (25.5%) |
Education in Spaulding
School Enrollment in Spaulding
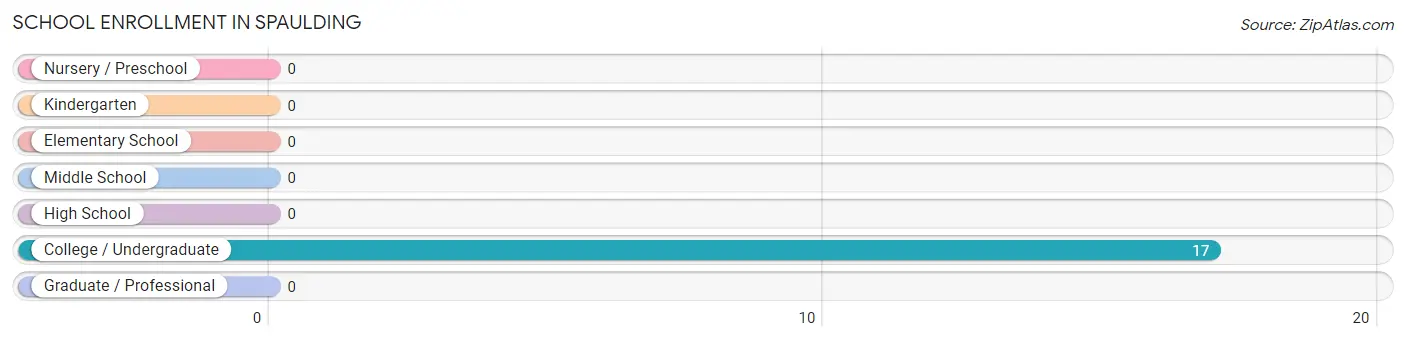
| School Level | # Students | % Students |
| Nursery / Preschool | 0 | 0.0% |
| Kindergarten | 0 | 0.0% |
| Elementary School | 0 | 0.0% |
| Middle School | 0 | 0.0% |
| High School | 0 | 0.0% |
| College / Undergraduate | 17 | 100.0% |
| Graduate / Professional | 0 | 0.0% |
| Total | 17 | 100.0% |
School Enrollment by Age by Funding Source in Spaulding
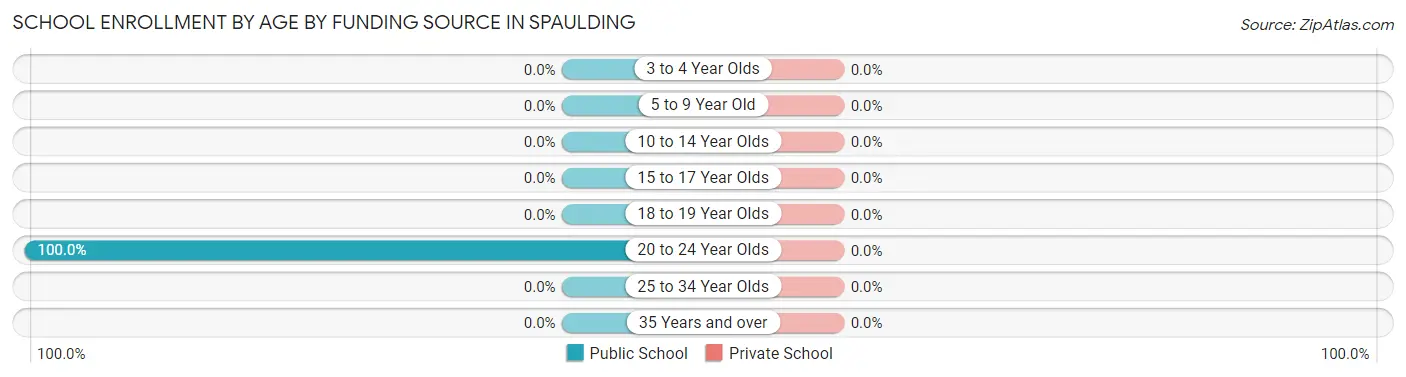
| Age Bracket | Public School | Private School |
| 3 to 4 Year Olds | 0 (0.0%) | 0 (0.0%) |
| 5 to 9 Year Old | 0 (0.0%) | 0 (0.0%) |
| 10 to 14 Year Olds | 0 (0.0%) | 0 (0.0%) |
| 15 to 17 Year Olds | 0 (0.0%) | 0 (0.0%) |
| 18 to 19 Year Olds | 0 (0.0%) | 0 (0.0%) |
| 20 to 24 Year Olds | 17 (100.0%) | 0 (0.0%) |
| 25 to 34 Year Olds | 0 (0.0%) | 0 (0.0%) |
| 35 Years and over | 0 (0.0%) | 0 (0.0%) |
| Total | 17 (100.0%) | 0 (0.0%) |
Educational Attainment by Field of Study in Spaulding
Social sciences (14 | 30.4%), business (14 | 30.4%), psychology (9 | 19.6%), and arts & humanities (9 | 19.6%) are the most common fields of study among 46 individuals in Spaulding who have obtained a bachelor's degree or higher.
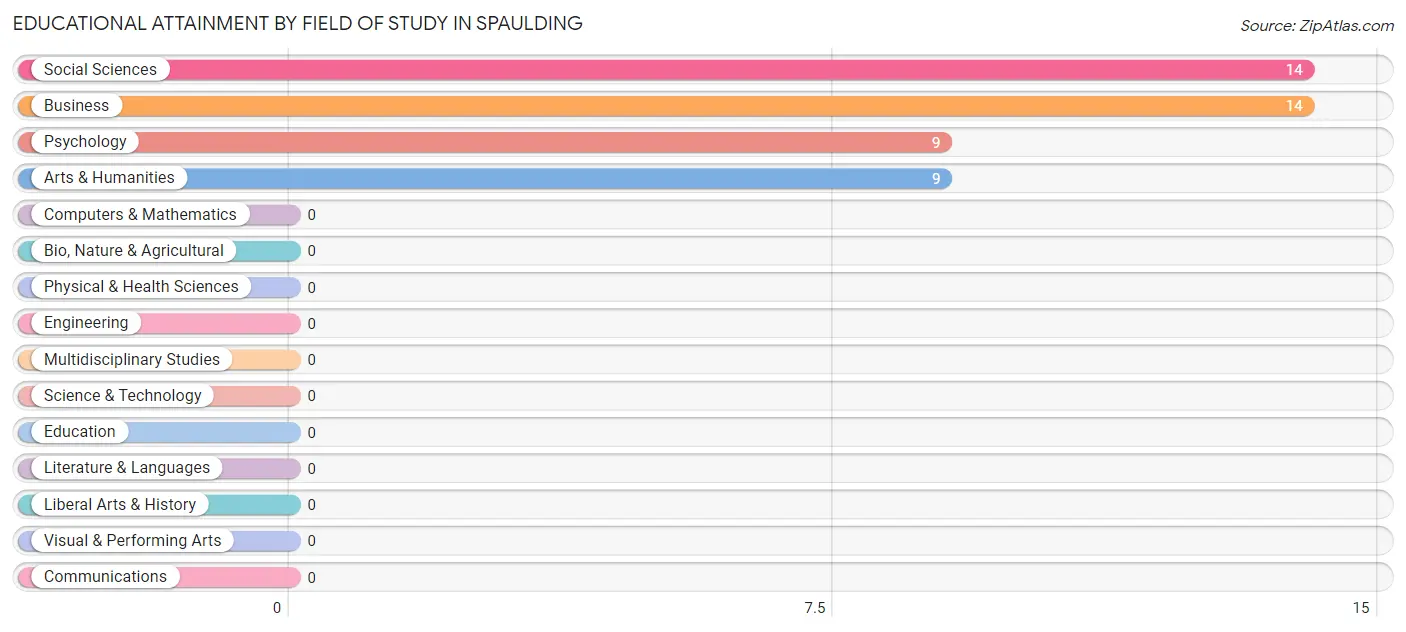
| Field of Study | # Graduates | % Graduates |
| Computers & Mathematics | 0 | 0.0% |
| Bio, Nature & Agricultural | 0 | 0.0% |
| Physical & Health Sciences | 0 | 0.0% |
| Psychology | 9 | 19.6% |
| Social Sciences | 14 | 30.4% |
| Engineering | 0 | 0.0% |
| Multidisciplinary Studies | 0 | 0.0% |
| Science & Technology | 0 | 0.0% |
| Business | 14 | 30.4% |
| Education | 0 | 0.0% |
| Literature & Languages | 0 | 0.0% |
| Liberal Arts & History | 0 | 0.0% |
| Visual & Performing Arts | 0 | 0.0% |
| Communications | 0 | 0.0% |
| Arts & Humanities | 9 | 19.6% |
| Total | 46 | 100.0% |
Transportation & Commute in Spaulding
Vehicle Availability by Sex in Spaulding
The most prevalent vehicle ownership categories in Spaulding are males with 3 vehicles (27, accounting for 65.8%) and females with 3 vehicles (0, making up 192.9%).
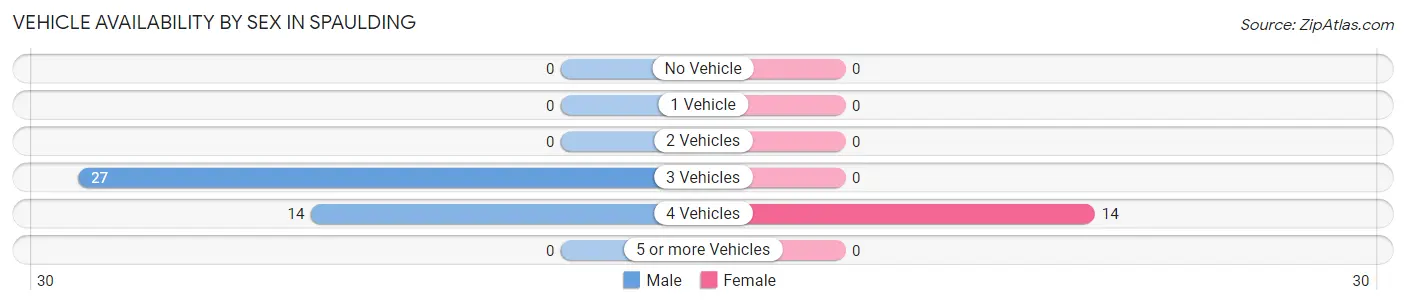
| Vehicles Available | Male | Female |
| No Vehicle | 0 (0.0%) | 0 (0.0%) |
| 1 Vehicle | 0 (0.0%) | 0 (0.0%) |
| 2 Vehicles | 0 (0.0%) | 0 (0.0%) |
| 3 Vehicles | 27 (65.8%) | 0 (0.0%) |
| 4 Vehicles | 14 (34.2%) | 14 (100.0%) |
| 5 or more Vehicles | 0 (0.0%) | 0 (0.0%) |
| Total | 41 (100.0%) | 14 (100.0%) |
Commute Time in Spaulding
The most frequently occuring commute durations in Spaulding are 60 to 89 minutes (27 commuters, 100.0%), less than 5 minutes (0 commuters, 0.0%), and 5 to 9 minutes (0 commuters, 0.0%).
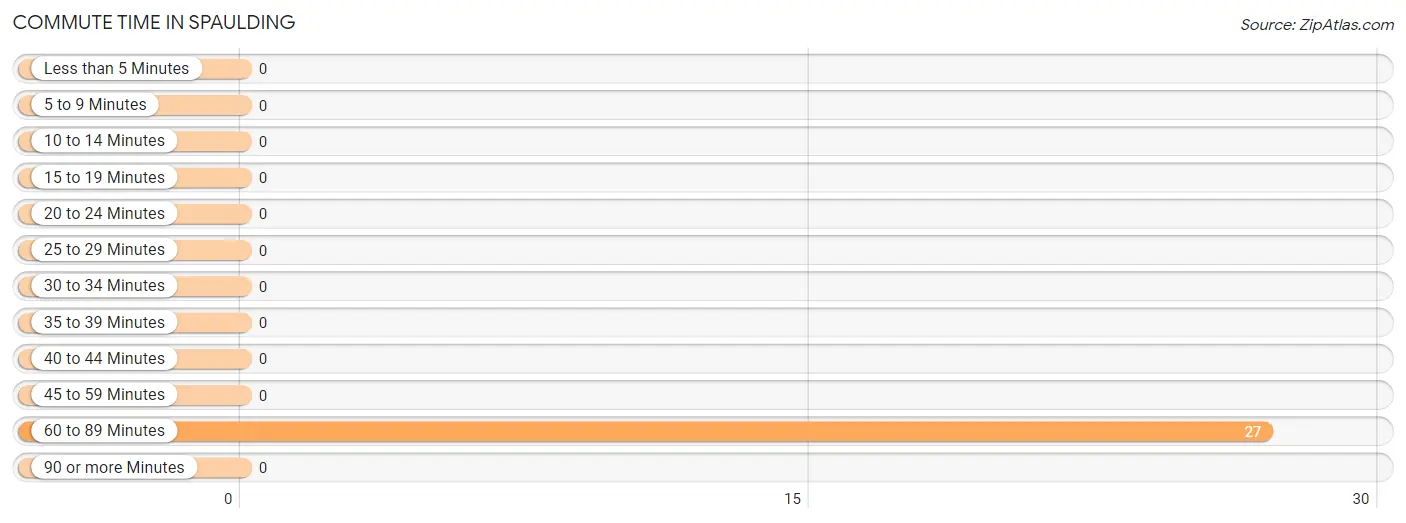
| Commute Time | # Commuters | % Commuters |
| Less than 5 Minutes | 0 | 0.0% |
| 5 to 9 Minutes | 0 | 0.0% |
| 10 to 14 Minutes | 0 | 0.0% |
| 15 to 19 Minutes | 0 | 0.0% |
| 20 to 24 Minutes | 0 | 0.0% |
| 25 to 29 Minutes | 0 | 0.0% |
| 30 to 34 Minutes | 0 | 0.0% |
| 35 to 39 Minutes | 0 | 0.0% |
| 40 to 44 Minutes | 0 | 0.0% |
| 45 to 59 Minutes | 0 | 0.0% |
| 60 to 89 Minutes | 27 | 100.0% |
| 90 or more Minutes | 0 | 0.0% |
Commute Time by Sex in Spaulding
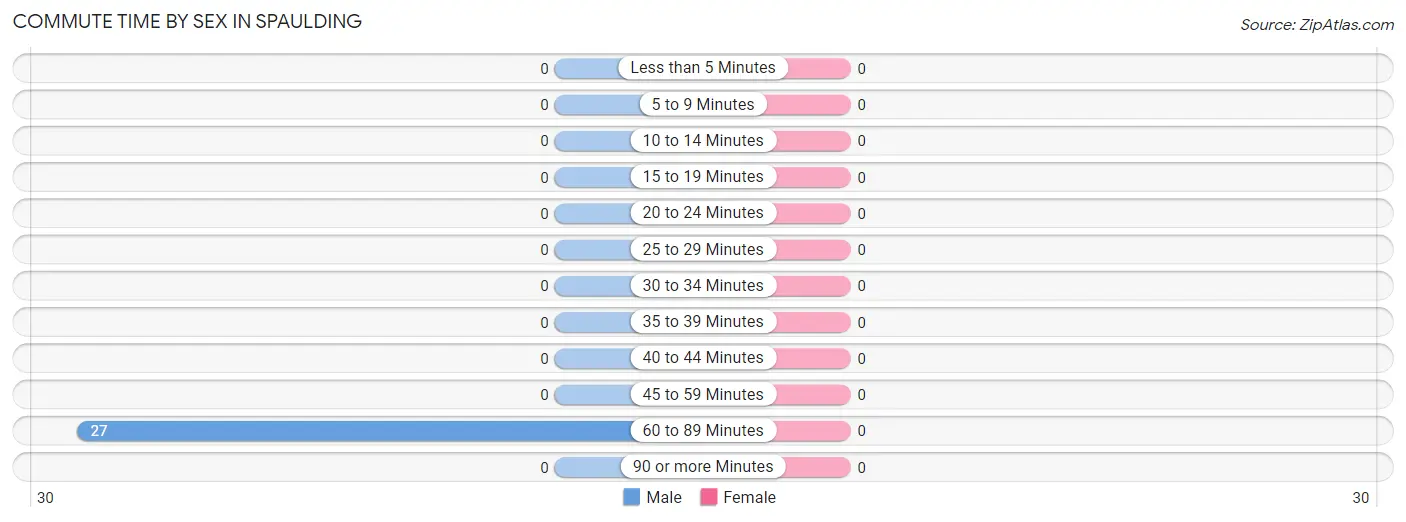
| Commute Time | Male | Female |
| Less than 5 Minutes | 0 (0.0%) | 0 (0.0%) |
| 5 to 9 Minutes | 0 (0.0%) | 0 (0.0%) |
| 10 to 14 Minutes | 0 (0.0%) | 0 (0.0%) |
| 15 to 19 Minutes | 0 (0.0%) | 0 (0.0%) |
| 20 to 24 Minutes | 0 (0.0%) | 0 (0.0%) |
| 25 to 29 Minutes | 0 (0.0%) | 0 (0.0%) |
| 30 to 34 Minutes | 0 (0.0%) | 0 (0.0%) |
| 35 to 39 Minutes | 0 (0.0%) | 0 (0.0%) |
| 40 to 44 Minutes | 0 (0.0%) | 0 (0.0%) |
| 45 to 59 Minutes | 0 (0.0%) | 0 (0.0%) |
| 60 to 89 Minutes | 27 (100.0%) | 0 (0.0%) |
| 90 or more Minutes | 0 (0.0%) | 0 (0.0%) |
Time of Departure to Work by Sex in Spaulding
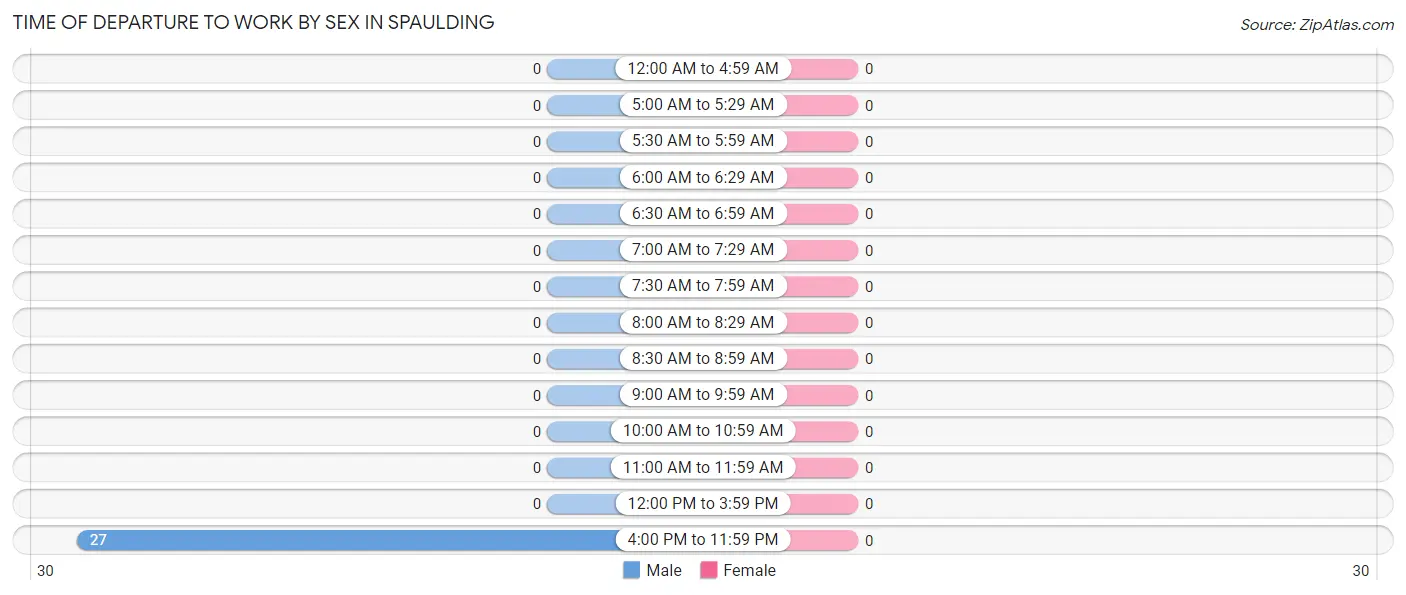
| Time of Departure | Male | Female |
| 12:00 AM to 4:59 AM | 0 (0.0%) | 0 (0.0%) |
| 5:00 AM to 5:29 AM | 0 (0.0%) | 0 (0.0%) |
| 5:30 AM to 5:59 AM | 0 (0.0%) | 0 (0.0%) |
| 6:00 AM to 6:29 AM | 0 (0.0%) | 0 (0.0%) |
| 6:30 AM to 6:59 AM | 0 (0.0%) | 0 (0.0%) |
| 7:00 AM to 7:29 AM | 0 (0.0%) | 0 (0.0%) |
| 7:30 AM to 7:59 AM | 0 (0.0%) | 0 (0.0%) |
| 8:00 AM to 8:29 AM | 0 (0.0%) | 0 (0.0%) |
| 8:30 AM to 8:59 AM | 0 (0.0%) | 0 (0.0%) |
| 9:00 AM to 9:59 AM | 0 (0.0%) | 0 (0.0%) |
| 10:00 AM to 10:59 AM | 0 (0.0%) | 0 (0.0%) |
| 11:00 AM to 11:59 AM | 0 (0.0%) | 0 (0.0%) |
| 12:00 PM to 3:59 PM | 0 (0.0%) | 0 (0.0%) |
| 4:00 PM to 11:59 PM | 27 (100.0%) | 0 (0.0%) |
| Total | 27 (100.0%) | 0 (0.0%) |
Housing Occupancy in Spaulding
Occupancy by Ownership in Spaulding
Of the total 145 dwellings in Spaulding, owner-occupied units account for 145 (100.0%), while renter-occupied units make up 0 (0.0%).
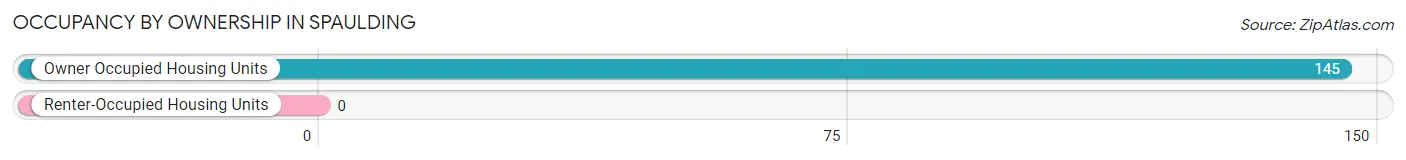
| Occupancy | # Housing Units | % Housing Units |
| Owner Occupied Housing Units | 145 | 100.0% |
| Renter-Occupied Housing Units | 0 | 0.0% |
| Total Occupied Housing Units | 145 | 100.0% |
Occupancy by Household Size in Spaulding
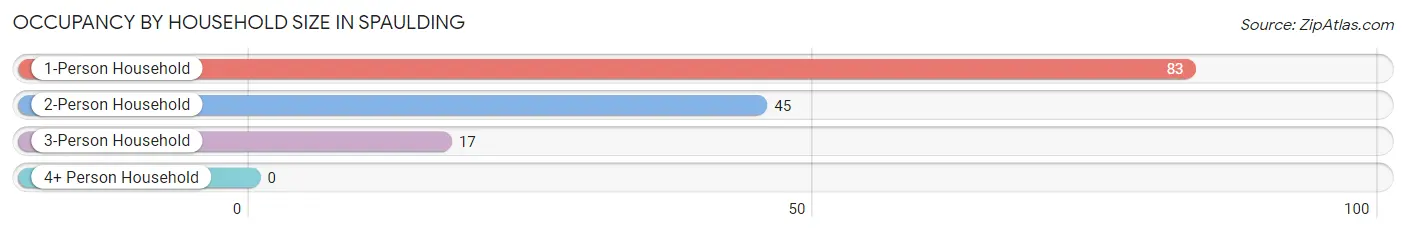
| Household Size | # Housing Units | % Housing Units |
| 1-Person Household | 83 | 57.2% |
| 2-Person Household | 45 | 31.0% |
| 3-Person Household | 17 | 11.7% |
| 4+ Person Household | 0 | 0.0% |
| Total Housing Units | 145 | 100.0% |
Occupancy by Ownership by Household Size in Spaulding
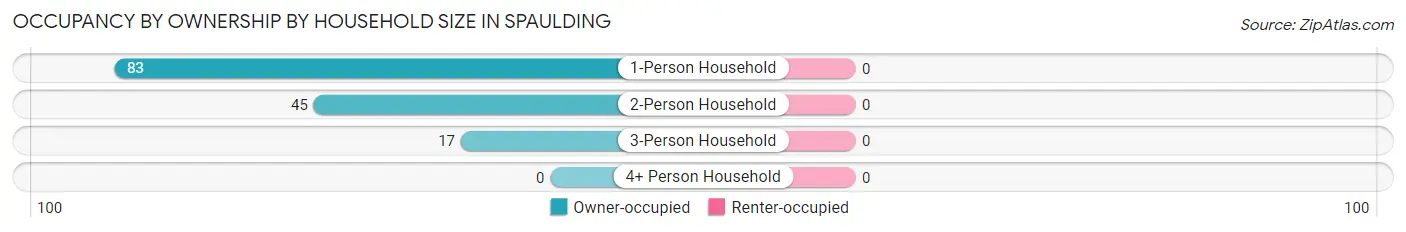
| Household Size | Owner-occupied | Renter-occupied |
| 1-Person Household | 83 (100.0%) | 0 (0.0%) |
| 2-Person Household | 45 (100.0%) | 0 (0.0%) |
| 3-Person Household | 17 (100.0%) | 0 (0.0%) |
| 4+ Person Household | 0 (0.0%) | 0 (0.0%) |
| Total Housing Units | 145 (100.0%) | 0 (0.0%) |
Occupancy by Educational Attainment in Spaulding
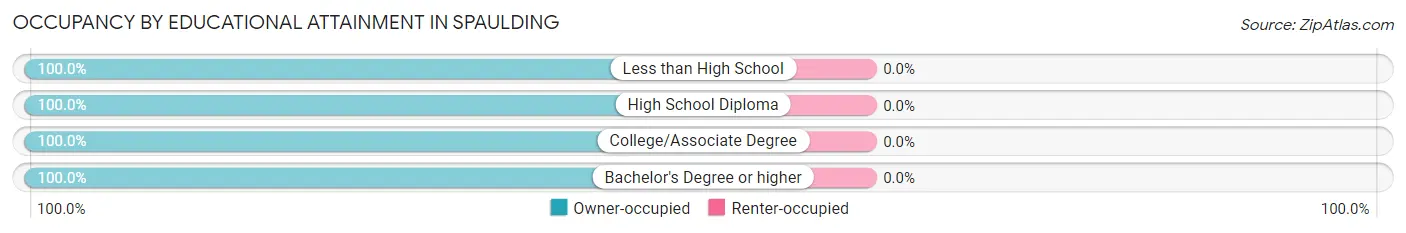
| Household Size | Owner-occupied | Renter-occupied |
| Less than High School | 26 (100.0%) | 0 (0.0%) |
| High School Diploma | 76 (100.0%) | 0 (0.0%) |
| College/Associate Degree | 20 (100.0%) | 0 (0.0%) |
| Bachelor's Degree or higher | 23 (100.0%) | 0 (0.0%) |
Occupancy by Age of Householder in Spaulding
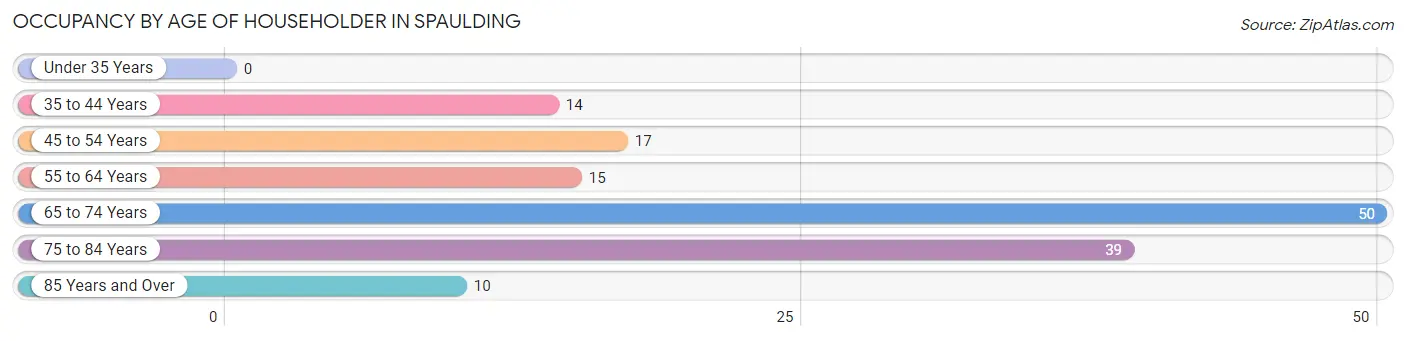
| Age Bracket | # Households | % Households |
| Under 35 Years | 0 | 0.0% |
| 35 to 44 Years | 14 | 9.7% |
| 45 to 54 Years | 17 | 11.7% |
| 55 to 64 Years | 15 | 10.3% |
| 65 to 74 Years | 50 | 34.5% |
| 75 to 84 Years | 39 | 26.9% |
| 85 Years and Over | 10 | 6.9% |
| Total | 145 | 100.0% |
Housing Finances in Spaulding
Median Income by Occupancy in Spaulding
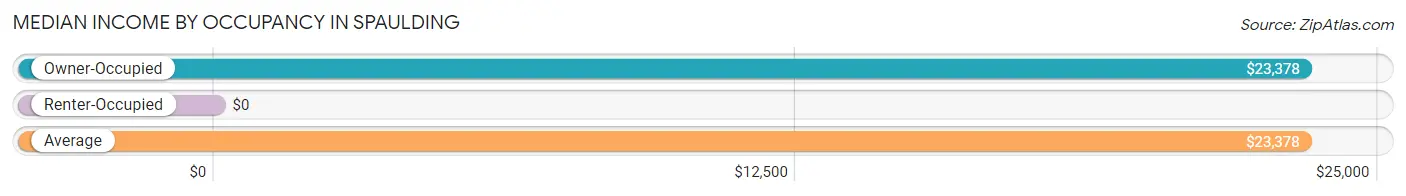
| Occupancy Type | # Households | Median Income |
| Owner-Occupied | 145 (100.0%) | $23,378 |
| Renter-Occupied | 0 (0.0%) | $0 |
| Average | 145 (100.0%) | $23,378 |
Occupancy by Householder Income Bracket in Spaulding
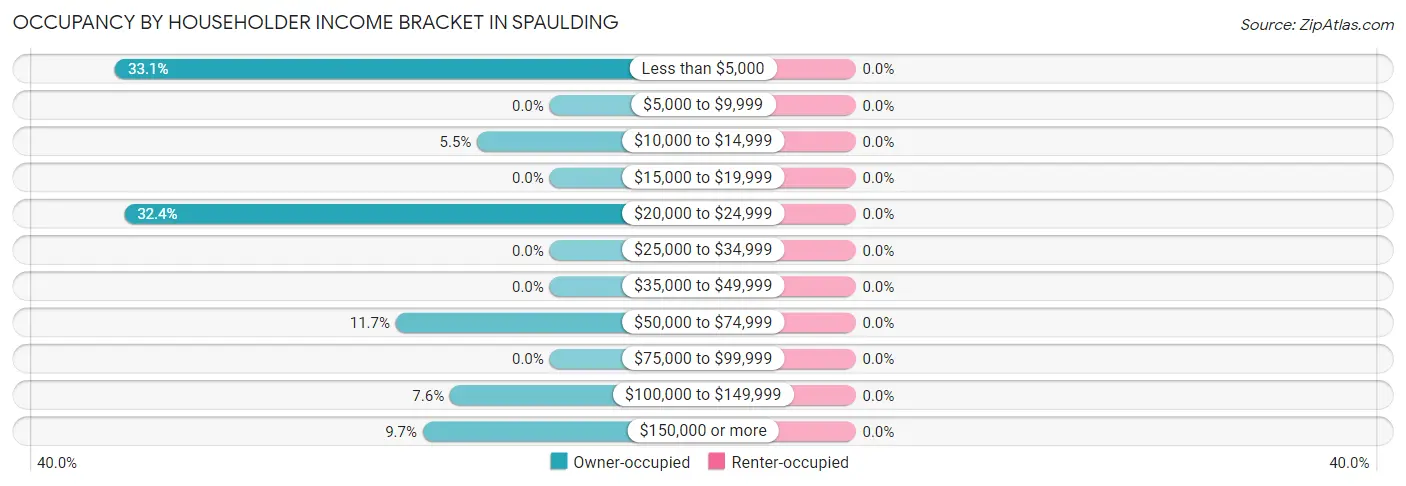
| Income Bracket | Owner-occupied | Renter-occupied |
| Less than $5,000 | 48 (33.1%) | 0 (0.0%) |
| $5,000 to $9,999 | 0 (0.0%) | 0 (0.0%) |
| $10,000 to $14,999 | 8 (5.5%) | 0 (0.0%) |
| $15,000 to $19,999 | 0 (0.0%) | 0 (0.0%) |
| $20,000 to $24,999 | 47 (32.4%) | 0 (0.0%) |
| $25,000 to $34,999 | 0 (0.0%) | 0 (0.0%) |
| $35,000 to $49,999 | 0 (0.0%) | 0 (0.0%) |
| $50,000 to $74,999 | 17 (11.7%) | 0 (0.0%) |
| $75,000 to $99,999 | 0 (0.0%) | 0 (0.0%) |
| $100,000 to $149,999 | 11 (7.6%) | 0 (0.0%) |
| $150,000 or more | 14 (9.7%) | 0 (0.0%) |
| Total | 145 (100.0%) | 0 (0.0%) |
Monthly Housing Cost Tiers in Spaulding
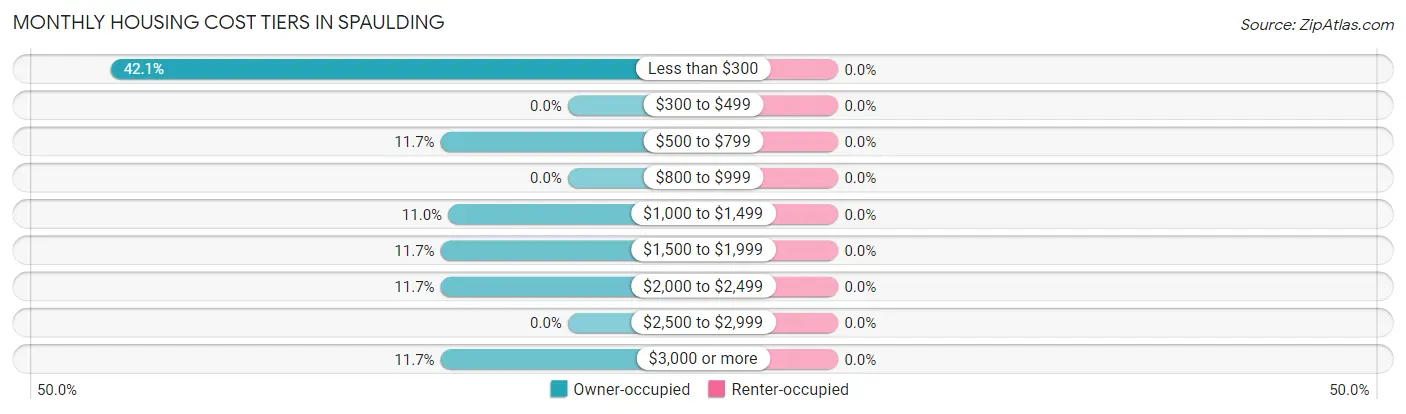
| Monthly Cost | Owner-occupied | Renter-occupied |
| Less than $300 | 61 (42.1%) | 0 (0.0%) |
| $300 to $499 | 0 (0.0%) | 0 (0.0%) |
| $500 to $799 | 17 (11.7%) | 0 (0.0%) |
| $800 to $999 | 0 (0.0%) | 0 (0.0%) |
| $1,000 to $1,499 | 16 (11.0%) | 0 (0.0%) |
| $1,500 to $1,999 | 17 (11.7%) | 0 (0.0%) |
| $2,000 to $2,499 | 17 (11.7%) | 0 (0.0%) |
| $2,500 to $2,999 | 0 (0.0%) | 0 (0.0%) |
| $3,000 or more | 17 (11.7%) | 0 (0.0%) |
| Total | 145 (100.0%) | 0 (0.0%) |
Physical Housing Characteristics in Spaulding
Housing Structures in Spaulding
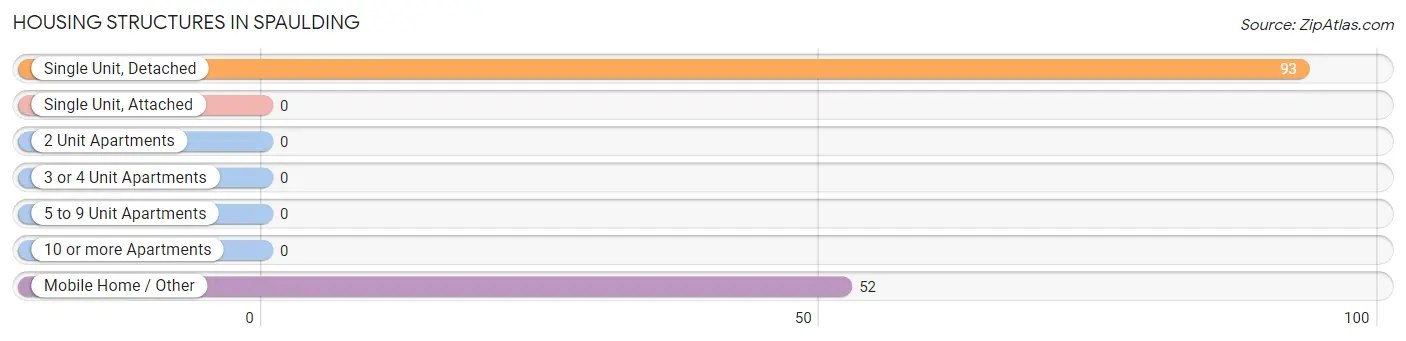
| Structure Type | # Housing Units | % Housing Units |
| Single Unit, Detached | 93 | 64.1% |
| Single Unit, Attached | 0 | 0.0% |
| 2 Unit Apartments | 0 | 0.0% |
| 3 or 4 Unit Apartments | 0 | 0.0% |
| 5 to 9 Unit Apartments | 0 | 0.0% |
| 10 or more Apartments | 0 | 0.0% |
| Mobile Home / Other | 52 | 35.9% |
| Total | 145 | 100.0% |
Housing Structures by Occupancy in Spaulding
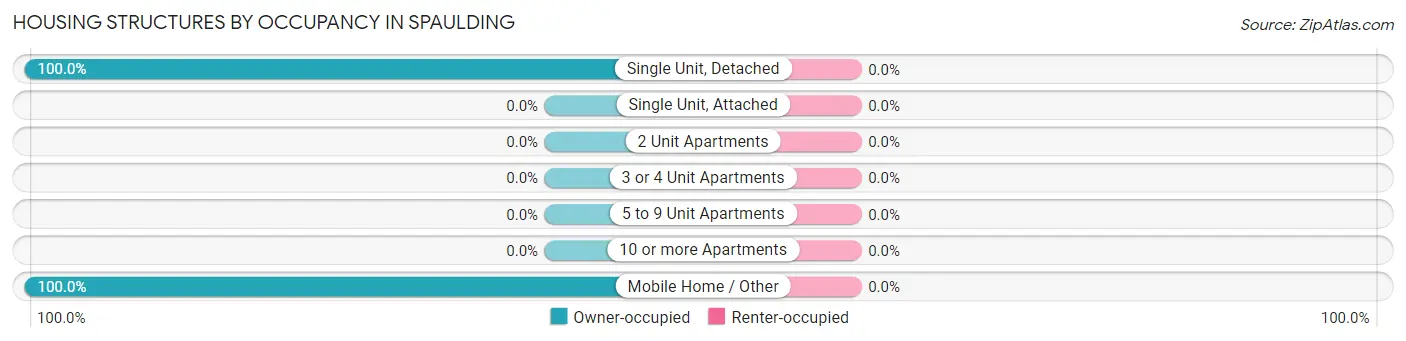
| Structure Type | Owner-occupied | Renter-occupied |
| Single Unit, Detached | 93 (100.0%) | 0 (0.0%) |
| Single Unit, Attached | 0 (0.0%) | 0 (0.0%) |
| 2 Unit Apartments | 0 (0.0%) | 0 (0.0%) |
| 3 or 4 Unit Apartments | 0 (0.0%) | 0 (0.0%) |
| 5 to 9 Unit Apartments | 0 (0.0%) | 0 (0.0%) |
| 10 or more Apartments | 0 (0.0%) | 0 (0.0%) |
| Mobile Home / Other | 52 (100.0%) | 0 (0.0%) |
| Total | 145 (100.0%) | 0 (0.0%) |
Housing Structures by Number of Rooms in Spaulding
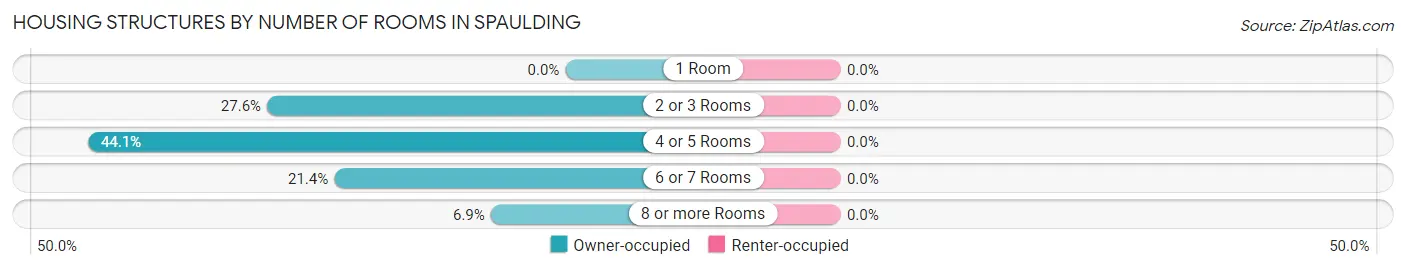
| Number of Rooms | Owner-occupied | Renter-occupied |
| 1 Room | 0 (0.0%) | 0 (0.0%) |
| 2 or 3 Rooms | 40 (27.6%) | 0 (0.0%) |
| 4 or 5 Rooms | 64 (44.1%) | 0 (0.0%) |
| 6 or 7 Rooms | 31 (21.4%) | 0 (0.0%) |
| 8 or more Rooms | 10 (6.9%) | 0 (0.0%) |
| Total | 145 (100.0%) | 0 (0.0%) |
Housing Structure by Heating Type in Spaulding
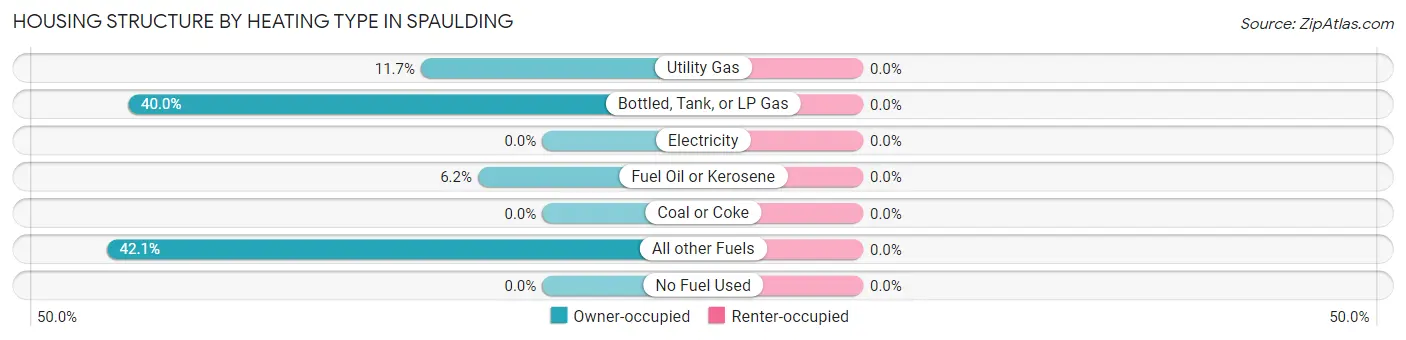
| Heating Type | Owner-occupied | Renter-occupied |
| Utility Gas | 17 (11.7%) | 0 (0.0%) |
| Bottled, Tank, or LP Gas | 58 (40.0%) | 0 (0.0%) |
| Electricity | 0 (0.0%) | 0 (0.0%) |
| Fuel Oil or Kerosene | 9 (6.2%) | 0 (0.0%) |
| Coal or Coke | 0 (0.0%) | 0 (0.0%) |
| All other Fuels | 61 (42.1%) | 0 (0.0%) |
| No Fuel Used | 0 (0.0%) | 0 (0.0%) |
| Total | 145 (100.0%) | 0 (0.0%) |
Household Vehicle Usage in Spaulding
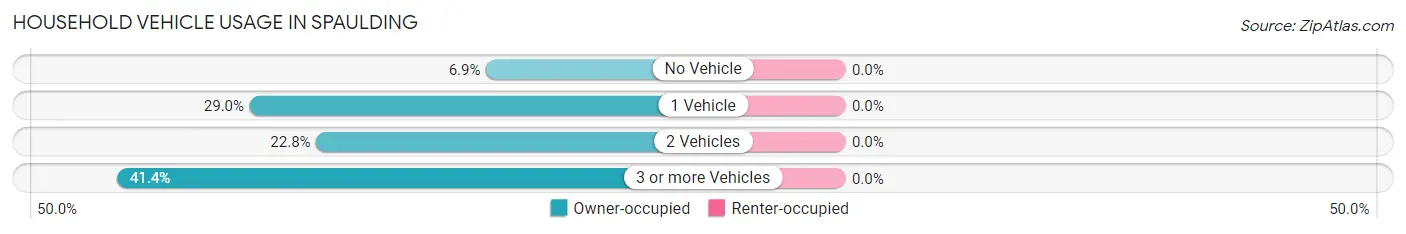
| Vehicles per Household | Owner-occupied | Renter-occupied |
| No Vehicle | 10 (6.9%) | 0 (0.0%) |
| 1 Vehicle | 42 (29.0%) | 0 (0.0%) |
| 2 Vehicles | 33 (22.8%) | 0 (0.0%) |
| 3 or more Vehicles | 60 (41.4%) | 0 (0.0%) |
| Total | 145 (100.0%) | 0 (0.0%) |
Real Estate & Mortgages in Spaulding
Real Estate and Mortgage Overview in Spaulding
| Characteristic | Without Mortgage | With Mortgage |
| Housing Units | 78 | 67 |
| Median Property Value | - | - |
| Median Household Income | - | - |
| Monthly Housing Costs | - | - |
| Real Estate Taxes | - | - |
Property Value by Mortgage Status in Spaulding
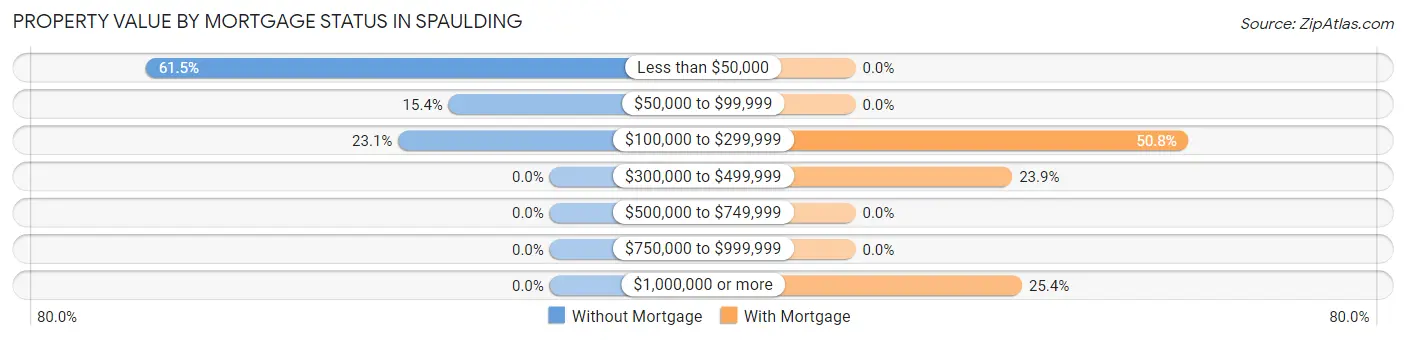
| Property Value | Without Mortgage | With Mortgage |
| Less than $50,000 | 48 (61.5%) | 0 (0.0%) |
| $50,000 to $99,999 | 12 (15.4%) | 0 (0.0%) |
| $100,000 to $299,999 | 18 (23.1%) | 34 (50.7%) |
| $300,000 to $499,999 | 0 (0.0%) | 16 (23.9%) |
| $500,000 to $749,999 | 0 (0.0%) | 0 (0.0%) |
| $750,000 to $999,999 | 0 (0.0%) | 0 (0.0%) |
| $1,000,000 or more | 0 (0.0%) | 17 (25.4%) |
| Total | 78 (100.0%) | 67 (100.0%) |
Household Income by Mortgage Status in Spaulding
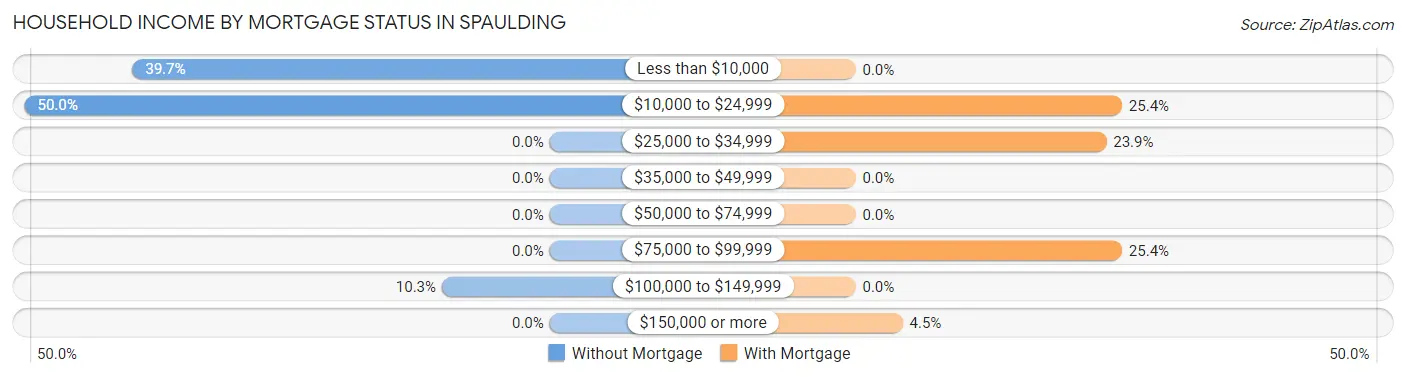
| Household Income | Without Mortgage | With Mortgage |
| Less than $10,000 | 31 (39.7%) | 0 (0.0%) |
| $10,000 to $24,999 | 39 (50.0%) | 17 (25.4%) |
| $25,000 to $34,999 | 0 (0.0%) | 16 (23.9%) |
| $35,000 to $49,999 | 0 (0.0%) | 0 (0.0%) |
| $50,000 to $74,999 | 0 (0.0%) | 0 (0.0%) |
| $75,000 to $99,999 | 0 (0.0%) | 17 (25.4%) |
| $100,000 to $149,999 | 8 (10.3%) | 0 (0.0%) |
| $150,000 or more | 0 (0.0%) | 3 (4.5%) |
| Total | 78 (100.0%) | 67 (100.0%) |
Property Value to Household Income Ratio in Spaulding
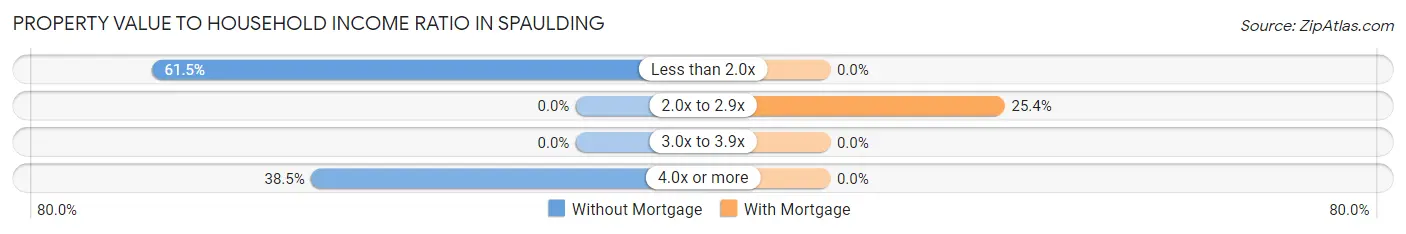
| Value-to-Income Ratio | Without Mortgage | With Mortgage |
| Less than 2.0x | 48 (61.5%) | 0 (0.0%) |
| 2.0x to 2.9x | 0 (0.0%) | 17 (25.4%) |
| 3.0x to 3.9x | 0 (0.0%) | 0 (0.0%) |
| 4.0x or more | 30 (38.5%) | 0 (0.0%) |
| Total | 78 (100.0%) | 67 (100.0%) |
Real Estate Taxes by Mortgage Status in Spaulding
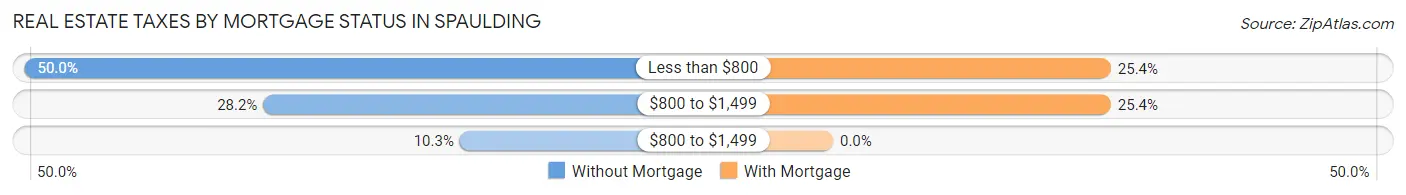
| Property Taxes | Without Mortgage | With Mortgage |
| Less than $800 | 39 (50.0%) | 17 (25.4%) |
| $800 to $1,499 | 22 (28.2%) | 17 (25.4%) |
| $800 to $1,499 | 8 (10.3%) | 0 (0.0%) |
| Total | 78 (100.0%) | 67 (100.0%) |
Health & Disability in Spaulding
Health Insurance Coverage by Age in Spaulding
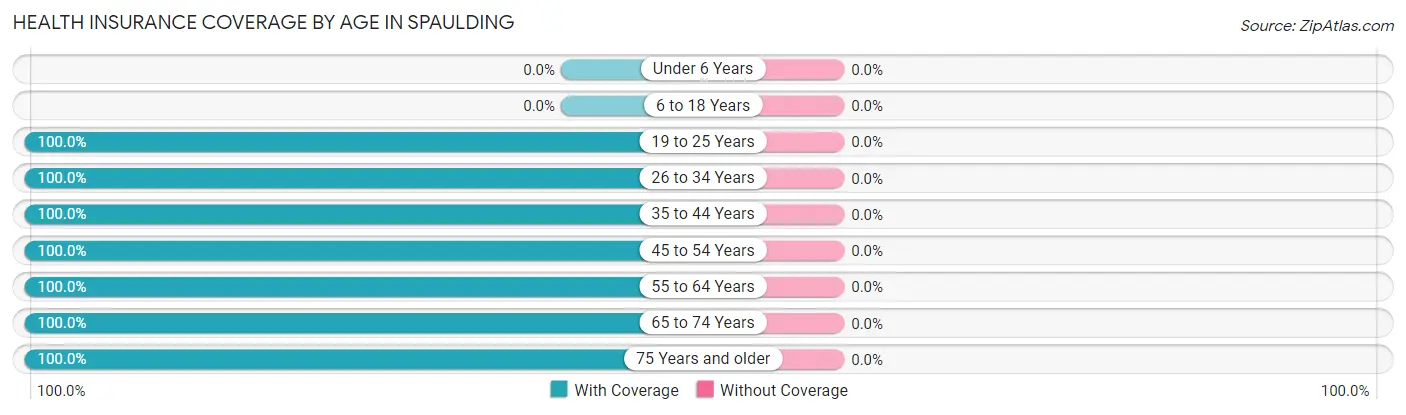
| Age Bracket | With Coverage | Without Coverage |
| Under 6 Years | 0 (0.0%) | 0 (0.0%) |
| 6 to 18 Years | 0 (0.0%) | 0 (0.0%) |
| 19 to 25 Years | 17 (100.0%) | 0 (0.0%) |
| 26 to 34 Years | 27 (100.0%) | 0 (0.0%) |
| 35 to 44 Years | 28 (100.0%) | 0 (0.0%) |
| 45 to 54 Years | 26 (100.0%) | 0 (0.0%) |
| 55 to 64 Years | 15 (100.0%) | 0 (0.0%) |
| 65 to 74 Years | 53 (100.0%) | 0 (0.0%) |
| 75 Years and older | 67 (100.0%) | 0 (0.0%) |
| Total | 233 (100.0%) | 0 (0.0%) |
Health Insurance Coverage by Citizenship Status in Spaulding
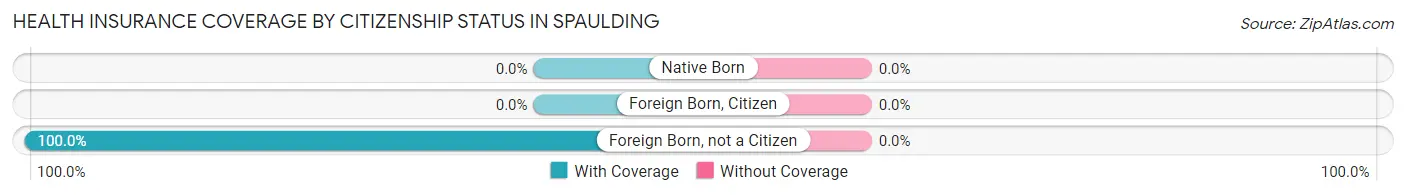
| Citizenship Status | With Coverage | Without Coverage |
| Native Born | 0 (0.0%) | 0 (0.0%) |
| Foreign Born, Citizen | 0 (0.0%) | 0 (0.0%) |
| Foreign Born, not a Citizen | 17 (100.0%) | 0 (0.0%) |
Health Insurance Coverage by Household Income in Spaulding
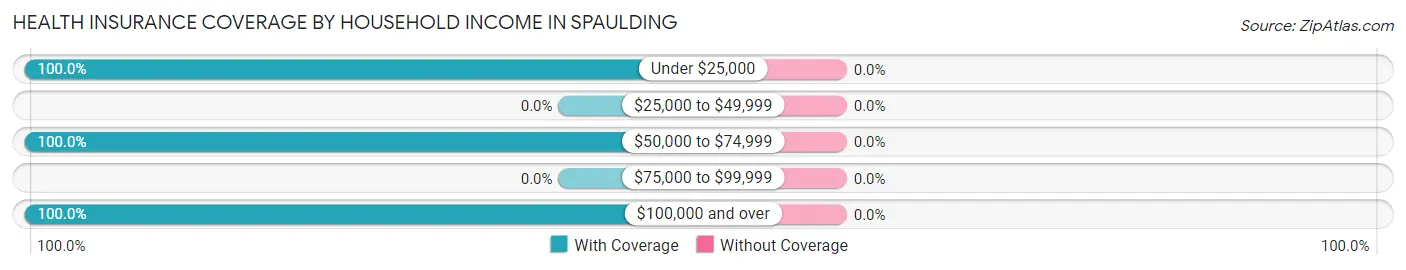
| Household Income | With Coverage | Without Coverage |
| Under $25,000 | 165 (100.0%) | 0 (0.0%) |
| $25,000 to $49,999 | 0 (0.0%) | 0 (0.0%) |
| $50,000 to $74,999 | 17 (100.0%) | 0 (0.0%) |
| $75,000 to $99,999 | 0 (0.0%) | 0 (0.0%) |
| $100,000 and over | 51 (100.0%) | 0 (0.0%) |
Public vs Private Health Insurance Coverage by Age in Spaulding
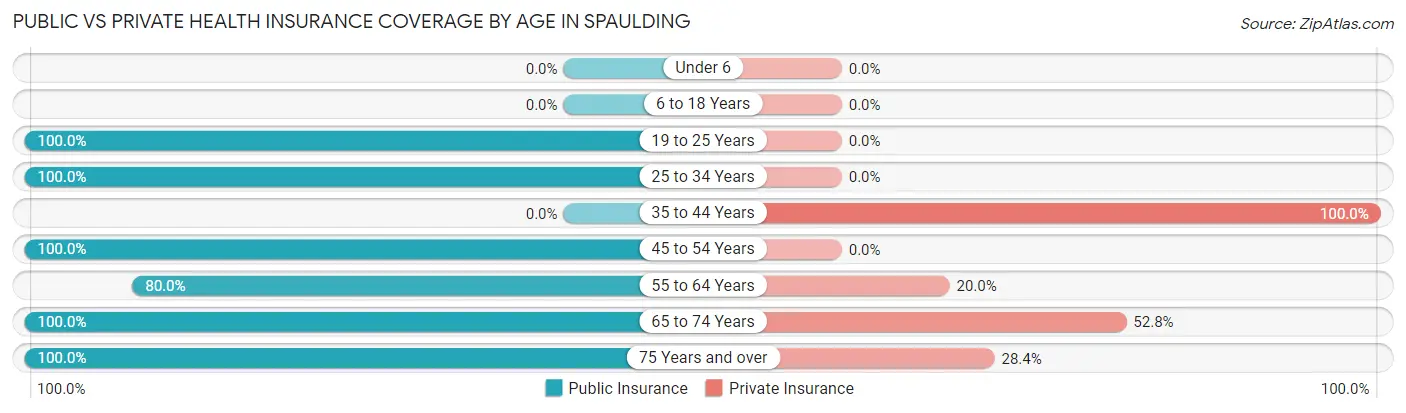
| Age Bracket | Public Insurance | Private Insurance |
| Under 6 | 0 (0.0%) | 0 (0.0%) |
| 6 to 18 Years | 0 (0.0%) | 0 (0.0%) |
| 19 to 25 Years | 17 (100.0%) | 0 (0.0%) |
| 25 to 34 Years | 27 (100.0%) | 0 (0.0%) |
| 35 to 44 Years | 0 (0.0%) | 28 (100.0%) |
| 45 to 54 Years | 26 (100.0%) | 0 (0.0%) |
| 55 to 64 Years | 12 (80.0%) | 3 (20.0%) |
| 65 to 74 Years | 53 (100.0%) | 28 (52.8%) |
| 75 Years and over | 67 (100.0%) | 19 (28.4%) |
| Total | 202 (86.7%) | 78 (33.5%) |
Disability Status by Sex by Age in Spaulding
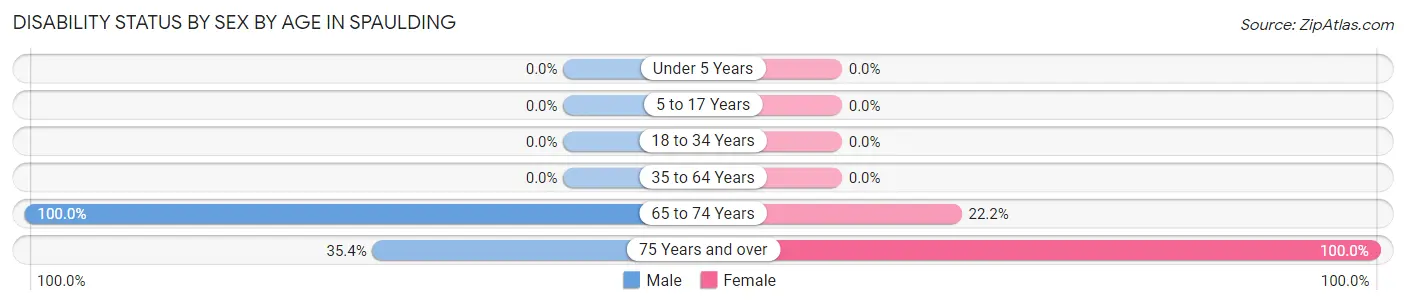
| Age Bracket | Male | Female |
| Under 5 Years | 0 (0.0%) | 0 (0.0%) |
| 5 to 17 Years | 0 (0.0%) | 0 (0.0%) |
| 18 to 34 Years | 0 (0.0%) | 0 (0.0%) |
| 35 to 64 Years | 0 (0.0%) | 0 (0.0%) |
| 65 to 74 Years | 17 (100.0%) | 8 (22.2%) |
| 75 Years and over | 17 (35.4%) | 19 (100.0%) |
Disability Class by Sex by Age in Spaulding
Disability Class: Hearing Difficulty
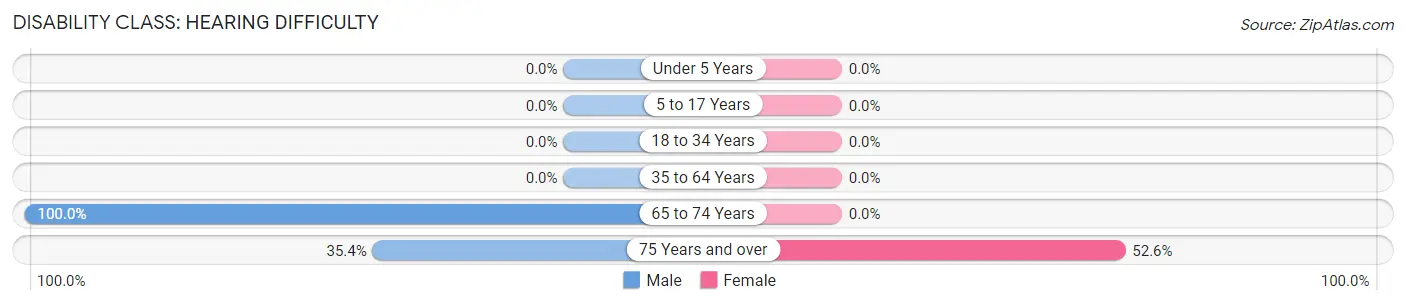
| Age Bracket | Male | Female |
| Under 5 Years | 0 (0.0%) | 0 (0.0%) |
| 5 to 17 Years | 0 (0.0%) | 0 (0.0%) |
| 18 to 34 Years | 0 (0.0%) | 0 (0.0%) |
| 35 to 64 Years | 0 (0.0%) | 0 (0.0%) |
| 65 to 74 Years | 17 (100.0%) | 0 (0.0%) |
| 75 Years and over | 17 (35.4%) | 10 (52.6%) |
Disability Class: Vision Difficulty
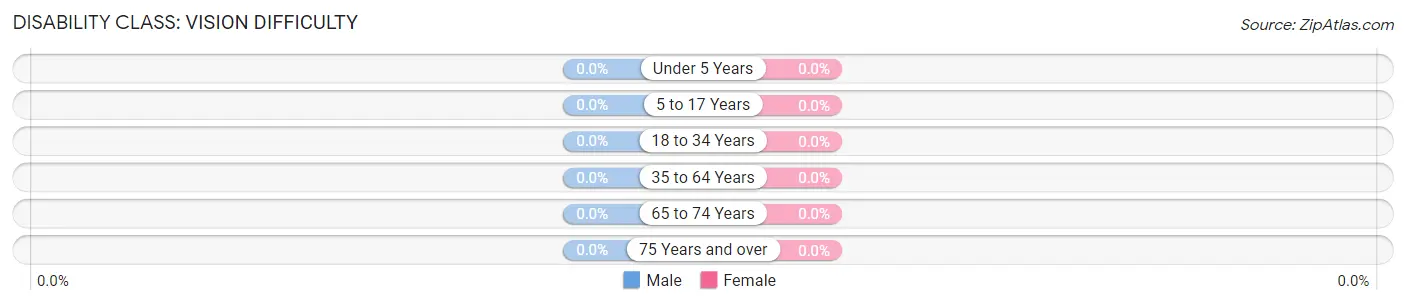
| Age Bracket | Male | Female |
| Under 5 Years | 0 (0.0%) | 0 (0.0%) |
| 5 to 17 Years | 0 (0.0%) | 0 (0.0%) |
| 18 to 34 Years | 0 (0.0%) | 0 (0.0%) |
| 35 to 64 Years | 0 (0.0%) | 0 (0.0%) |
| 65 to 74 Years | 0 (0.0%) | 0 (0.0%) |
| 75 Years and over | 0 (0.0%) | 0 (0.0%) |
Disability Class: Cognitive Difficulty
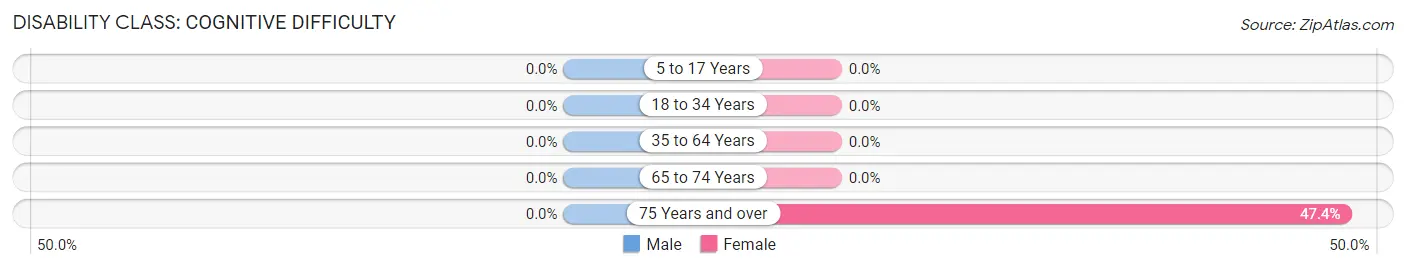
| Age Bracket | Male | Female |
| 5 to 17 Years | 0 (0.0%) | 0 (0.0%) |
| 18 to 34 Years | 0 (0.0%) | 0 (0.0%) |
| 35 to 64 Years | 0 (0.0%) | 0 (0.0%) |
| 65 to 74 Years | 0 (0.0%) | 0 (0.0%) |
| 75 Years and over | 0 (0.0%) | 9 (47.4%) |
Disability Class: Ambulatory Difficulty
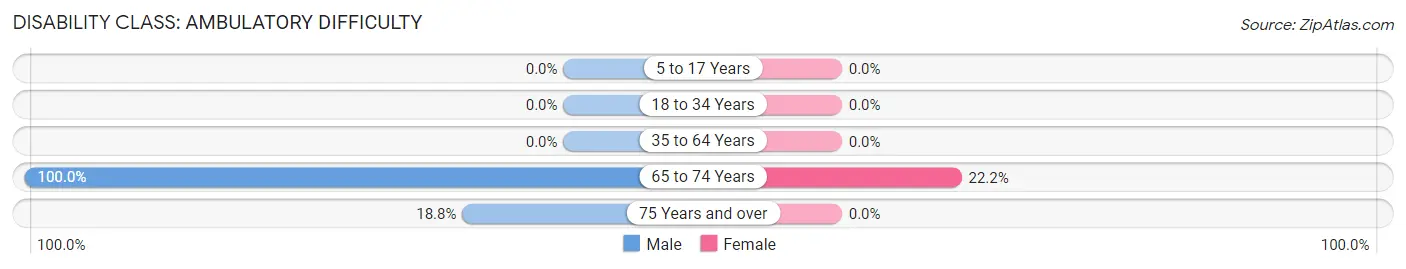
| Age Bracket | Male | Female |
| 5 to 17 Years | 0 (0.0%) | 0 (0.0%) |
| 18 to 34 Years | 0 (0.0%) | 0 (0.0%) |
| 35 to 64 Years | 0 (0.0%) | 0 (0.0%) |
| 65 to 74 Years | 17 (100.0%) | 8 (22.2%) |
| 75 Years and over | 9 (18.8%) | 0 (0.0%) |
Disability Class: Self-Care Difficulty
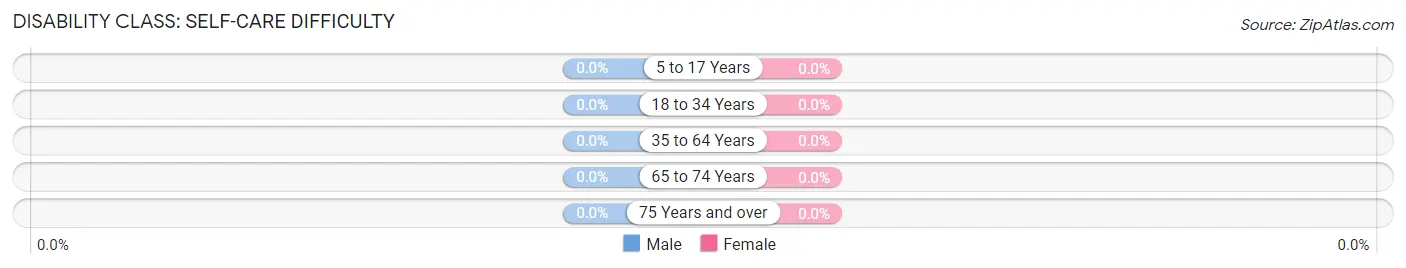
| Age Bracket | Male | Female |
| 5 to 17 Years | 0 (0.0%) | 0 (0.0%) |
| 18 to 34 Years | 0 (0.0%) | 0 (0.0%) |
| 35 to 64 Years | 0 (0.0%) | 0 (0.0%) |
| 65 to 74 Years | 0 (0.0%) | 0 (0.0%) |
| 75 Years and over | 0 (0.0%) | 0 (0.0%) |
Technology Access in Spaulding
Computing Device Access in Spaulding
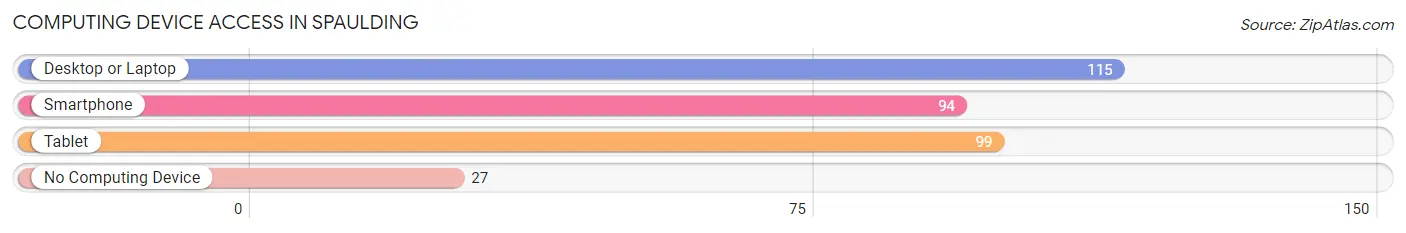
| Device Type | # Households | % Households |
| Desktop or Laptop | 115 | 79.3% |
| Smartphone | 94 | 64.8% |
| Tablet | 99 | 68.3% |
| No Computing Device | 27 | 18.6% |
| Total | 145 | 100.0% |
Internet Access in Spaulding
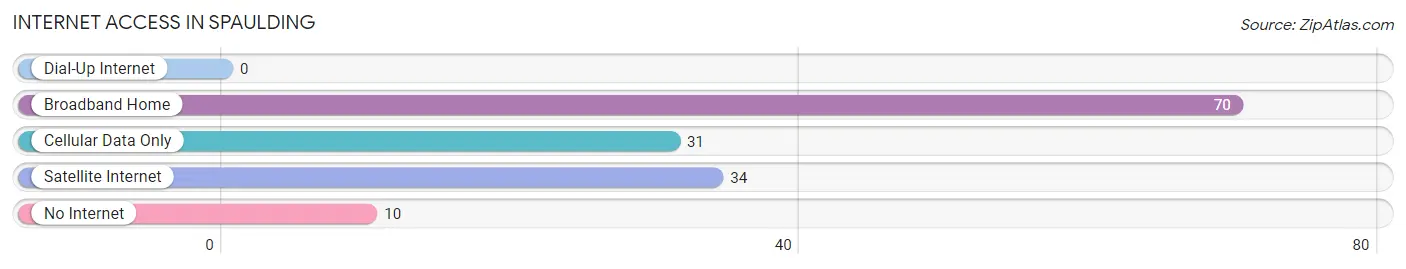
| Internet Type | # Households | % Households |
| Dial-Up Internet | 0 | 0.0% |
| Broadband Home | 70 | 48.3% |
| Cellular Data Only | 31 | 21.4% |
| Satellite Internet | 34 | 23.4% |
| No Internet | 10 | 6.9% |
| Total | 145 | 100.0% |
Spaulding Summary
Spaulding is a small unincorporated community located in the foothills of the Sierra Nevada Mountains in El Dorado County, California. It is situated at an elevation of 2,845 feet (867 m) and is located approximately 25 miles (40 km) east of Placerville. The population of Spaulding is estimated to be around 200 people.
History
The area that is now Spaulding was originally inhabited by the Miwok Native Americans. The first European settlers arrived in the area in the mid-1800s and began to establish farms and ranches. The town was named after the Spaulding family, who were among the first settlers in the area.
In the late 1800s, the town became a popular destination for tourists and outdoor enthusiasts. The area was known for its beautiful scenery and abundant wildlife. In the early 1900s, the town was home to a number of resorts and lodges, including the Spaulding Hotel, which was built in 1906.
Geography
Spaulding is located in the foothills of the Sierra Nevada Mountains in El Dorado County, California. It is situated at an elevation of 2,845 feet (867 m) and is located approximately 25 miles (40 km) east of Placerville. The town is surrounded by the Eldorado National Forest and is close to the South Fork of the American River.
The climate in Spaulding is typical of the Sierra Nevada Mountains, with hot summers and cold winters. The average high temperature in the summer is around 90°F (32°C) and the average low temperature in the winter is around 20°F (-7°C).
Economy
The economy of Spaulding is largely based on tourism and outdoor recreation. The town is home to a number of resorts and lodges, as well as several campgrounds. The area is popular with hikers, campers, and fishermen, and is also a popular destination for hunting and horseback riding.
The town is also home to a number of small businesses, including a general store, a gas station, and a post office. The town is also home to a number of restaurants and bars.
Demographics
The population of Spaulding is estimated to be around 200 people. The town is predominantly white, with a small Hispanic population. The median household income in Spaulding is around $50,000, and the median home value is around $250,000. The town has a low unemployment rate and a high rate of homeownership.
Conclusion
Spaulding is a small unincorporated community located in the foothills of the Sierra Nevada Mountains in El Dorado County, California. It is a popular destination for tourists and outdoor enthusiasts, and is home to a number of resorts and lodges. The economy of Spaulding is largely based on tourism and outdoor recreation, and the town is home to a number of small businesses. The population of Spaulding is estimated to be around 200 people, and the town is predominantly white, with a small Hispanic population.
Common Questions
What is Per Capita Income in Spaulding?
Per Capita income in Spaulding is $32,011.
What is the Median Household income in Spaulding?
Median Household Income in Spaulding is $23,378.
What is Inequality or Gini Index in Spaulding?
Inequality or Gini Index in Spaulding is 0.66.
What is the Total Population of Spaulding?
Total Population of Spaulding is 233.
What is the Total Male Population of Spaulding?
Total Male Population of Spaulding is 155.
What is the Total Female Population of Spaulding?
Total Female Population of Spaulding is 78.
What is the Ratio of Males per 100 Females in Spaulding?
There are 198.72 Males per 100 Females in Spaulding.
What is the Ratio of Females per 100 Males in Spaulding?
There are 50.32 Females per 100 Males in Spaulding.
What is the Median Population Age in Spaulding?
Median Population Age in Spaulding is 66.4 Years.
What is the Average Family Size in Spaulding
Average Family Size in Spaulding is 2.5 People.
What is the Average Household Size in Spaulding
Average Household Size in Spaulding is 1.6 People.
How Large is the Labor Force in Spaulding?
There are 98 People in the Labor Forcein in Spaulding.
What is the Percentage of People in the Labor Force in Spaulding?
42.1% of People are in the Labor Force in Spaulding.
What is the Unemployment Rate in Spaulding?
Unemployment Rate in Spaulding is 43.9%.