Foster City, CA Map & Demographics
Foster City Map
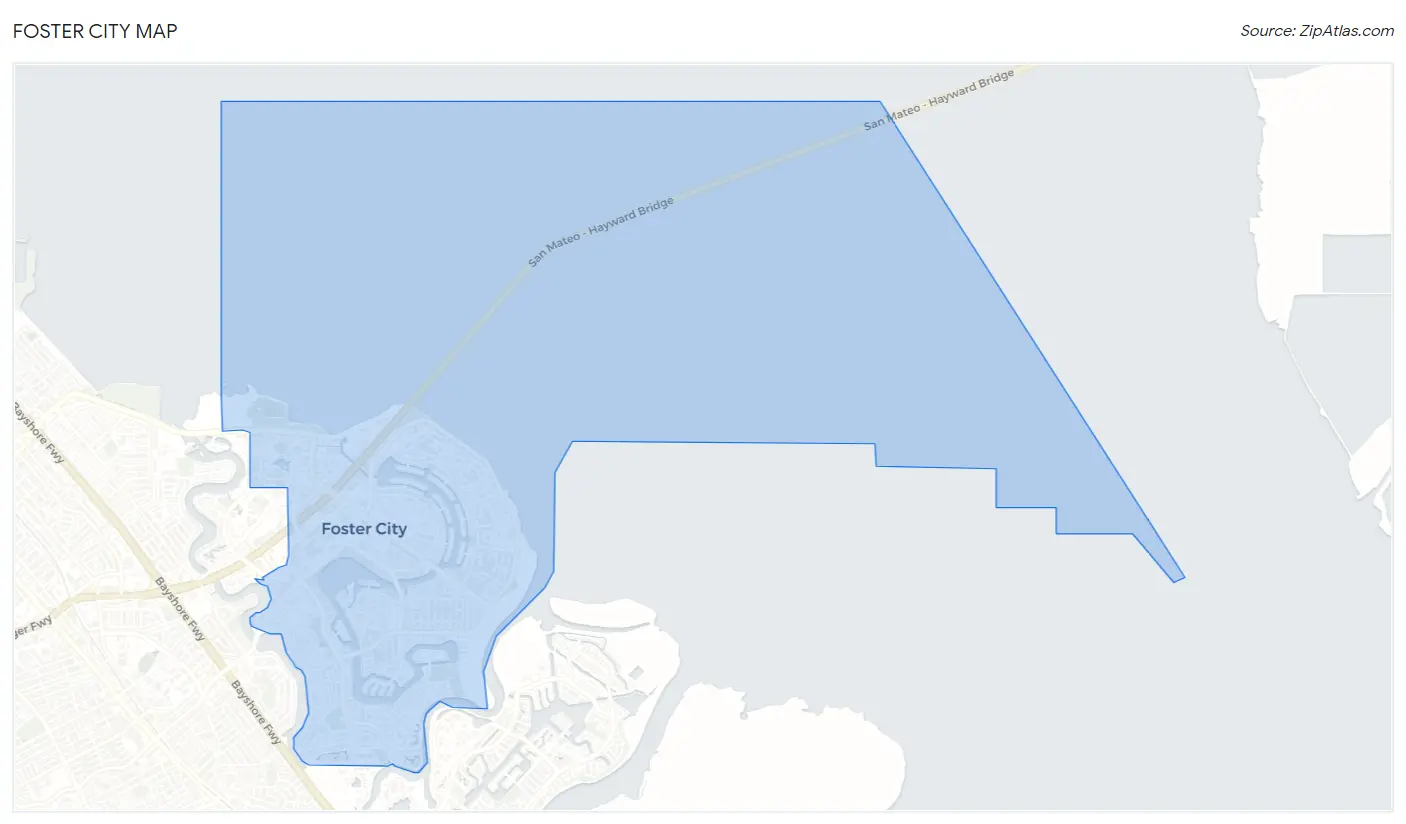
Foster City Overview
$91,552
PER CAPITA INCOME
$218,632
AVG FAMILY INCOME
$191,267
AVG HOUSEHOLD INCOME
25.3%
WAGE / INCOME GAP [ % ]
74.7¢/ $1
WAGE / INCOME GAP [ $ ]
0.42
INEQUALITY / GINI INDEX
33,215
TOTAL POPULATION
16,310
MALE POPULATION
16,905
FEMALE POPULATION
96.48
MALES / 100 FEMALES
103.65
FEMALES / 100 MALES
39.9
MEDIAN AGE
3.1
AVG FAMILY SIZE
2.6
AVG HOUSEHOLD SIZE
17,740
LABOR FORCE [ PEOPLE ]
66.5%
PERCENT IN LABOR FORCE
4.3%
UNEMPLOYMENT RATE
Foster City Area Codes
Income in Foster City
Income Overview in Foster City
Per Capita Income in Foster City is $91,552, while median incomes of families and households are $218,632 and $191,267 respectively.
| Characteristic | Number | Measure |
| Per Capita Income | 33,215 | $91,552 |
| Median Family Income | 8,827 | $218,632 |
| Mean Family Income | 8,827 | $266,930 |
| Median Household Income | 12,658 | $191,267 |
| Mean Household Income | 12,658 | $234,829 |
| Income Deficit | 8,827 | $0 |
| Wage / Income Gap (%) | 33,215 | 25.30% |
| Wage / Income Gap ($) | 33,215 | 74.70¢ per $1 |
| Gini / Inequality Index | 33,215 | 0.42 |
Earnings by Sex in Foster City
Average Earnings in Foster City are $116,929, $133,481 for men and $99,707 for women, a difference of 25.3%.
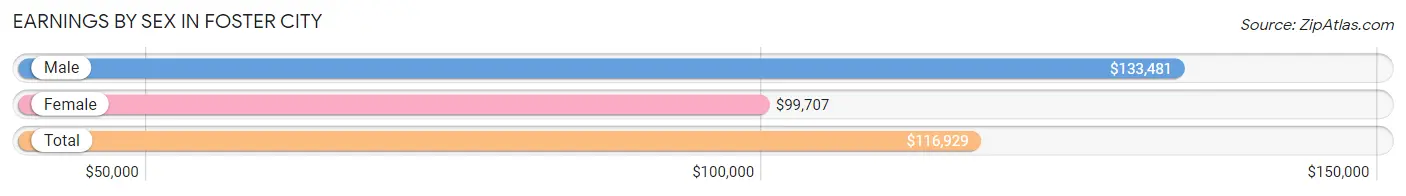
| Sex | Number | Average Earnings |
| Male | 9,935 (54.2%) | $133,481 |
| Female | 8,392 (45.8%) | $99,707 |
| Total | 18,327 (100.0%) | $116,929 |
Earnings by Sex by Income Bracket in Foster City
The most common earnings brackets in Foster City are $100,000+ for men (6,439 | 64.8%) and $100,000+ for women (4,185 | 49.9%).
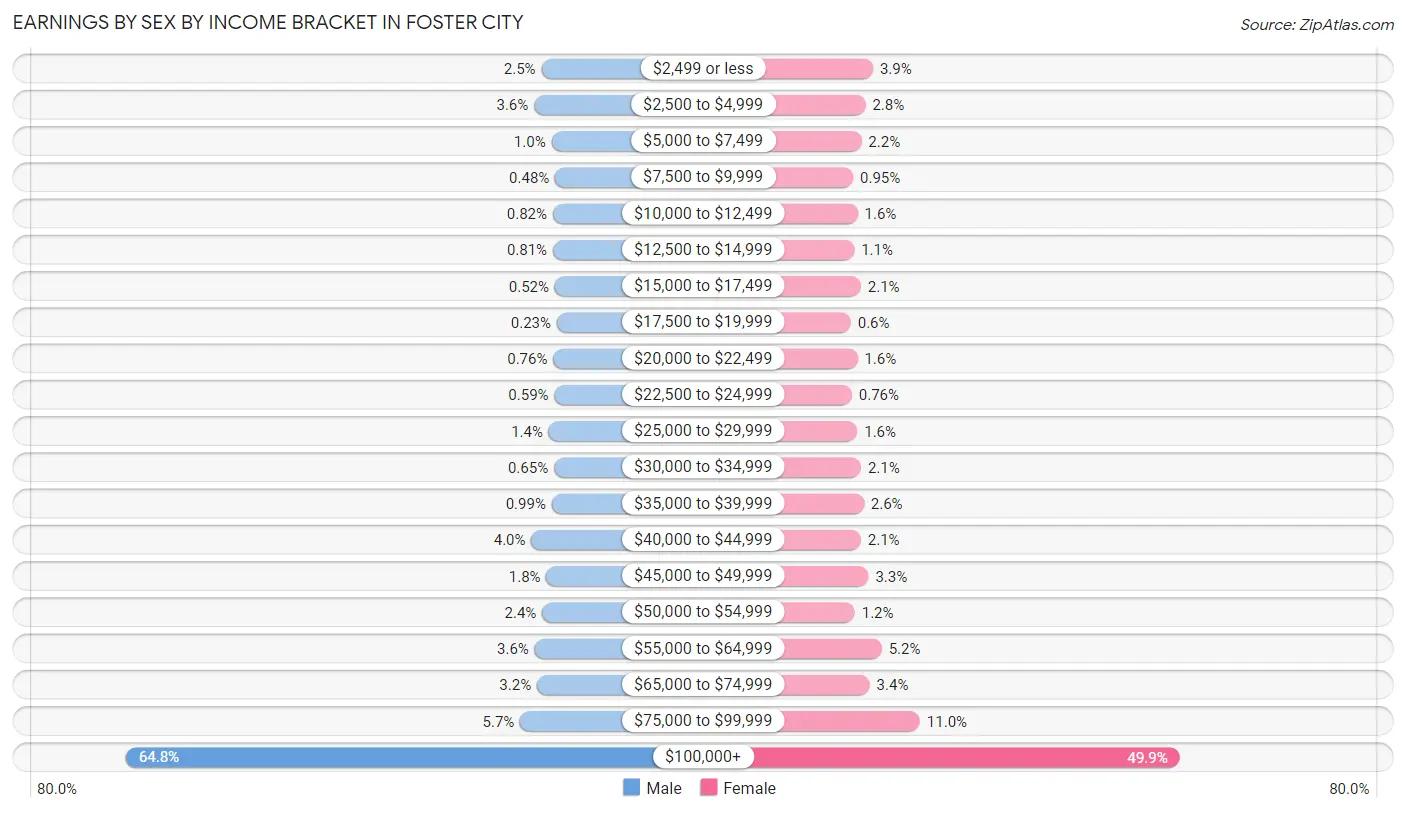
| Income | Male | Female |
| $2,499 or less | 251 (2.5%) | 329 (3.9%) |
| $2,500 to $4,999 | 361 (3.6%) | 235 (2.8%) |
| $5,000 to $7,499 | 102 (1.0%) | 184 (2.2%) |
| $7,500 to $9,999 | 48 (0.5%) | 80 (0.9%) |
| $10,000 to $12,499 | 81 (0.8%) | 136 (1.6%) |
| $12,500 to $14,999 | 80 (0.8%) | 93 (1.1%) |
| $15,000 to $17,499 | 52 (0.5%) | 177 (2.1%) |
| $17,500 to $19,999 | 23 (0.2%) | 50 (0.6%) |
| $20,000 to $22,499 | 76 (0.8%) | 134 (1.6%) |
| $22,500 to $24,999 | 59 (0.6%) | 64 (0.8%) |
| $25,000 to $29,999 | 142 (1.4%) | 132 (1.6%) |
| $30,000 to $34,999 | 65 (0.6%) | 179 (2.1%) |
| $35,000 to $39,999 | 98 (1.0%) | 215 (2.6%) |
| $40,000 to $44,999 | 401 (4.0%) | 177 (2.1%) |
| $45,000 to $49,999 | 178 (1.8%) | 273 (3.3%) |
| $50,000 to $54,999 | 240 (2.4%) | 101 (1.2%) |
| $55,000 to $64,999 | 353 (3.5%) | 440 (5.2%) |
| $65,000 to $74,999 | 318 (3.2%) | 288 (3.4%) |
| $75,000 to $99,999 | 568 (5.7%) | 920 (11.0%) |
| $100,000+ | 6,439 (64.8%) | 4,185 (49.9%) |
| Total | 9,935 (100.0%) | 8,392 (100.0%) |
Earnings by Sex by Educational Attainment in Foster City
Average earnings in Foster City are $140,996 for men and $107,686 for women, a difference of 23.6%. Men with an educational attainment of graduate degree enjoy the highest average annual earnings of $190,427, while those with less than high school education earn the least with $42,403. Women with an educational attainment of graduate degree earn the most with the average annual earnings of $132,371, while those with less than high school education have the smallest earnings of $13,566.
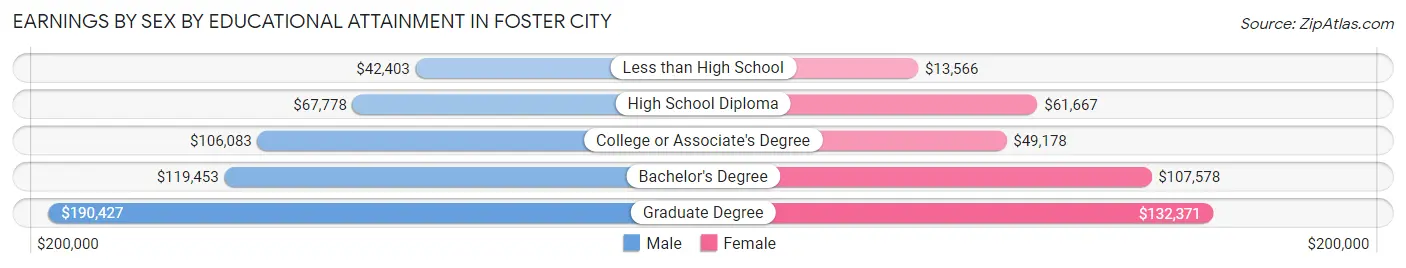
| Educational Attainment | Male Income | Female Income |
| Less than High School | $42,403 | $13,566 |
| High School Diploma | $67,778 | $61,667 |
| College or Associate's Degree | $106,083 | $49,178 |
| Bachelor's Degree | $119,453 | $107,578 |
| Graduate Degree | $190,427 | $132,371 |
| Total | $140,996 | $107,686 |
Family Income in Foster City
Family Income Brackets in Foster City
According to the Foster City family income data, there are 4,811 families falling into the $200,000+ income range, which is the most common income bracket and makes up 54.5% of all families. Conversely, the $10,000 to $14,999 income bracket is the least frequent group with only 26 families (0.3%) belonging to this category.
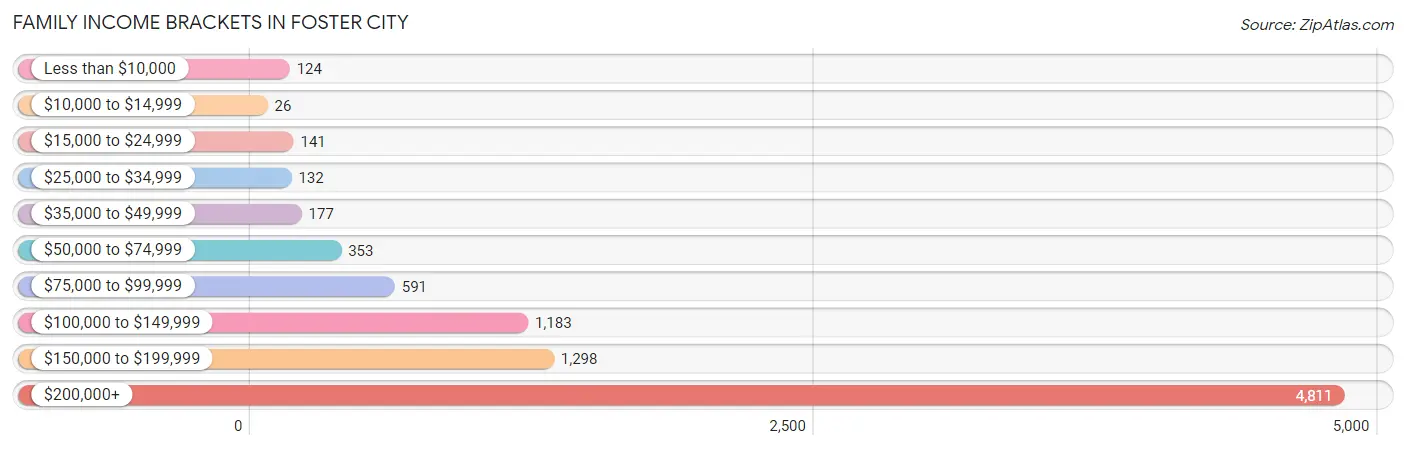
| Income Bracket | # Families | % Families |
| Less than $10,000 | 124 | 1.4% |
| $10,000 to $14,999 | 26 | 0.3% |
| $15,000 to $24,999 | 141 | 1.6% |
| $25,000 to $34,999 | 132 | 1.5% |
| $35,000 to $49,999 | 177 | 2.0% |
| $50,000 to $74,999 | 353 | 4.0% |
| $75,000 to $99,999 | 591 | 6.7% |
| $100,000 to $149,999 | 1,183 | 13.4% |
| $150,000 to $199,999 | 1,298 | 14.7% |
| $200,000+ | 4,811 | 54.5% |
Family Income by Famaliy Size in Foster City
4-person families (1,904 | 21.6%) account for the highest median family income in Foster City with $250,001 per family, while 2-person families (3,622 | 41.0%) have the highest median income of $87,875 per family member.
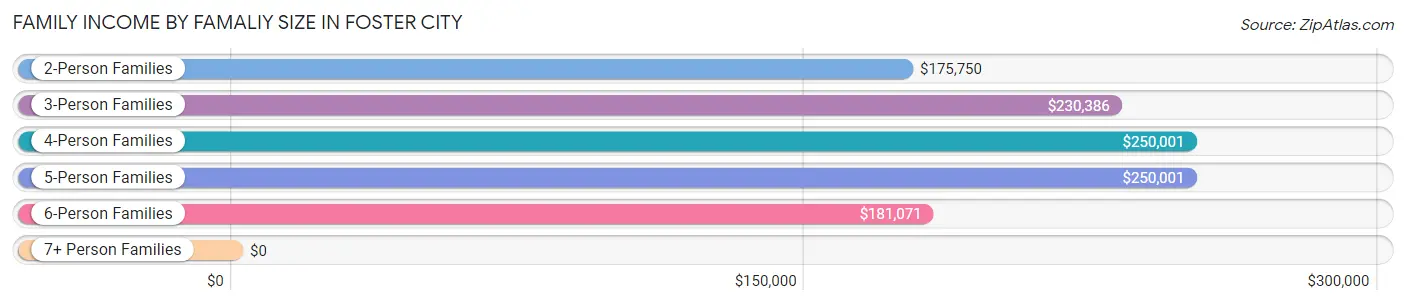
| Income Bracket | # Families | Median Income |
| 2-Person Families | 3,622 (41.0%) | $175,750 |
| 3-Person Families | 2,723 (30.8%) | $230,386 |
| 4-Person Families | 1,904 (21.6%) | $250,001 |
| 5-Person Families | 440 (5.0%) | $250,001 |
| 6-Person Families | 138 (1.6%) | $181,071 |
| 7+ Person Families | 0 (0.0%) | $0 |
| Total | 8,827 (100.0%) | $218,632 |
Family Income by Number of Earners in Foster City
The median family income in Foster City is $218,632, with families comprising 2 earners (4,185) having the highest median family income of $250,001, while families with no earners (936) have the lowest median family income of $92,750, accounting for 47.4% and 10.6% of families, respectively.
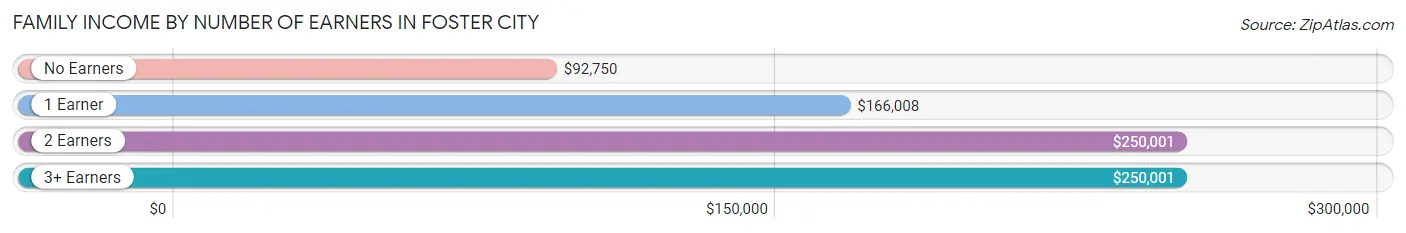
| Number of Earners | # Families | Median Income |
| No Earners | 936 (10.6%) | $92,750 |
| 1 Earner | 2,947 (33.4%) | $166,008 |
| 2 Earners | 4,185 (47.4%) | $250,001 |
| 3+ Earners | 759 (8.6%) | $250,001 |
| Total | 8,827 (100.0%) | $218,632 |
Household Income in Foster City
Household Income Brackets in Foster City
With 5,975 households falling in the category, the $200,000+ income range is the most frequent in Foster City, accounting for 47.2% of all households. In contrast, only 127 households (1.0%) fall into the $10,000 to $14,999 income bracket, making it the least populous group.
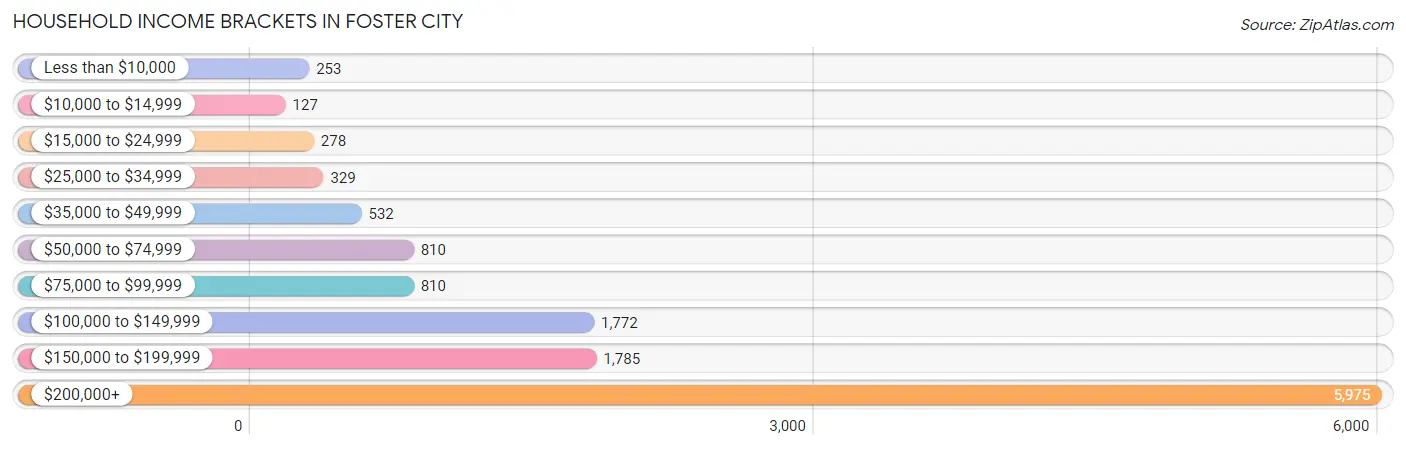
| Income Bracket | # Households | % Households |
| Less than $10,000 | 253 | 2.0% |
| $10,000 to $14,999 | 127 | 1.0% |
| $15,000 to $24,999 | 278 | 2.2% |
| $25,000 to $34,999 | 329 | 2.6% |
| $35,000 to $49,999 | 532 | 4.2% |
| $50,000 to $74,999 | 810 | 6.4% |
| $75,000 to $99,999 | 810 | 6.4% |
| $100,000 to $149,999 | 1,772 | 14.0% |
| $150,000 to $199,999 | 1,785 | 14.1% |
| $200,000+ | 5,975 | 47.2% |
Household Income by Householder Age in Foster City
The median household income in Foster City is $191,267, with the highest median household income of $231,830 found in the 25 to 44 years age bracket for the primary householder. A total of 5,140 households (40.6%) fall into this category. Meanwhile, the 15 to 24 years age bracket for the primary householder has the lowest median household income of $58,264, with 188 households (1.5%) in this group.
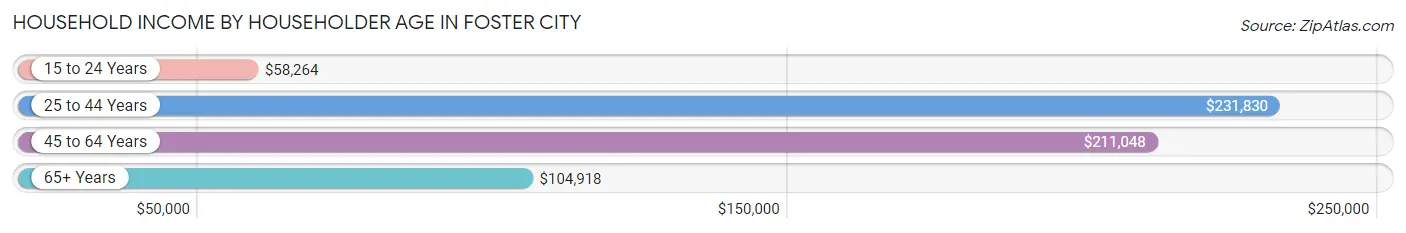
| Income Bracket | # Households | Median Income |
| 15 to 24 Years | 188 (1.5%) | $58,264 |
| 25 to 44 Years | 5,140 (40.6%) | $231,830 |
| 45 to 64 Years | 4,153 (32.8%) | $211,048 |
| 65+ Years | 3,177 (25.1%) | $104,918 |
| Total | 12,658 (100.0%) | $191,267 |
Poverty in Foster City
Income Below Poverty by Sex and Age in Foster City
With 3.4% poverty level for males and 4.1% for females among the residents of Foster City, 18 to 24 year old males and 16 and 17 year old females are the most vulnerable to poverty, with 62 males (8.9%) and 48 females (13.8%) in their respective age groups living below the poverty level.
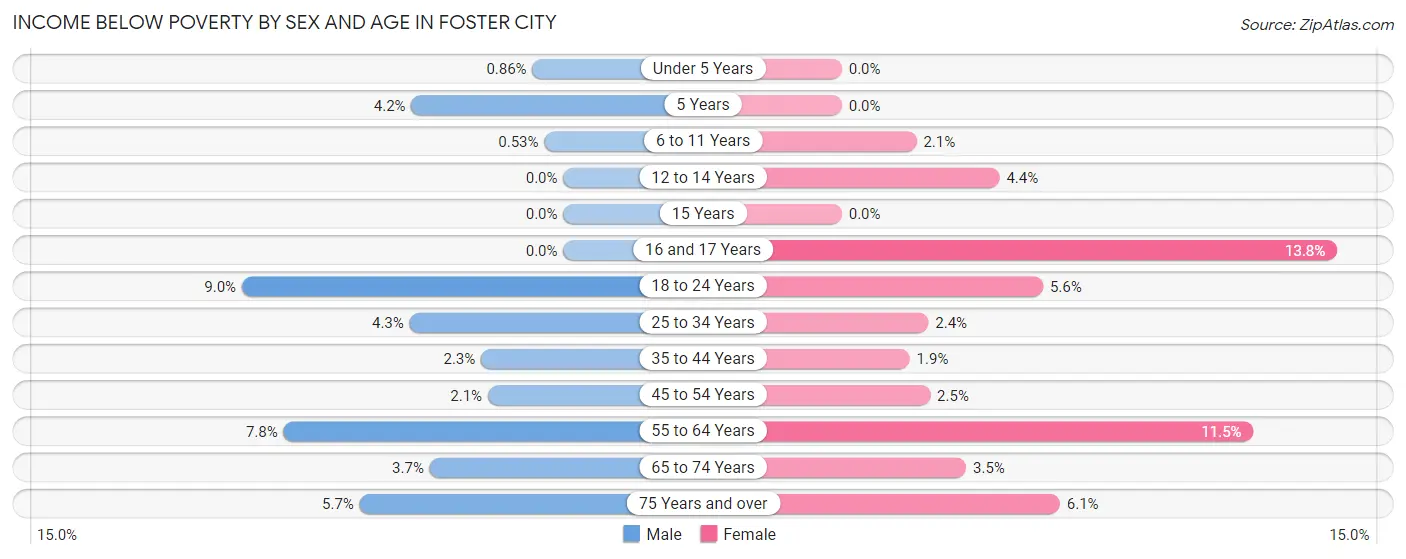
| Age Bracket | Male | Female |
| Under 5 Years | 8 (0.9%) | 0 (0.0%) |
| 5 Years | 9 (4.2%) | 0 (0.0%) |
| 6 to 11 Years | 7 (0.5%) | 26 (2.1%) |
| 12 to 14 Years | 0 (0.0%) | 26 (4.4%) |
| 15 Years | 0 (0.0%) | 0 (0.0%) |
| 16 and 17 Years | 0 (0.0%) | 48 (13.8%) |
| 18 to 24 Years | 62 (8.9%) | 44 (5.6%) |
| 25 to 34 Years | 111 (4.3%) | 55 (2.4%) |
| 35 to 44 Years | 67 (2.3%) | 52 (1.9%) |
| 45 to 54 Years | 41 (2.1%) | 54 (2.5%) |
| 55 to 64 Years | 130 (7.8%) | 217 (11.5%) |
| 65 to 74 Years | 50 (3.7%) | 51 (3.5%) |
| 75 Years and over | 73 (5.7%) | 112 (6.1%) |
| Total | 558 (3.4%) | 685 (4.1%) |
Income Above Poverty by Sex and Age in Foster City
According to the poverty statistics in Foster City, males aged 12 to 14 years and females aged under 5 years are the age groups that are most secure financially, with 100.0% of males and 100.0% of females in these age groups living above the poverty line.
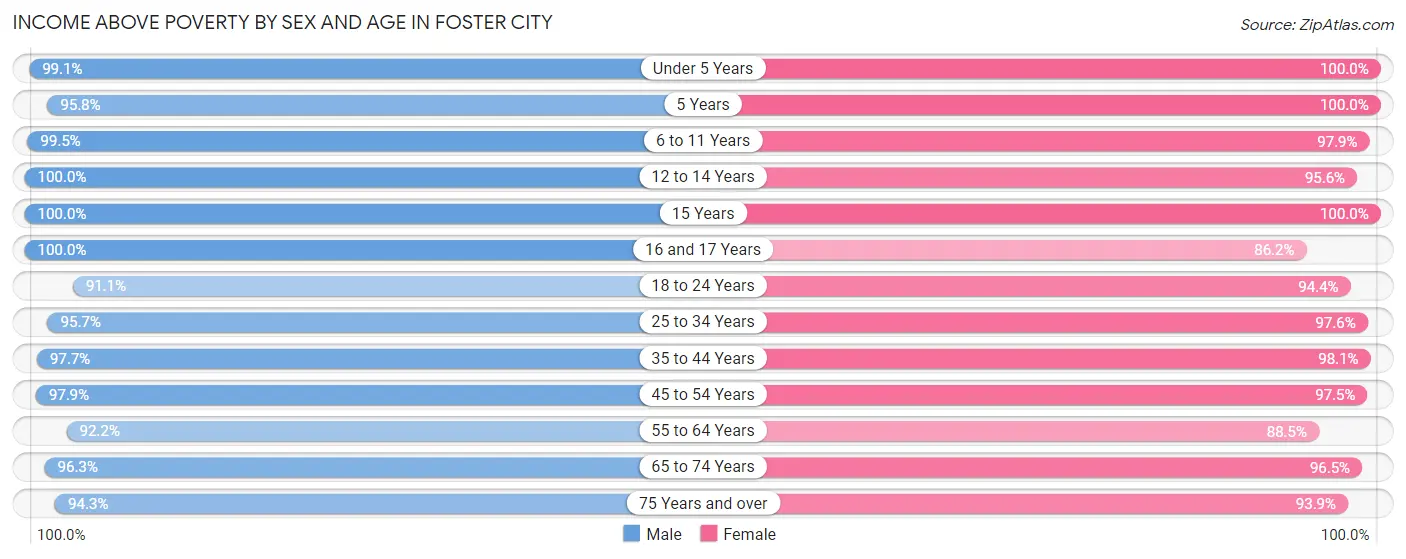
| Age Bracket | Male | Female |
| Under 5 Years | 923 (99.1%) | 919 (100.0%) |
| 5 Years | 204 (95.8%) | 225 (100.0%) |
| 6 to 11 Years | 1,326 (99.5%) | 1,223 (97.9%) |
| 12 to 14 Years | 560 (100.0%) | 566 (95.6%) |
| 15 Years | 138 (100.0%) | 162 (100.0%) |
| 16 and 17 Years | 571 (100.0%) | 300 (86.2%) |
| 18 to 24 Years | 631 (91.0%) | 742 (94.4%) |
| 25 to 34 Years | 2,481 (95.7%) | 2,228 (97.6%) |
| 35 to 44 Years | 2,859 (97.7%) | 2,700 (98.1%) |
| 45 to 54 Years | 1,909 (97.9%) | 2,139 (97.5%) |
| 55 to 64 Years | 1,539 (92.2%) | 1,676 (88.5%) |
| 65 to 74 Years | 1,293 (96.3%) | 1,421 (96.5%) |
| 75 Years and over | 1,215 (94.3%) | 1,734 (93.9%) |
| Total | 15,649 (96.6%) | 16,035 (95.9%) |
Income Below Poverty Among Married-Couple Families in Foster City
The poverty statistics for married-couple families in Foster City show that 2.8% or 205 of the total 7,428 families live below the poverty line. Families with 3 or 4 children have the highest poverty rate of 12.6%, comprising of 24 families. On the other hand, families with 1 or 2 children have the lowest poverty rate of 0.3%, which includes 11 families.
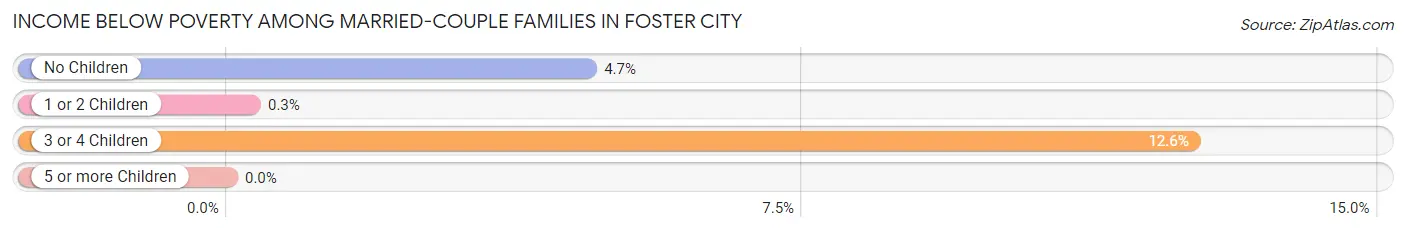
| Children | Above Poverty | Below Poverty |
| No Children | 3,455 (95.3%) | 170 (4.7%) |
| 1 or 2 Children | 3,601 (99.7%) | 11 (0.3%) |
| 3 or 4 Children | 167 (87.4%) | 24 (12.6%) |
| 5 or more Children | 0 (0.0%) | 0 (0.0%) |
| Total | 7,223 (97.2%) | 205 (2.8%) |
Income Below Poverty Among Single-Parent Households in Foster City
According to the poverty data in Foster City, 2.1% or 9 single-father households and 2.0% or 20 single-mother households are living below the poverty line. Among single-father households, those with 1 or 2 children have the highest poverty rate, with 9 households (6.5%) experiencing poverty. Likewise, among single-mother households, those with no children have the highest poverty rate, with 12 households (3.0%) falling below the poverty line.
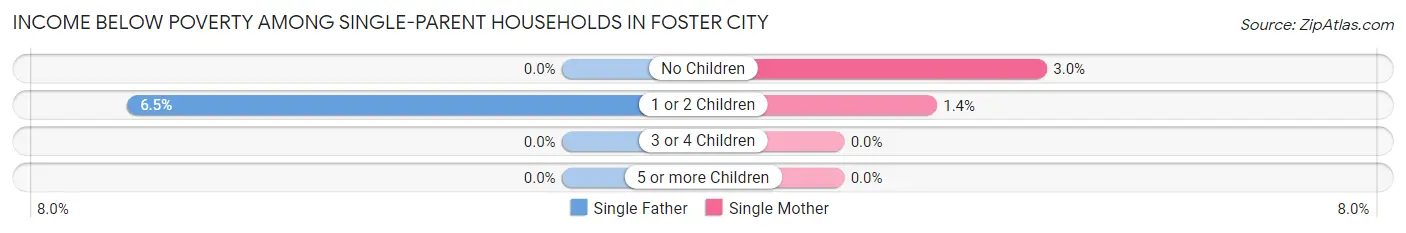
| Children | Single Father | Single Mother |
| No Children | 0 (0.0%) | 12 (3.0%) |
| 1 or 2 Children | 9 (6.5%) | 8 (1.4%) |
| 3 or 4 Children | 0 (0.0%) | 0 (0.0%) |
| 5 or more Children | 0 (0.0%) | 0 (0.0%) |
| Total | 9 (2.1%) | 20 (2.0%) |
Income Below Poverty Among Married-Couple vs Single-Parent Households in Foster City
The poverty data for Foster City shows that 205 of the married-couple family households (2.8%) and 29 of the single-parent households (2.1%) are living below the poverty level. Within the married-couple family households, those with 3 or 4 children have the highest poverty rate, with 24 households (12.6%) falling below the poverty line. Among the single-parent households, those with 1 or 2 children have the highest poverty rate, with 17 household (2.4%) living below poverty.
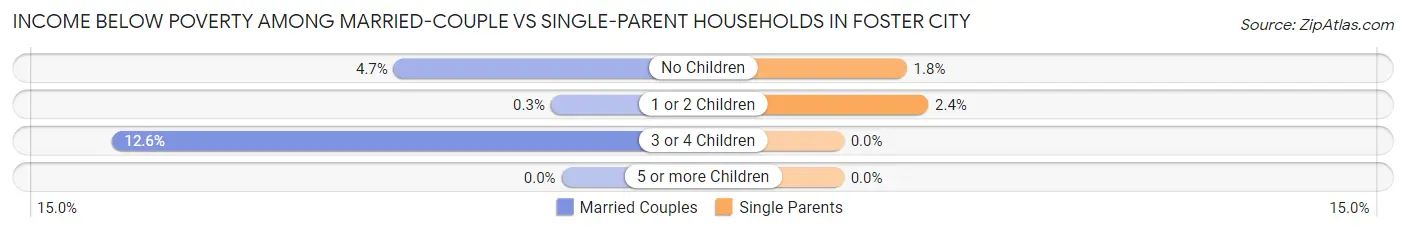
| Children | Married-Couple Families | Single-Parent Households |
| No Children | 170 (4.7%) | 12 (1.8%) |
| 1 or 2 Children | 11 (0.3%) | 17 (2.4%) |
| 3 or 4 Children | 24 (12.6%) | 0 (0.0%) |
| 5 or more Children | 0 (0.0%) | 0 (0.0%) |
| Total | 205 (2.8%) | 29 (2.1%) |
Race in Foster City
The most populous races in Foster City are Asian (17,636 | 53.1%), White / Caucasian (11,445 | 34.5%), and Two or more Races (2,727 | 8.2%).
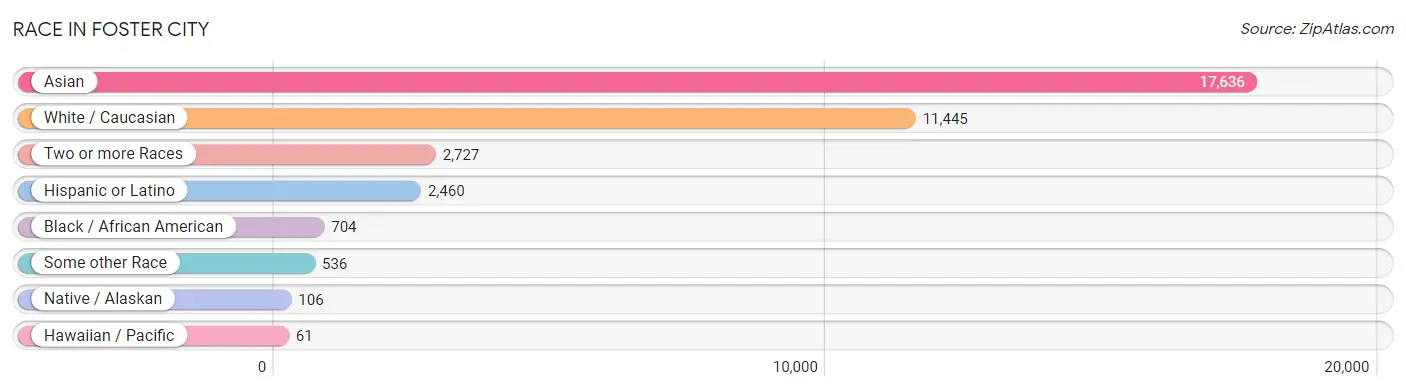
| Race | # Population | % Population |
| Asian | 17,636 | 53.1% |
| Black / African American | 704 | 2.1% |
| Hawaiian / Pacific | 61 | 0.2% |
| Hispanic or Latino | 2,460 | 7.4% |
| Native / Alaskan | 106 | 0.3% |
| White / Caucasian | 11,445 | 34.5% |
| Two or more Races | 2,727 | 8.2% |
| Some other Race | 536 | 1.6% |
| Total | 33,215 | 100.0% |
Ancestry in Foster City
The most populous ancestries reported in Foster City are Indian (Asian) (8,903 | 26.8%), Thai (4,877 | 14.7%), Korean (2,141 | 6.5%), German (1,633 | 4.9%), and English (1,541 | 4.6%), together accounting for 57.5% of all Foster City residents.
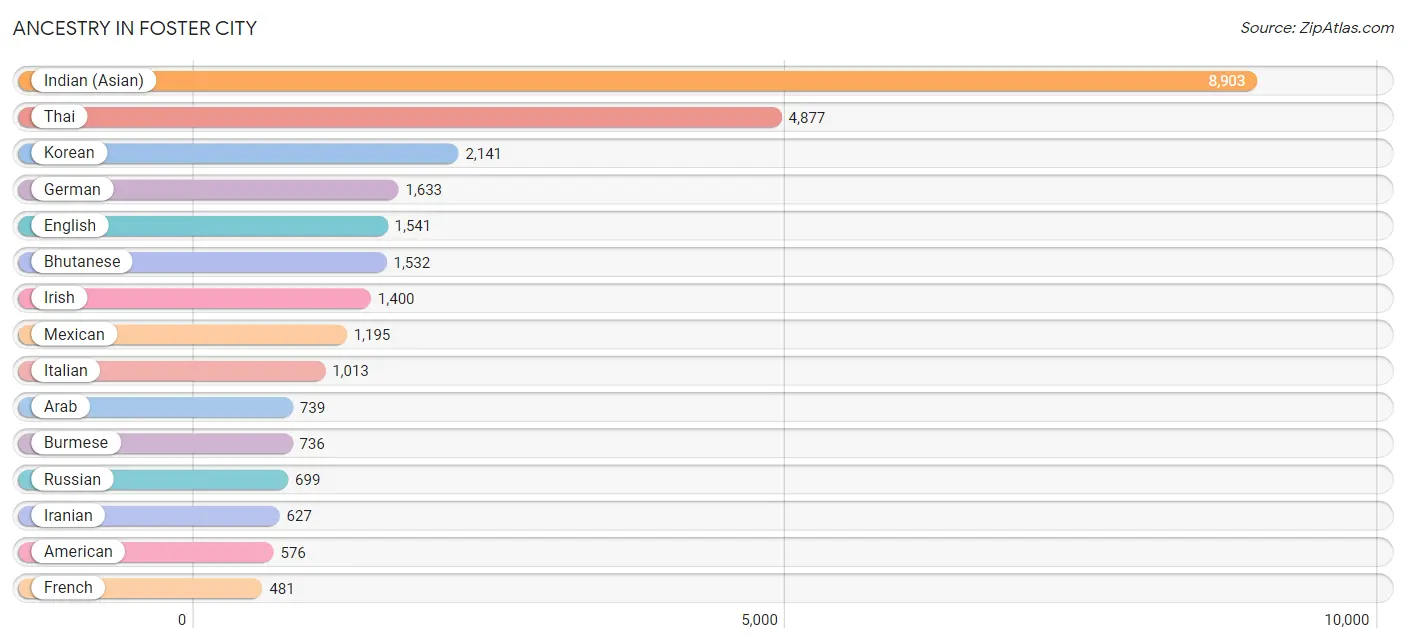
| Ancestry | # Population | % Population |
| African | 21 | 0.1% |
| Alaskan Athabascan | 11 | 0.0% |
| American | 576 | 1.7% |
| Arab | 739 | 2.2% |
| Argentinean | 16 | 0.1% |
| Armenian | 106 | 0.3% |
| Australian | 9 | 0.0% |
| Austrian | 109 | 0.3% |
| Basque | 17 | 0.1% |
| Belgian | 65 | 0.2% |
| Bhutanese | 1,532 | 4.6% |
| Brazilian | 103 | 0.3% |
| British | 202 | 0.6% |
| Burmese | 736 | 2.2% |
| Cajun | 7 | 0.0% |
| Cambodian | 66 | 0.2% |
| Canadian | 115 | 0.4% |
| Carpatho Rusyn | 9 | 0.0% |
| Central American | 477 | 1.4% |
| Chilean | 61 | 0.2% |
| Chippewa | 79 | 0.2% |
| Croatian | 14 | 0.0% |
| Cuban | 183 | 0.5% |
| Czech | 80 | 0.2% |
| Czechoslovakian | 16 | 0.1% |
| Danish | 45 | 0.1% |
| Dutch | 169 | 0.5% |
| Eastern European | 101 | 0.3% |
| Ecuadorian | 17 | 0.1% |
| Egyptian | 129 | 0.4% |
| English | 1,541 | 4.6% |
| European | 446 | 1.3% |
| Filipino | 445 | 1.3% |
| Finnish | 59 | 0.2% |
| French | 481 | 1.5% |
| French Canadian | 99 | 0.3% |
| German | 1,633 | 4.9% |
| Greek | 137 | 0.4% |
| Guamanian / Chamorro | 39 | 0.1% |
| Guatemalan | 187 | 0.6% |
| Hungarian | 189 | 0.6% |
| Indian (Asian) | 8,903 | 26.8% |
| Indonesian | 9 | 0.0% |
| Iranian | 627 | 1.9% |
| Iraqi | 28 | 0.1% |
| Irish | 1,400 | 4.2% |
| Israeli | 126 | 0.4% |
| Italian | 1,013 | 3.0% |
| Japanese | 89 | 0.3% |
| Jordanian | 32 | 0.1% |
| Korean | 2,141 | 6.5% |
| Laotian | 146 | 0.4% |
| Latvian | 29 | 0.1% |
| Lebanese | 12 | 0.0% |
| Lithuanian | 65 | 0.2% |
| Malaysian | 9 | 0.0% |
| Maltese | 18 | 0.1% |
| Mexican | 1,195 | 3.6% |
| Mexican American Indian | 23 | 0.1% |
| Moroccan | 7 | 0.0% |
| Native Hawaiian | 137 | 0.4% |
| New Zealander | 8 | 0.0% |
| Nicaraguan | 65 | 0.2% |
| Nigerian | 163 | 0.5% |
| Northern European | 34 | 0.1% |
| Norwegian | 46 | 0.1% |
| Pakistani | 90 | 0.3% |
| Palestinian | 133 | 0.4% |
| Panamanian | 32 | 0.1% |
| Peruvian | 82 | 0.3% |
| Polish | 397 | 1.2% |
| Portuguese | 266 | 0.8% |
| Pueblo | 11 | 0.0% |
| Puerto Rican | 81 | 0.2% |
| Romanian | 49 | 0.2% |
| Russian | 699 | 2.1% |
| Salvadoran | 163 | 0.5% |
| Scandinavian | 62 | 0.2% |
| Scotch-Irish | 184 | 0.5% |
| Scottish | 283 | 0.9% |
| Senegalese | 28 | 0.1% |
| Serbian | 24 | 0.1% |
| Slovak | 28 | 0.1% |
| South African | 7 | 0.0% |
| South American | 184 | 0.5% |
| South American Indian | 61 | 0.2% |
| Spaniard | 103 | 0.3% |
| Spanish | 125 | 0.4% |
| Spanish American | 24 | 0.1% |
| Sri Lankan | 438 | 1.3% |
| Subsaharan African | 318 | 1.0% |
| Swedish | 326 | 1.0% |
| Swiss | 13 | 0.0% |
| Syrian | 7 | 0.0% |
| Thai | 4,877 | 14.7% |
| Tongan | 20 | 0.1% |
| Turkish | 68 | 0.2% |
| Ukrainian | 158 | 0.5% |
| Vietnamese | 18 | 0.1% |
| Welsh | 49 | 0.2% |
| Yaqui | 21 | 0.1% |
| Yugoslavian | 9 | 0.0% | View All 102 Rows |
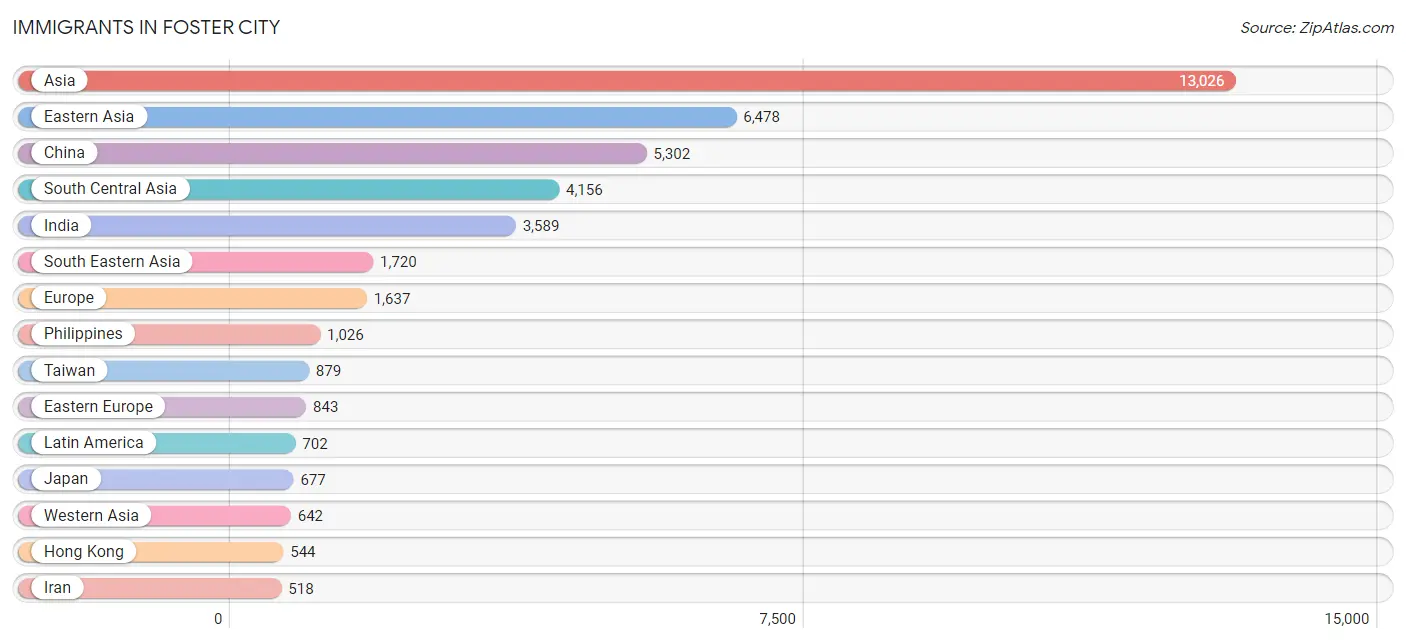
Immigrants in Foster City
The most numerous immigrant groups reported in Foster City came from Asia (13,026 | 39.2%), Eastern Asia (6,478 | 19.5%), China (5,302 | 16.0%), South Central Asia (4,156 | 12.5%), and India (3,589 | 10.8%), together accounting for 98.0% of all Foster City residents.
| Immigration Origin | # Population | % Population |
| Africa | 390 | 1.2% |
| Argentina | 8 | 0.0% |
| Asia | 13,026 | 39.2% |
| Australia | 10 | 0.0% |
| Bangladesh | 9 | 0.0% |
| Belarus | 89 | 0.3% |
| Belgium | 61 | 0.2% |
| Bosnia and Herzegovina | 9 | 0.0% |
| Brazil | 122 | 0.4% |
| Cambodia | 80 | 0.2% |
| Canada | 118 | 0.4% |
| Caribbean | 22 | 0.1% |
| Central America | 406 | 1.2% |
| Chile | 62 | 0.2% |
| China | 5,302 | 16.0% |
| Colombia | 11 | 0.0% |
| Croatia | 8 | 0.0% |
| Cuba | 22 | 0.1% |
| Denmark | 11 | 0.0% |
| Eastern Africa | 72 | 0.2% |
| Eastern Asia | 6,478 | 19.5% |
| Eastern Europe | 843 | 2.5% |
| Ecuador | 25 | 0.1% |
| Egypt | 138 | 0.4% |
| El Salvador | 156 | 0.5% |
| England | 175 | 0.5% |
| Europe | 1,637 | 4.9% |
| Fiji | 17 | 0.1% |
| France | 44 | 0.1% |
| Germany | 170 | 0.5% |
| Greece | 29 | 0.1% |
| Guatemala | 12 | 0.0% |
| Hong Kong | 544 | 1.6% |
| Hungary | 75 | 0.2% |
| India | 3,589 | 10.8% |
| Indonesia | 150 | 0.4% |
| Iran | 518 | 1.6% |
| Israel | 157 | 0.5% |
| Italy | 13 | 0.0% |
| Japan | 677 | 2.0% |
| Jordan | 79 | 0.2% |
| Korea | 467 | 1.4% |
| Kuwait | 45 | 0.1% |
| Latin America | 702 | 2.1% |
| Latvia | 27 | 0.1% |
| Lebanon | 52 | 0.2% |
| Malaysia | 12 | 0.0% |
| Mexico | 238 | 0.7% |
| Middle Africa | 17 | 0.1% |
| Netherlands | 54 | 0.2% |
| Nigeria | 119 | 0.4% |
| Northern Africa | 154 | 0.5% |
| Northern Europe | 353 | 1.1% |
| Oceania | 56 | 0.2% |
| Pakistan | 40 | 0.1% |
| Peru | 34 | 0.1% |
| Philippines | 1,026 | 3.1% |
| Poland | 50 | 0.2% |
| Portugal | 24 | 0.1% |
| Romania | 8 | 0.0% |
| Russia | 354 | 1.1% |
| Saudi Arabia | 159 | 0.5% |
| Senegal | 21 | 0.1% |
| Serbia | 34 | 0.1% |
| Singapore | 138 | 0.4% |
| South Africa | 7 | 0.0% |
| South America | 274 | 0.8% |
| South Central Asia | 4,156 | 12.5% |
| South Eastern Asia | 1,720 | 5.2% |
| Southern Europe | 104 | 0.3% |
| Spain | 23 | 0.1% |
| Sweden | 56 | 0.2% |
| Syria | 18 | 0.1% |
| Taiwan | 879 | 2.6% |
| Thailand | 24 | 0.1% |
| Turkey | 132 | 0.4% |
| Ukraine | 81 | 0.2% |
| Vietnam | 267 | 0.8% |
| Western Africa | 140 | 0.4% |
| Western Asia | 642 | 1.9% |
| Western Europe | 337 | 1.0% |
| Zaire | 17 | 0.1% | View All 82 Rows |
Sex and Age in Foster City
Sex and Age in Foster City
The most populous age groups in Foster City are 40 to 44 Years (1,553 | 9.5%) for men and 30 to 34 Years (1,497 | 8.9%) for women.
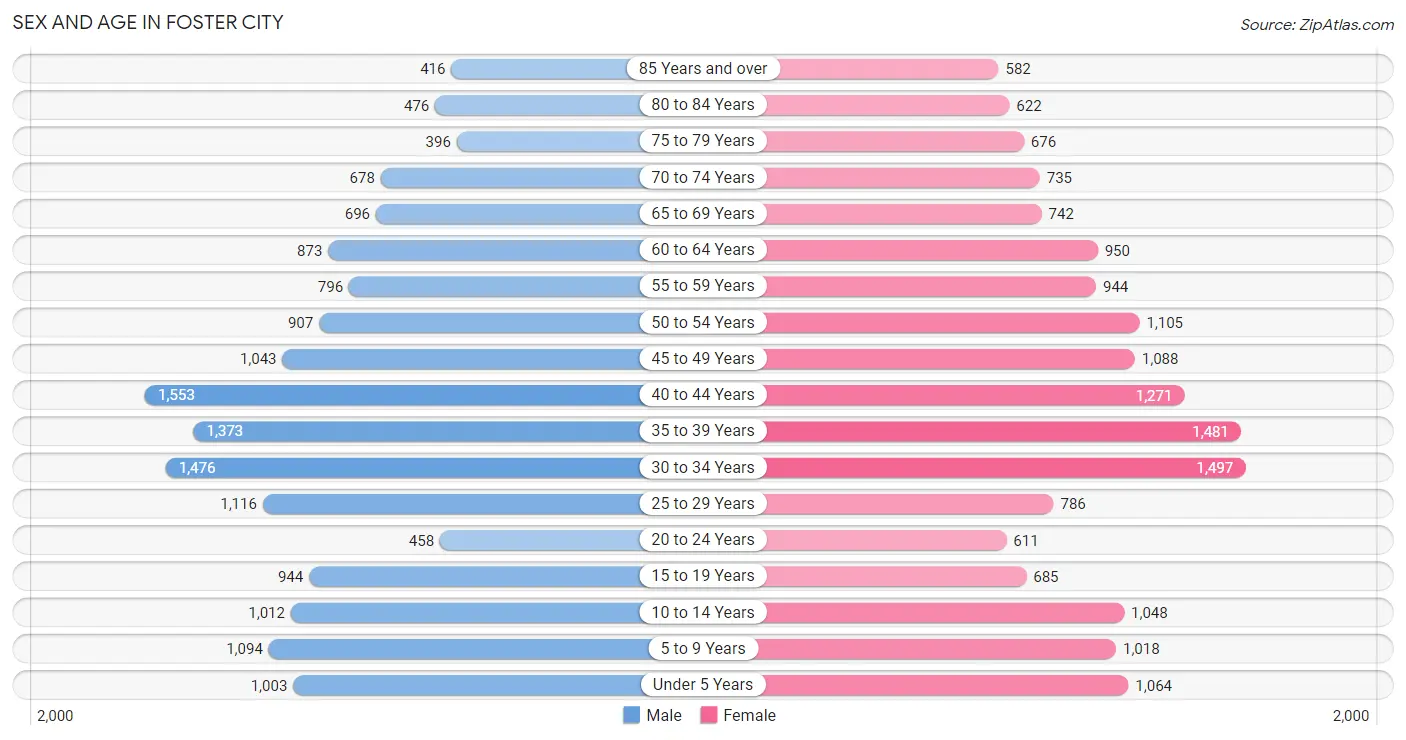
| Age Bracket | Male | Female |
| Under 5 Years | 1,003 (6.1%) | 1,064 (6.3%) |
| 5 to 9 Years | 1,094 (6.7%) | 1,018 (6.0%) |
| 10 to 14 Years | 1,012 (6.2%) | 1,048 (6.2%) |
| 15 to 19 Years | 944 (5.8%) | 685 (4.1%) |
| 20 to 24 Years | 458 (2.8%) | 611 (3.6%) |
| 25 to 29 Years | 1,116 (6.8%) | 786 (4.6%) |
| 30 to 34 Years | 1,476 (9.0%) | 1,497 (8.9%) |
| 35 to 39 Years | 1,373 (8.4%) | 1,481 (8.8%) |
| 40 to 44 Years | 1,553 (9.5%) | 1,271 (7.5%) |
| 45 to 49 Years | 1,043 (6.4%) | 1,088 (6.4%) |
| 50 to 54 Years | 907 (5.6%) | 1,105 (6.5%) |
| 55 to 59 Years | 796 (4.9%) | 944 (5.6%) |
| 60 to 64 Years | 873 (5.3%) | 950 (5.6%) |
| 65 to 69 Years | 696 (4.3%) | 742 (4.4%) |
| 70 to 74 Years | 678 (4.2%) | 735 (4.3%) |
| 75 to 79 Years | 396 (2.4%) | 676 (4.0%) |
| 80 to 84 Years | 476 (2.9%) | 622 (3.7%) |
| 85 Years and over | 416 (2.5%) | 582 (3.4%) |
| Total | 16,310 (100.0%) | 16,905 (100.0%) |
Families and Households in Foster City
Median Family Size in Foster City
The median family size in Foster City is 3.08 persons per family, with married-couple families (7,428 | 84.2%) accounting for the largest median family size of 3.1 persons per family. On the other hand, single female/mother families (978 | 11.1%) represent the smallest median family size with 2.95 persons per family.
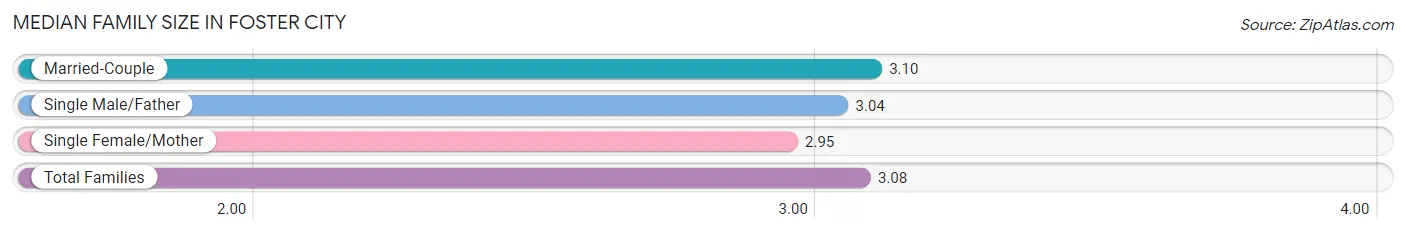
| Family Type | # Families | Family Size |
| Married-Couple | 7,428 (84.2%) | 3.10 |
| Single Male/Father | 421 (4.8%) | 3.04 |
| Single Female/Mother | 978 (11.1%) | 2.95 |
| Total Families | 8,827 (100.0%) | 3.08 |
Median Household Size in Foster City
The median household size in Foster City is 2.61 persons per household, with single male/father households (421 | 3.3%) accounting for the largest median household size of 3.29 persons per household. non-family households (3,831 | 30.3%) represent the smallest median household size with 1.46 persons per household.
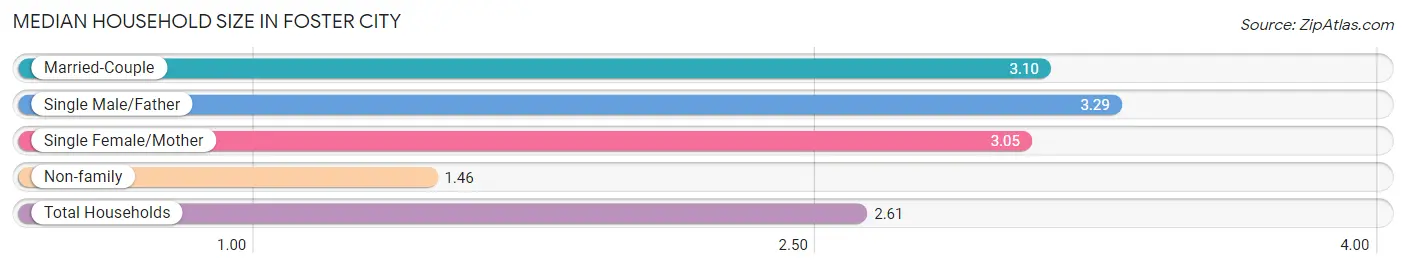
| Household Type | # Households | Household Size |
| Married-Couple | 7,428 (58.7%) | 3.10 |
| Single Male/Father | 421 (3.3%) | 3.29 |
| Single Female/Mother | 978 (7.7%) | 3.05 |
| Non-family | 3,831 (30.3%) | 1.46 |
| Total Households | 12,658 (100.0%) | 2.61 |
Household Size by Marriage Status in Foster City
Out of a total of 12,658 households in Foster City, 8,827 (69.7%) are family households, while 3,831 (30.3%) are nonfamily households. The most numerous type of family households are 2-person households, comprising 3,463, and the most common type of nonfamily households are 1-person households, comprising 2,668.
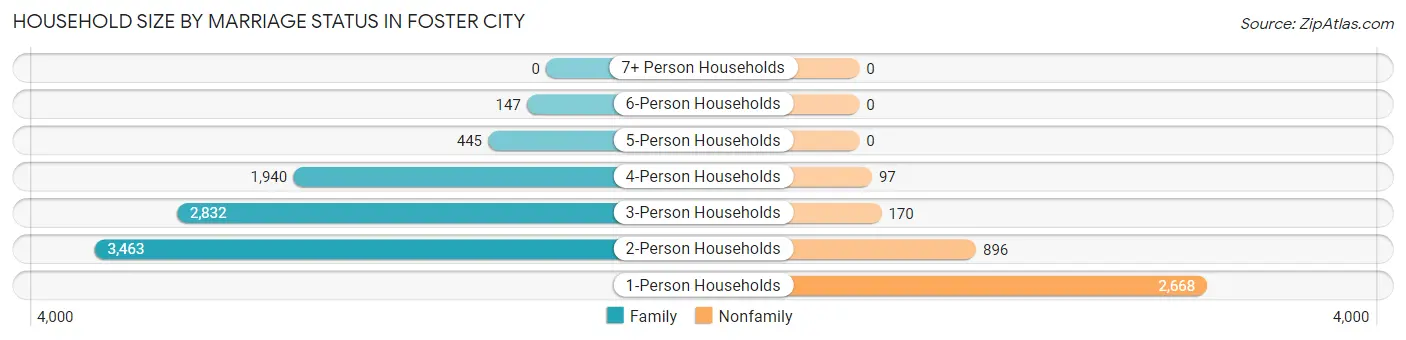
| Household Size | Family Households | Nonfamily Households |
| 1-Person Households | - | 2,668 (21.1%) |
| 2-Person Households | 3,463 (27.4%) | 896 (7.1%) |
| 3-Person Households | 2,832 (22.4%) | 170 (1.3%) |
| 4-Person Households | 1,940 (15.3%) | 97 (0.8%) |
| 5-Person Households | 445 (3.5%) | 0 (0.0%) |
| 6-Person Households | 147 (1.2%) | 0 (0.0%) |
| 7+ Person Households | 0 (0.0%) | 0 (0.0%) |
| Total | 8,827 (69.7%) | 3,831 (30.3%) |
Female Fertility in Foster City
Fertility by Age in Foster City
Average fertility rate in Foster City is 54.0 births per 1,000 women. Women in the age bracket of 20 to 34 years have the highest fertility rate with 78.0 births per 1,000 women. Women in the age bracket of 20 to 34 years acount for 54.2% of all women with births.
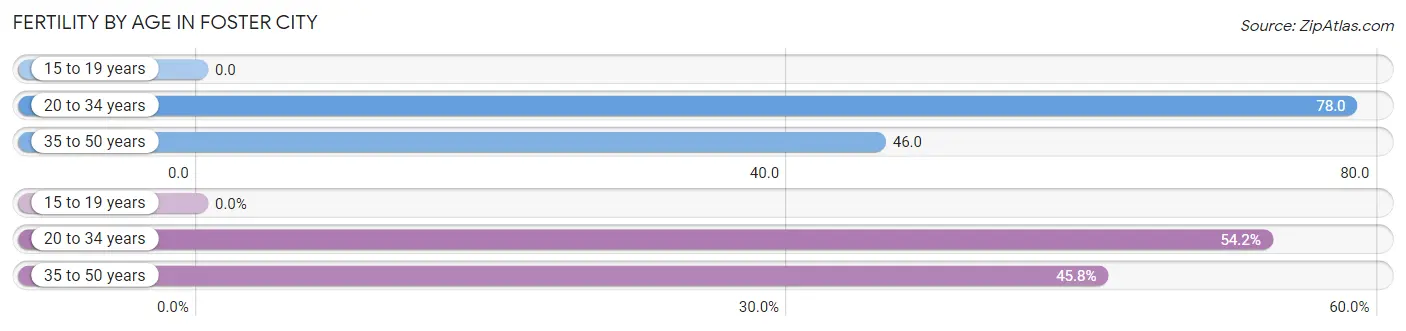
| Age Bracket | Women with Births | Births / 1,000 Women |
| 15 to 19 years | 0 (0.0%) | 0.0 |
| 20 to 34 years | 227 (54.2%) | 78.0 |
| 35 to 50 years | 192 (45.8%) | 46.0 |
| Total | 419 (100.0%) | 54.0 |
Fertility by Age by Marriage Status in Foster City
91.6% of women with births (419) in Foster City are married. The highest percentage of unmarried women with births falls into 35 to 50 years age bracket with 13.0% of them unmarried at the time of birth, while the lowest percentage of unmarried women with births belong to 20 to 34 years age bracket with 4.4% of them unmarried.
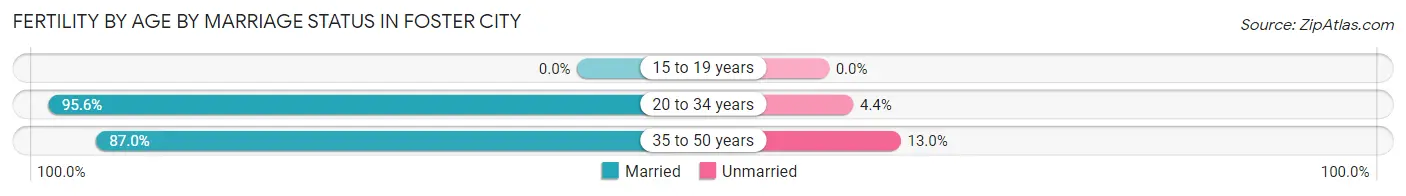
| Age Bracket | Married | Unmarried |
| 15 to 19 years | 0 (0.0%) | 0 (0.0%) |
| 20 to 34 years | 217 (95.6%) | 10 (4.4%) |
| 35 to 50 years | 167 (87.0%) | 25 (13.0%) |
| Total | 384 (91.6%) | 35 (8.4%) |
Fertility by Education in Foster City
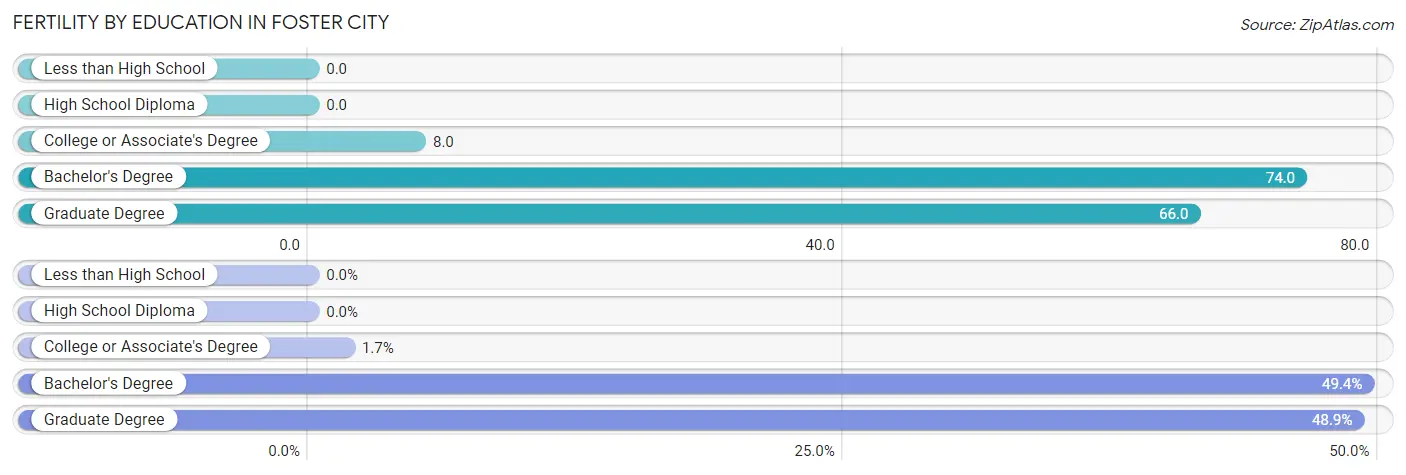
| Educational Attainment | Women with Births | Births / 1,000 Women |
| Less than High School | 0 (0.0%) | 0.0 |
| High School Diploma | 0 (0.0%) | 0.0 |
| College or Associate's Degree | 7 (1.7%) | 8.0 |
| Bachelor's Degree | 207 (49.4%) | 74.0 |
| Graduate Degree | 205 (48.9%) | 66.0 |
| Total | 419 (100.0%) | 54.0 |
Fertility by Education by Marriage Status in Foster City
8.4% of women with births in Foster City are unmarried. Women with the educational attainment of college or associate's degree are most likely to be married with 100.0% of them married at childbirth, while women with the educational attainment of bachelor's degree are least likely to be married with 12.1% of them unmarried at childbirth.
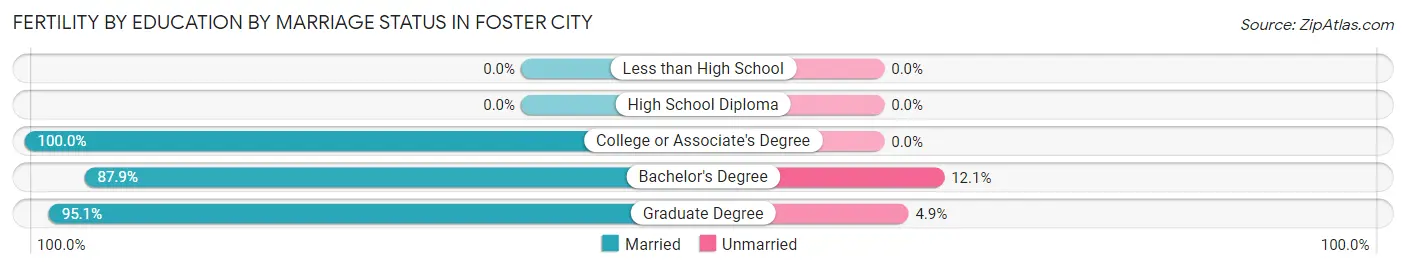
| Educational Attainment | Married | Unmarried |
| Less than High School | 0 (0.0%) | 0 (0.0%) |
| High School Diploma | 0 (0.0%) | 0 (0.0%) |
| College or Associate's Degree | 7 (100.0%) | 0 (0.0%) |
| Bachelor's Degree | 182 (87.9%) | 25 (12.1%) |
| Graduate Degree | 195 (95.1%) | 10 (4.9%) |
| Total | 384 (91.6%) | 35 (8.4%) |
Employment Characteristics in Foster City
Employment by Class of Employer in Foster City
Among the 16,689 employed individuals in Foster City, private company employees (13,116 | 78.6%), self-employed (not incorporated) (996 | 6.0%), and not-for-profit organizations (916 | 5.5%) make up the most common classes of employment.
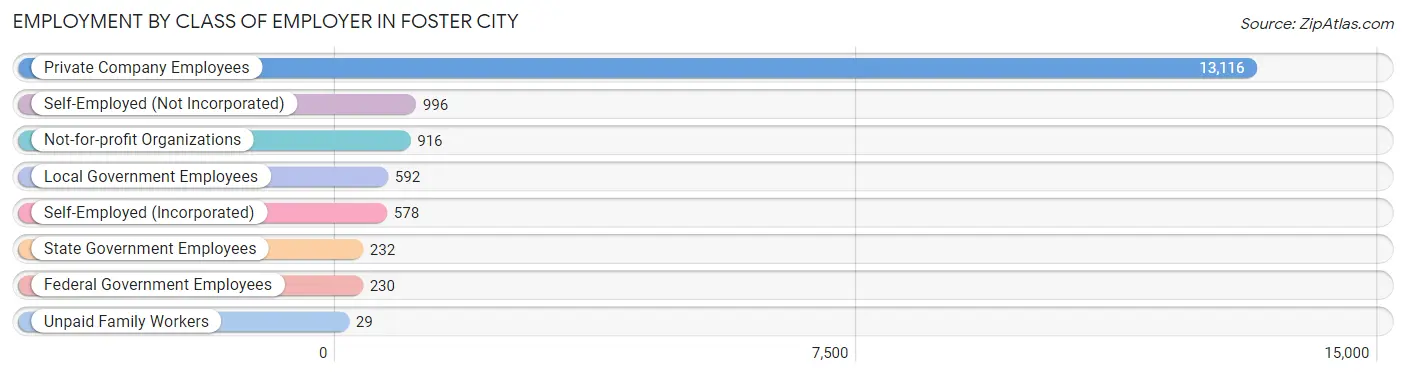
| Employer Class | # Employees | % Employees |
| Private Company Employees | 13,116 | 78.6% |
| Self-Employed (Incorporated) | 578 | 3.5% |
| Self-Employed (Not Incorporated) | 996 | 6.0% |
| Not-for-profit Organizations | 916 | 5.5% |
| Local Government Employees | 592 | 3.5% |
| State Government Employees | 232 | 1.4% |
| Federal Government Employees | 230 | 1.4% |
| Unpaid Family Workers | 29 | 0.2% |
| Total | 16,689 | 100.0% |
Employment Status by Age in Foster City
According to the labor force statistics for Foster City, out of the total population over 16 years of age (26,676), 66.5% or 17,740 individuals are in the labor force, with 4.3% or 763 of them unemployed. The age group with the highest labor force participation rate is 35 to 44 years, with 88.1% or 5,002 individuals in the labor force. Within the labor force, the 16 to 19 years age range has the highest percentage of unemployed individuals, with 19.6% or 55 of them being unemployed.
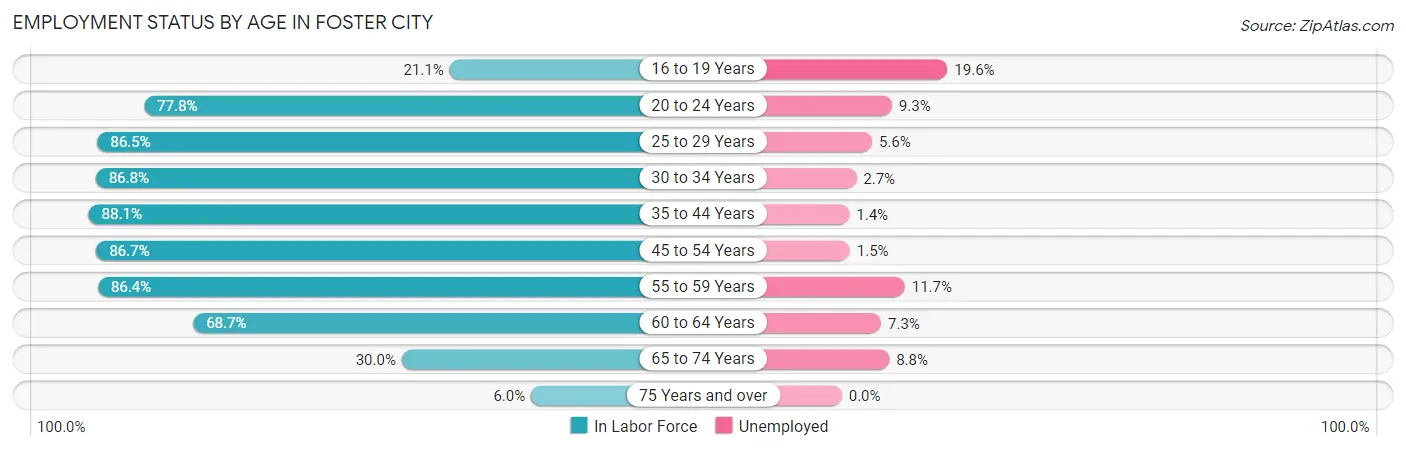
| Age Bracket | In Labor Force | Unemployed |
| 16 to 19 Years | 280 (21.1%) | 55 (19.6%) |
| 20 to 24 Years | 832 (77.8%) | 77 (9.3%) |
| 25 to 29 Years | 1,645 (86.5%) | 92 (5.6%) |
| 30 to 34 Years | 2,581 (86.8%) | 70 (2.7%) |
| 35 to 44 Years | 5,002 (88.1%) | 70 (1.4%) |
| 45 to 54 Years | 3,592 (86.7%) | 54 (1.5%) |
| 55 to 59 Years | 1,503 (86.4%) | 176 (11.7%) |
| 60 to 64 Years | 1,252 (68.7%) | 91 (7.3%) |
| 65 to 74 Years | 855 (30.0%) | 75 (8.8%) |
| 75 Years and over | 190 (6.0%) | 0 (0.0%) |
| Total | 17,740 (66.5%) | 763 (4.3%) |
Employment Status by Educational Attainment in Foster City
According to labor force statistics for Foster City, 85.3% of individuals (15,575) out of the total population between 25 and 64 years of age (18,259) are in the labor force, with 3.6% or 561 of them being unemployed. The group with the highest labor force participation rate are those with the educational attainment of bachelor's degree or higher, with 87.2% or 12,585 individuals in the labor force. Within the labor force, individuals with less than high school education have the highest percentage of unemployment, with 15.5% or 66 of them being unemployed.
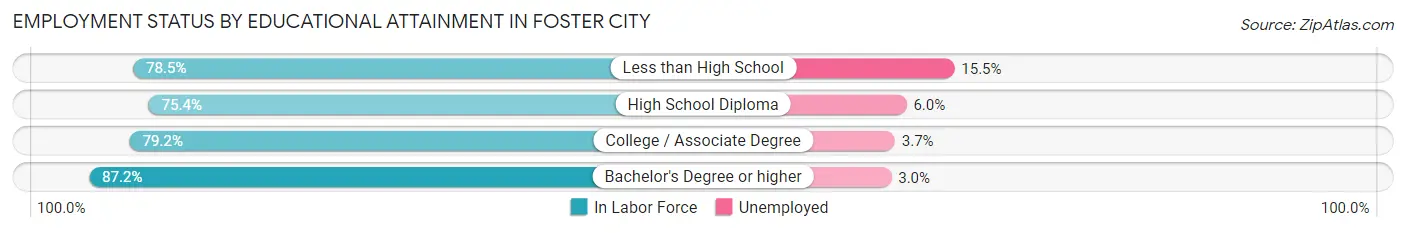
| Educational Attainment | In Labor Force | Unemployed |
| Less than High School | 427 (78.5%) | 84 (15.5%) |
| High School Diploma | 685 (75.4%) | 54 (6.0%) |
| College / Associate Degree | 1,881 (79.2%) | 88 (3.7%) |
| Bachelor's Degree or higher | 12,585 (87.2%) | 433 (3.0%) |
| Total | 15,575 (85.3%) | 657 (3.6%) |
Employment Occupations by Sex in Foster City
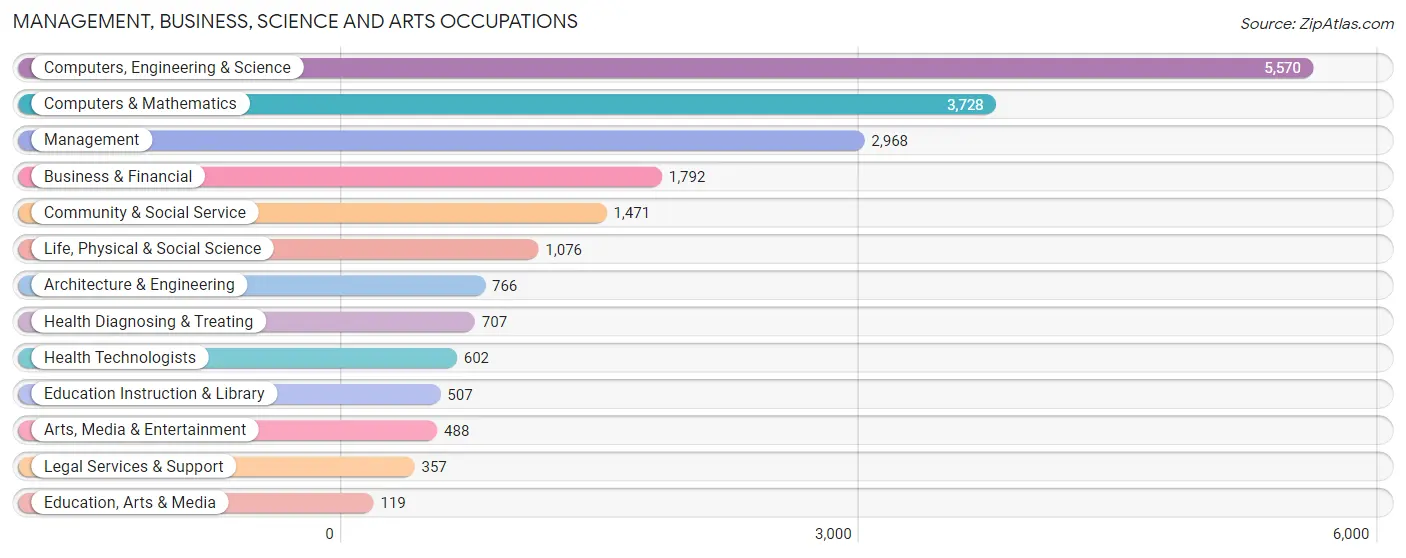
Management, Business, Science and Arts Occupations
The most common Management, Business, Science and Arts occupations in Foster City are Computers, Engineering & Science (5,570 | 32.9%), Computers & Mathematics (3,728 | 22.0%), Management (2,968 | 17.5%), Business & Financial (1,792 | 10.6%), and Community & Social Service (1,471 | 8.7%).
Management, Business, Science and Arts Occupations by Sex
Within the Management, Business, Science and Arts occupations in Foster City, the most male-oriented occupations are Architecture & Engineering (86.8%), Computers, Engineering & Science (67.1%), and Computers & Mathematics (66.4%), while the most female-oriented occupations are Health Technologists (86.5%), Health Diagnosing & Treating (83.6%), and Education Instruction & Library (73.2%).
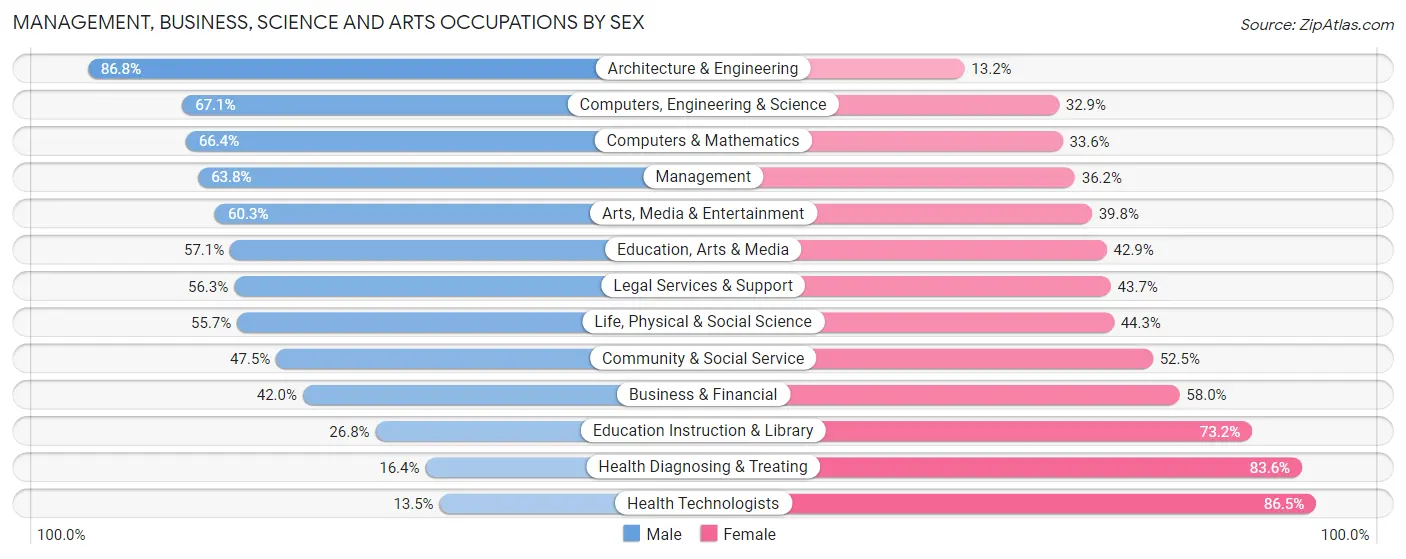
| Occupation | Male | Female |
| Management | 1,893 (63.8%) | 1,075 (36.2%) |
| Business & Financial | 752 (42.0%) | 1,040 (58.0%) |
| Computers, Engineering & Science | 3,738 (67.1%) | 1,832 (32.9%) |
| Computers & Mathematics | 2,474 (66.4%) | 1,254 (33.6%) |
| Architecture & Engineering | 665 (86.8%) | 101 (13.2%) |
| Life, Physical & Social Science | 599 (55.7%) | 477 (44.3%) |
| Community & Social Service | 699 (47.5%) | 772 (52.5%) |
| Education, Arts & Media | 68 (57.1%) | 51 (42.9%) |
| Legal Services & Support | 201 (56.3%) | 156 (43.7%) |
| Education Instruction & Library | 136 (26.8%) | 371 (73.2%) |
| Arts, Media & Entertainment | 294 (60.3%) | 194 (39.8%) |
| Health Diagnosing & Treating | 116 (16.4%) | 591 (83.6%) |
| Health Technologists | 81 (13.5%) | 521 (86.5%) |
| Total (Category) | 7,198 (57.6%) | 5,310 (42.4%) |
| Total (Overall) | 9,303 (55.0%) | 7,609 (45.0%) |
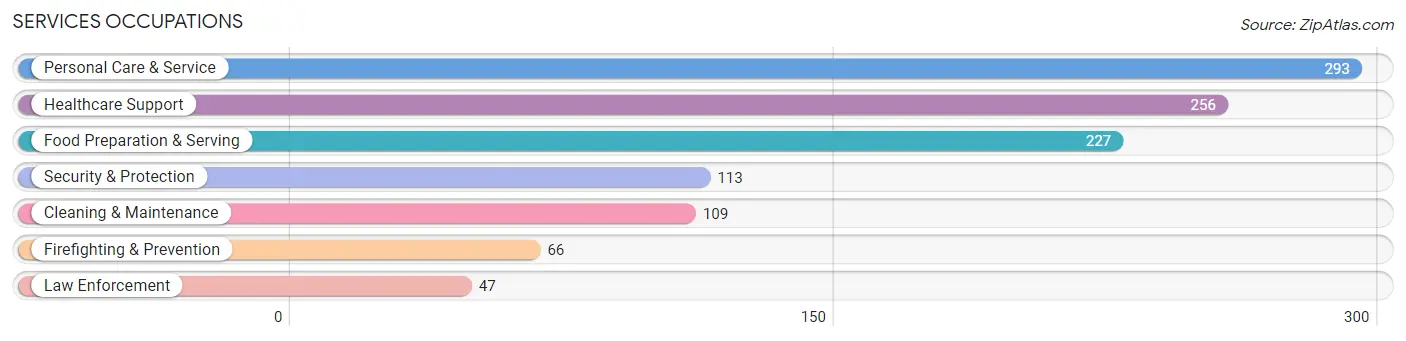
Services Occupations
The most common Services occupations in Foster City are Personal Care & Service (293 | 1.7%), Healthcare Support (256 | 1.5%), Food Preparation & Serving (227 | 1.3%), Security & Protection (113 | 0.7%), and Cleaning & Maintenance (109 | 0.6%).
Services Occupations by Sex
Within the Services occupations in Foster City, the most male-oriented occupations are Firefighting & Prevention (86.4%), Security & Protection (69.9%), and Law Enforcement (46.8%), while the most female-oriented occupations are Personal Care & Service (86.0%), Healthcare Support (82.0%), and Cleaning & Maintenance (76.1%).
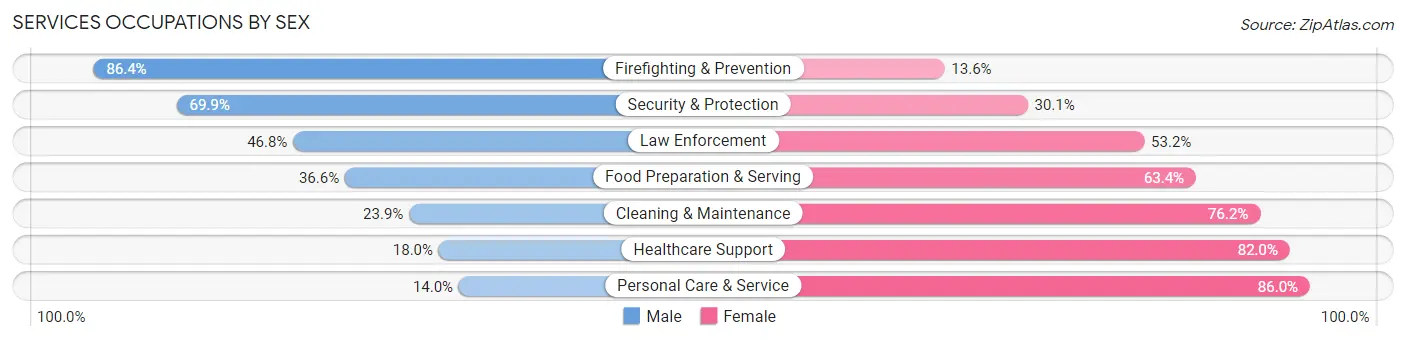
| Occupation | Male | Female |
| Healthcare Support | 46 (18.0%) | 210 (82.0%) |
| Security & Protection | 79 (69.9%) | 34 (30.1%) |
| Firefighting & Prevention | 57 (86.4%) | 9 (13.6%) |
| Law Enforcement | 22 (46.8%) | 25 (53.2%) |
| Food Preparation & Serving | 83 (36.6%) | 144 (63.4%) |
| Cleaning & Maintenance | 26 (23.8%) | 83 (76.1%) |
| Personal Care & Service | 41 (14.0%) | 252 (86.0%) |
| Total (Category) | 275 (27.6%) | 723 (72.4%) |
| Total (Overall) | 9,303 (55.0%) | 7,609 (45.0%) |
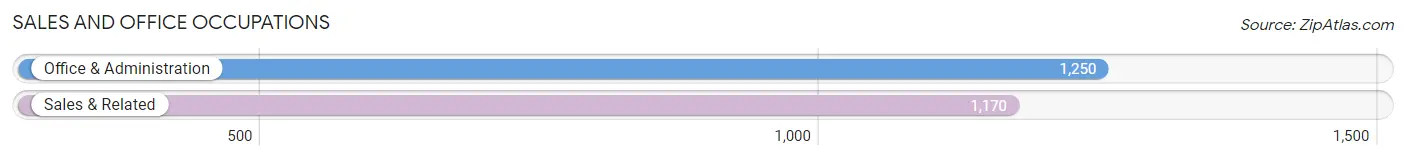
Sales and Office Occupations
The most common Sales and Office occupations in Foster City are Office & Administration (1,250 | 7.4%), and Sales & Related (1,170 | 6.9%).
Sales and Office Occupations by Sex
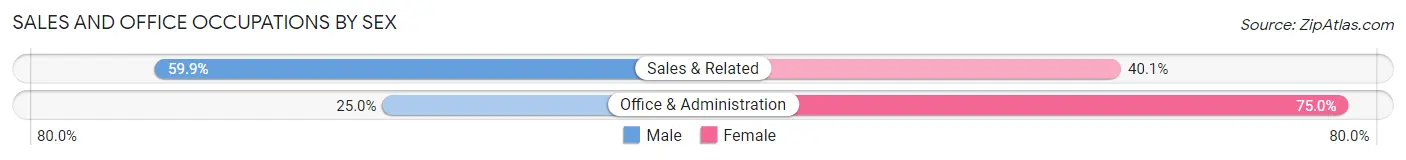
| Occupation | Male | Female |
| Sales & Related | 701 (59.9%) | 469 (40.1%) |
| Office & Administration | 312 (25.0%) | 938 (75.0%) |
| Total (Category) | 1,013 (41.9%) | 1,407 (58.1%) |
| Total (Overall) | 9,303 (55.0%) | 7,609 (45.0%) |
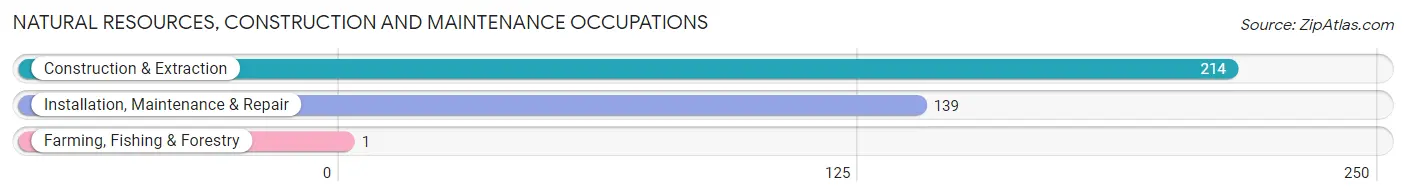
Natural Resources, Construction and Maintenance Occupations
The most common Natural Resources, Construction and Maintenance occupations in Foster City are Construction & Extraction (214 | 1.3%), Installation, Maintenance & Repair (139 | 0.8%), and Farming, Fishing & Forestry (1 | 0.0%).
Natural Resources, Construction and Maintenance Occupations by Sex
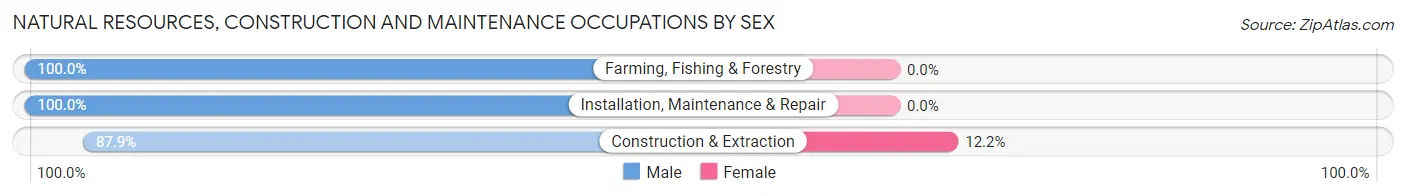
| Occupation | Male | Female |
| Farming, Fishing & Forestry | 1 (100.0%) | 0 (0.0%) |
| Construction & Extraction | 188 (87.8%) | 26 (12.1%) |
| Installation, Maintenance & Repair | 139 (100.0%) | 0 (0.0%) |
| Total (Category) | 328 (92.7%) | 26 (7.3%) |
| Total (Overall) | 9,303 (55.0%) | 7,609 (45.0%) |
Production, Transportation and Moving Occupations
The most common Production, Transportation and Moving occupations in Foster City are Transportation (325 | 1.9%), Production (232 | 1.4%), and Material Moving (75 | 0.4%).
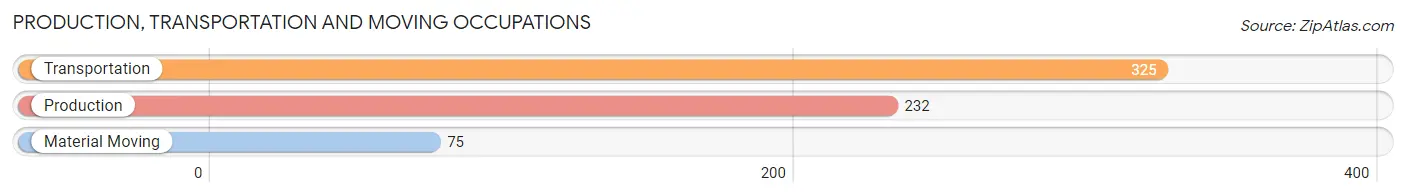
Production, Transportation and Moving Occupations by Sex
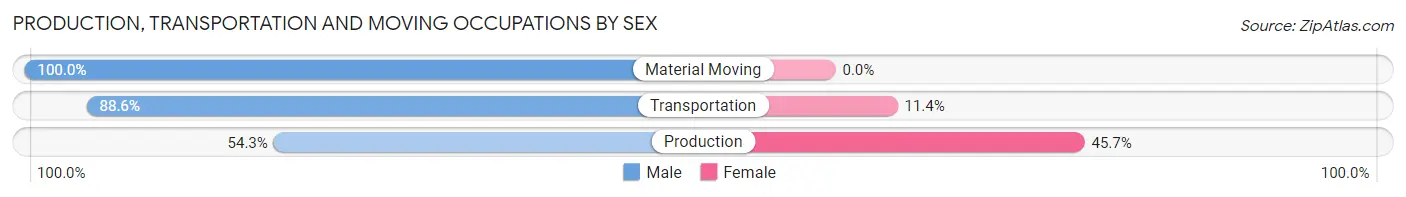
| Occupation | Male | Female |
| Production | 126 (54.3%) | 106 (45.7%) |
| Transportation | 288 (88.6%) | 37 (11.4%) |
| Material Moving | 75 (100.0%) | 0 (0.0%) |
| Total (Category) | 489 (77.4%) | 143 (22.6%) |
| Total (Overall) | 9,303 (55.0%) | 7,609 (45.0%) |
Employment Industries by Sex in Foster City
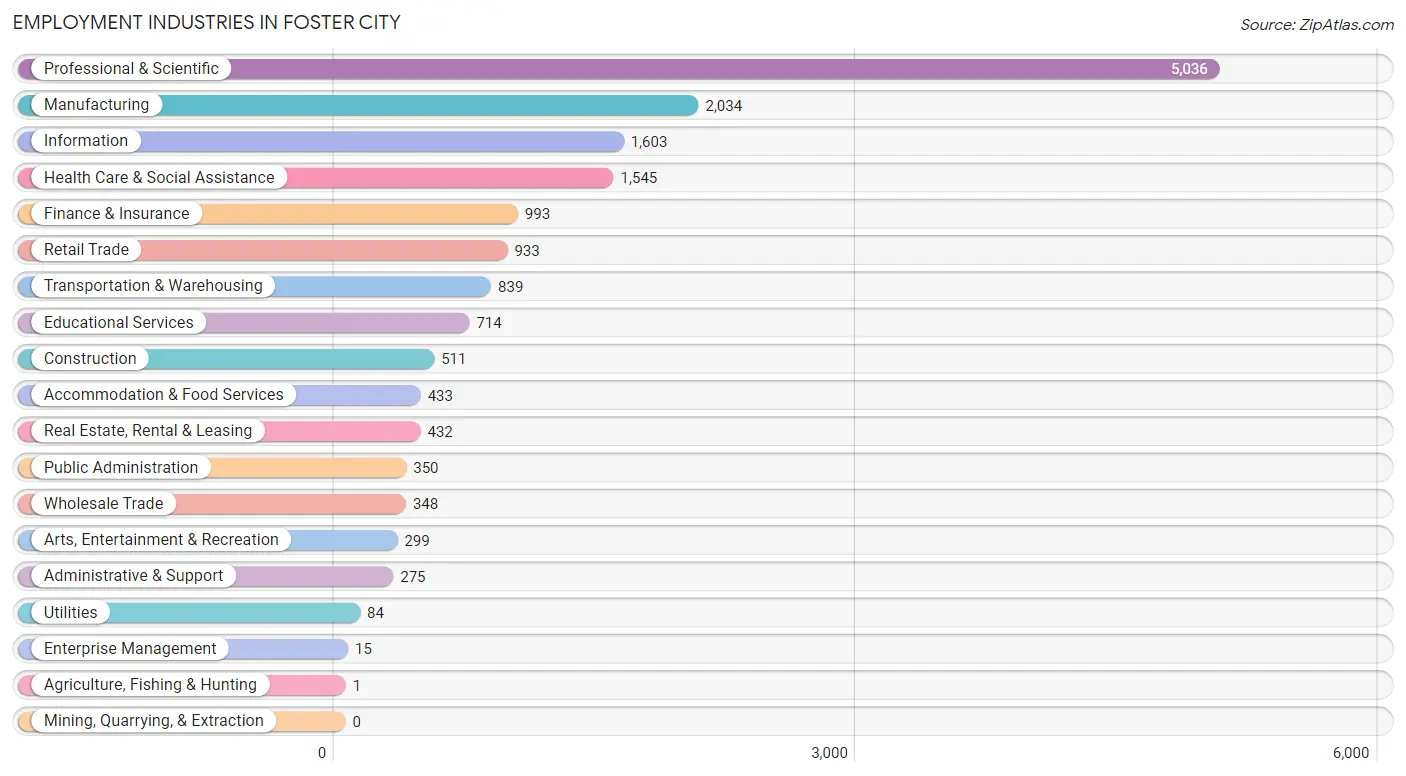
Employment Industries in Foster City
The major employment industries in Foster City include Professional & Scientific (5,036 | 29.8%), Manufacturing (2,034 | 12.0%), Information (1,603 | 9.5%), Health Care & Social Assistance (1,545 | 9.1%), and Finance & Insurance (993 | 5.9%).
Employment Industries by Sex in Foster City
The Foster City industries that see more men than women are Agriculture, Fishing & Hunting (100.0%), Enterprise Management (100.0%), and Wholesale Trade (77.0%), whereas the industries that tend to have a higher number of women are Health Care & Social Assistance (70.4%), Educational Services (68.5%), and Accommodation & Food Services (59.1%).
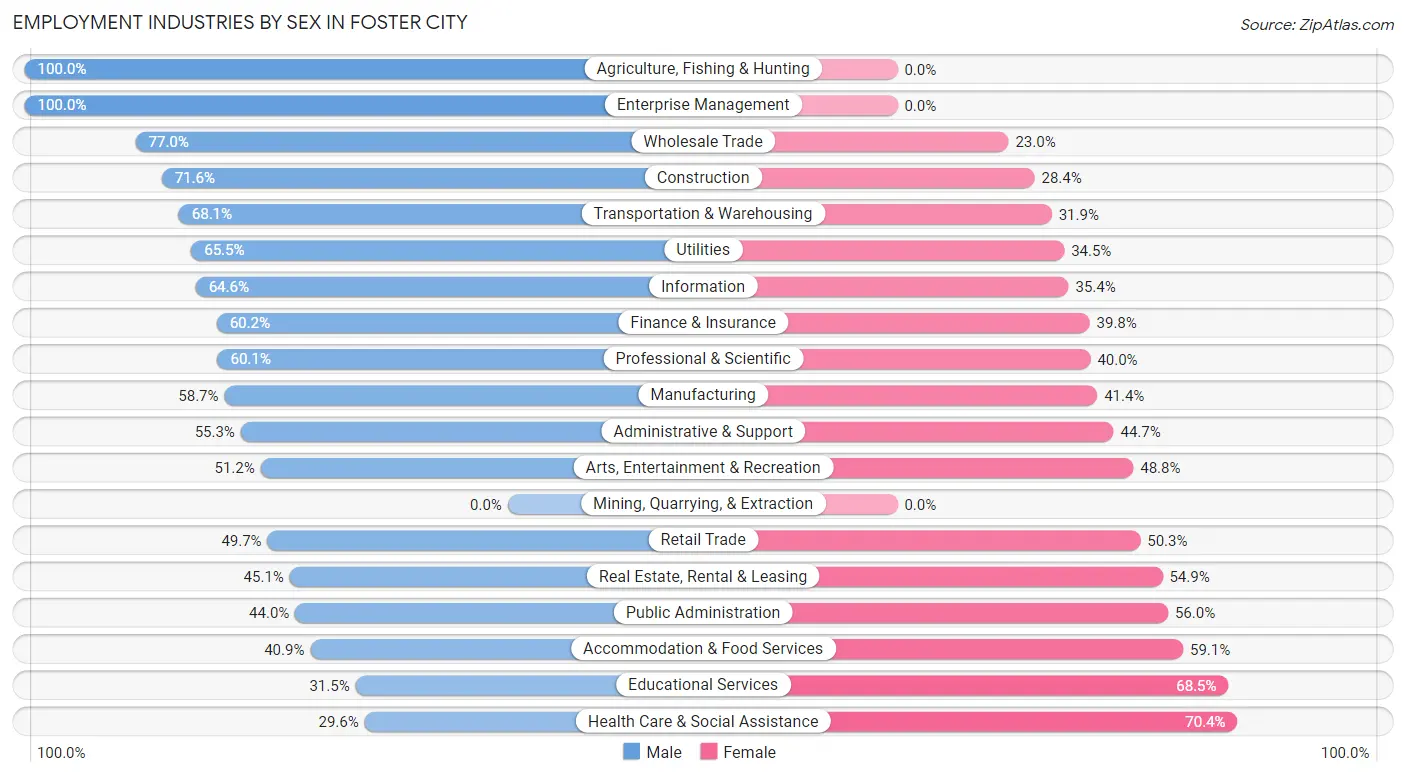
| Industry | Male | Female |
| Agriculture, Fishing & Hunting | 1 (100.0%) | 0 (0.0%) |
| Mining, Quarrying, & Extraction | 0 (0.0%) | 0 (0.0%) |
| Construction | 366 (71.6%) | 145 (28.4%) |
| Manufacturing | 1,193 (58.7%) | 841 (41.3%) |
| Wholesale Trade | 268 (77.0%) | 80 (23.0%) |
| Retail Trade | 464 (49.7%) | 469 (50.3%) |
| Transportation & Warehousing | 571 (68.1%) | 268 (31.9%) |
| Utilities | 55 (65.5%) | 29 (34.5%) |
| Information | 1,035 (64.6%) | 568 (35.4%) |
| Finance & Insurance | 598 (60.2%) | 395 (39.8%) |
| Real Estate, Rental & Leasing | 195 (45.1%) | 237 (54.9%) |
| Professional & Scientific | 3,024 (60.1%) | 2,012 (40.0%) |
| Enterprise Management | 15 (100.0%) | 0 (0.0%) |
| Administrative & Support | 152 (55.3%) | 123 (44.7%) |
| Educational Services | 225 (31.5%) | 489 (68.5%) |
| Health Care & Social Assistance | 458 (29.6%) | 1,087 (70.4%) |
| Arts, Entertainment & Recreation | 153 (51.2%) | 146 (48.8%) |
| Accommodation & Food Services | 177 (40.9%) | 256 (59.1%) |
| Public Administration | 154 (44.0%) | 196 (56.0%) |
| Total | 9,303 (55.0%) | 7,609 (45.0%) |
Education in Foster City
School Enrollment in Foster City
The most common levels of schooling among the 7,206 students in Foster City are middle school (1,717 | 23.8%), high school (1,491 | 20.7%), and elementary school (1,460 | 20.3%).
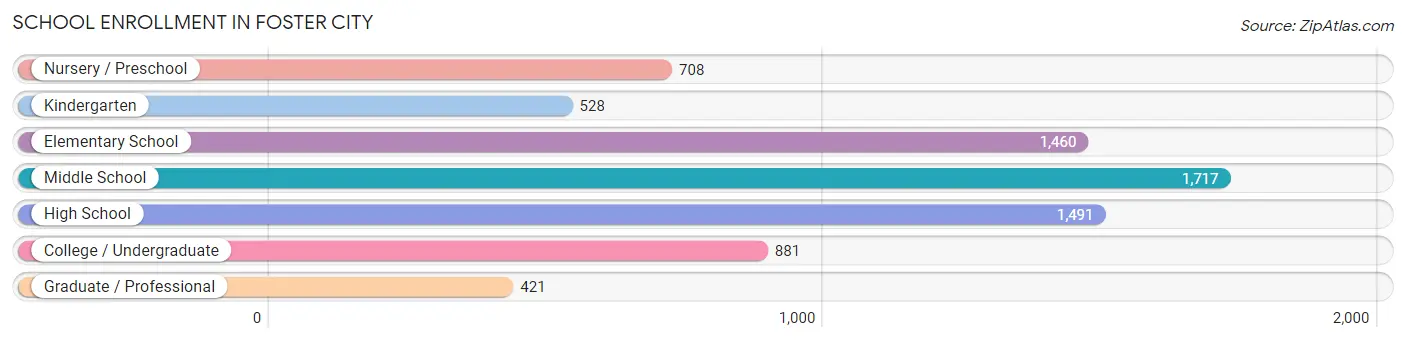
| School Level | # Students | % Students |
| Nursery / Preschool | 708 | 9.8% |
| Kindergarten | 528 | 7.3% |
| Elementary School | 1,460 | 20.3% |
| Middle School | 1,717 | 23.8% |
| High School | 1,491 | 20.7% |
| College / Undergraduate | 881 | 12.2% |
| Graduate / Professional | 421 | 5.8% |
| Total | 7,206 | 100.0% |
School Enrollment by Age by Funding Source in Foster City
Out of a total of 7,206 students who are enrolled in schools in Foster City, 2,047 (28.4%) attend a private institution, while the remaining 5,159 (71.6%) are enrolled in public schools. The age group of 3 to 4 year olds has the highest likelihood of being enrolled in private schools, with 502 (85.8% in the age bracket) enrolled. Conversely, the age group of 15 to 17 year olds has the lowest likelihood of being enrolled in a private school, with 1,117 (94.1% in the age bracket) attending a public institution.
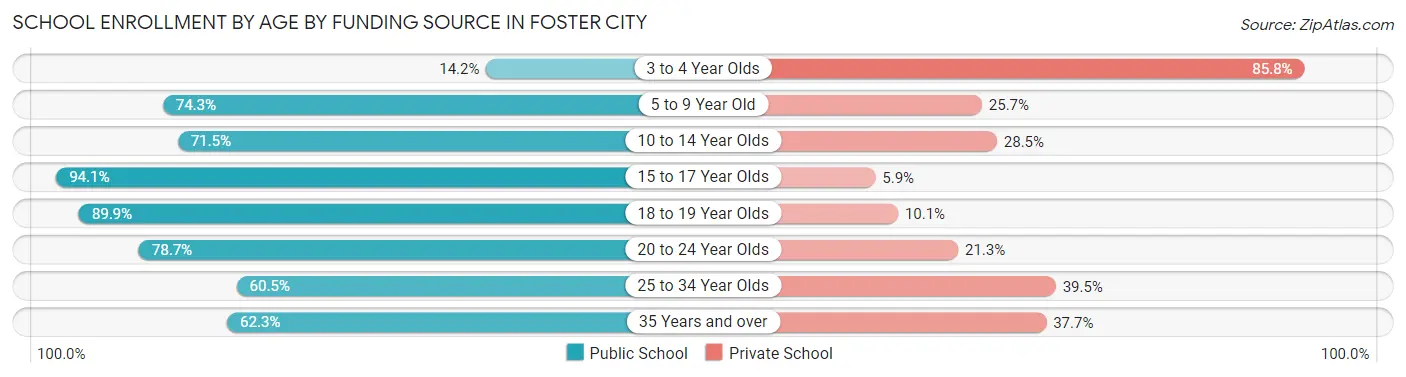
| Age Bracket | Public School | Private School |
| 3 to 4 Year Olds | 83 (14.2%) | 502 (85.8%) |
| 5 to 9 Year Old | 1,489 (74.3%) | 516 (25.7%) |
| 10 to 14 Year Olds | 1,443 (71.5%) | 576 (28.5%) |
| 15 to 17 Year Olds | 1,117 (94.1%) | 70 (5.9%) |
| 18 to 19 Year Olds | 320 (89.9%) | 36 (10.1%) |
| 20 to 24 Year Olds | 266 (78.7%) | 72 (21.3%) |
| 25 to 34 Year Olds | 236 (60.5%) | 154 (39.5%) |
| 35 Years and over | 203 (62.3%) | 123 (37.7%) |
| Total | 5,159 (71.6%) | 2,047 (28.4%) |
Educational Attainment by Field of Study in Foster City
Engineering (3,758 | 19.9%), business (3,046 | 16.2%), computers & mathematics (2,291 | 12.1%), social sciences (1,744 | 9.2%), and bio, nature & agricultural (1,608 | 8.5%) are the most common fields of study among 18,864 individuals in Foster City who have obtained a bachelor's degree or higher.
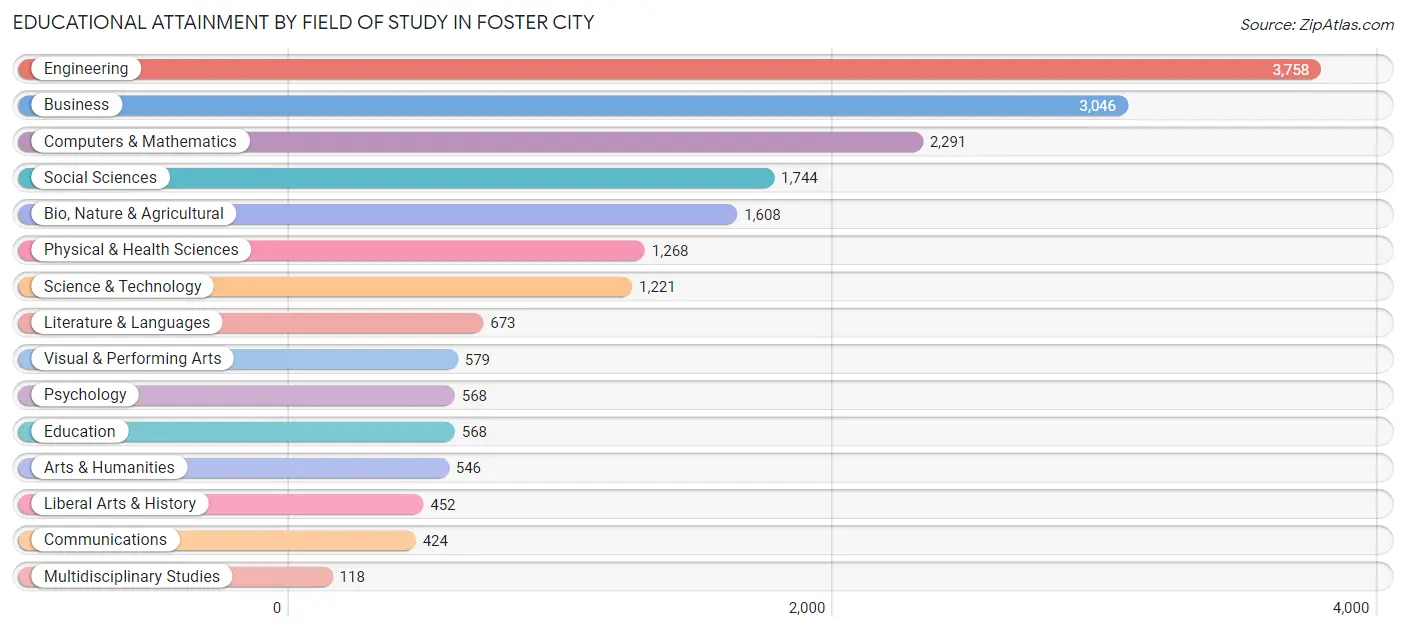
| Field of Study | # Graduates | % Graduates |
| Computers & Mathematics | 2,291 | 12.1% |
| Bio, Nature & Agricultural | 1,608 | 8.5% |
| Physical & Health Sciences | 1,268 | 6.7% |
| Psychology | 568 | 3.0% |
| Social Sciences | 1,744 | 9.2% |
| Engineering | 3,758 | 19.9% |
| Multidisciplinary Studies | 118 | 0.6% |
| Science & Technology | 1,221 | 6.5% |
| Business | 3,046 | 16.2% |
| Education | 568 | 3.0% |
| Literature & Languages | 673 | 3.6% |
| Liberal Arts & History | 452 | 2.4% |
| Visual & Performing Arts | 579 | 3.1% |
| Communications | 424 | 2.2% |
| Arts & Humanities | 546 | 2.9% |
| Total | 18,864 | 100.0% |
Transportation & Commute in Foster City
Vehicle Availability by Sex in Foster City
The most prevalent vehicle ownership categories in Foster City are males with 2 vehicles (4,287, accounting for 47.0%) and females with 2 vehicles (3,588, making up 57.1%).
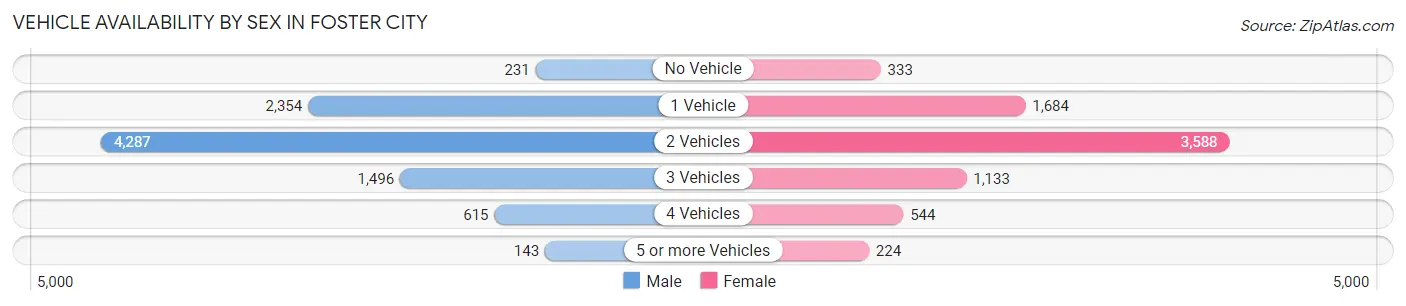
| Vehicles Available | Male | Female |
| No Vehicle | 231 (2.5%) | 333 (4.4%) |
| 1 Vehicle | 2,354 (25.8%) | 1,684 (22.4%) |
| 2 Vehicles | 4,287 (47.0%) | 3,588 (47.8%) |
| 3 Vehicles | 1,496 (16.4%) | 1,133 (15.1%) |
| 4 Vehicles | 615 (6.7%) | 544 (7.2%) |
| 5 or more Vehicles | 143 (1.6%) | 224 (3.0%) |
| Total | 9,126 (100.0%) | 7,506 (100.0%) |
Commute Time in Foster City
The most frequently occuring commute durations in Foster City are 30 to 34 minutes (2,050 commuters, 16.5%), 45 to 59 minutes (1,671 commuters, 13.5%), and 20 to 24 minutes (1,420 commuters, 11.5%).
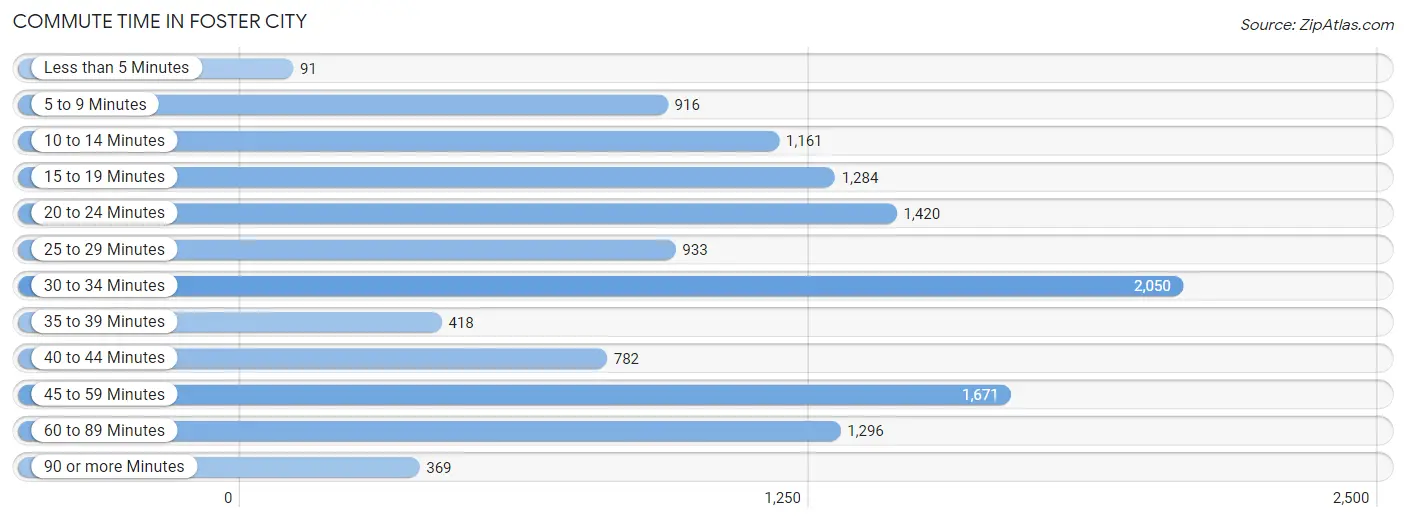
| Commute Time | # Commuters | % Commuters |
| Less than 5 Minutes | 91 | 0.7% |
| 5 to 9 Minutes | 916 | 7.4% |
| 10 to 14 Minutes | 1,161 | 9.4% |
| 15 to 19 Minutes | 1,284 | 10.4% |
| 20 to 24 Minutes | 1,420 | 11.5% |
| 25 to 29 Minutes | 933 | 7.5% |
| 30 to 34 Minutes | 2,050 | 16.5% |
| 35 to 39 Minutes | 418 | 3.4% |
| 40 to 44 Minutes | 782 | 6.3% |
| 45 to 59 Minutes | 1,671 | 13.5% |
| 60 to 89 Minutes | 1,296 | 10.5% |
| 90 or more Minutes | 369 | 3.0% |
Commute Time by Sex in Foster City
The most common commute times in Foster City are 30 to 34 minutes (1,115 commuters, 16.2%) for males and 30 to 34 minutes (935 commuters, 17.0%) for females.
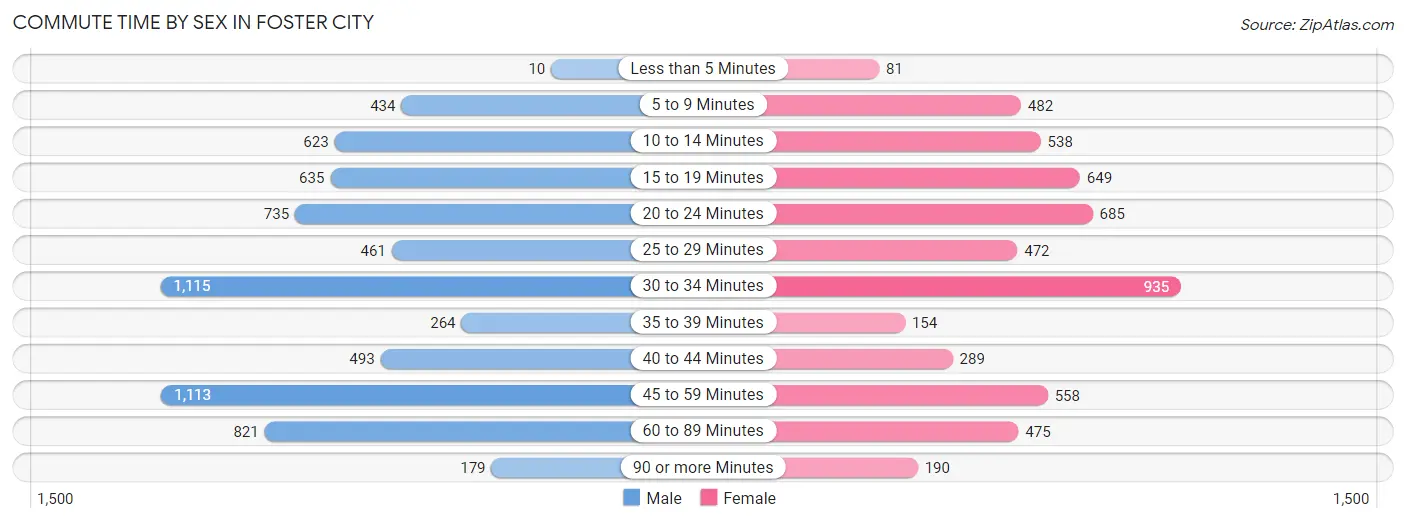
| Commute Time | Male | Female |
| Less than 5 Minutes | 10 (0.2%) | 81 (1.5%) |
| 5 to 9 Minutes | 434 (6.3%) | 482 (8.7%) |
| 10 to 14 Minutes | 623 (9.0%) | 538 (9.8%) |
| 15 to 19 Minutes | 635 (9.2%) | 649 (11.8%) |
| 20 to 24 Minutes | 735 (10.7%) | 685 (12.4%) |
| 25 to 29 Minutes | 461 (6.7%) | 472 (8.6%) |
| 30 to 34 Minutes | 1,115 (16.2%) | 935 (17.0%) |
| 35 to 39 Minutes | 264 (3.8%) | 154 (2.8%) |
| 40 to 44 Minutes | 493 (7.2%) | 289 (5.2%) |
| 45 to 59 Minutes | 1,113 (16.2%) | 558 (10.1%) |
| 60 to 89 Minutes | 821 (11.9%) | 475 (8.6%) |
| 90 or more Minutes | 179 (2.6%) | 190 (3.5%) |
Time of Departure to Work by Sex in Foster City
The most frequent times of departure to work in Foster City are 9:00 AM to 9:59 AM (1,631, 23.7%) for males and 7:30 AM to 7:59 AM (955, 17.3%) for females.
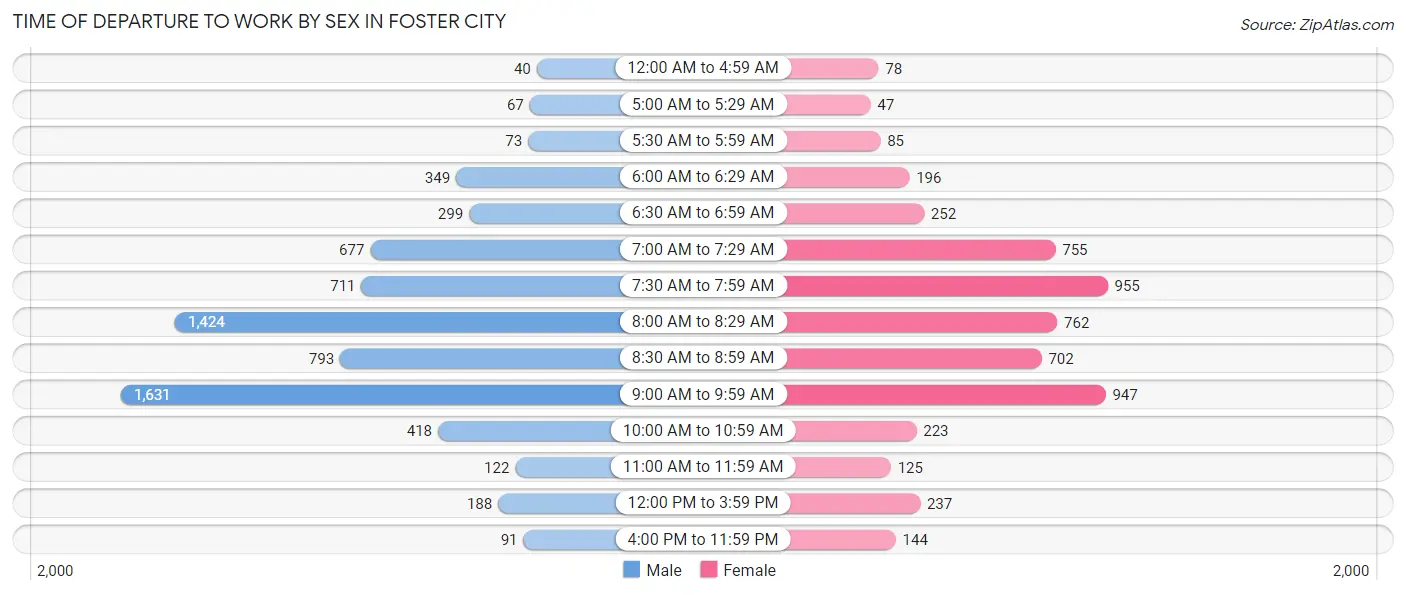
| Time of Departure | Male | Female |
| 12:00 AM to 4:59 AM | 40 (0.6%) | 78 (1.4%) |
| 5:00 AM to 5:29 AM | 67 (1.0%) | 47 (0.9%) |
| 5:30 AM to 5:59 AM | 73 (1.1%) | 85 (1.5%) |
| 6:00 AM to 6:29 AM | 349 (5.1%) | 196 (3.6%) |
| 6:30 AM to 6:59 AM | 299 (4.3%) | 252 (4.6%) |
| 7:00 AM to 7:29 AM | 677 (9.8%) | 755 (13.7%) |
| 7:30 AM to 7:59 AM | 711 (10.3%) | 955 (17.3%) |
| 8:00 AM to 8:29 AM | 1,424 (20.7%) | 762 (13.8%) |
| 8:30 AM to 8:59 AM | 793 (11.5%) | 702 (12.8%) |
| 9:00 AM to 9:59 AM | 1,631 (23.7%) | 947 (17.2%) |
| 10:00 AM to 10:59 AM | 418 (6.1%) | 223 (4.1%) |
| 11:00 AM to 11:59 AM | 122 (1.8%) | 125 (2.3%) |
| 12:00 PM to 3:59 PM | 188 (2.7%) | 237 (4.3%) |
| 4:00 PM to 11:59 PM | 91 (1.3%) | 144 (2.6%) |
| Total | 6,883 (100.0%) | 5,508 (100.0%) |
Housing Occupancy in Foster City
Occupancy by Ownership in Foster City
Of the total 12,658 dwellings in Foster City, owner-occupied units account for 6,646 (52.5%), while renter-occupied units make up 6,012 (47.5%).
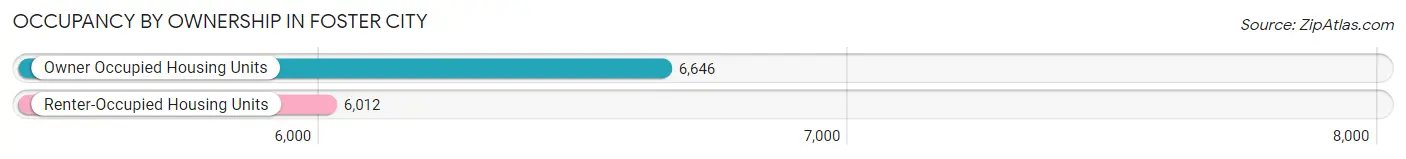
| Occupancy | # Housing Units | % Housing Units |
| Owner Occupied Housing Units | 6,646 | 52.5% |
| Renter-Occupied Housing Units | 6,012 | 47.5% |
| Total Occupied Housing Units | 12,658 | 100.0% |
Occupancy by Household Size in Foster City
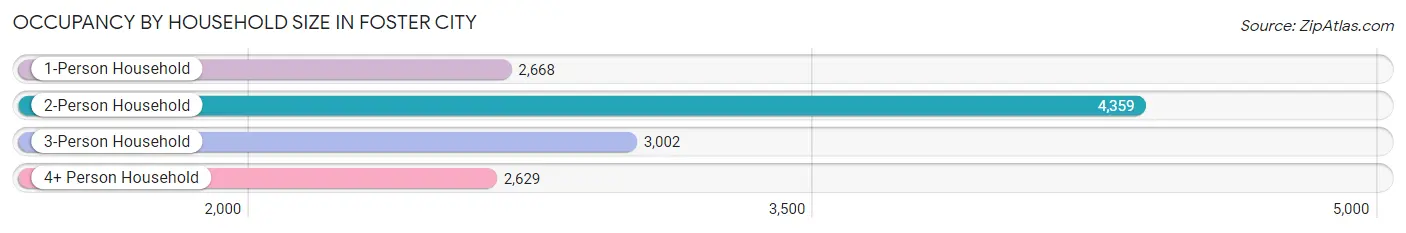
| Household Size | # Housing Units | % Housing Units |
| 1-Person Household | 2,668 | 21.1% |
| 2-Person Household | 4,359 | 34.4% |
| 3-Person Household | 3,002 | 23.7% |
| 4+ Person Household | 2,629 | 20.8% |
| Total Housing Units | 12,658 | 100.0% |
Occupancy by Ownership by Household Size in Foster City
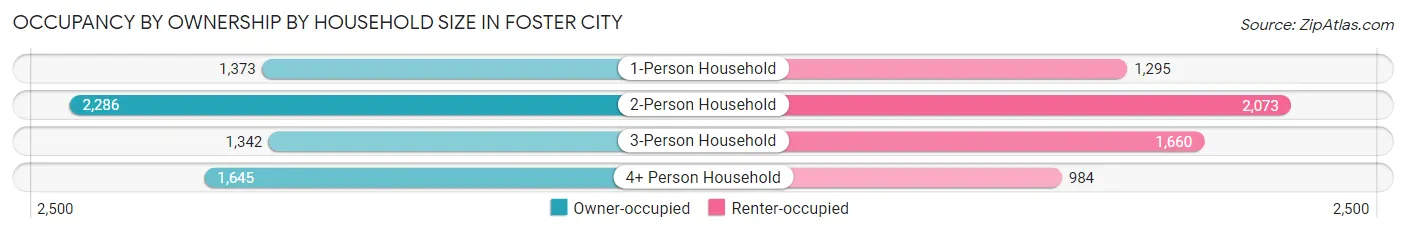
| Household Size | Owner-occupied | Renter-occupied |
| 1-Person Household | 1,373 (51.5%) | 1,295 (48.5%) |
| 2-Person Household | 2,286 (52.4%) | 2,073 (47.6%) |
| 3-Person Household | 1,342 (44.7%) | 1,660 (55.3%) |
| 4+ Person Household | 1,645 (62.6%) | 984 (37.4%) |
| Total Housing Units | 6,646 (52.5%) | 6,012 (47.5%) |
Occupancy by Educational Attainment in Foster City
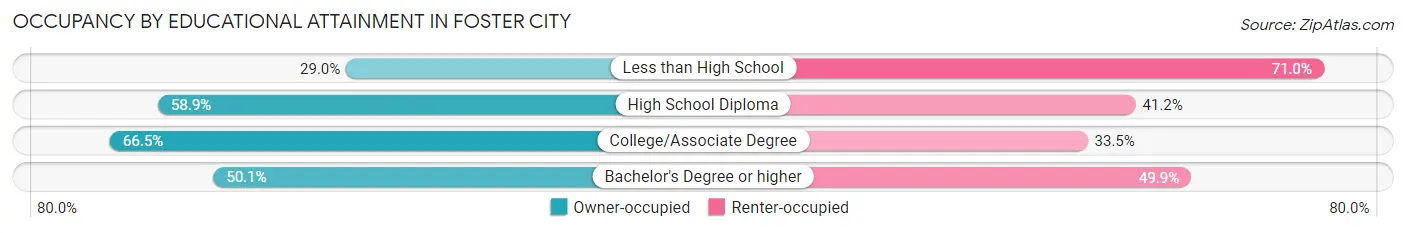
| Household Size | Owner-occupied | Renter-occupied |
| Less than High School | 96 (29.0%) | 235 (71.0%) |
| High School Diploma | 439 (58.9%) | 307 (41.1%) |
| College/Associate Degree | 1,270 (66.5%) | 641 (33.5%) |
| Bachelor's Degree or higher | 4,841 (50.1%) | 4,829 (49.9%) |
Occupancy by Age of Householder in Foster City
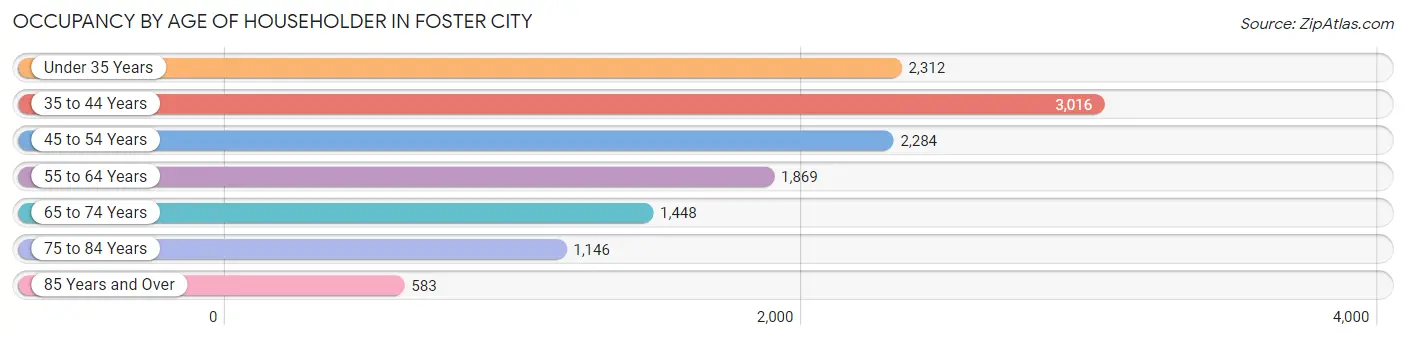
| Age Bracket | # Households | % Households |
| Under 35 Years | 2,312 | 18.3% |
| 35 to 44 Years | 3,016 | 23.8% |
| 45 to 54 Years | 2,284 | 18.0% |
| 55 to 64 Years | 1,869 | 14.8% |
| 65 to 74 Years | 1,448 | 11.4% |
| 75 to 84 Years | 1,146 | 9.0% |
| 85 Years and Over | 583 | 4.6% |
| Total | 12,658 | 100.0% |
Housing Finances in Foster City
Median Income by Occupancy in Foster City
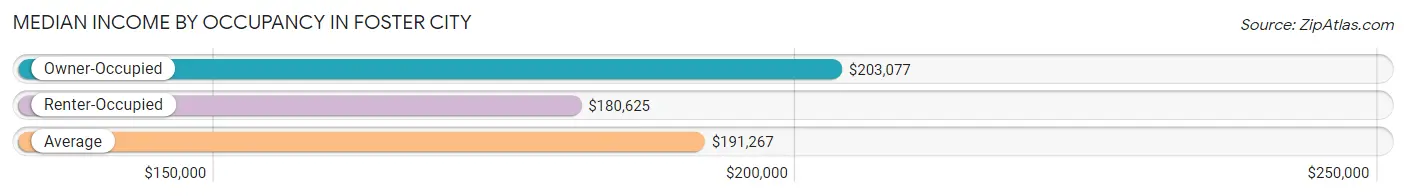
| Occupancy Type | # Households | Median Income |
| Owner-Occupied | 6,646 (52.5%) | $203,077 |
| Renter-Occupied | 6,012 (47.5%) | $180,625 |
| Average | 12,658 (100.0%) | $191,267 |
Occupancy by Householder Income Bracket in Foster City
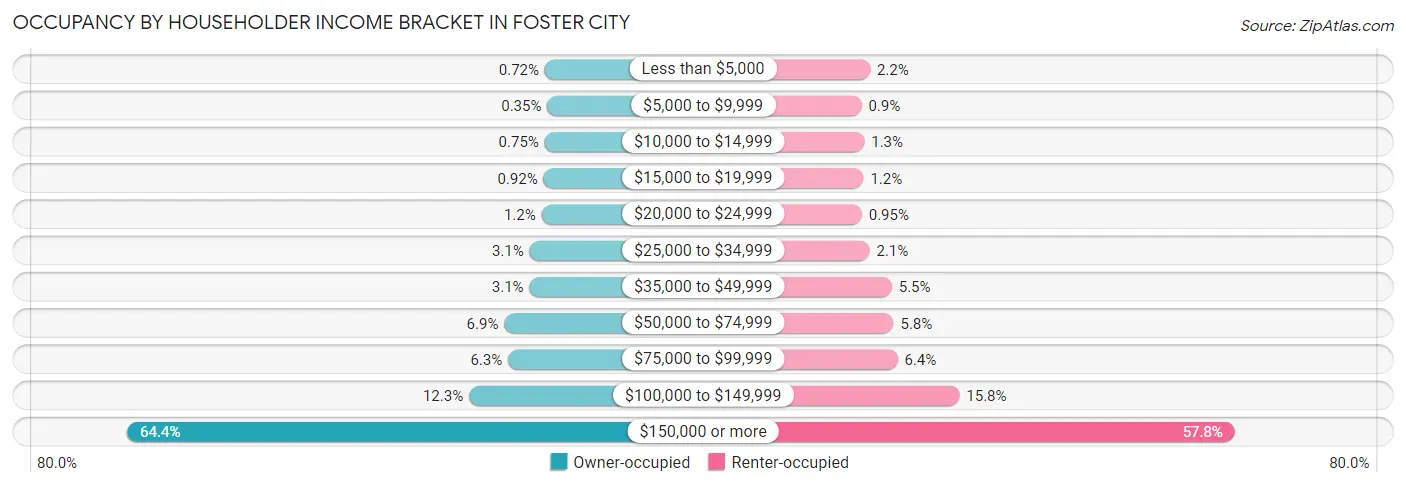
| Income Bracket | Owner-occupied | Renter-occupied |
| Less than $5,000 | 48 (0.7%) | 132 (2.2%) |
| $5,000 to $9,999 | 23 (0.4%) | 54 (0.9%) |
| $10,000 to $14,999 | 50 (0.7%) | 80 (1.3%) |
| $15,000 to $19,999 | 61 (0.9%) | 73 (1.2%) |
| $20,000 to $24,999 | 82 (1.2%) | 57 (0.9%) |
| $25,000 to $34,999 | 203 (3.0%) | 128 (2.1%) |
| $35,000 to $49,999 | 204 (3.1%) | 332 (5.5%) |
| $50,000 to $74,999 | 459 (6.9%) | 348 (5.8%) |
| $75,000 to $99,999 | 421 (6.3%) | 384 (6.4%) |
| $100,000 to $149,999 | 816 (12.3%) | 951 (15.8%) |
| $150,000 or more | 4,279 (64.4%) | 3,473 (57.8%) |
| Total | 6,646 (100.0%) | 6,012 (100.0%) |
Monthly Housing Cost Tiers in Foster City
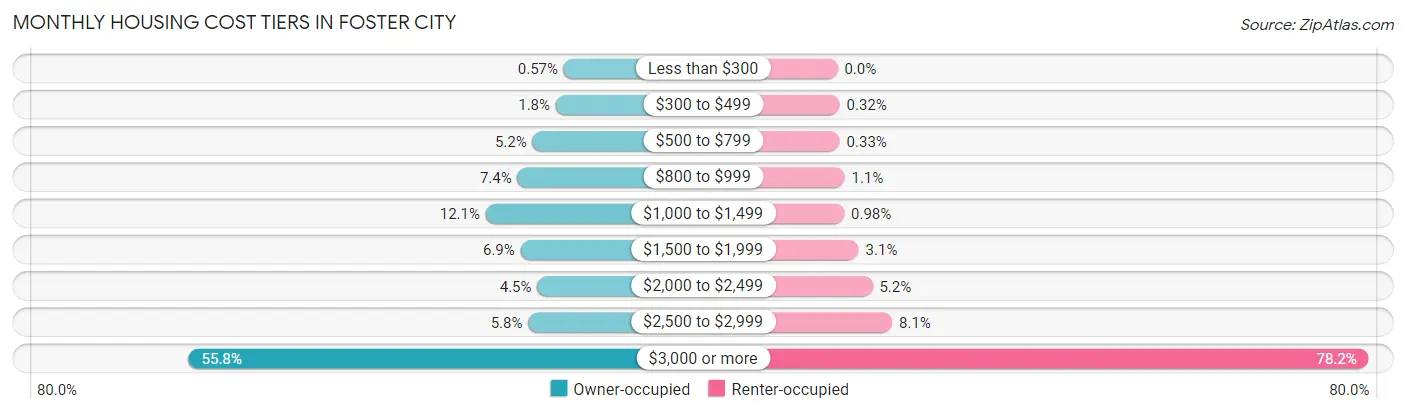
| Monthly Cost | Owner-occupied | Renter-occupied |
| Less than $300 | 38 (0.6%) | 0 (0.0%) |
| $300 to $499 | 116 (1.8%) | 19 (0.3%) |
| $500 to $799 | 344 (5.2%) | 20 (0.3%) |
| $800 to $999 | 491 (7.4%) | 63 (1.1%) |
| $1,000 to $1,499 | 802 (12.1%) | 59 (1.0%) |
| $1,500 to $1,999 | 461 (6.9%) | 188 (3.1%) |
| $2,000 to $2,499 | 297 (4.5%) | 310 (5.2%) |
| $2,500 to $2,999 | 386 (5.8%) | 484 (8.1%) |
| $3,000 or more | 3,711 (55.8%) | 4,704 (78.2%) |
| Total | 6,646 (100.0%) | 6,012 (100.0%) |
Physical Housing Characteristics in Foster City
Housing Structures in Foster City
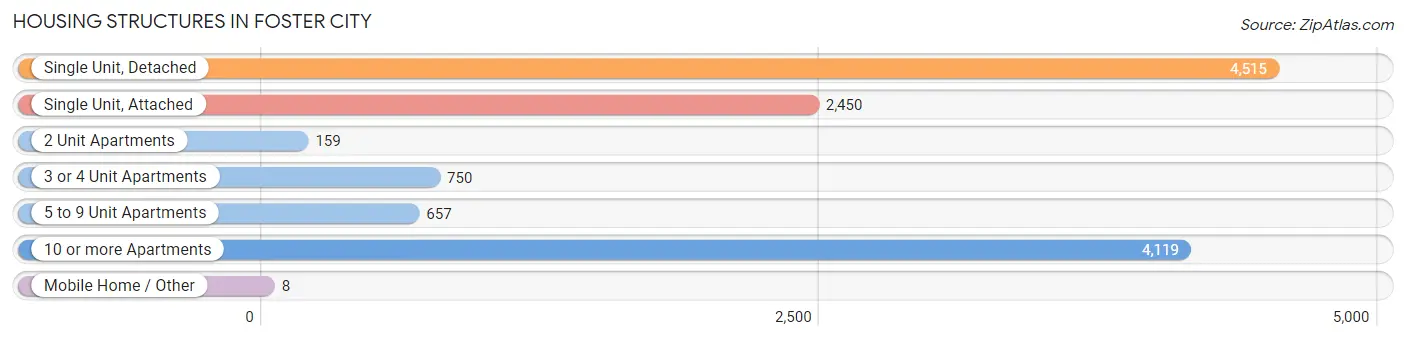
| Structure Type | # Housing Units | % Housing Units |
| Single Unit, Detached | 4,515 | 35.7% |
| Single Unit, Attached | 2,450 | 19.4% |
| 2 Unit Apartments | 159 | 1.3% |
| 3 or 4 Unit Apartments | 750 | 5.9% |
| 5 to 9 Unit Apartments | 657 | 5.2% |
| 10 or more Apartments | 4,119 | 32.5% |
| Mobile Home / Other | 8 | 0.1% |
| Total | 12,658 | 100.0% |
Housing Structures by Occupancy in Foster City
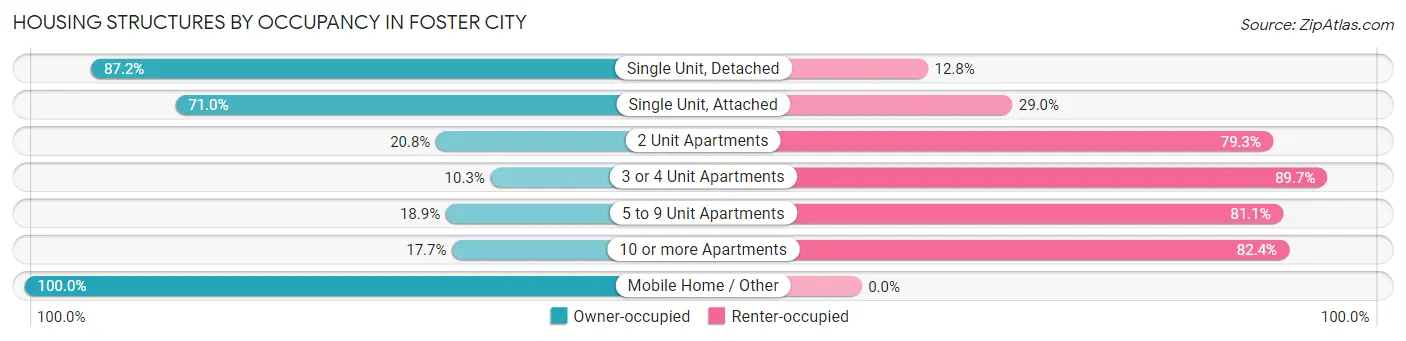
| Structure Type | Owner-occupied | Renter-occupied |
| Single Unit, Detached | 3,938 (87.2%) | 577 (12.8%) |
| Single Unit, Attached | 1,739 (71.0%) | 711 (29.0%) |
| 2 Unit Apartments | 33 (20.7%) | 126 (79.2%) |
| 3 or 4 Unit Apartments | 77 (10.3%) | 673 (89.7%) |
| 5 to 9 Unit Apartments | 124 (18.9%) | 533 (81.1%) |
| 10 or more Apartments | 727 (17.6%) | 3,392 (82.4%) |
| Mobile Home / Other | 8 (100.0%) | 0 (0.0%) |
| Total | 6,646 (52.5%) | 6,012 (47.5%) |
Housing Structures by Number of Rooms in Foster City
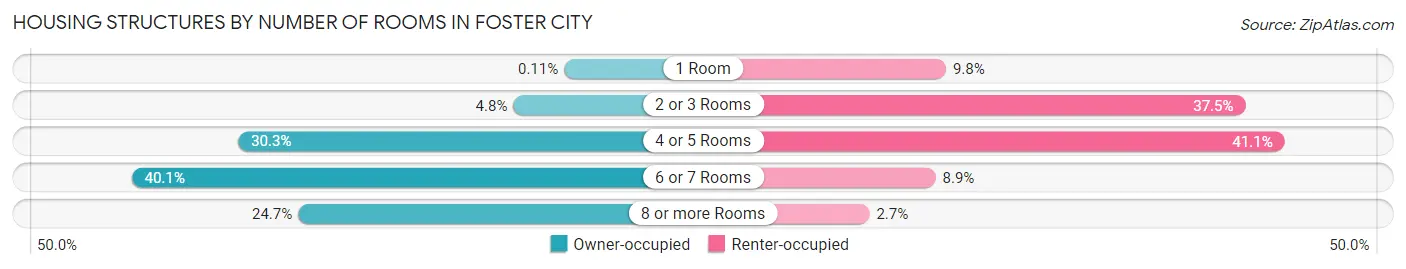
| Number of Rooms | Owner-occupied | Renter-occupied |
| 1 Room | 7 (0.1%) | 590 (9.8%) |
| 2 or 3 Rooms | 320 (4.8%) | 2,254 (37.5%) |
| 4 or 5 Rooms | 2,011 (30.3%) | 2,472 (41.1%) |
| 6 or 7 Rooms | 2,666 (40.1%) | 532 (8.8%) |
| 8 or more Rooms | 1,642 (24.7%) | 164 (2.7%) |
| Total | 6,646 (100.0%) | 6,012 (100.0%) |
Housing Structure by Heating Type in Foster City
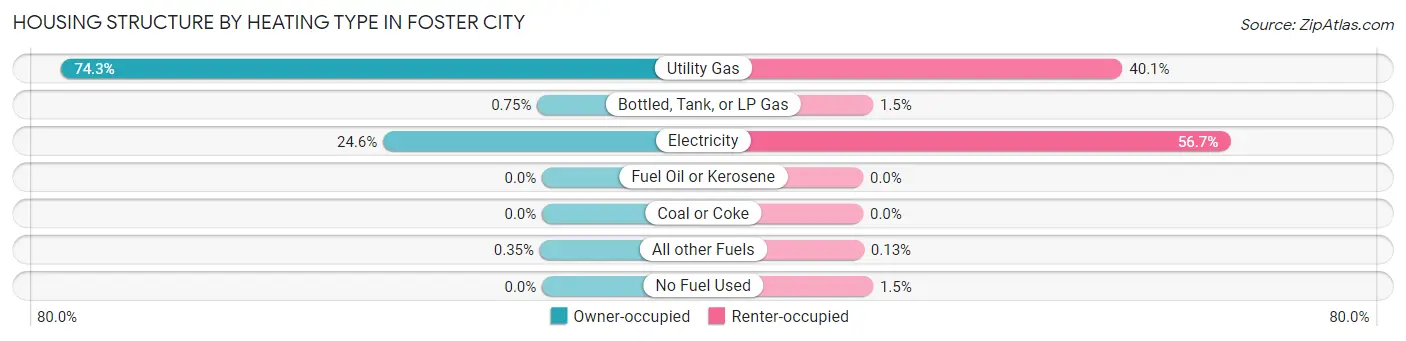
| Heating Type | Owner-occupied | Renter-occupied |
| Utility Gas | 4,939 (74.3%) | 2,410 (40.1%) |
| Bottled, Tank, or LP Gas | 50 (0.7%) | 92 (1.5%) |
| Electricity | 1,634 (24.6%) | 3,410 (56.7%) |
| Fuel Oil or Kerosene | 0 (0.0%) | 0 (0.0%) |
| Coal or Coke | 0 (0.0%) | 0 (0.0%) |
| All other Fuels | 23 (0.4%) | 8 (0.1%) |
| No Fuel Used | 0 (0.0%) | 92 (1.5%) |
| Total | 6,646 (100.0%) | 6,012 (100.0%) |
Household Vehicle Usage in Foster City
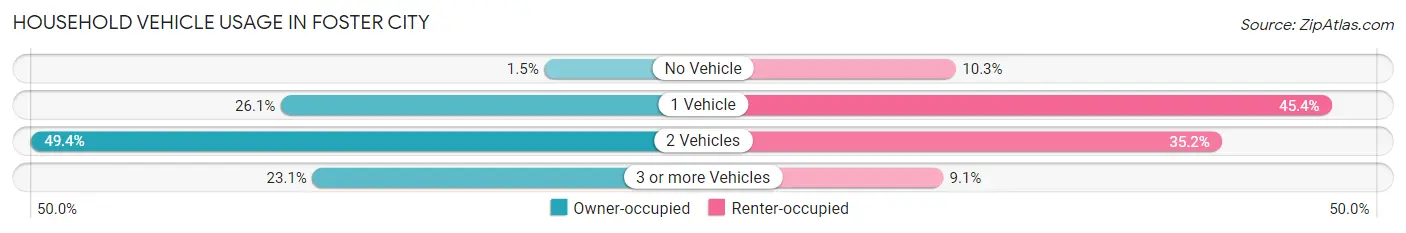
| Vehicles per Household | Owner-occupied | Renter-occupied |
| No Vehicle | 98 (1.5%) | 620 (10.3%) |
| 1 Vehicle | 1,731 (26.1%) | 2,730 (45.4%) |
| 2 Vehicles | 3,281 (49.4%) | 2,114 (35.2%) |
| 3 or more Vehicles | 1,536 (23.1%) | 548 (9.1%) |
| Total | 6,646 (100.0%) | 6,012 (100.0%) |
Real Estate & Mortgages in Foster City
Real Estate and Mortgage Overview in Foster City
| Characteristic | Without Mortgage | With Mortgage |
| Housing Units | 2,070 | 4,576 |
| Median Property Value | $1,633,700 | $1,683,900 |
| Median Household Income | $123,523 | $3,423 |
| Monthly Housing Costs | $1,046 | $3,698 |
| Real Estate Taxes | $5,943 | $54 |
Property Value by Mortgage Status in Foster City
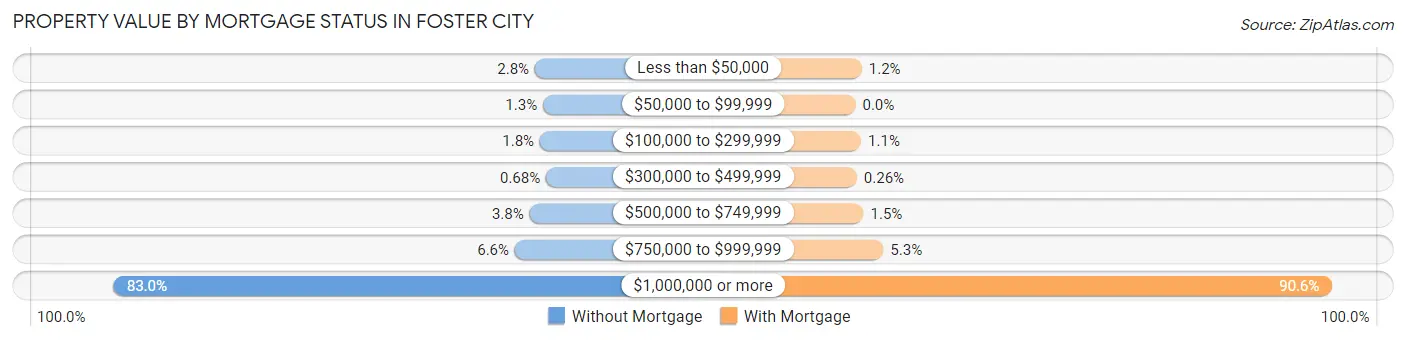
| Property Value | Without Mortgage | With Mortgage |
| Less than $50,000 | 58 (2.8%) | 55 (1.2%) |
| $50,000 to $99,999 | 26 (1.3%) | 0 (0.0%) |
| $100,000 to $299,999 | 38 (1.8%) | 49 (1.1%) |
| $300,000 to $499,999 | 14 (0.7%) | 12 (0.3%) |
| $500,000 to $749,999 | 79 (3.8%) | 70 (1.5%) |
| $750,000 to $999,999 | 137 (6.6%) | 243 (5.3%) |
| $1,000,000 or more | 1,718 (83.0%) | 4,147 (90.6%) |
| Total | 2,070 (100.0%) | 4,576 (100.0%) |
Household Income by Mortgage Status in Foster City
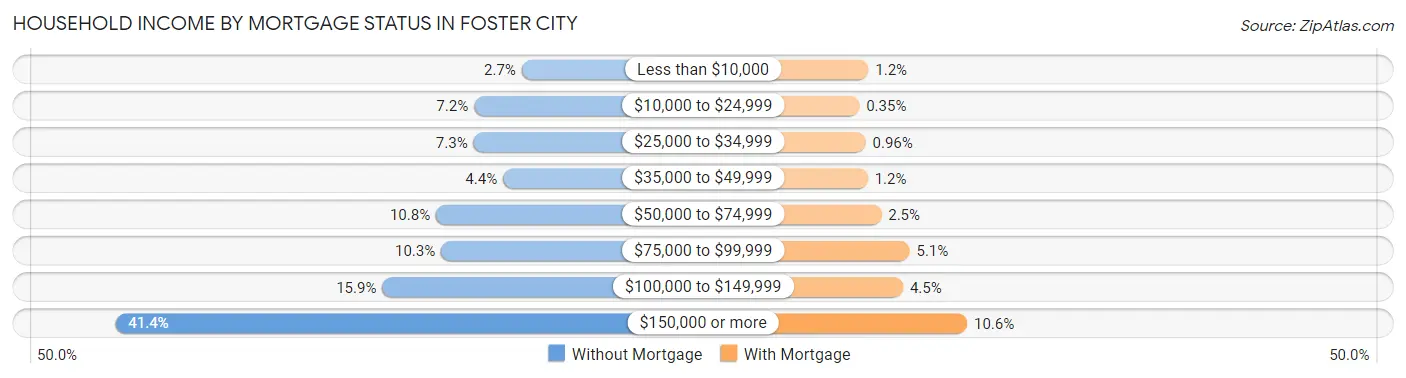
| Household Income | Without Mortgage | With Mortgage |
| Less than $10,000 | 55 (2.7%) | 56 (1.2%) |
| $10,000 to $24,999 | 149 (7.2%) | 16 (0.4%) |
| $25,000 to $34,999 | 150 (7.2%) | 44 (1.0%) |
| $35,000 to $49,999 | 92 (4.4%) | 53 (1.2%) |
| $50,000 to $74,999 | 224 (10.8%) | 112 (2.5%) |
| $75,000 to $99,999 | 214 (10.3%) | 235 (5.1%) |
| $100,000 to $149,999 | 330 (15.9%) | 207 (4.5%) |
| $150,000 or more | 856 (41.3%) | 486 (10.6%) |
| Total | 2,070 (100.0%) | 4,576 (100.0%) |
Property Value to Household Income Ratio in Foster City
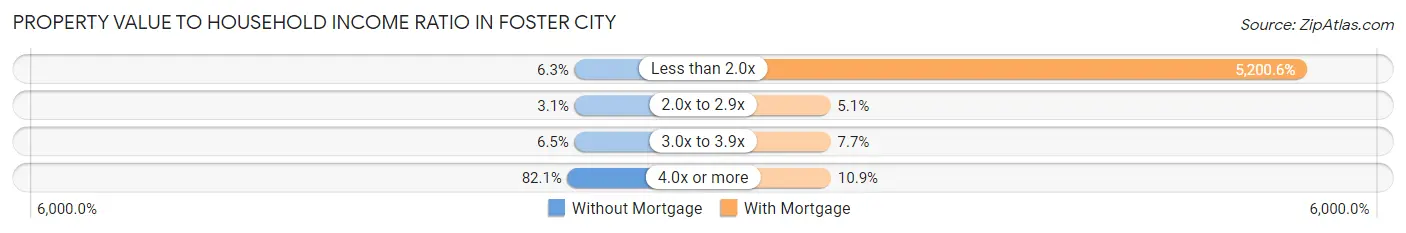
| Value-to-Income Ratio | Without Mortgage | With Mortgage |
| Less than 2.0x | 130 (6.3%) | 237,981 (5,200.6%) |
| 2.0x to 2.9x | 65 (3.1%) | 234 (5.1%) |
| 3.0x to 3.9x | 134 (6.5%) | 354 (7.7%) |
| 4.0x or more | 1,700 (82.1%) | 497 (10.9%) |
| Total | 2,070 (100.0%) | 4,576 (100.0%) |
Real Estate Taxes by Mortgage Status in Foster City
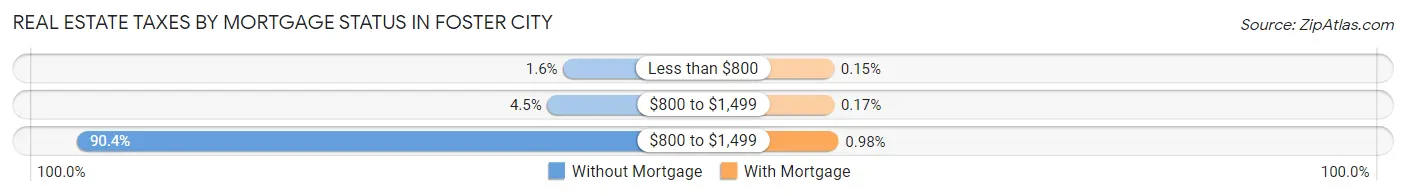
| Property Taxes | Without Mortgage | With Mortgage |
| Less than $800 | 33 (1.6%) | 7 (0.2%) |
| $800 to $1,499 | 93 (4.5%) | 8 (0.2%) |
| $800 to $1,499 | 1,872 (90.4%) | 45 (1.0%) |
| Total | 2,070 (100.0%) | 4,576 (100.0%) |
Health & Disability in Foster City
Health Insurance Coverage by Age in Foster City
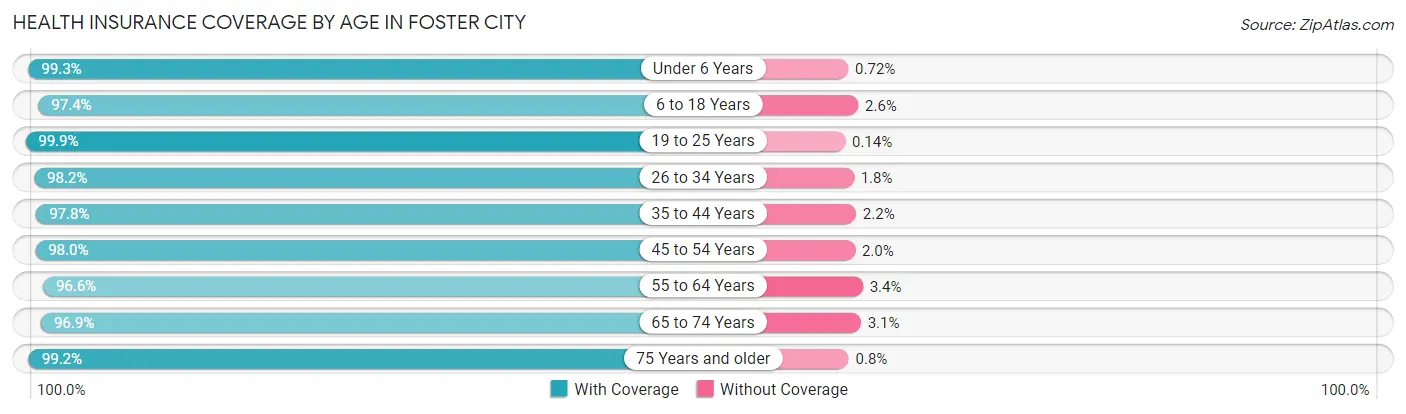
| Age Bracket | With Coverage | Without Coverage |
| Under 6 Years | 2,487 (99.3%) | 18 (0.7%) |
| 6 to 18 Years | 5,098 (97.4%) | 135 (2.6%) |
| 19 to 25 Years | 1,418 (99.9%) | 2 (0.1%) |
| 26 to 34 Years | 4,572 (98.2%) | 82 (1.8%) |
| 35 to 44 Years | 5,555 (97.8%) | 123 (2.2%) |
| 45 to 54 Years | 3,999 (98.0%) | 81 (2.0%) |
| 55 to 64 Years | 3,440 (96.6%) | 122 (3.4%) |
| 65 to 74 Years | 2,729 (96.9%) | 86 (3.1%) |
| 75 Years and older | 3,109 (99.2%) | 25 (0.8%) |
| Total | 32,407 (98.0%) | 674 (2.0%) |
Health Insurance Coverage by Citizenship Status in Foster City
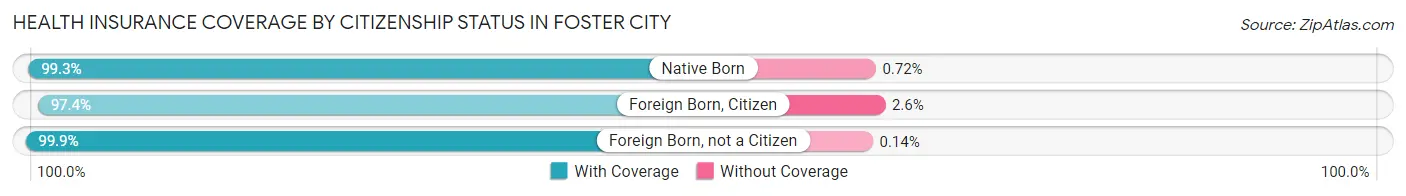
| Citizenship Status | With Coverage | Without Coverage |
| Native Born | 2,487 (99.3%) | 18 (0.7%) |
| Foreign Born, Citizen | 5,098 (97.4%) | 135 (2.6%) |
| Foreign Born, not a Citizen | 1,418 (99.9%) | 2 (0.1%) |
Health Insurance Coverage by Household Income in Foster City
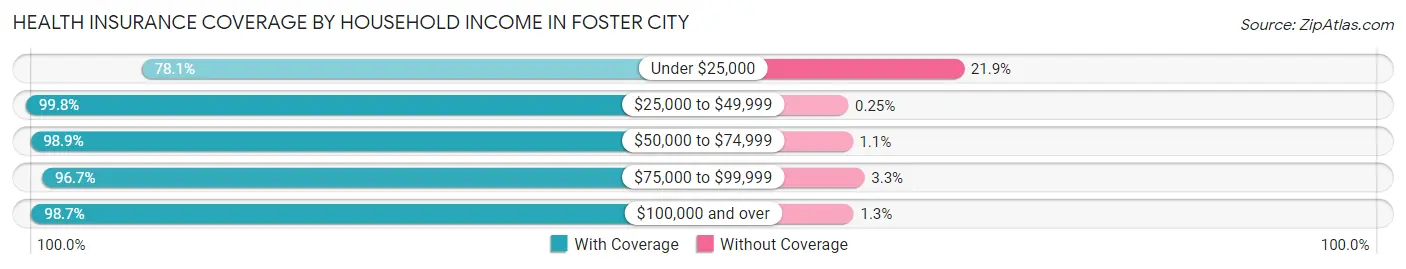
| Household Income | With Coverage | Without Coverage |
| Under $25,000 | 907 (78.1%) | 255 (21.9%) |
| $25,000 to $49,999 | 1,592 (99.8%) | 4 (0.3%) |
| $50,000 to $74,999 | 1,309 (98.9%) | 14 (1.1%) |
| $75,000 to $99,999 | 1,732 (96.7%) | 59 (3.3%) |
| $100,000 and over | 26,748 (98.7%) | 341 (1.3%) |
Public vs Private Health Insurance Coverage by Age in Foster City
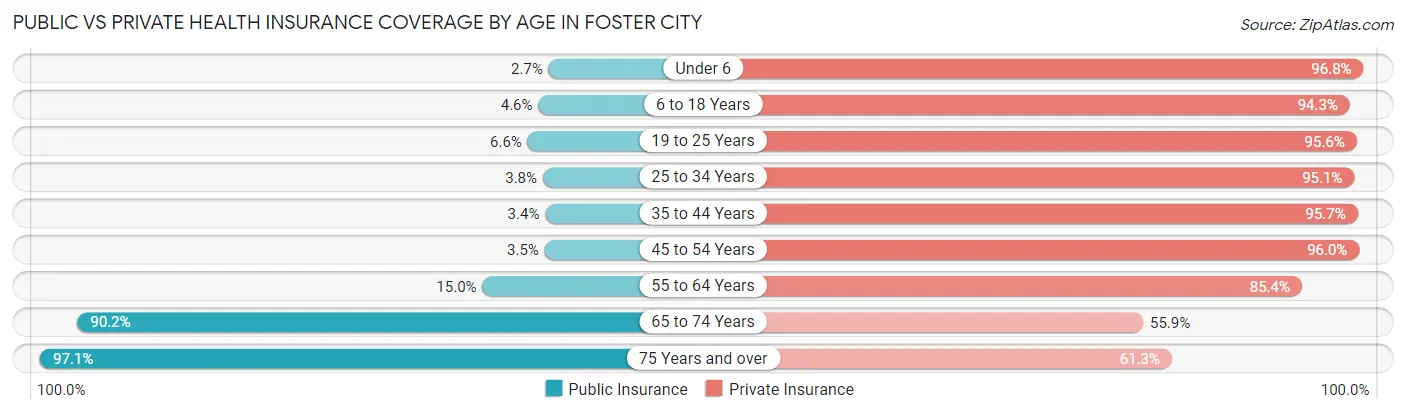
| Age Bracket | Public Insurance | Private Insurance |
| Under 6 | 68 (2.7%) | 2,425 (96.8%) |
| 6 to 18 Years | 243 (4.6%) | 4,933 (94.3%) |
| 19 to 25 Years | 94 (6.6%) | 1,357 (95.6%) |
| 25 to 34 Years | 177 (3.8%) | 4,426 (95.1%) |
| 35 to 44 Years | 191 (3.4%) | 5,435 (95.7%) |
| 45 to 54 Years | 141 (3.5%) | 3,918 (96.0%) |
| 55 to 64 Years | 535 (15.0%) | 3,041 (85.4%) |
| 65 to 74 Years | 2,539 (90.2%) | 1,574 (55.9%) |
| 75 Years and over | 3,044 (97.1%) | 1,920 (61.3%) |
| Total | 7,032 (21.3%) | 29,029 (87.7%) |
Disability Status by Sex by Age in Foster City
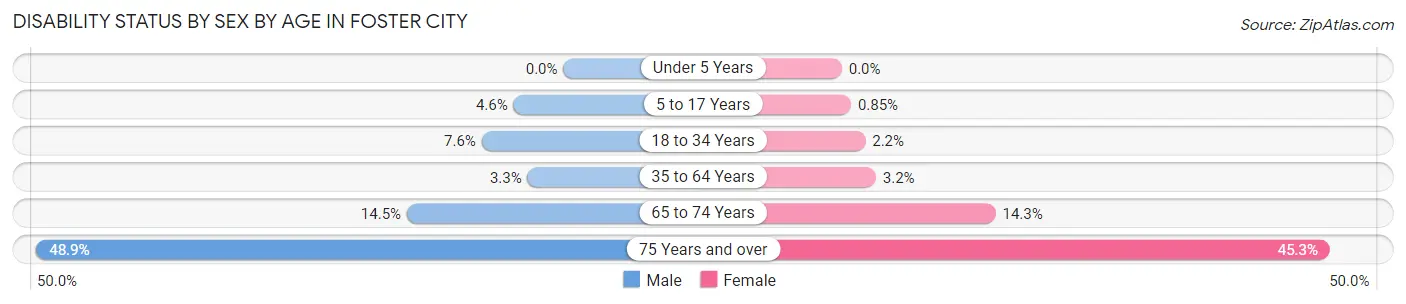
| Age Bracket | Male | Female |
| Under 5 Years | 0 (0.0%) | 0 (0.0%) |
| 5 to 17 Years | 130 (4.6%) | 22 (0.9%) |
| 18 to 34 Years | 249 (7.6%) | 67 (2.2%) |
| 35 to 64 Years | 217 (3.3%) | 214 (3.2%) |
| 65 to 74 Years | 195 (14.5%) | 210 (14.3%) |
| 75 Years and over | 630 (48.9%) | 836 (45.3%) |
Disability Class by Sex by Age in Foster City
Disability Class: Hearing Difficulty
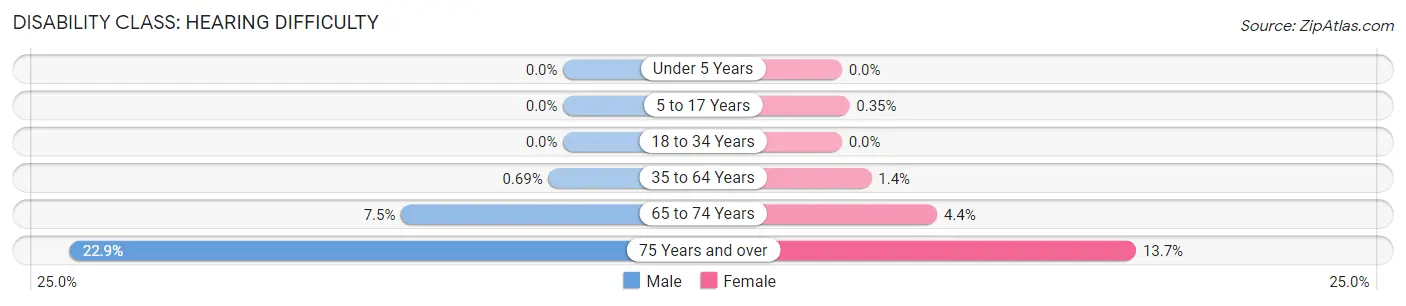
| Age Bracket | Male | Female |
| Under 5 Years | 0 (0.0%) | 0 (0.0%) |
| 5 to 17 Years | 0 (0.0%) | 9 (0.4%) |
| 18 to 34 Years | 0 (0.0%) | 0 (0.0%) |
| 35 to 64 Years | 45 (0.7%) | 93 (1.4%) |
| 65 to 74 Years | 101 (7.5%) | 65 (4.4%) |
| 75 Years and over | 295 (22.9%) | 252 (13.7%) |
Disability Class: Vision Difficulty
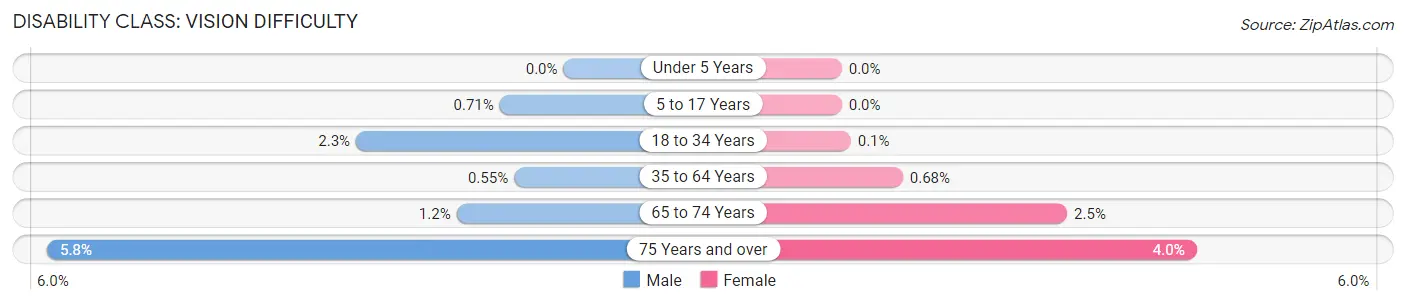
| Age Bracket | Male | Female |
| Under 5 Years | 0 (0.0%) | 0 (0.0%) |
| 5 to 17 Years | 20 (0.7%) | 0 (0.0%) |
| 18 to 34 Years | 76 (2.3%) | 3 (0.1%) |
| 35 to 64 Years | 36 (0.5%) | 46 (0.7%) |
| 65 to 74 Years | 16 (1.2%) | 37 (2.5%) |
| 75 Years and over | 74 (5.8%) | 73 (4.0%) |
Disability Class: Cognitive Difficulty
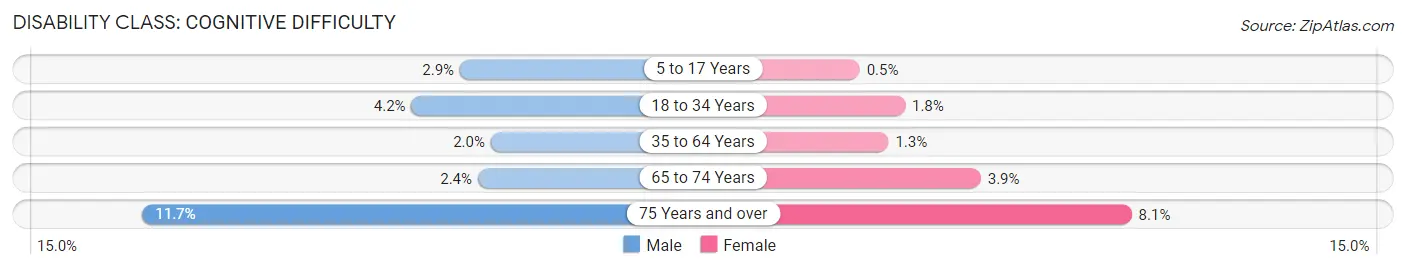
| Age Bracket | Male | Female |
| 5 to 17 Years | 81 (2.9%) | 13 (0.5%) |
| 18 to 34 Years | 139 (4.2%) | 54 (1.8%) |
| 35 to 64 Years | 132 (2.0%) | 88 (1.3%) |
| 65 to 74 Years | 32 (2.4%) | 57 (3.9%) |
| 75 Years and over | 151 (11.7%) | 149 (8.1%) |
Disability Class: Ambulatory Difficulty
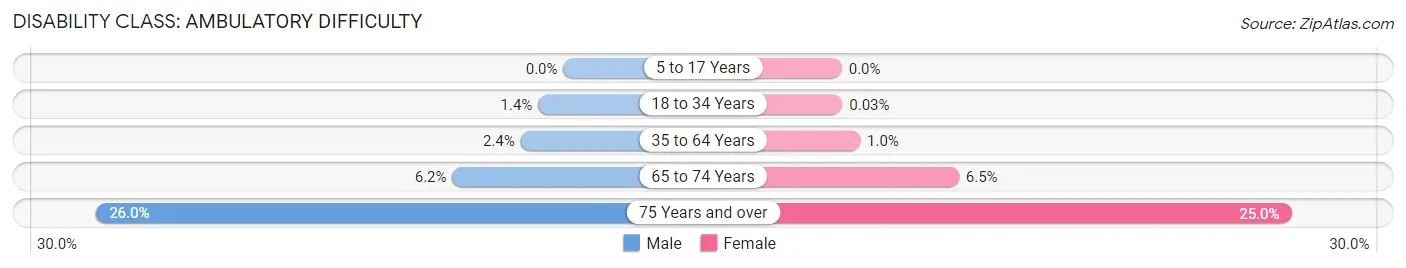
| Age Bracket | Male | Female |
| 5 to 17 Years | 0 (0.0%) | 0 (0.0%) |
| 18 to 34 Years | 46 (1.4%) | 1 (0.0%) |
| 35 to 64 Years | 156 (2.4%) | 69 (1.0%) |
| 65 to 74 Years | 83 (6.2%) | 96 (6.5%) |
| 75 Years and over | 335 (26.0%) | 462 (25.0%) |
Disability Class: Self-Care Difficulty
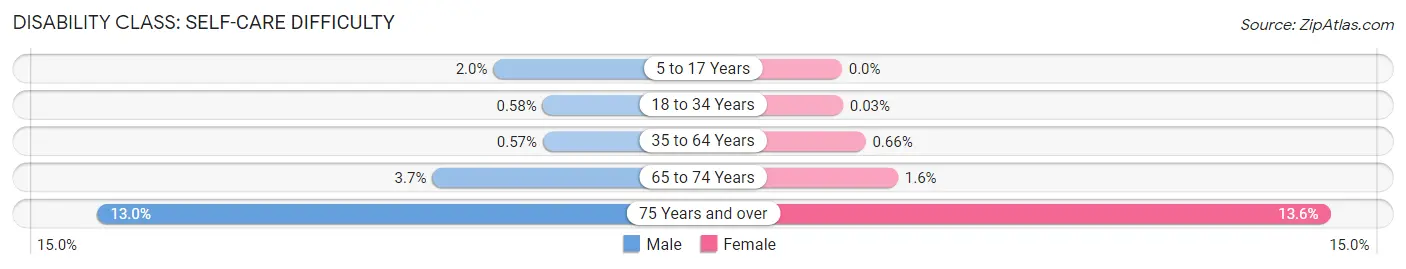
| Age Bracket | Male | Female |
| 5 to 17 Years | 55 (1.9%) | 0 (0.0%) |
| 18 to 34 Years | 19 (0.6%) | 1 (0.0%) |
| 35 to 64 Years | 37 (0.6%) | 45 (0.7%) |
| 65 to 74 Years | 49 (3.6%) | 23 (1.6%) |
| 75 Years and over | 167 (13.0%) | 251 (13.6%) |
Technology Access in Foster City
Computing Device Access in Foster City
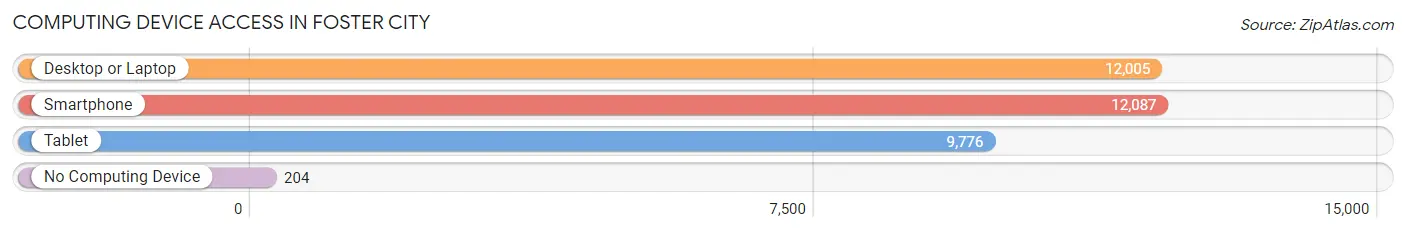
| Device Type | # Households | % Households |
| Desktop or Laptop | 12,005 | 94.8% |
| Smartphone | 12,087 | 95.5% |
| Tablet | 9,776 | 77.2% |
| No Computing Device | 204 | 1.6% |
| Total | 12,658 | 100.0% |
Internet Access in Foster City
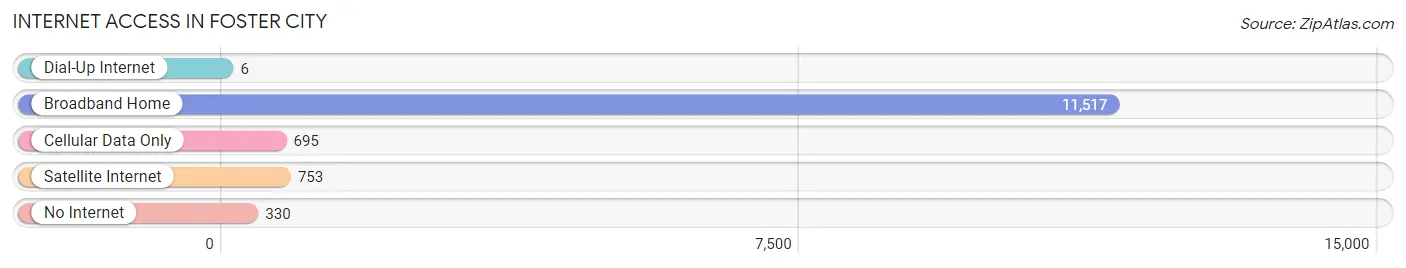
| Internet Type | # Households | % Households |
| Dial-Up Internet | 6 | 0.1% |
| Broadband Home | 11,517 | 91.0% |
| Cellular Data Only | 695 | 5.5% |
| Satellite Internet | 753 | 5.9% |
| No Internet | 330 | 2.6% |
| Total | 12,658 | 100.0% |
Foster City Summary
Foster City is a city located in San Mateo County, California, United States, located in the San Francisco Bay Area. It is situated between San Mateo and San Carlos, and is bordered by the San Francisco Bay to the east and the San Mateo Bridge to the west. The city was incorporated in 1971 and is named after T. Jack Foster, a real estate magnate who owned much of the land comprising the city.
Geography
Foster City is located at 37°31'N 122°17'W (37.5179, -122.2845). It is situated on the eastern shore of the San Francisco Bay, between San Mateo and San Carlos. The city covers an area of 6.2 square miles, of which 5.3 square miles is land and 0.9 square miles is water. The city is located on a peninsula, with the San Francisco Bay to the east and the San Mateo Bridge to the west.
Climate
Foster City has a mild Mediterranean climate, with warm, dry summers and mild, wet winters. The average annual temperature is 61°F, with an average high of 68°F in July and an average low of 54°F in January. The average annual precipitation is 22.3 inches, with an average of 2.3 inches in July and an average of 4.2 inches in January.
Demographics
As of the 2010 census, Foster City had a population of 30,567. The racial makeup of the city was 57.2% White, 16.3% Asian, 11.2% Hispanic or Latino, 8.2% African American, 0.3% Native American, 0.1% Pacific Islander, and 6.9% from other races.
Economy
Foster City is home to a number of major employers, including Visa, Gilead Sciences, Sony, and Oracle. The city is also home to a number of technology companies, including Electronic Arts, Symantec, and Oracle. The city is also home to a number of retail stores, including Target, Walmart, and Safeway.
History
Foster City was founded in 1971 by T. Jack Foster, a real estate magnate who owned much of the land comprising the city. The city was incorporated in 1971 and was named after Foster. The city was designed to be a planned community, with a focus on providing a high quality of life for its residents.
In the 1980s, Foster City experienced a period of rapid growth, as the city's population grew from 8,000 in 1980 to over 30,000 in 1990. The city's population has continued to grow since then, and as of the 2010 census, the city had a population of 30,567.
Foster City is now a thriving community, with a strong economy and a high quality of life. The city is home to a number of major employers, and is a popular destination for tourists and business travelers alike.
Common Questions
What is Per Capita Income in Foster City?
Per Capita income in Foster City is $91,552.
What is the Median Family Income in Foster City?
Median Family Income in Foster City is $218,632.
What is the Median Household income in Foster City?
Median Household Income in Foster City is $191,267.
What is Income or Wage Gap in Foster City?
Income or Wage Gap in Foster City is 25.3%.
Women in Foster City earn 74.7 cents for every dollar earned by a man.
What is Inequality or Gini Index in Foster City?
Inequality or Gini Index in Foster City is 0.42.
What is the Total Population of Foster City?
Total Population of Foster City is 33,215.
What is the Total Male Population of Foster City?
Total Male Population of Foster City is 16,310.
What is the Total Female Population of Foster City?
Total Female Population of Foster City is 16,905.
What is the Ratio of Males per 100 Females in Foster City?
There are 96.48 Males per 100 Females in Foster City.
What is the Ratio of Females per 100 Males in Foster City?
There are 103.65 Females per 100 Males in Foster City.
What is the Median Population Age in Foster City?
Median Population Age in Foster City is 39.9 Years.
What is the Average Family Size in Foster City
Average Family Size in Foster City is 3.1 People.
What is the Average Household Size in Foster City
Average Household Size in Foster City is 2.6 People.
How Large is the Labor Force in Foster City?
There are 17,740 People in the Labor Forcein in Foster City.
What is the Percentage of People in the Labor Force in Foster City?
66.5% of People are in the Labor Force in Foster City.
What is the Unemployment Rate in Foster City?
Unemployment Rate in Foster City is 4.3%.