Zip Codes with the Highest Percentage of Population Employed in Computer, Engineering & Science in California
RELATED REPORTS & OPTIONS
Computer, Engineering & Science
California
Compare Zip Codes
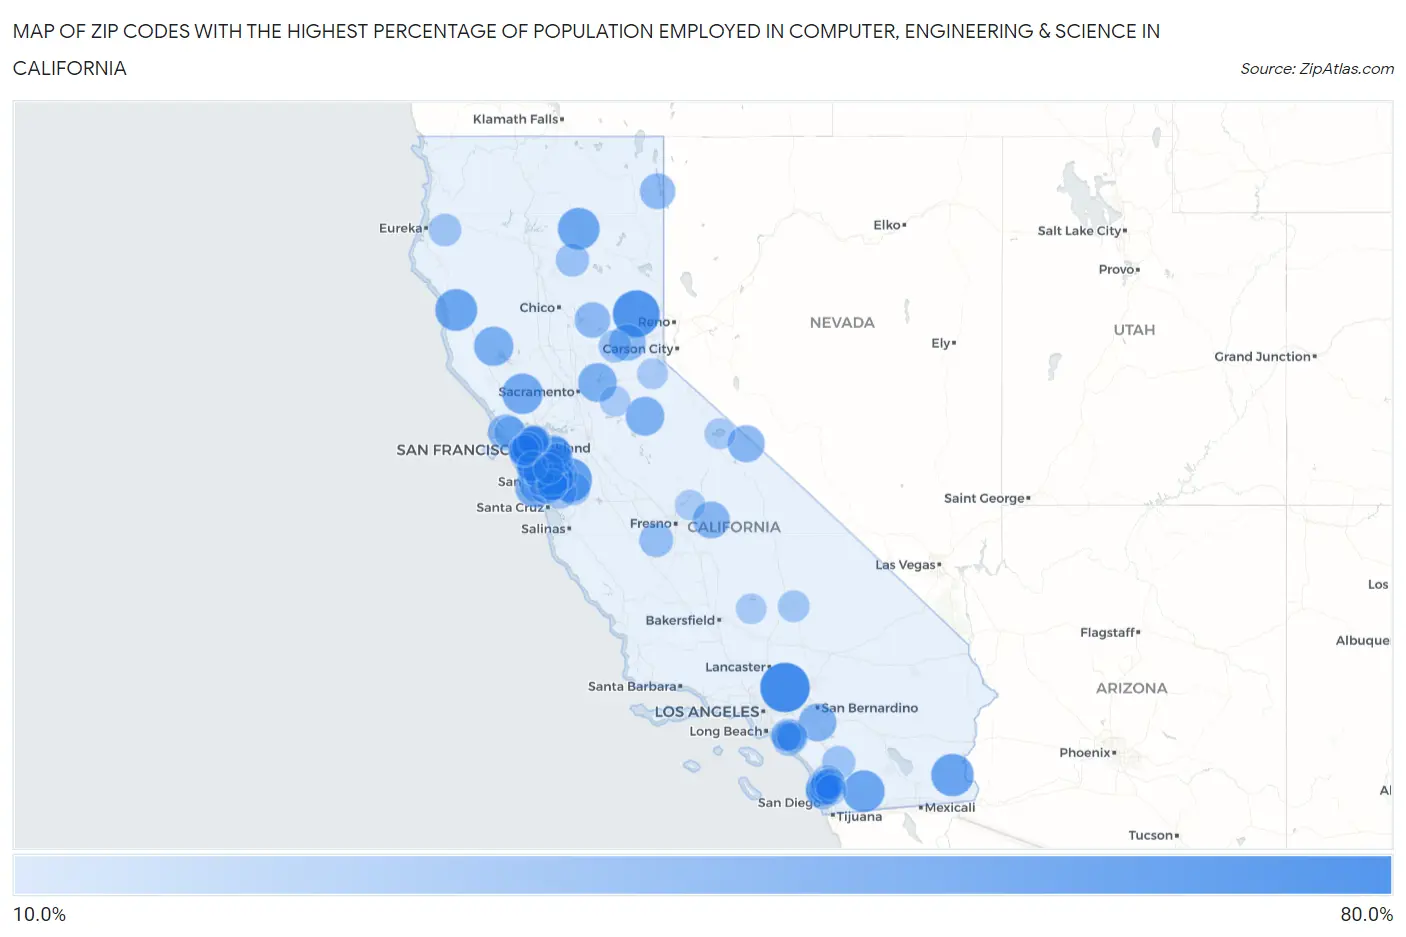
Map of Zip Codes with the Highest Percentage of Population Employed in Computer, Engineering & Science in California
10.0%
80.0%
Zip Codes with the Highest Percentage of Population Employed in Computer, Engineering & Science in California
| Zip Code | % Employed | vs State | vs National | |
| 1. | 93563 | 71.4% | 8.0%(+63.5)#1 | 6.8%(+64.7)#17 |
| 2. | 96124 | 63.8% | 8.0%(+55.8)#2 | 6.8%(+57.0)#20 |
| 3. | 95140 | 56.0% | 8.0%(+48.0)#3 | 6.8%(+49.2)#24 |
| 4. | 95134 | 54.2% | 8.0%(+46.2)#4 | 6.8%(+47.4)#29 |
| 5. | 92266 | 51.9% | 8.0%(+43.9)#5 | 6.8%(+45.1)#35 |
| 6. | 95417 | 50.7% | 8.0%(+42.7)#6 | 6.8%(+43.9)#38 |
| 7. | 91948 | 50.0% | 8.0%(+42.0)#7 | 6.8%(+43.2)#39 |
| 8. | 96040 | 50.0% | 8.0%(+42.0)#8 | 6.8%(+43.2)#41 |
| 9. | 94576 | 46.7% | 8.0%(+38.7)#9 | 6.8%(+39.9)#51 |
| 10. | 94021 | 43.8% | 8.0%(+35.9)#10 | 6.8%(+37.1)#58 |
| 11. | 94086 | 43.7% | 8.0%(+35.7)#11 | 6.8%(+36.9)#60 |
| 12. | 95493 | 43.5% | 8.0%(+35.5)#12 | 6.8%(+36.7)#61 |
| 13. | 95671 | 41.7% | 8.0%(+33.7)#13 | 6.8%(+34.9)#69 |
| 14. | 95014 | 41.4% | 8.0%(+33.4)#14 | 6.8%(+34.6)#73 |
| 15. | 95224 | 41.3% | 8.0%(+33.3)#15 | 6.8%(+34.5)#75 |
| 16. | 94085 | 40.1% | 8.0%(+32.1)#16 | 6.8%(+33.3)#82 |
| 17. | 95054 | 40.0% | 8.0%(+32.1)#17 | 6.8%(+33.3)#83 |
| 18. | 94087 | 39.3% | 8.0%(+31.4)#18 | 6.8%(+32.6)#86 |
| 19. | 92518 | 38.8% | 8.0%(+30.8)#19 | 6.8%(+32.0)#88 |
| 20. | 94539 | 38.4% | 8.0%(+30.5)#20 | 6.8%(+31.7)#93 |
| 21. | 94040 | 38.3% | 8.0%(+30.4)#21 | 6.8%(+31.6)#94 |
| 22. | 95113 | 37.6% | 8.0%(+29.7)#22 | 6.8%(+30.9)#103 |
| 23. | 95051 | 37.0% | 8.0%(+29.0)#23 | 6.8%(+30.2)#113 |
| 24. | 93512 | 36.9% | 8.0%(+29.0)#24 | 6.8%(+30.2)#114 |
| 25. | 94041 | 36.7% | 8.0%(+28.7)#25 | 6.8%(+29.9)#115 |
| 26. | 93621 | 36.5% | 8.0%(+28.6)#26 | 6.8%(+29.8)#118 |
| 27. | 95129 | 36.0% | 8.0%(+28.0)#27 | 6.8%(+29.2)#124 |
| 28. | 94555 | 36.0% | 8.0%(+28.0)#28 | 6.8%(+29.2)#125 |
| 29. | 95715 | 35.8% | 8.0%(+27.9)#29 | 6.8%(+29.1)#127 |
| 30. | 94043 | 35.2% | 8.0%(+27.3)#30 | 6.8%(+28.5)#129 |
| 31. | 94950 | 34.8% | 8.0%(+26.8)#31 | 6.8%(+28.0)#135 |
| 32. | 95941 | 33.3% | 8.0%(+25.4)#32 | 6.8%(+26.6)#143 |
| 33. | 96110 | 33.3% | 8.0%(+25.4)#33 | 6.8%(+26.6)#145 |
| 34. | 94089 | 32.7% | 8.0%(+24.7)#34 | 6.8%(+25.9)#149 |
| 35. | 94404 | 32.1% | 8.0%(+24.2)#35 | 6.8%(+25.4)#154 |
| 36. | 95131 | 30.8% | 8.0%(+22.9)#36 | 6.8%(+24.1)#166 |
| 37. | 93627 | 29.1% | 8.0%(+21.2)#37 | 6.8%(+22.4)#186 |
| 38. | 94107 | 28.5% | 8.0%(+20.6)#38 | 6.8%(+21.8)#196 |
| 39. | 95035 | 28.4% | 8.0%(+20.4)#39 | 6.8%(+21.6)#198 |
| 40. | 94020 | 28.4% | 8.0%(+20.4)#40 | 6.8%(+21.6)#199 |
| 41. | 94306 | 28.3% | 8.0%(+20.3)#41 | 6.8%(+21.5)#201 |
| 42. | 94065 | 28.1% | 8.0%(+20.1)#42 | 6.8%(+21.3)#206 |
| 43. | 94568 | 28.1% | 8.0%(+20.1)#43 | 6.8%(+21.3)#207 |
| 44. | 94538 | 27.8% | 8.0%(+19.8)#44 | 6.8%(+21.0)#213 |
| 45. | 92130 | 27.7% | 8.0%(+19.7)#45 | 6.8%(+20.9)#220 |
| 46. | 94301 | 27.4% | 8.0%(+19.5)#46 | 6.8%(+20.7)#222 |
| 47. | 96063 | 27.1% | 8.0%(+19.1)#47 | 6.8%(+20.3)#226 |
| 48. | 92122 | 27.0% | 8.0%(+19.0)#48 | 6.8%(+20.2)#228 |
| 49. | 92061 | 26.7% | 8.0%(+18.7)#49 | 6.8%(+19.9)#236 |
| 50. | 92121 | 26.7% | 8.0%(+18.7)#50 | 6.8%(+19.9)#237 |
| 51. | 94582 | 26.4% | 8.0%(+18.4)#51 | 6.8%(+19.6)#246 |
| 52. | 94536 | 26.1% | 8.0%(+18.2)#52 | 6.8%(+19.4)#249 |
| 53. | 95135 | 25.8% | 8.0%(+17.8)#53 | 6.8%(+19.0)#259 |
| 54. | 94024 | 25.8% | 8.0%(+17.8)#54 | 6.8%(+19.0)#260 |
| 55. | 95070 | 25.4% | 8.0%(+17.5)#55 | 6.8%(+18.7)#268 |
| 56. | 92127 | 25.3% | 8.0%(+17.3)#56 | 6.8%(+18.5)#270 |
| 57. | 95550 | 25.2% | 8.0%(+17.2)#57 | 6.8%(+18.4)#271 |
| 58. | 95714 | 25.1% | 8.0%(+17.2)#58 | 6.8%(+18.4)#272 |
| 59. | 95120 | 25.0% | 8.0%(+17.1)#59 | 6.8%(+18.3)#274 |
| 60. | 95132 | 23.9% | 8.0%(+15.9)#60 | 6.8%(+17.1)#303 |
| 61. | 92603 | 23.8% | 8.0%(+15.9)#61 | 6.8%(+17.1)#306 |
| 62. | 92606 | 23.8% | 8.0%(+15.8)#62 | 6.8%(+17.0)#312 |
| 63. | 94588 | 23.7% | 8.0%(+15.8)#63 | 6.8%(+17.0)#315 |
| 64. | 94158 | 23.7% | 8.0%(+15.7)#64 | 6.8%(+16.9)#317 |
| 65. | 94105 | 23.6% | 8.0%(+15.6)#65 | 6.8%(+16.8)#321 |
| 66. | 94022 | 23.5% | 8.0%(+15.6)#66 | 6.8%(+16.8)#323 |
| 67. | 94002 | 23.5% | 8.0%(+15.5)#67 | 6.8%(+16.7)#324 |
| 68. | 94933 | 23.4% | 8.0%(+15.4)#68 | 6.8%(+16.6)#329 |
| 69. | 92126 | 23.3% | 8.0%(+15.3)#69 | 6.8%(+16.5)#331 |
| 70. | 95133 | 22.9% | 8.0%(+14.9)#70 | 6.8%(+16.1)#351 |
| 71. | 95130 | 22.9% | 8.0%(+14.9)#71 | 6.8%(+16.1)#358 |
| 72. | 95050 | 22.7% | 8.0%(+14.7)#72 | 6.8%(+15.9)#363 |
| 73. | 93555 | 22.7% | 8.0%(+14.7)#73 | 6.8%(+15.9)#365 |
| 74. | 94005 | 22.6% | 8.0%(+14.6)#74 | 6.8%(+15.8)#368 |
| 75. | 94709 | 22.0% | 8.0%(+14.0)#75 | 6.8%(+15.2)#392 |
| 76. | 92129 | 21.5% | 8.0%(+13.5)#76 | 6.8%(+14.7)#405 |
| 77. | 92128 | 21.3% | 8.0%(+13.4)#77 | 6.8%(+14.6)#419 |
| 78. | 92620 | 21.1% | 8.0%(+13.1)#78 | 6.8%(+14.3)#434 |
| 79. | 94025 | 21.1% | 8.0%(+13.1)#79 | 6.8%(+14.3)#435 |
| 80. | 94703 | 20.9% | 8.0%(+12.9)#80 | 6.8%(+14.1)#446 |
| 81. | 94103 | 20.8% | 8.0%(+12.8)#81 | 6.8%(+14.0)#454 |
| 82. | 93541 | 20.6% | 8.0%(+12.7)#82 | 6.8%(+13.9)#460 |
| 83. | 94114 | 20.4% | 8.0%(+12.4)#83 | 6.8%(+13.6)#481 |
| 84. | 94131 | 20.4% | 8.0%(+12.4)#84 | 6.8%(+13.6)#482 |
| 85. | 94566 | 20.2% | 8.0%(+12.3)#85 | 6.8%(+13.5)#491 |
| 86. | 95699 | 20.0% | 8.0%(+12.0)#86 | 6.8%(+13.2)#511 |
| 87. | 95735 | 20.0% | 8.0%(+12.0)#87 | 6.8%(+13.2)#512 |
| 88. | 92131 | 20.0% | 8.0%(+12.0)#88 | 6.8%(+13.2)#514 |
| 89. | 94708 | 19.7% | 8.0%(+11.8)#89 | 6.8%(+13.0)#529 |
| 90. | 94706 | 19.7% | 8.0%(+11.8)#90 | 6.8%(+13.0)#530 |
| 91. | 92618 | 19.6% | 8.0%(+11.7)#91 | 6.8%(+12.9)#538 |
| 92. | 93205 | 19.6% | 8.0%(+11.7)#92 | 6.8%(+12.9)#542 |
| 93. | 94707 | 19.6% | 8.0%(+11.6)#93 | 6.8%(+12.8)#545 |
| 94. | 94117 | 19.5% | 8.0%(+11.5)#94 | 6.8%(+12.7)#553 |
| 95. | 94111 | 19.4% | 8.0%(+11.5)#95 | 6.8%(+12.7)#560 |
| 96. | 95008 | 19.2% | 8.0%(+11.3)#96 | 6.8%(+12.5)#576 |
| 97. | 94403 | 19.0% | 8.0%(+11.1)#97 | 6.8%(+12.3)#588 |
| 98. | 93651 | 19.0% | 8.0%(+11.1)#98 | 6.8%(+12.3)#589 |
| 99. | 94560 | 19.0% | 8.0%(+11.0)#99 | 6.8%(+12.2)#594 |
| 100. | 92614 | 18.9% | 8.0%(+11.0)#100 | 6.8%(+12.2)#598 |
Common Questions
What are the Top 10 Zip Codes with the Highest Percentage of Population Employed in Computer, Engineering & Science in California?
Top 10 Zip Codes with the Highest Percentage of Population Employed in Computer, Engineering & Science in California are:
What zip code has the Highest Percentage of Population Employed in Computer, Engineering & Science in California?
93563 has the Highest Percentage of Population Employed in Computer, Engineering & Science in California with 71.4%.
What is the Percentage of Population Employed in Computer, Engineering & Science in the State of California?
Percentage of Population Employed in Computer, Engineering & Science in California is 8.0%.
What is the Percentage of Population Employed in Computer, Engineering & Science in the United States?
Percentage of Population Employed in Computer, Engineering & Science in the United States is 6.8%.