Mineral, CA Map & Demographics
Mineral Map
Mineral Overview
$47,827
PER CAPITA INCOME
0.36
INEQUALITY / GINI INDEX
77
TOTAL POPULATION
56
MALE POPULATION
21
FEMALE POPULATION
266.67
MALES / 100 FEMALES
37.50
FEMALES / 100 MALES
48.9
MEDIAN AGE
2.2
AVG FAMILY SIZE
1.3
AVG HOUSEHOLD SIZE
48
LABOR FORCE [ PEOPLE ]
62.3%
PERCENT IN LABOR FORCE
Mineral Zip Codes
Mineral Area Codes
Income in Mineral
Income Overview in Mineral
| Characteristic | Number | Measure |
| Per Capita Income | 77 | $47,827 |
| Median Family Income | 8 | $0 |
| Mean Family Income | 8 | $0 |
| Median Household Income | 59 | $0 |
| Mean Household Income | 59 | $62,166 |
| Income Deficit | 8 | $0 |
| Wage / Income Gap (%) | 77 | 0.00% |
| Wage / Income Gap ($) | 77 | 100.00¢ per $1 |
| Gini / Inequality Index | 77 | 0.36 |
Earnings by Sex in Mineral
| Sex | Number | Average Earnings |
| Male | 48 (100.0%) | $0 |
| Female | 0 (0.0%) | $0 |
| Total | 48 (100.0%) | $0 |
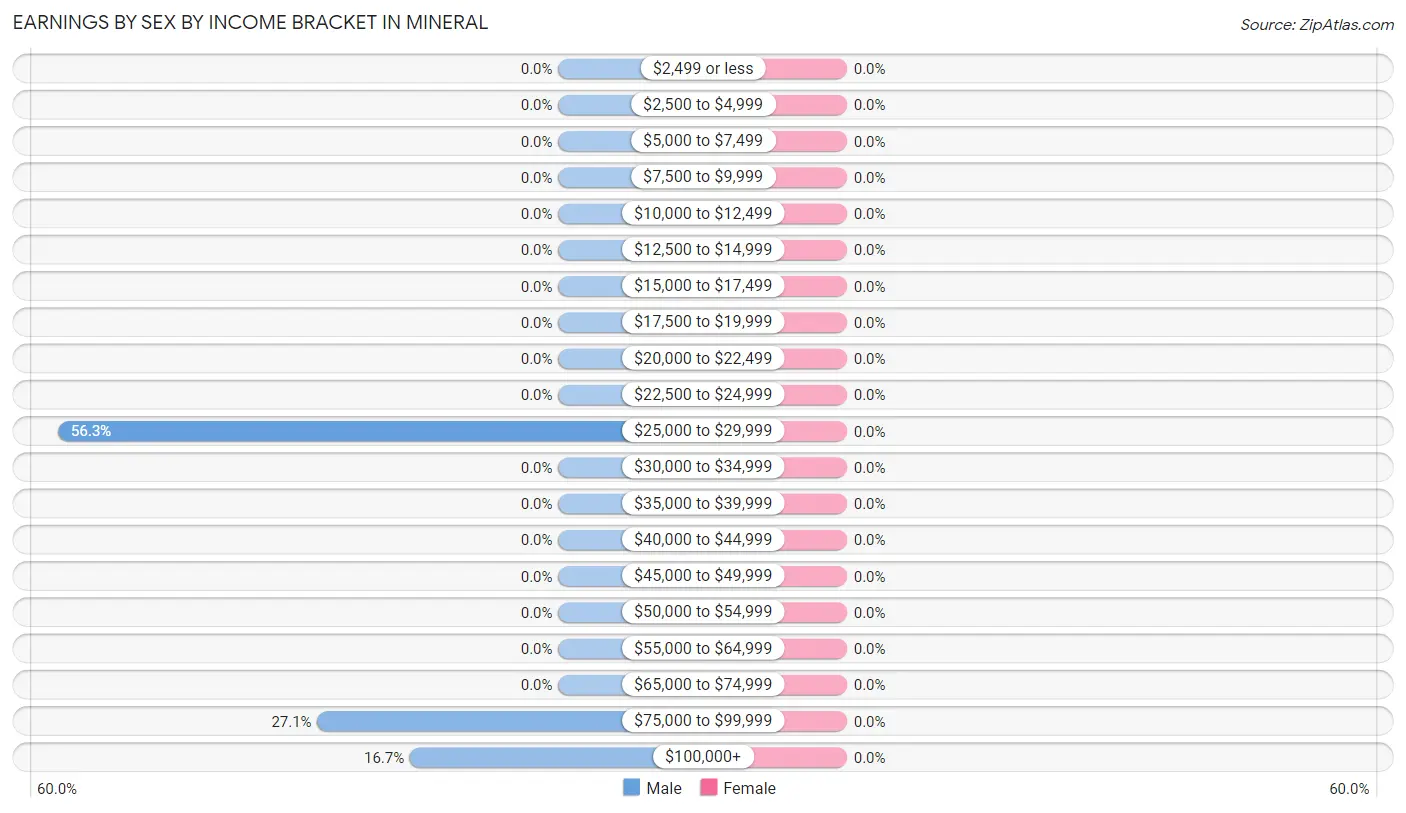
Earnings by Sex by Income Bracket in Mineral
| Income | Male | Female |
| $2,499 or less | 0 (0.0%) | 0 (0.0%) |
| $2,500 to $4,999 | 0 (0.0%) | 0 (0.0%) |
| $5,000 to $7,499 | 0 (0.0%) | 0 (0.0%) |
| $7,500 to $9,999 | 0 (0.0%) | 0 (0.0%) |
| $10,000 to $12,499 | 0 (0.0%) | 0 (0.0%) |
| $12,500 to $14,999 | 0 (0.0%) | 0 (0.0%) |
| $15,000 to $17,499 | 0 (0.0%) | 0 (0.0%) |
| $17,500 to $19,999 | 0 (0.0%) | 0 (0.0%) |
| $20,000 to $22,499 | 0 (0.0%) | 0 (0.0%) |
| $22,500 to $24,999 | 0 (0.0%) | 0 (0.0%) |
| $25,000 to $29,999 | 27 (56.2%) | 0 (0.0%) |
| $30,000 to $34,999 | 0 (0.0%) | 0 (0.0%) |
| $35,000 to $39,999 | 0 (0.0%) | 0 (0.0%) |
| $40,000 to $44,999 | 0 (0.0%) | 0 (0.0%) |
| $45,000 to $49,999 | 0 (0.0%) | 0 (0.0%) |
| $50,000 to $54,999 | 0 (0.0%) | 0 (0.0%) |
| $55,000 to $64,999 | 0 (0.0%) | 0 (0.0%) |
| $65,000 to $74,999 | 0 (0.0%) | 0 (0.0%) |
| $75,000 to $99,999 | 13 (27.1%) | 0 (0.0%) |
| $100,000+ | 8 (16.7%) | 0 (0.0%) |
| Total | 48 (100.0%) | 0 (0.0%) |
Earnings by Sex by Educational Attainment in Mineral
| Educational Attainment | Male Income | Female Income |
| Less than High School | - | - |
| High School Diploma | - | - |
| College or Associate's Degree | - | - |
| Bachelor's Degree | - | - |
| Graduate Degree | - | - |
| Total | - | - |
Family Income in Mineral
Family Income Brackets in Mineral
According to the Mineral family income data, there are 8 families falling into the $150,000 to $199,999 income range, which is the most common income bracket and makes up 100.0% of all families.
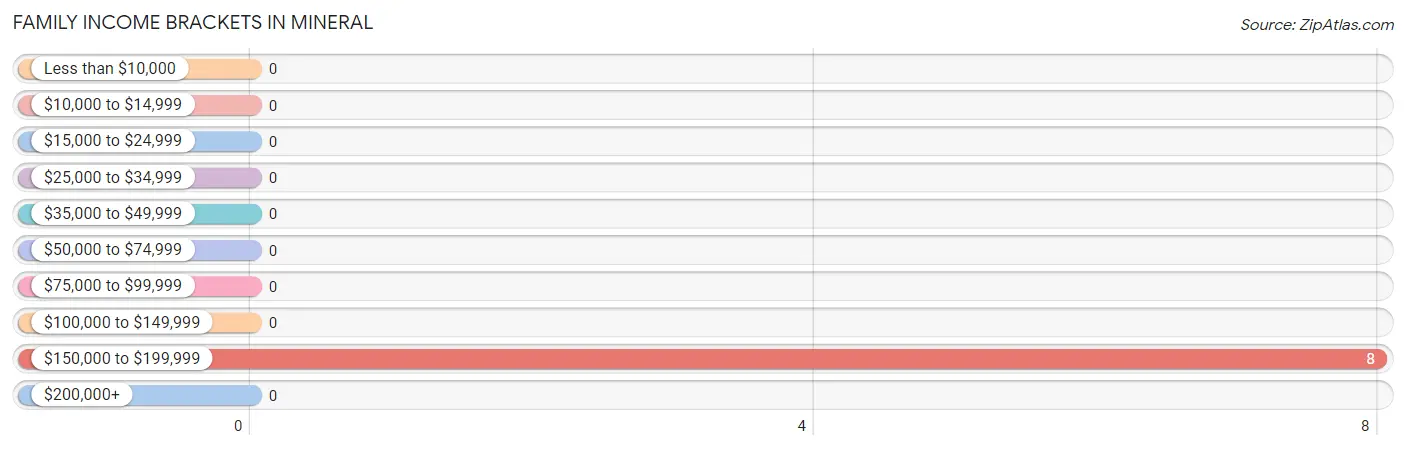
| Income Bracket | # Families | % Families |
| Less than $10,000 | 0 | 0.0% |
| $10,000 to $14,999 | 0 | 0.0% |
| $15,000 to $24,999 | 0 | 0.0% |
| $25,000 to $34,999 | 0 | 0.0% |
| $35,000 to $49,999 | 0 | 0.0% |
| $50,000 to $74,999 | 0 | 0.0% |
| $75,000 to $99,999 | 0 | 0.0% |
| $100,000 to $149,999 | 0 | 0.0% |
| $150,000 to $199,999 | 8 | 100.0% |
| $200,000+ | 0 | 0.0% |
Family Income by Famaliy Size in Mineral
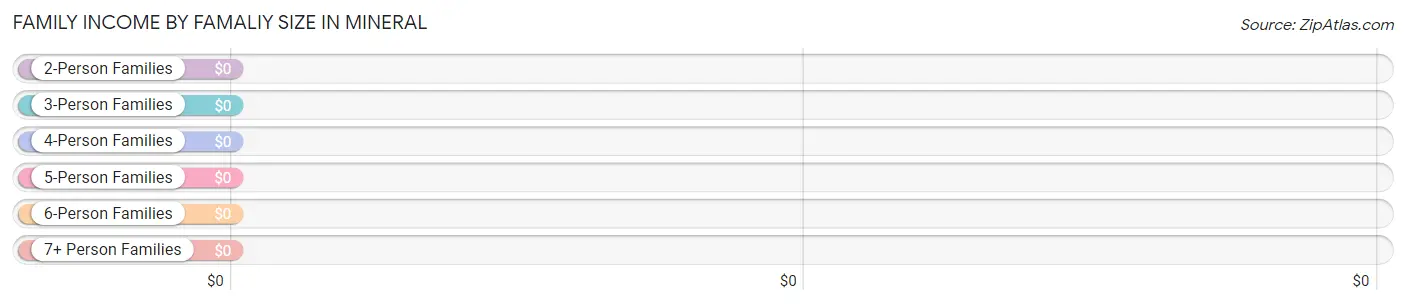
| Income Bracket | # Families | Median Income |
| 2-Person Families | 8 (100.0%) | $0 |
| 3-Person Families | 0 (0.0%) | $0 |
| 4-Person Families | 0 (0.0%) | $0 |
| 5-Person Families | 0 (0.0%) | $0 |
| 6-Person Families | 0 (0.0%) | $0 |
| 7+ Person Families | 0 (0.0%) | $0 |
| Total | 8 (100.0%) | $0 |
Family Income by Number of Earners in Mineral
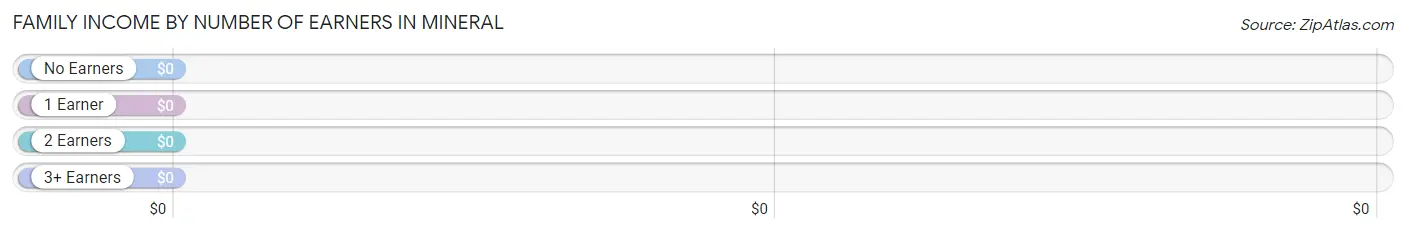
| Number of Earners | # Families | Median Income |
| No Earners | 0 (0.0%) | $0 |
| 1 Earner | 8 (100.0%) | $0 |
| 2 Earners | 0 (0.0%) | $0 |
| 3+ Earners | 0 (0.0%) | $0 |
| Total | 8 (100.0%) | $0 |
Household Income in Mineral
Household Income Brackets in Mineral
With 27 households falling in the category, the $25,000 to $34,999 income range is the most frequent in Mineral, accounting for 45.8% of all households.
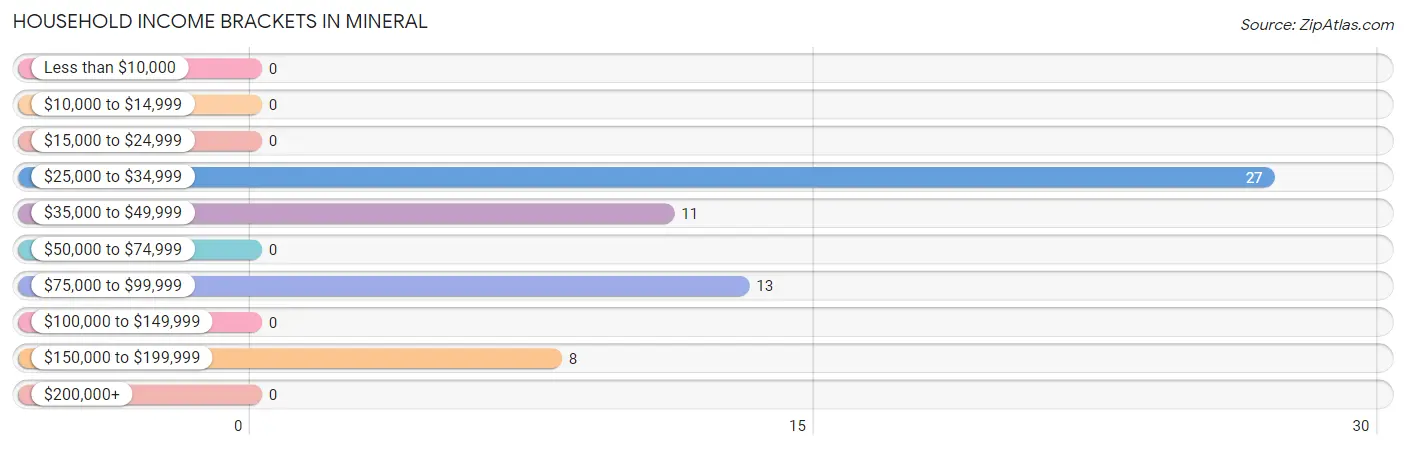
| Income Bracket | # Households | % Households |
| Less than $10,000 | 0 | 0.0% |
| $10,000 to $14,999 | 0 | 0.0% |
| $15,000 to $24,999 | 0 | 0.0% |
| $25,000 to $34,999 | 27 | 45.8% |
| $35,000 to $49,999 | 11 | 18.6% |
| $50,000 to $74,999 | 0 | 0.0% |
| $75,000 to $99,999 | 13 | 22.0% |
| $100,000 to $149,999 | 0 | 0.0% |
| $150,000 to $199,999 | 8 | 13.6% |
| $200,000+ | 0 | 0.0% |
Household Income by Householder Age in Mineral
| Income Bracket | # Households | Median Income |
| 15 to 24 Years | 0 (0.0%) | $0 |
| 25 to 44 Years | 27 (45.8%) | $0 |
| 45 to 64 Years | 21 (35.6%) | $0 |
| 65+ Years | 11 (18.6%) | $0 |
| Total | 59 (100.0%) | $0 |
Poverty in Mineral
Income Below Poverty by Sex and Age in Mineral
| Age Bracket | Male | Female |
| Under 5 Years | 0 (0.0%) | 0 (0.0%) |
| 5 Years | 0 (0.0%) | 0 (0.0%) |
| 6 to 11 Years | 0 (0.0%) | 0 (0.0%) |
| 12 to 14 Years | 0 (0.0%) | 0 (0.0%) |
| 15 Years | 0 (0.0%) | 0 (0.0%) |
| 16 and 17 Years | 0 (0.0%) | 0 (0.0%) |
| 18 to 24 Years | 0 (0.0%) | 0 (0.0%) |
| 25 to 34 Years | 0 (0.0%) | 0 (0.0%) |
| 35 to 44 Years | 0 (0.0%) | 0 (0.0%) |
| 45 to 54 Years | 0 (0.0%) | 0 (0.0%) |
| 55 to 64 Years | 0 (0.0%) | 0 (0.0%) |
| 65 to 74 Years | 0 (0.0%) | 0 (0.0%) |
| 75 Years and over | 8 (100.0%) | 0 (0.0%) |
| Total | 8 (14.3%) | 0 (0.0%) |
Income Above Poverty by Sex and Age in Mineral
According to the poverty statistics in Mineral, males aged 35 to 44 years and females aged 55 to 64 years are the age groups that are most secure financially, with 100.0% of males and 100.0% of females in these age groups living above the poverty line.
| Age Bracket | Male | Female |
| Under 5 Years | 0 (0.0%) | 0 (0.0%) |
| 5 Years | 0 (0.0%) | 0 (0.0%) |
| 6 to 11 Years | 0 (0.0%) | 0 (0.0%) |
| 12 to 14 Years | 0 (0.0%) | 0 (0.0%) |
| 15 Years | 0 (0.0%) | 0 (0.0%) |
| 16 and 17 Years | 0 (0.0%) | 0 (0.0%) |
| 18 to 24 Years | 0 (0.0%) | 0 (0.0%) |
| 25 to 34 Years | 0 (0.0%) | 0 (0.0%) |
| 35 to 44 Years | 27 (100.0%) | 0 (0.0%) |
| 45 to 54 Years | 13 (100.0%) | 0 (0.0%) |
| 55 to 64 Years | 8 (100.0%) | 10 (100.0%) |
| 65 to 74 Years | 0 (0.0%) | 0 (0.0%) |
| 75 Years and over | 0 (0.0%) | 11 (100.0%) |
| Total | 48 (85.7%) | 21 (100.0%) |
Income Below Poverty Among Married-Couple Families in Mineral
| Children | Above Poverty | Below Poverty |
| No Children | 8 (100.0%) | 0 (0.0%) |
| 1 or 2 Children | 0 (0.0%) | 0 (0.0%) |
| 3 or 4 Children | 0 (0.0%) | 0 (0.0%) |
| 5 or more Children | 0 (0.0%) | 0 (0.0%) |
| Total | 8 (100.0%) | 0 (0.0%) |
Income Below Poverty Among Single-Parent Households in Mineral

| Children | Single Father | Single Mother |
| No Children | 0 (0.0%) | 0 (0.0%) |
| 1 or 2 Children | 0 (0.0%) | 0 (0.0%) |
| 3 or 4 Children | 0 (0.0%) | 0 (0.0%) |
| 5 or more Children | 0 (0.0%) | 0 (0.0%) |
| Total | 0 (0.0%) | 0 (0.0%) |
Income Below Poverty Among Married-Couple vs Single-Parent Households in Mineral
| Children | Married-Couple Families | Single-Parent Households |
| No Children | 0 (0.0%) | 0 (0.0%) |
| 1 or 2 Children | 0 (0.0%) | 0 (0.0%) |
| 3 or 4 Children | 0 (0.0%) | 0 (0.0%) |
| 5 or more Children | 0 (0.0%) | 0 (0.0%) |
| Total | 0 (0.0%) | 0 (0.0%) |
Race in Mineral
The most populous races in Mineral are , and White / Caucasian (77 | 100.0%).
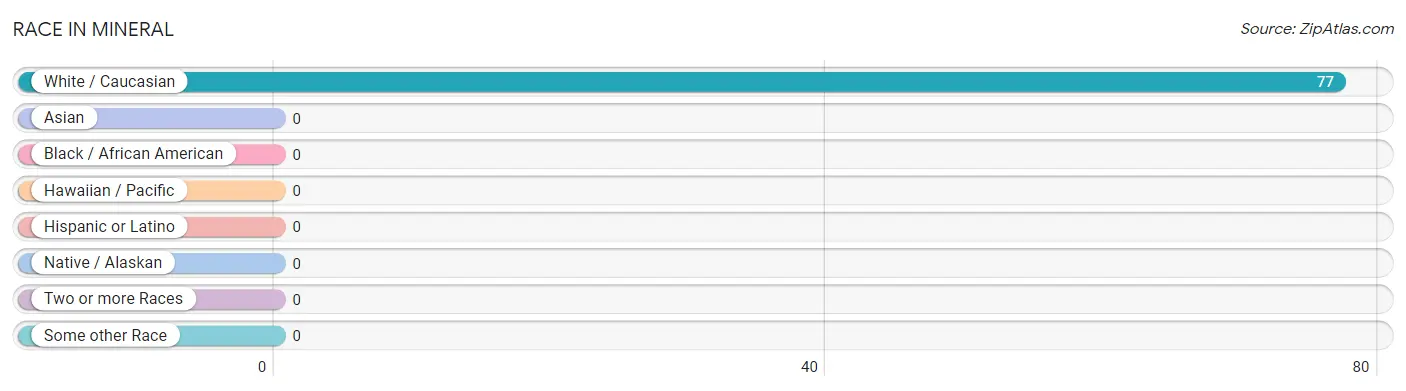
| Race | # Population | % Population |
| Asian | 0 | 0.0% |
| Black / African American | 0 | 0.0% |
| Hawaiian / Pacific | 0 | 0.0% |
| Hispanic or Latino | 0 | 0.0% |
| Native / Alaskan | 0 | 0.0% |
| White / Caucasian | 77 | 100.0% |
| Two or more Races | 0 | 0.0% |
| Some other Race | 0 | 0.0% |
| Total | 77 | 100.0% |
Ancestry in Mineral
The most populous ancestries reported in Mineral are British (40 | 51.9%), German (19 | 24.7%), European (18 | 23.4%), English (13 | 16.9%), and Scottish (11 | 14.3%), together accounting for 131.2% of all Mineral residents.
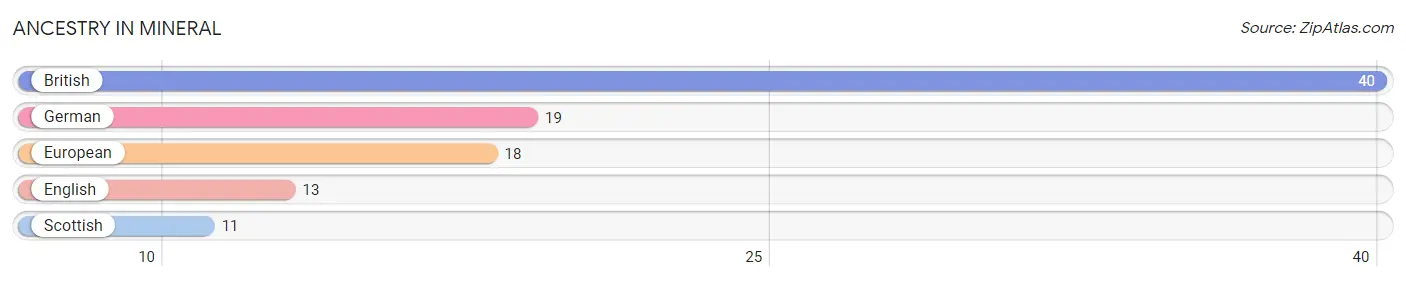
| Ancestry | # Population | % Population |
| British | 40 | 51.9% |
| English | 13 | 16.9% |
| European | 18 | 23.4% |
| German | 19 | 24.7% |
| Scottish | 11 | 14.3% | View All 5 Rows |
Immigrants in Mineral

| Immigration Origin | # Population | % Population | View All 0 Rows |
Sex and Age in Mineral
Sex and Age in Mineral
The most populous age groups in Mineral are 40 to 44 Years (27 | 48.2%) for men and 75 to 79 Years (11 | 52.4%) for women.
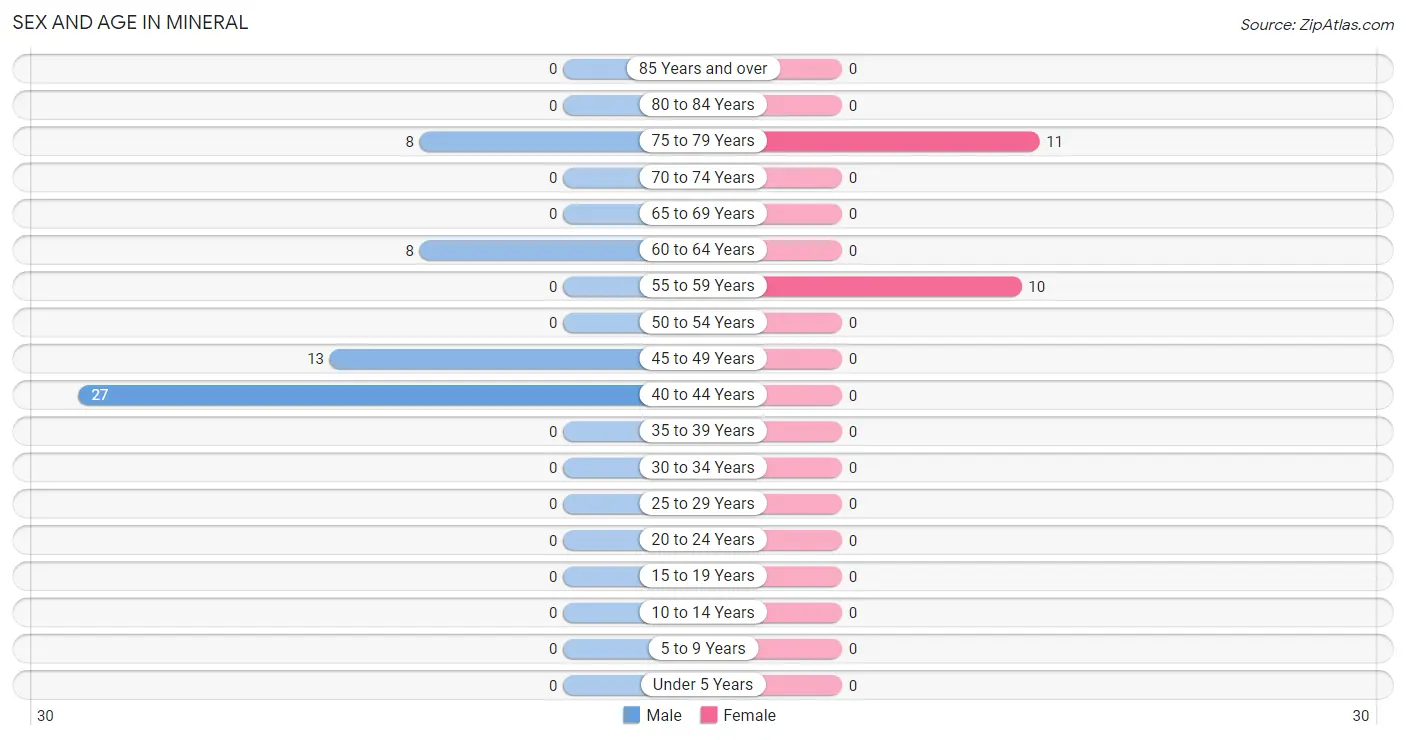
| Age Bracket | Male | Female |
| Under 5 Years | 0 (0.0%) | 0 (0.0%) |
| 5 to 9 Years | 0 (0.0%) | 0 (0.0%) |
| 10 to 14 Years | 0 (0.0%) | 0 (0.0%) |
| 15 to 19 Years | 0 (0.0%) | 0 (0.0%) |
| 20 to 24 Years | 0 (0.0%) | 0 (0.0%) |
| 25 to 29 Years | 0 (0.0%) | 0 (0.0%) |
| 30 to 34 Years | 0 (0.0%) | 0 (0.0%) |
| 35 to 39 Years | 0 (0.0%) | 0 (0.0%) |
| 40 to 44 Years | 27 (48.2%) | 0 (0.0%) |
| 45 to 49 Years | 13 (23.2%) | 0 (0.0%) |
| 50 to 54 Years | 0 (0.0%) | 0 (0.0%) |
| 55 to 59 Years | 0 (0.0%) | 10 (47.6%) |
| 60 to 64 Years | 8 (14.3%) | 0 (0.0%) |
| 65 to 69 Years | 0 (0.0%) | 0 (0.0%) |
| 70 to 74 Years | 0 (0.0%) | 0 (0.0%) |
| 75 to 79 Years | 8 (14.3%) | 11 (52.4%) |
| 80 to 84 Years | 0 (0.0%) | 0 (0.0%) |
| 85 Years and over | 0 (0.0%) | 0 (0.0%) |
| Total | 56 (100.0%) | 21 (100.0%) |
Families and Households in Mineral
Median Family Size in Mineral
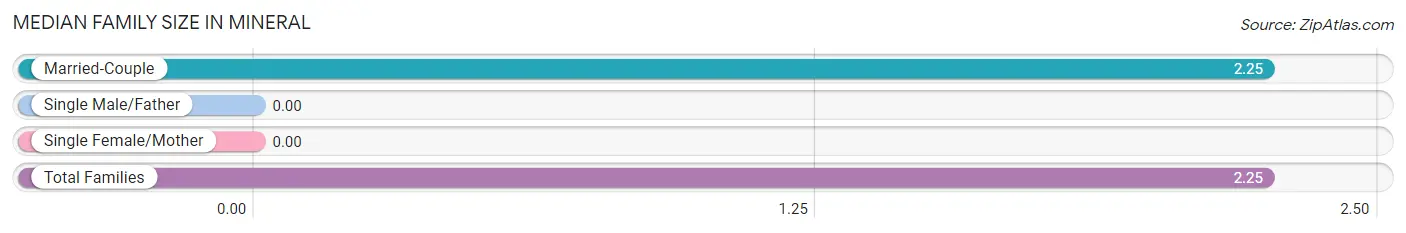
| Family Type | # Families | Family Size |
| Married-Couple | 8 (100.0%) | 2.25 |
| Single Male/Father | 0 (0.0%) | - |
| Single Female/Mother | 0 (0.0%) | - |
| Total Families | 8 (100.0%) | 2.25 |
Median Household Size in Mineral
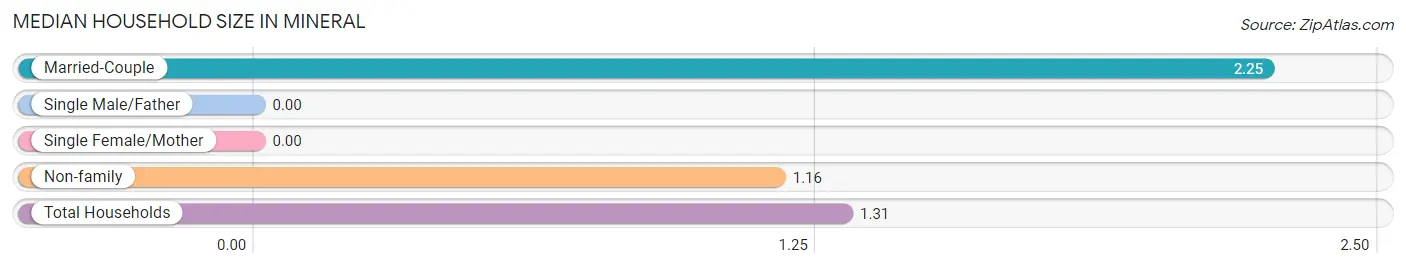
| Household Type | # Households | Household Size |
| Married-Couple | 8 (13.6%) | 2.25 |
| Single Male/Father | 0 (0.0%) | - |
| Single Female/Mother | 0 (0.0%) | - |
| Non-family | 51 (86.4%) | 1.16 |
| Total Households | 59 (100.0%) | 1.31 |
Household Size by Marriage Status in Mineral
Out of a total of 59 households in Mineral, 8 (13.6%) are family households, while 51 (86.4%) are nonfamily households. The most numerous type of family households are 2-person households, comprising 8, and the most common type of nonfamily households are 1-person households, comprising 40.
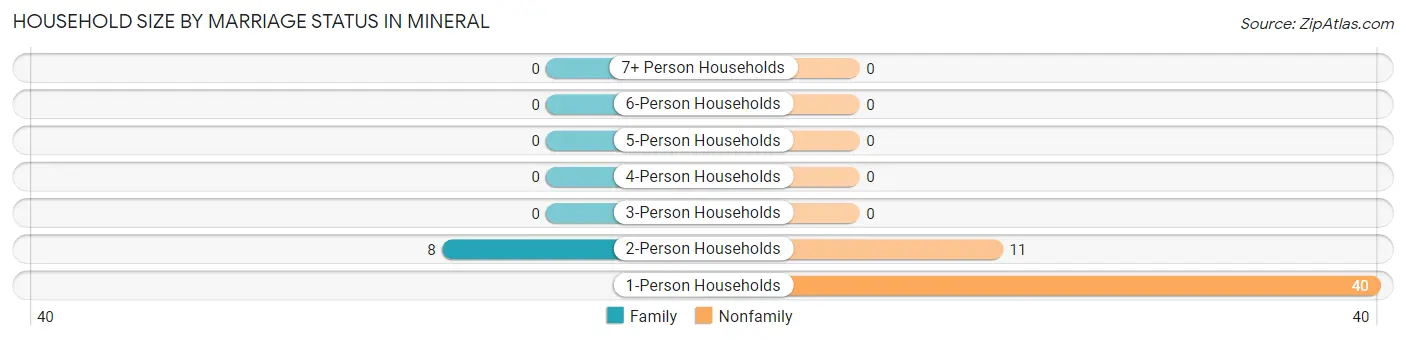
| Household Size | Family Households | Nonfamily Households |
| 1-Person Households | - | 40 (67.8%) |
| 2-Person Households | 8 (13.6%) | 11 (18.6%) |
| 3-Person Households | 0 (0.0%) | 0 (0.0%) |
| 4-Person Households | 0 (0.0%) | 0 (0.0%) |
| 5-Person Households | 0 (0.0%) | 0 (0.0%) |
| 6-Person Households | 0 (0.0%) | 0 (0.0%) |
| 7+ Person Households | 0 (0.0%) | 0 (0.0%) |
| Total | 8 (13.6%) | 51 (86.4%) |
Female Fertility in Mineral
Fertility by Age in Mineral
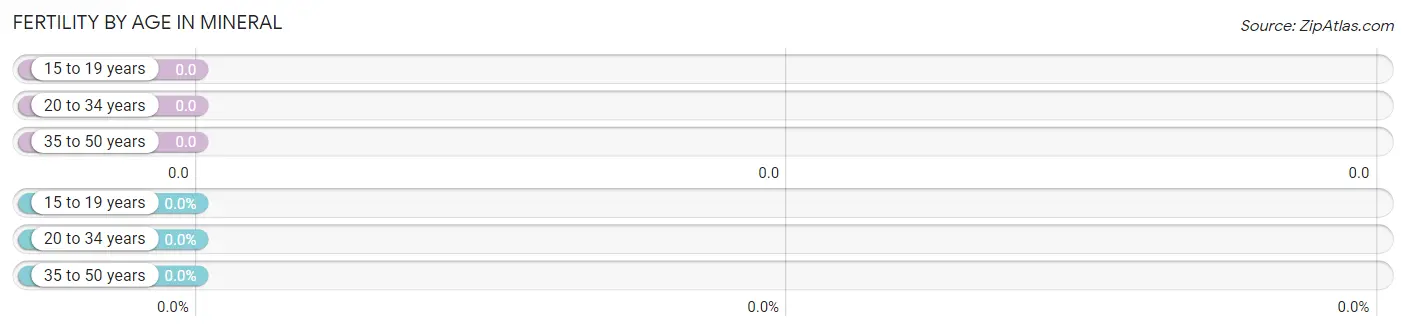
| Age Bracket | Women with Births | Births / 1,000 Women |
| 15 to 19 years | 0 (0.0%) | 0.0 |
| 20 to 34 years | 0 (0.0%) | 0.0 |
| 35 to 50 years | 0 (0.0%) | 0.0 |
| Total | 0 (0.0%) | 0.0 |
Fertility by Age by Marriage Status in Mineral
| Age Bracket | Married | Unmarried |
| 15 to 19 years | 0 (0.0%) | 0 (0.0%) |
| 20 to 34 years | 0 (0.0%) | 0 (0.0%) |
| 35 to 50 years | 0 (0.0%) | 0 (0.0%) |
| Total | 0 (0.0%) | 0 (0.0%) |
Fertility by Education in Mineral
| Educational Attainment | Women with Births | Births / 1,000 Women |
| Less than High School | 0 (0.0%) | 0.0 |
| High School Diploma | 0 (0.0%) | 0.0 |
| College or Associate's Degree | 0 (0.0%) | 0.0 |
| Bachelor's Degree | 0 (0.0%) | 0.0 |
| Graduate Degree | 0 (0.0%) | 0.0 |
| Total | 0 (0.0%) | 0.0 |
Fertility by Education by Marriage Status in Mineral
| Educational Attainment | Married | Unmarried |
| Less than High School | 0 (0.0%) | 0 (0.0%) |
| High School Diploma | 0 (0.0%) | 0 (0.0%) |
| College or Associate's Degree | 0 (0.0%) | 0 (0.0%) |
| Bachelor's Degree | 0 (0.0%) | 0 (0.0%) |
| Graduate Degree | 0 (0.0%) | 0 (0.0%) |
| Total | 0 (0.0%) | 0 (0.0%) |
Employment Characteristics in Mineral
Employment by Class of Employer in Mineral
Among the 48 employed individuals in Mineral, private company employees (27 | 56.2%), and federal government employees (21 | 43.8%) make up the most common classes of employment.
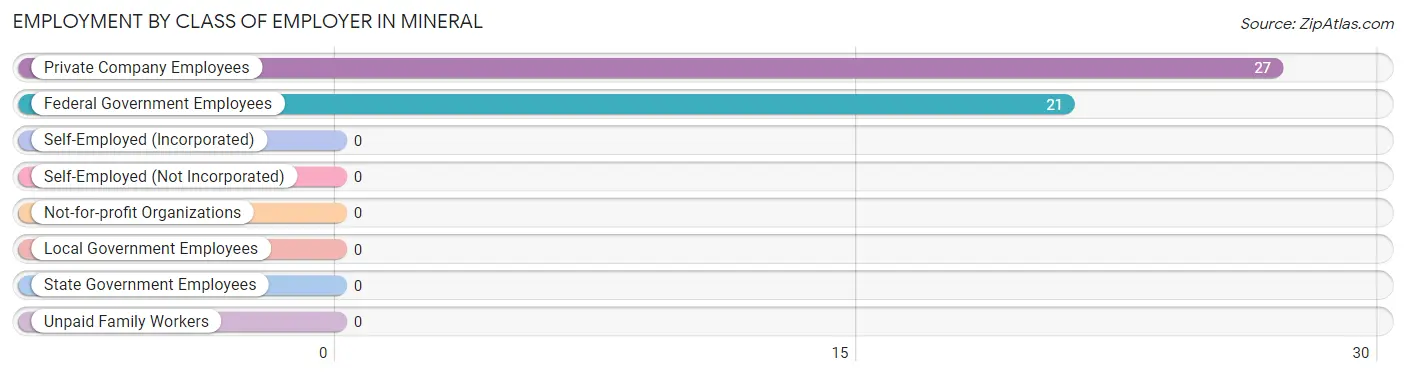
| Employer Class | # Employees | % Employees |
| Private Company Employees | 27 | 56.2% |
| Self-Employed (Incorporated) | 0 | 0.0% |
| Self-Employed (Not Incorporated) | 0 | 0.0% |
| Not-for-profit Organizations | 0 | 0.0% |
| Local Government Employees | 0 | 0.0% |
| State Government Employees | 0 | 0.0% |
| Federal Government Employees | 21 | 43.8% |
| Unpaid Family Workers | 0 | 0.0% |
| Total | 48 | 100.0% |
Employment Status by Age in Mineral
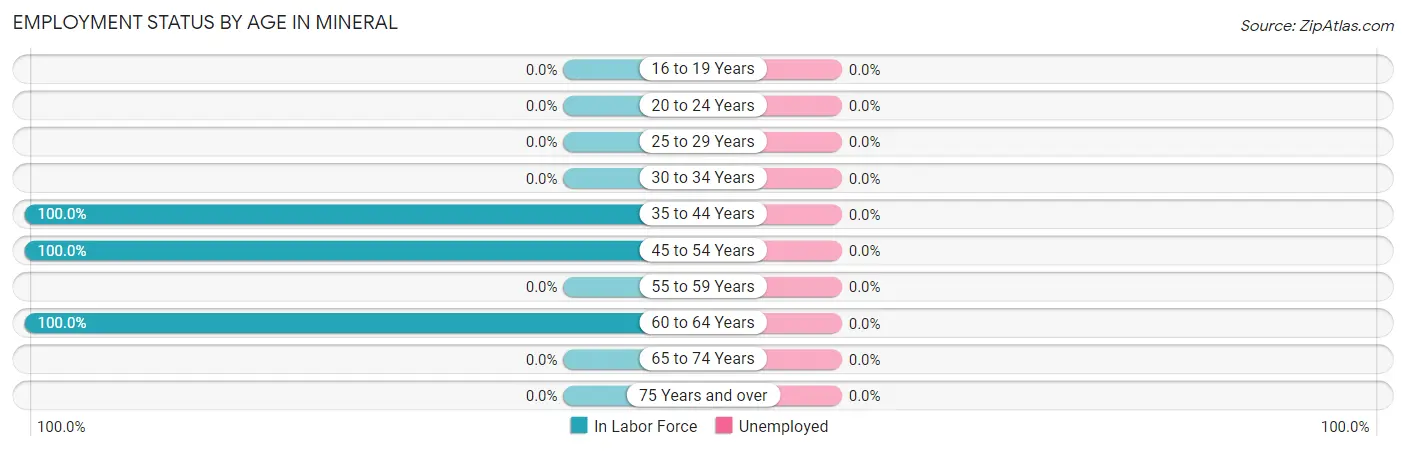
| Age Bracket | In Labor Force | Unemployed |
| 16 to 19 Years | 0 (0.0%) | 0 (0.0%) |
| 20 to 24 Years | 0 (0.0%) | 0 (0.0%) |
| 25 to 29 Years | 0 (0.0%) | 0 (0.0%) |
| 30 to 34 Years | 0 (0.0%) | 0 (0.0%) |
| 35 to 44 Years | 27 (100.0%) | 0 (0.0%) |
| 45 to 54 Years | 13 (100.0%) | 0 (0.0%) |
| 55 to 59 Years | 0 (0.0%) | 0 (0.0%) |
| 60 to 64 Years | 8 (100.0%) | 0 (0.0%) |
| 65 to 74 Years | 0 (0.0%) | 0 (0.0%) |
| 75 Years and over | 0 (0.0%) | 0 (0.0%) |
| Total | 48 (62.3%) | 0 (0.0%) |
Employment Status by Educational Attainment in Mineral
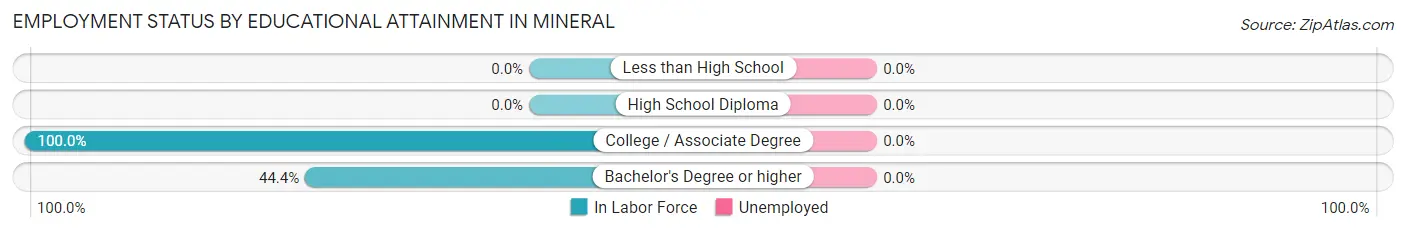
| Educational Attainment | In Labor Force | Unemployed |
| Less than High School | 0 (0.0%) | 0 (0.0%) |
| High School Diploma | 0 (0.0%) | 0 (0.0%) |
| College / Associate Degree | 40 (100.0%) | 0 (0.0%) |
| Bachelor's Degree or higher | 8 (44.4%) | 0 (0.0%) |
| Total | 48 (82.8%) | 0 (0.0%) |
Employment Occupations by Sex in Mineral
Management, Business, Science and Arts Occupations
The most common Management, Business, Science and Arts occupations in Mineral are Computers, Engineering & Science (13 | 27.1%), and Computers & Mathematics (13 | 27.1%).
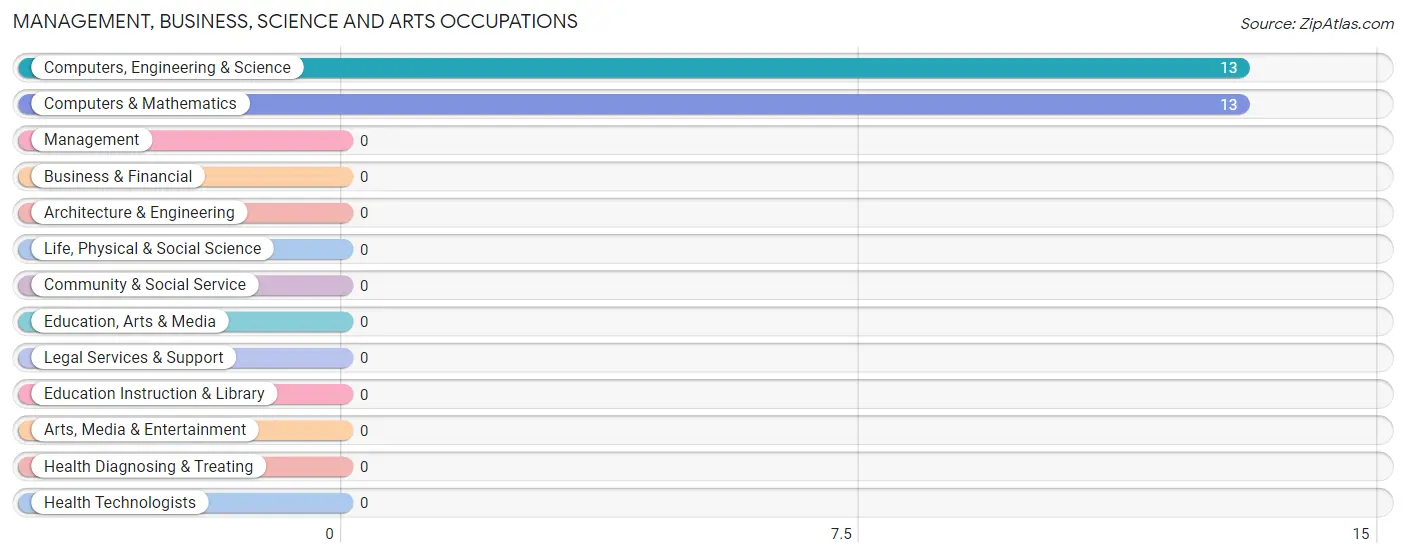
Management, Business, Science and Arts Occupations by Sex
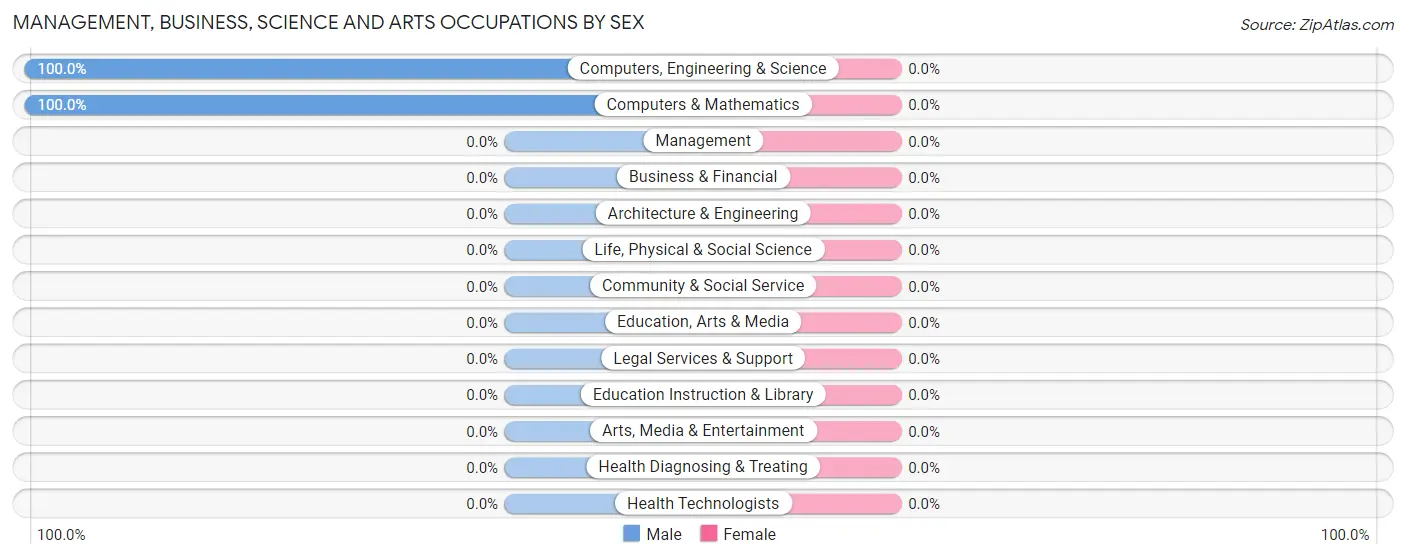
| Occupation | Male | Female |
| Management | 0 (0.0%) | 0 (0.0%) |
| Business & Financial | 0 (0.0%) | 0 (0.0%) |
| Computers, Engineering & Science | 13 (100.0%) | 0 (0.0%) |
| Computers & Mathematics | 13 (100.0%) | 0 (0.0%) |
| Architecture & Engineering | 0 (0.0%) | 0 (0.0%) |
| Life, Physical & Social Science | 0 (0.0%) | 0 (0.0%) |
| Community & Social Service | 0 (0.0%) | 0 (0.0%) |
| Education, Arts & Media | 0 (0.0%) | 0 (0.0%) |
| Legal Services & Support | 0 (0.0%) | 0 (0.0%) |
| Education Instruction & Library | 0 (0.0%) | 0 (0.0%) |
| Arts, Media & Entertainment | 0 (0.0%) | 0 (0.0%) |
| Health Diagnosing & Treating | 0 (0.0%) | 0 (0.0%) |
| Health Technologists | 0 (0.0%) | 0 (0.0%) |
| Total (Category) | 13 (100.0%) | 0 (0.0%) |
| Total (Overall) | 48 (100.0%) | 0 (0.0%) |
Services Occupations
Services Occupations by Sex
| Occupation | Male | Female |
| Healthcare Support | 0 (0.0%) | 0 (0.0%) |
| Security & Protection | 0 (0.0%) | 0 (0.0%) |
| Firefighting & Prevention | 0 (0.0%) | 0 (0.0%) |
| Law Enforcement | 0 (0.0%) | 0 (0.0%) |
| Food Preparation & Serving | 0 (0.0%) | 0 (0.0%) |
| Cleaning & Maintenance | 0 (0.0%) | 0 (0.0%) |
| Personal Care & Service | 0 (0.0%) | 0 (0.0%) |
| Total (Category) | 0 (0.0%) | 0 (0.0%) |
| Total (Overall) | 48 (100.0%) | 0 (0.0%) |
Sales and Office Occupations
The most common Sales and Office occupations in Mineral are , and Sales & Related (8 | 16.7%).
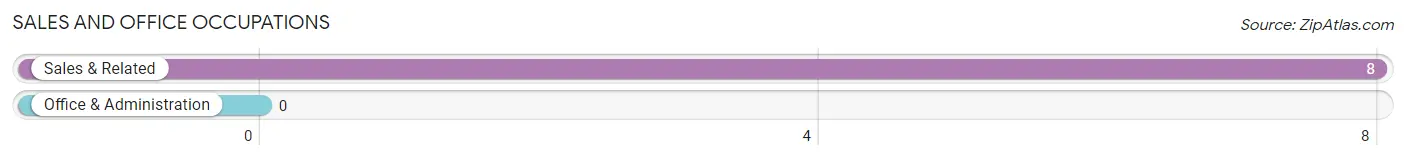
Sales and Office Occupations by Sex
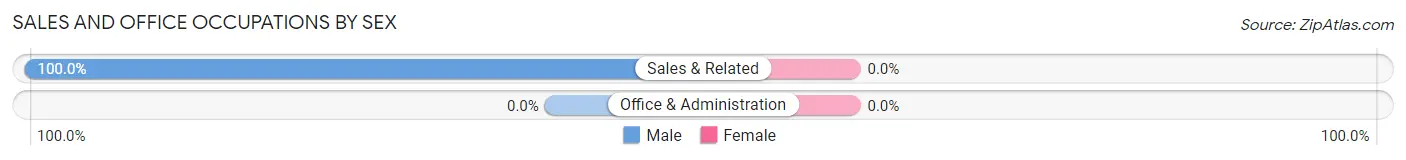
| Occupation | Male | Female |
| Sales & Related | 8 (100.0%) | 0 (0.0%) |
| Office & Administration | 0 (0.0%) | 0 (0.0%) |
| Total (Category) | 8 (100.0%) | 0 (0.0%) |
| Total (Overall) | 48 (100.0%) | 0 (0.0%) |
Natural Resources, Construction and Maintenance Occupations
The most common Natural Resources, Construction and Maintenance occupations in Mineral are , and Construction & Extraction (27 | 56.2%).
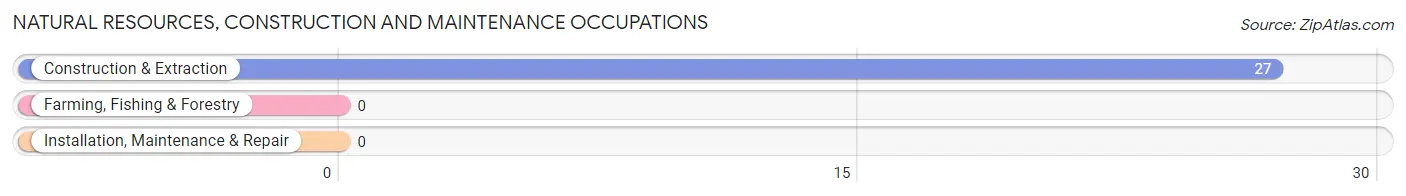
Natural Resources, Construction and Maintenance Occupations by Sex
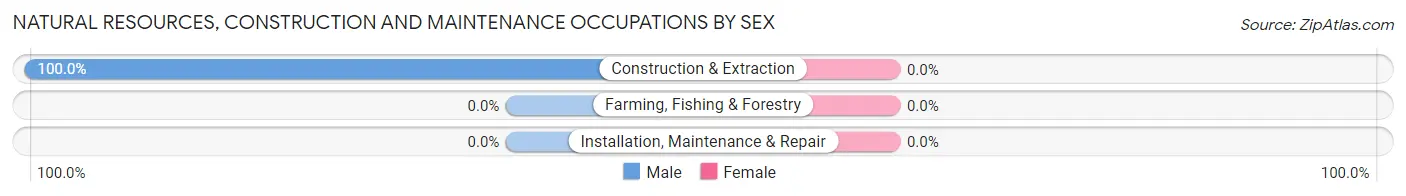
| Occupation | Male | Female |
| Farming, Fishing & Forestry | 0 (0.0%) | 0 (0.0%) |
| Construction & Extraction | 27 (100.0%) | 0 (0.0%) |
| Installation, Maintenance & Repair | 0 (0.0%) | 0 (0.0%) |
| Total (Category) | 27 (100.0%) | 0 (0.0%) |
| Total (Overall) | 48 (100.0%) | 0 (0.0%) |
Production, Transportation and Moving Occupations
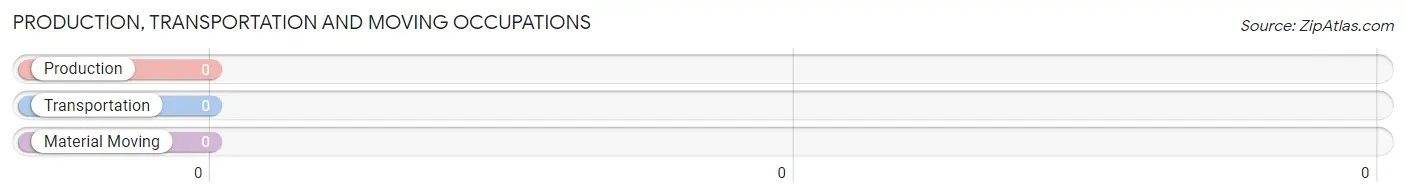
Production, Transportation and Moving Occupations by Sex
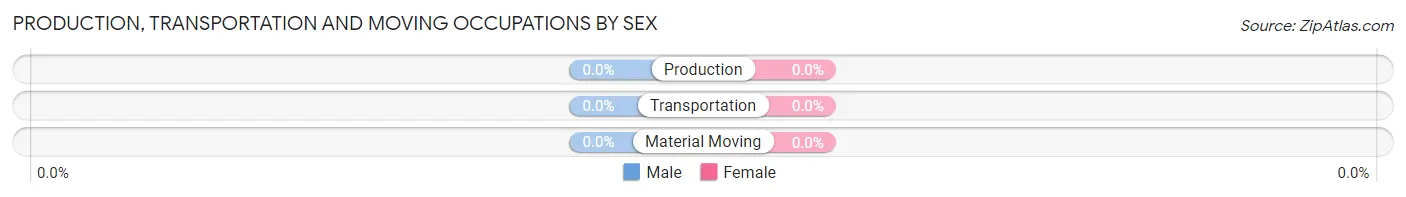
| Occupation | Male | Female |
| Production | 0 (0.0%) | 0 (0.0%) |
| Transportation | 0 (0.0%) | 0 (0.0%) |
| Material Moving | 0 (0.0%) | 0 (0.0%) |
| Total (Category) | 0 (0.0%) | 0 (0.0%) |
| Total (Overall) | 48 (100.0%) | 0 (0.0%) |
Employment Industries by Sex in Mineral
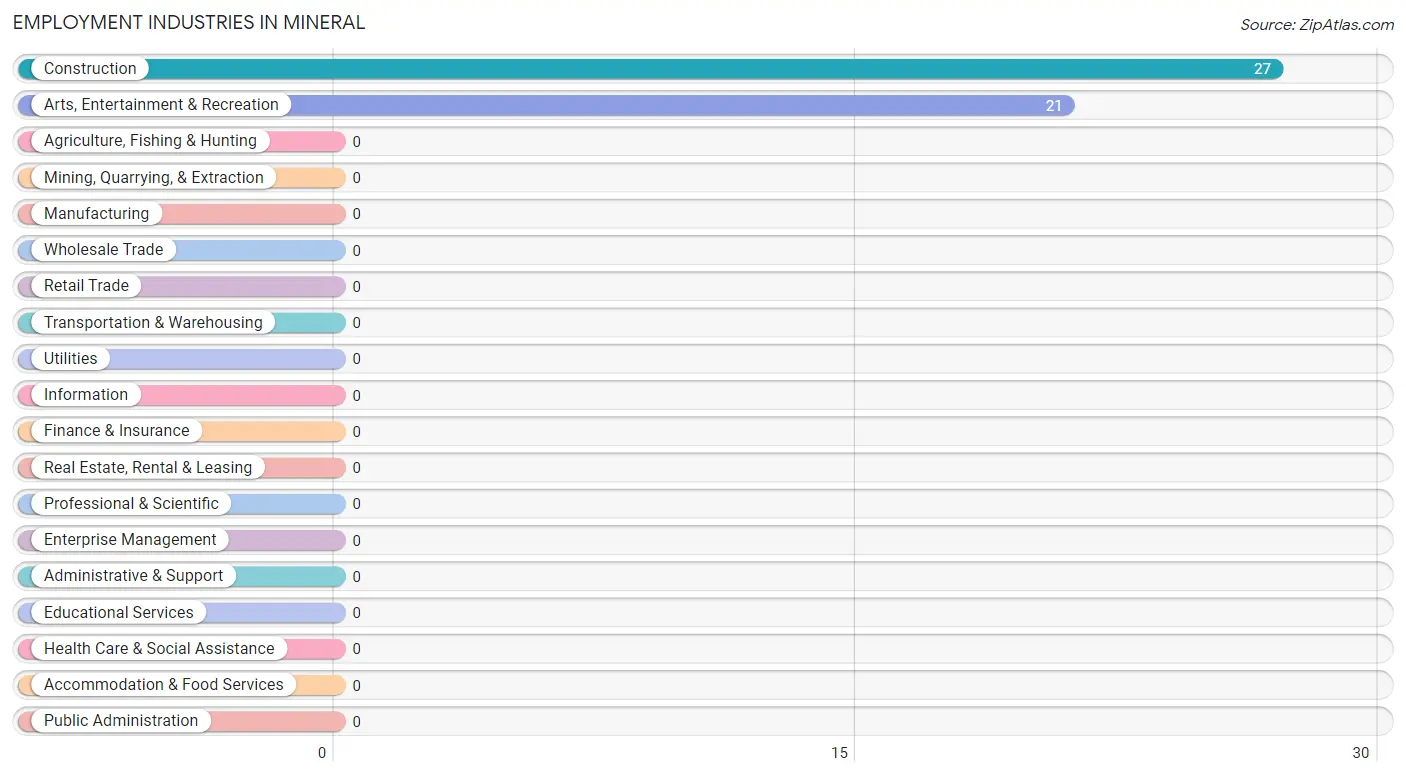
Employment Industries in Mineral
The major employment industries in Mineral include Construction (27 | 56.2%), and Arts, Entertainment & Recreation (21 | 43.8%).
Employment Industries by Sex in Mineral
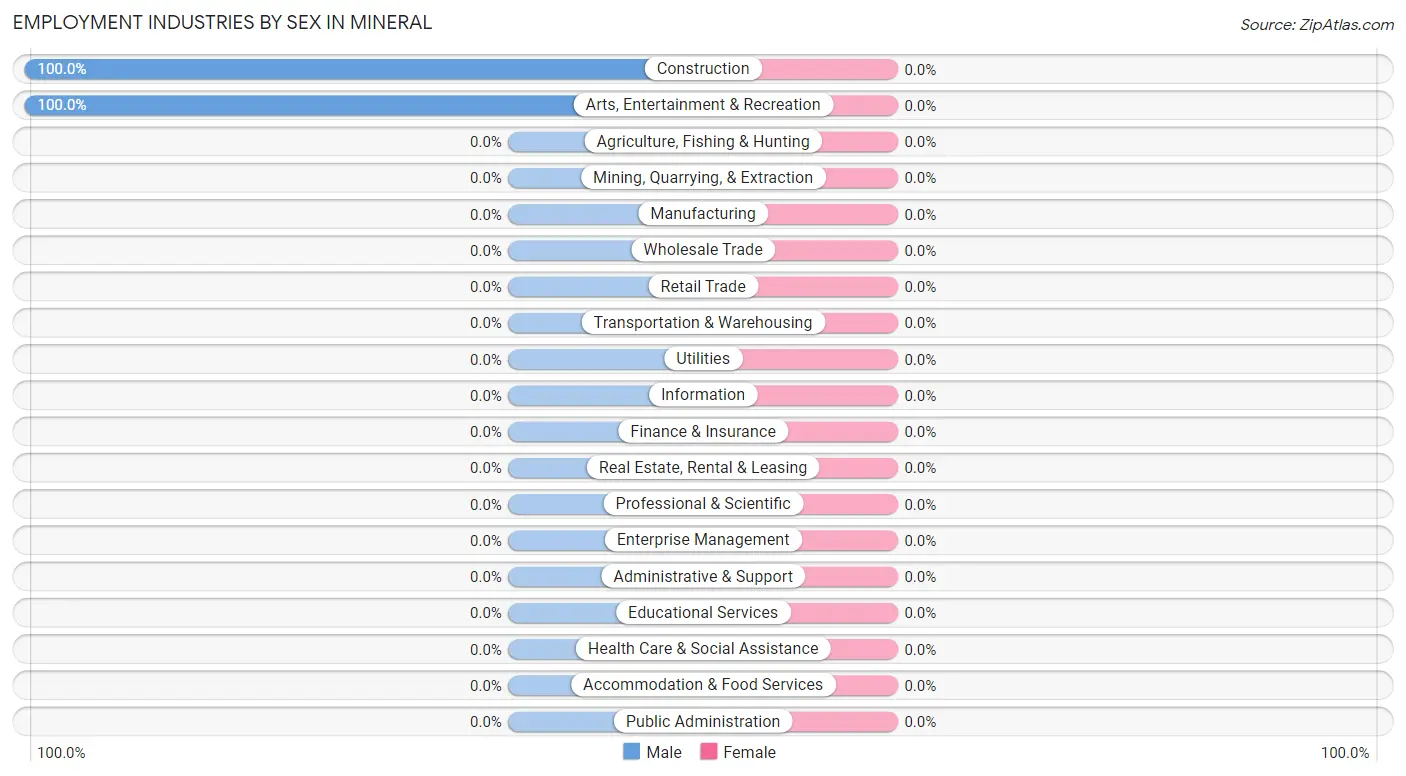
| Industry | Male | Female |
| Agriculture, Fishing & Hunting | 0 (0.0%) | 0 (0.0%) |
| Mining, Quarrying, & Extraction | 0 (0.0%) | 0 (0.0%) |
| Construction | 27 (100.0%) | 0 (0.0%) |
| Manufacturing | 0 (0.0%) | 0 (0.0%) |
| Wholesale Trade | 0 (0.0%) | 0 (0.0%) |
| Retail Trade | 0 (0.0%) | 0 (0.0%) |
| Transportation & Warehousing | 0 (0.0%) | 0 (0.0%) |
| Utilities | 0 (0.0%) | 0 (0.0%) |
| Information | 0 (0.0%) | 0 (0.0%) |
| Finance & Insurance | 0 (0.0%) | 0 (0.0%) |
| Real Estate, Rental & Leasing | 0 (0.0%) | 0 (0.0%) |
| Professional & Scientific | 0 (0.0%) | 0 (0.0%) |
| Enterprise Management | 0 (0.0%) | 0 (0.0%) |
| Administrative & Support | 0 (0.0%) | 0 (0.0%) |
| Educational Services | 0 (0.0%) | 0 (0.0%) |
| Health Care & Social Assistance | 0 (0.0%) | 0 (0.0%) |
| Arts, Entertainment & Recreation | 21 (100.0%) | 0 (0.0%) |
| Accommodation & Food Services | 0 (0.0%) | 0 (0.0%) |
| Public Administration | 0 (0.0%) | 0 (0.0%) |
| Total | 48 (100.0%) | 0 (0.0%) |
Education in Mineral
School Enrollment in Mineral
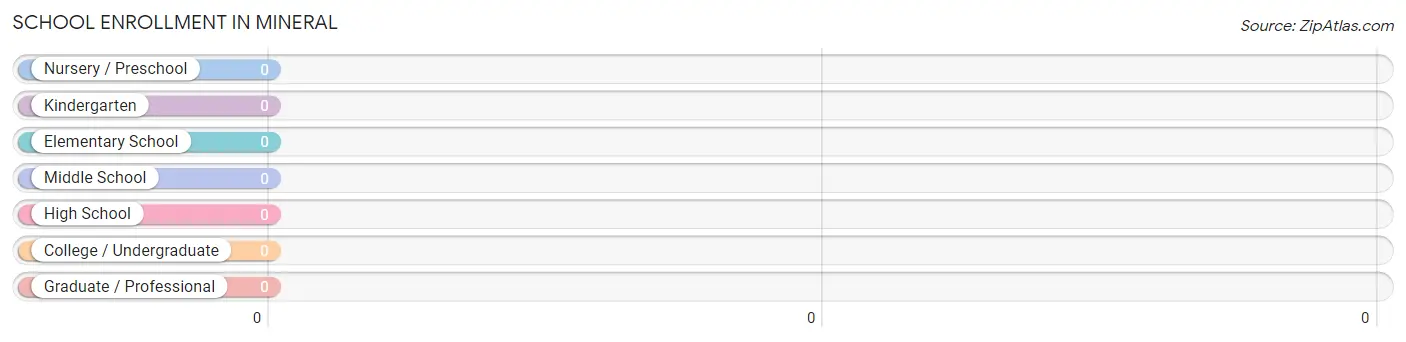
| School Level | # Students | % Students |
| Nursery / Preschool | 0 | 0.0% |
| Kindergarten | 0 | 0.0% |
| Elementary School | 0 | 0.0% |
| Middle School | 0 | 0.0% |
| High School | 0 | 0.0% |
| College / Undergraduate | 0 | 0.0% |
| Graduate / Professional | 0 | 0.0% |
| Total | 0 | 0.0% |
School Enrollment by Age by Funding Source in Mineral
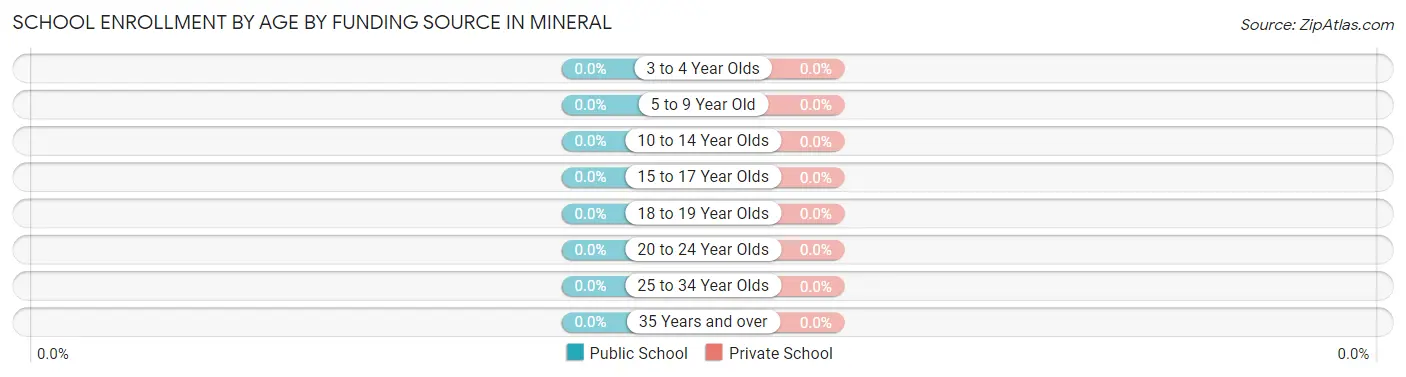
| Age Bracket | Public School | Private School |
| 3 to 4 Year Olds | 0 (0.0%) | 0 (0.0%) |
| 5 to 9 Year Old | 0 (0.0%) | 0 (0.0%) |
| 10 to 14 Year Olds | 0 (0.0%) | 0 (0.0%) |
| 15 to 17 Year Olds | 0 (0.0%) | 0 (0.0%) |
| 18 to 19 Year Olds | 0 (0.0%) | 0 (0.0%) |
| 20 to 24 Year Olds | 0 (0.0%) | 0 (0.0%) |
| 25 to 34 Year Olds | 0 (0.0%) | 0 (0.0%) |
| 35 Years and over | 0 (0.0%) | 0 (0.0%) |
| Total | 0 (0.0%) | 0 (0.0%) |
Educational Attainment by Field of Study in Mineral
Arts & humanities (18 | 69.2%), and business (8 | 30.8%) are the most common fields of study among 26 individuals in Mineral who have obtained a bachelor's degree or higher.
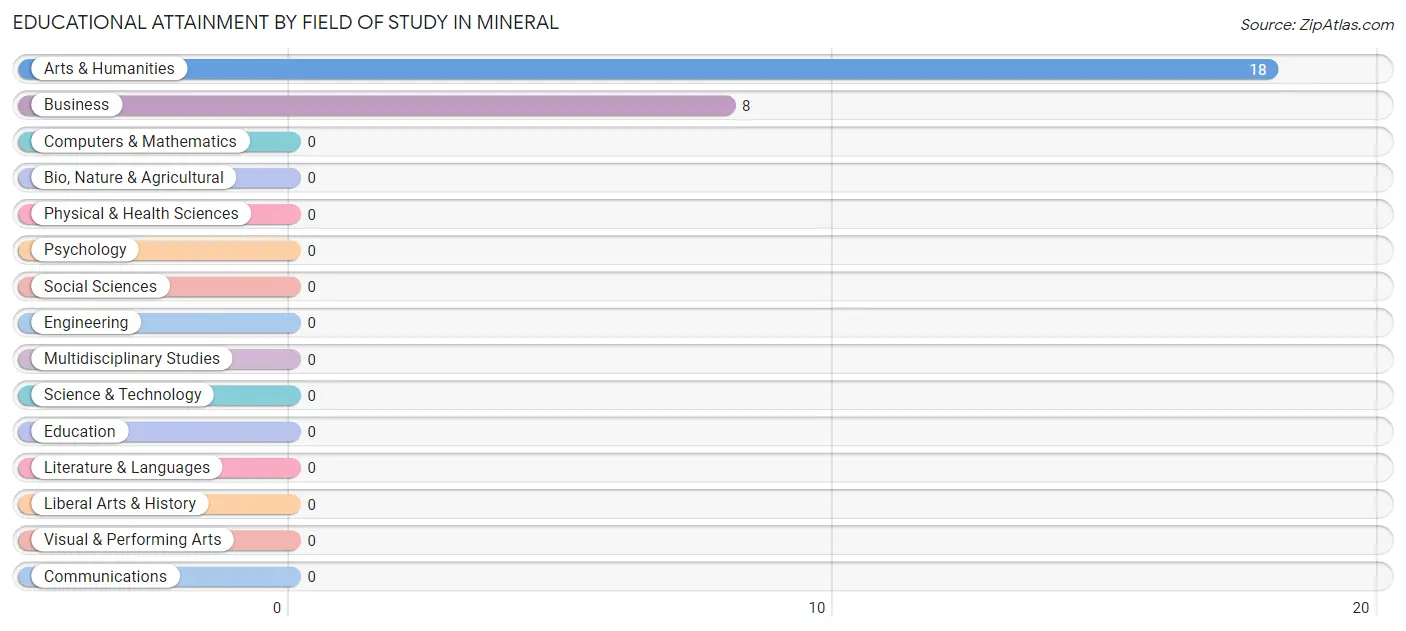
| Field of Study | # Graduates | % Graduates |
| Computers & Mathematics | 0 | 0.0% |
| Bio, Nature & Agricultural | 0 | 0.0% |
| Physical & Health Sciences | 0 | 0.0% |
| Psychology | 0 | 0.0% |
| Social Sciences | 0 | 0.0% |
| Engineering | 0 | 0.0% |
| Multidisciplinary Studies | 0 | 0.0% |
| Science & Technology | 0 | 0.0% |
| Business | 8 | 30.8% |
| Education | 0 | 0.0% |
| Literature & Languages | 0 | 0.0% |
| Liberal Arts & History | 0 | 0.0% |
| Visual & Performing Arts | 0 | 0.0% |
| Communications | 0 | 0.0% |
| Arts & Humanities | 18 | 69.2% |
| Total | 26 | 100.0% |
Transportation & Commute in Mineral
Vehicle Availability by Sex in Mineral
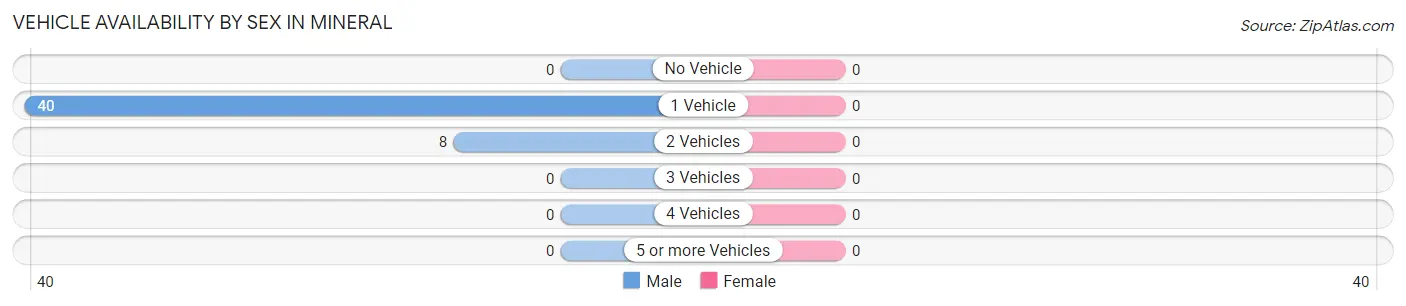
| Vehicles Available | Male | Female |
| No Vehicle | 0 (0.0%) | 0 (0.0%) |
| 1 Vehicle | 40 (83.3%) | 0 (0.0%) |
| 2 Vehicles | 8 (16.7%) | 0 (0.0%) |
| 3 Vehicles | 0 (0.0%) | 0 (0.0%) |
| 4 Vehicles | 0 (0.0%) | 0 (0.0%) |
| 5 or more Vehicles | 0 (0.0%) | 0 (0.0%) |
| Total | 48 (100.0%) | 0 (0.0%) |
Commute Time in Mineral
The most frequently occuring commute durations in Mineral are 5 to 9 minutes (40 commuters, 83.3%), 10 to 14 minutes (8 commuters, 16.7%), and less than 5 minutes (0 commuters, 0.0%).
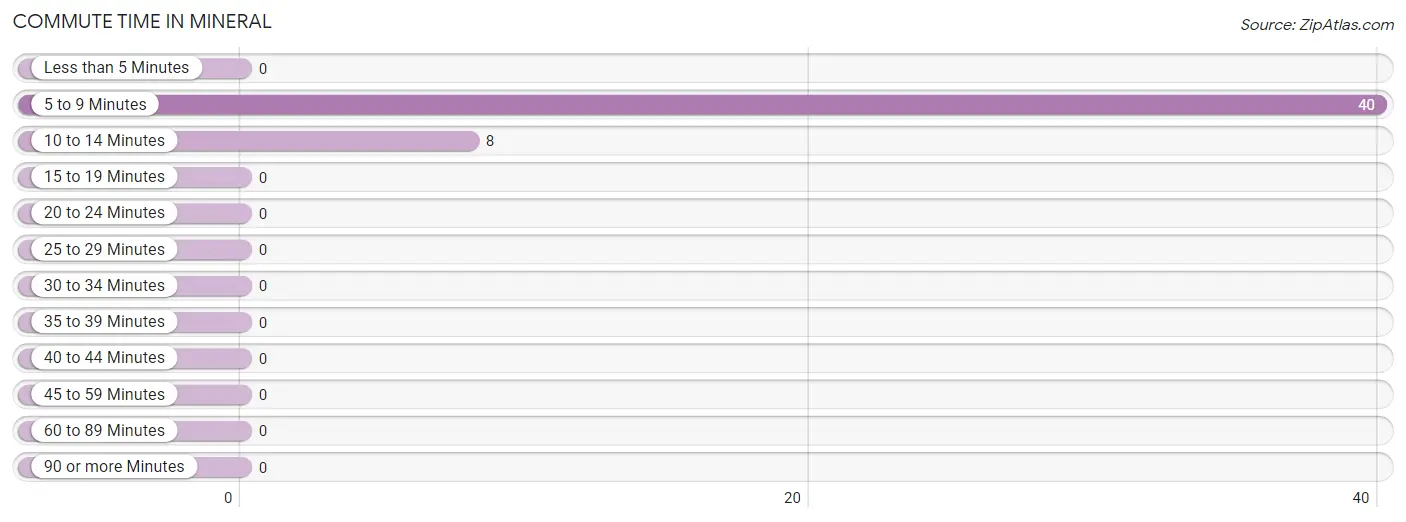
| Commute Time | # Commuters | % Commuters |
| Less than 5 Minutes | 0 | 0.0% |
| 5 to 9 Minutes | 40 | 83.3% |
| 10 to 14 Minutes | 8 | 16.7% |
| 15 to 19 Minutes | 0 | 0.0% |
| 20 to 24 Minutes | 0 | 0.0% |
| 25 to 29 Minutes | 0 | 0.0% |
| 30 to 34 Minutes | 0 | 0.0% |
| 35 to 39 Minutes | 0 | 0.0% |
| 40 to 44 Minutes | 0 | 0.0% |
| 45 to 59 Minutes | 0 | 0.0% |
| 60 to 89 Minutes | 0 | 0.0% |
| 90 or more Minutes | 0 | 0.0% |
Commute Time by Sex in Mineral
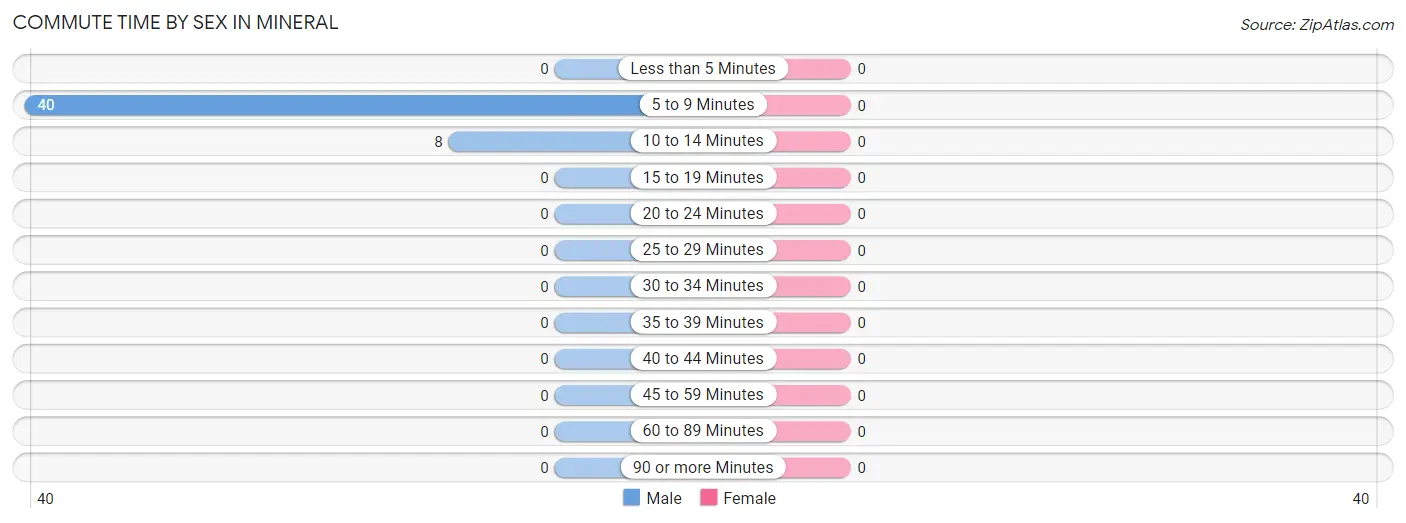
| Commute Time | Male | Female |
| Less than 5 Minutes | 0 (0.0%) | 0 (0.0%) |
| 5 to 9 Minutes | 40 (83.3%) | 0 (0.0%) |
| 10 to 14 Minutes | 8 (16.7%) | 0 (0.0%) |
| 15 to 19 Minutes | 0 (0.0%) | 0 (0.0%) |
| 20 to 24 Minutes | 0 (0.0%) | 0 (0.0%) |
| 25 to 29 Minutes | 0 (0.0%) | 0 (0.0%) |
| 30 to 34 Minutes | 0 (0.0%) | 0 (0.0%) |
| 35 to 39 Minutes | 0 (0.0%) | 0 (0.0%) |
| 40 to 44 Minutes | 0 (0.0%) | 0 (0.0%) |
| 45 to 59 Minutes | 0 (0.0%) | 0 (0.0%) |
| 60 to 89 Minutes | 0 (0.0%) | 0 (0.0%) |
| 90 or more Minutes | 0 (0.0%) | 0 (0.0%) |
Time of Departure to Work by Sex in Mineral
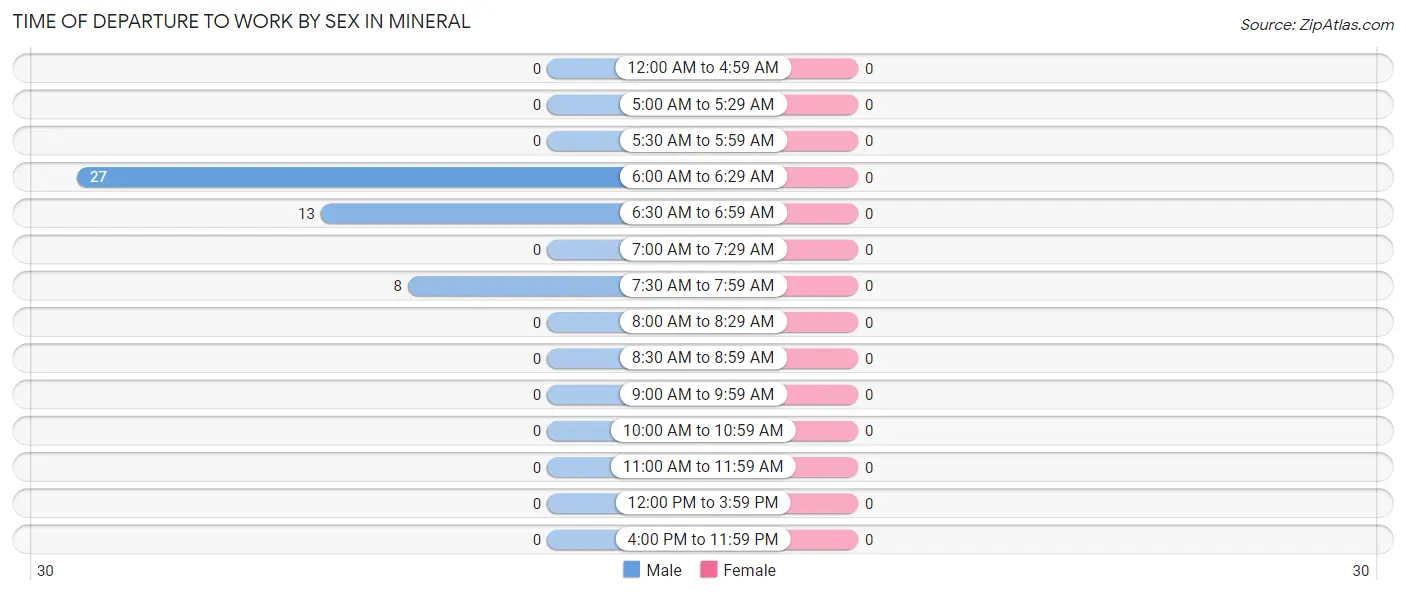
| Time of Departure | Male | Female |
| 12:00 AM to 4:59 AM | 0 (0.0%) | 0 (0.0%) |
| 5:00 AM to 5:29 AM | 0 (0.0%) | 0 (0.0%) |
| 5:30 AM to 5:59 AM | 0 (0.0%) | 0 (0.0%) |
| 6:00 AM to 6:29 AM | 27 (56.2%) | 0 (0.0%) |
| 6:30 AM to 6:59 AM | 13 (27.1%) | 0 (0.0%) |
| 7:00 AM to 7:29 AM | 0 (0.0%) | 0 (0.0%) |
| 7:30 AM to 7:59 AM | 8 (16.7%) | 0 (0.0%) |
| 8:00 AM to 8:29 AM | 0 (0.0%) | 0 (0.0%) |
| 8:30 AM to 8:59 AM | 0 (0.0%) | 0 (0.0%) |
| 9:00 AM to 9:59 AM | 0 (0.0%) | 0 (0.0%) |
| 10:00 AM to 10:59 AM | 0 (0.0%) | 0 (0.0%) |
| 11:00 AM to 11:59 AM | 0 (0.0%) | 0 (0.0%) |
| 12:00 PM to 3:59 PM | 0 (0.0%) | 0 (0.0%) |
| 4:00 PM to 11:59 PM | 0 (0.0%) | 0 (0.0%) |
| Total | 48 (100.0%) | 0 (0.0%) |
Housing Occupancy in Mineral
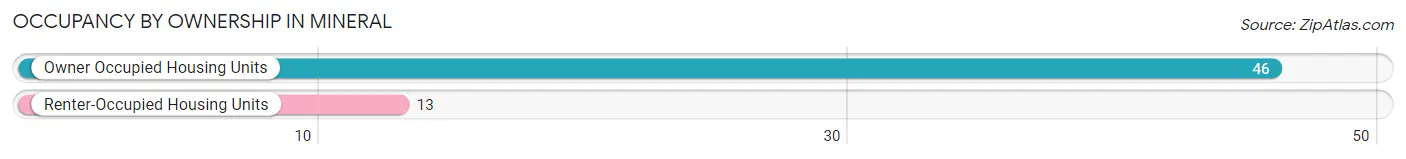
Occupancy by Ownership in Mineral
Of the total 59 dwellings in Mineral, owner-occupied units account for 46 (78.0%), while renter-occupied units make up 13 (22.0%).
| Occupancy | # Housing Units | % Housing Units |
| Owner Occupied Housing Units | 46 | 78.0% |
| Renter-Occupied Housing Units | 13 | 22.0% |
| Total Occupied Housing Units | 59 | 100.0% |
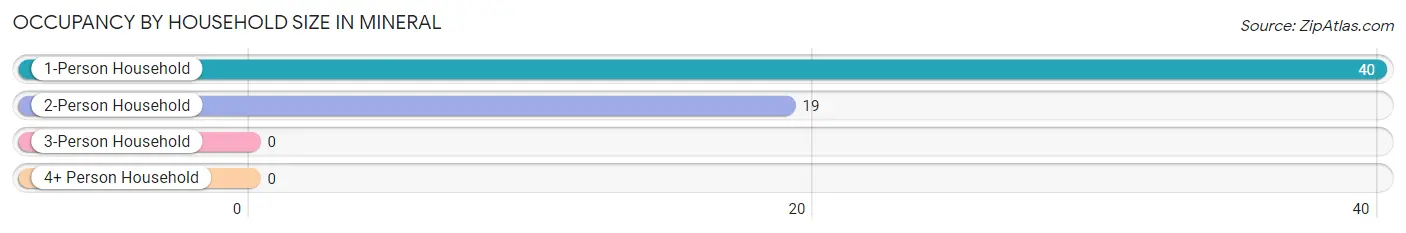
Occupancy by Household Size in Mineral
| Household Size | # Housing Units | % Housing Units |
| 1-Person Household | 40 | 67.8% |
| 2-Person Household | 19 | 32.2% |
| 3-Person Household | 0 | 0.0% |
| 4+ Person Household | 0 | 0.0% |
| Total Housing Units | 59 | 100.0% |
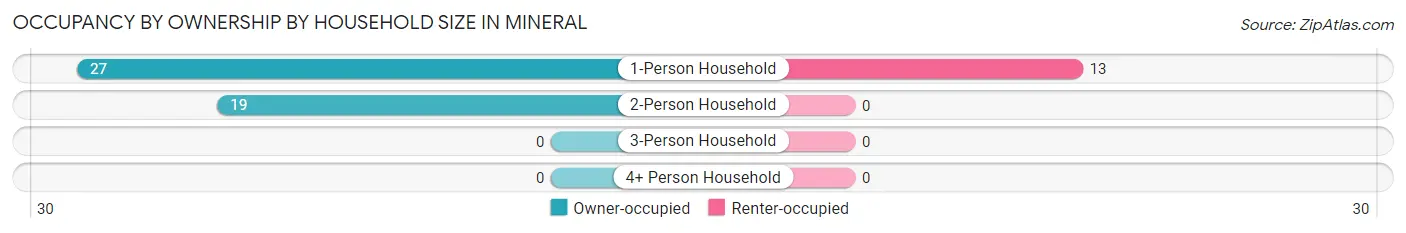
Occupancy by Ownership by Household Size in Mineral
| Household Size | Owner-occupied | Renter-occupied |
| 1-Person Household | 27 (67.5%) | 13 (32.5%) |
| 2-Person Household | 19 (100.0%) | 0 (0.0%) |
| 3-Person Household | 0 (0.0%) | 0 (0.0%) |
| 4+ Person Household | 0 (0.0%) | 0 (0.0%) |
| Total Housing Units | 46 (78.0%) | 13 (22.0%) |
Occupancy by Educational Attainment in Mineral
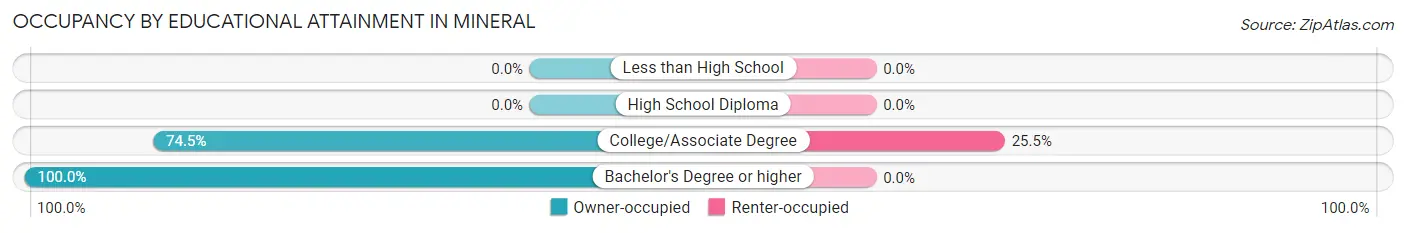
| Household Size | Owner-occupied | Renter-occupied |
| Less than High School | 0 (0.0%) | 0 (0.0%) |
| High School Diploma | 0 (0.0%) | 0 (0.0%) |
| College/Associate Degree | 38 (74.5%) | 13 (25.5%) |
| Bachelor's Degree or higher | 8 (100.0%) | 0 (0.0%) |
Occupancy by Age of Householder in Mineral
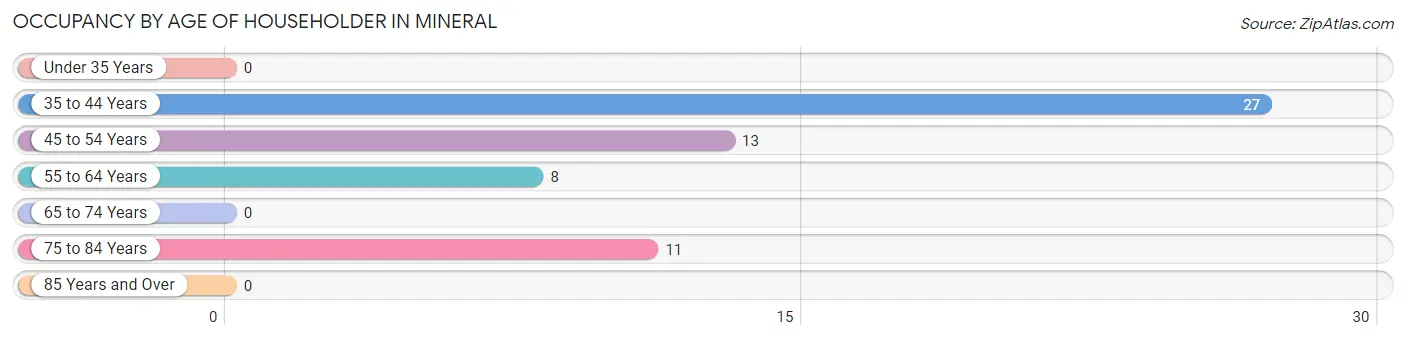
| Age Bracket | # Households | % Households |
| Under 35 Years | 0 | 0.0% |
| 35 to 44 Years | 27 | 45.8% |
| 45 to 54 Years | 13 | 22.0% |
| 55 to 64 Years | 8 | 13.6% |
| 65 to 74 Years | 0 | 0.0% |
| 75 to 84 Years | 11 | 18.6% |
| 85 Years and Over | 0 | 0.0% |
| Total | 59 | 100.0% |
Housing Finances in Mineral
Median Income by Occupancy in Mineral
| Occupancy Type | # Households | Median Income |
| Owner-Occupied | 46 (78.0%) | $0 |
| Renter-Occupied | 13 (22.0%) | $0 |
| Average | 59 (100.0%) | $0 |
Occupancy by Householder Income Bracket in Mineral
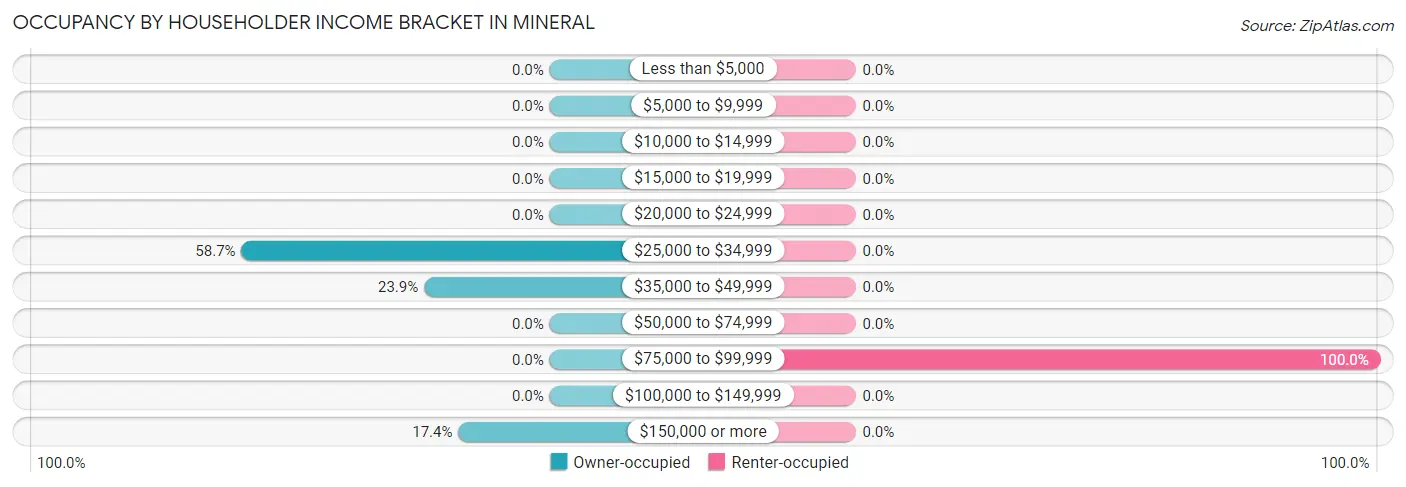
| Income Bracket | Owner-occupied | Renter-occupied |
| Less than $5,000 | 0 (0.0%) | 0 (0.0%) |
| $5,000 to $9,999 | 0 (0.0%) | 0 (0.0%) |
| $10,000 to $14,999 | 0 (0.0%) | 0 (0.0%) |
| $15,000 to $19,999 | 0 (0.0%) | 0 (0.0%) |
| $20,000 to $24,999 | 0 (0.0%) | 0 (0.0%) |
| $25,000 to $34,999 | 27 (58.7%) | 0 (0.0%) |
| $35,000 to $49,999 | 11 (23.9%) | 0 (0.0%) |
| $50,000 to $74,999 | 0 (0.0%) | 0 (0.0%) |
| $75,000 to $99,999 | 0 (0.0%) | 13 (100.0%) |
| $100,000 to $149,999 | 0 (0.0%) | 0 (0.0%) |
| $150,000 or more | 8 (17.4%) | 0 (0.0%) |
| Total | 46 (100.0%) | 13 (100.0%) |
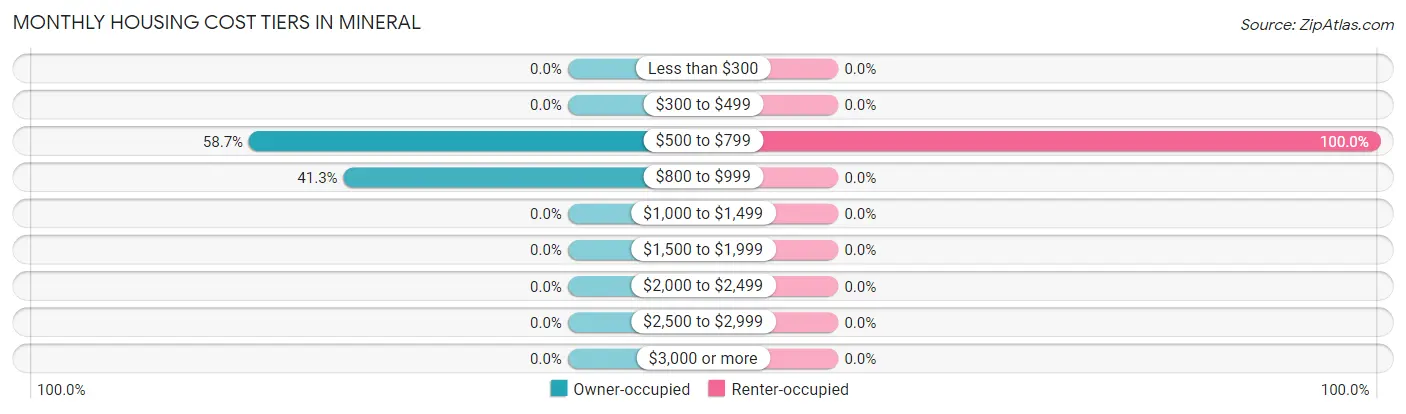
Monthly Housing Cost Tiers in Mineral
| Monthly Cost | Owner-occupied | Renter-occupied |
| Less than $300 | 0 (0.0%) | 0 (0.0%) |
| $300 to $499 | 0 (0.0%) | 0 (0.0%) |
| $500 to $799 | 27 (58.7%) | 13 (100.0%) |
| $800 to $999 | 19 (41.3%) | 0 (0.0%) |
| $1,000 to $1,499 | 0 (0.0%) | 0 (0.0%) |
| $1,500 to $1,999 | 0 (0.0%) | 0 (0.0%) |
| $2,000 to $2,499 | 0 (0.0%) | 0 (0.0%) |
| $2,500 to $2,999 | 0 (0.0%) | 0 (0.0%) |
| $3,000 or more | 0 (0.0%) | 0 (0.0%) |
| Total | 46 (100.0%) | 13 (100.0%) |
Physical Housing Characteristics in Mineral
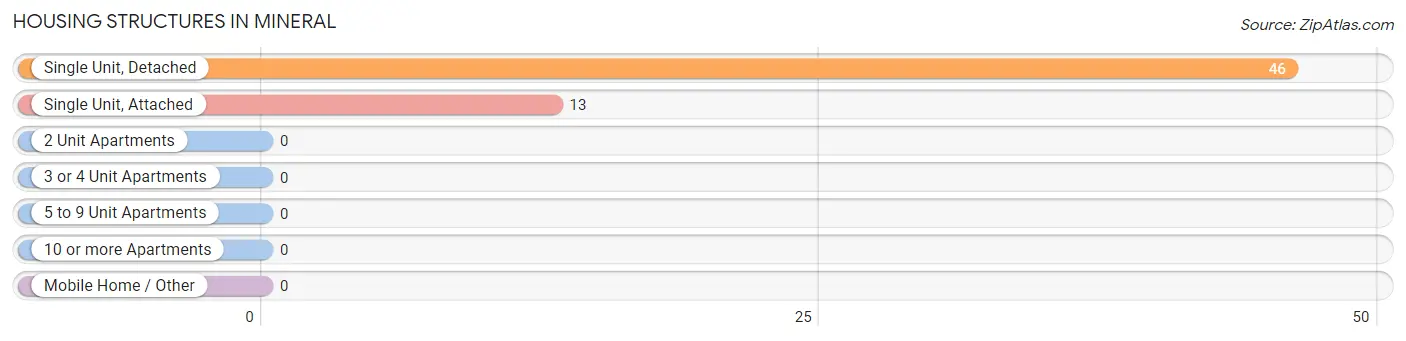
Housing Structures in Mineral
| Structure Type | # Housing Units | % Housing Units |
| Single Unit, Detached | 46 | 78.0% |
| Single Unit, Attached | 13 | 22.0% |
| 2 Unit Apartments | 0 | 0.0% |
| 3 or 4 Unit Apartments | 0 | 0.0% |
| 5 to 9 Unit Apartments | 0 | 0.0% |
| 10 or more Apartments | 0 | 0.0% |
| Mobile Home / Other | 0 | 0.0% |
| Total | 59 | 100.0% |
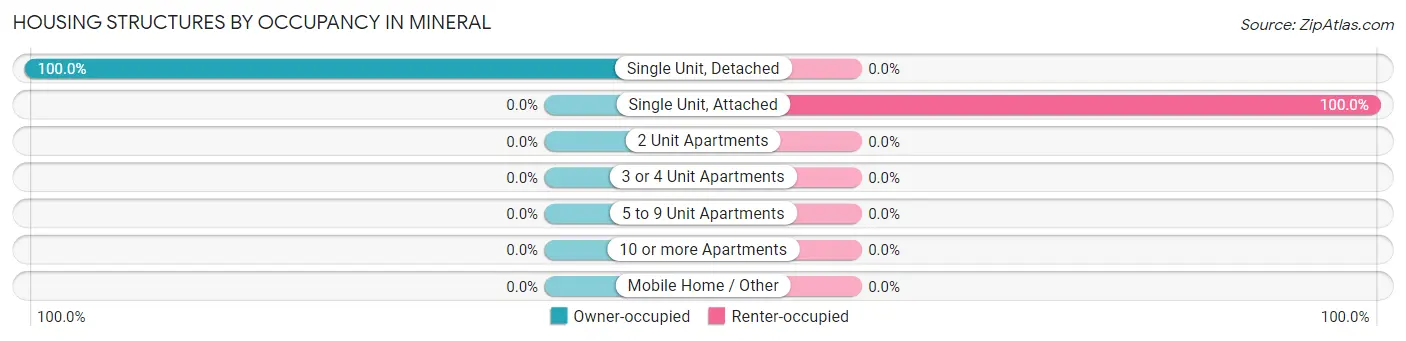
Housing Structures by Occupancy in Mineral
| Structure Type | Owner-occupied | Renter-occupied |
| Single Unit, Detached | 46 (100.0%) | 0 (0.0%) |
| Single Unit, Attached | 0 (0.0%) | 13 (100.0%) |
| 2 Unit Apartments | 0 (0.0%) | 0 (0.0%) |
| 3 or 4 Unit Apartments | 0 (0.0%) | 0 (0.0%) |
| 5 to 9 Unit Apartments | 0 (0.0%) | 0 (0.0%) |
| 10 or more Apartments | 0 (0.0%) | 0 (0.0%) |
| Mobile Home / Other | 0 (0.0%) | 0 (0.0%) |
| Total | 46 (78.0%) | 13 (22.0%) |
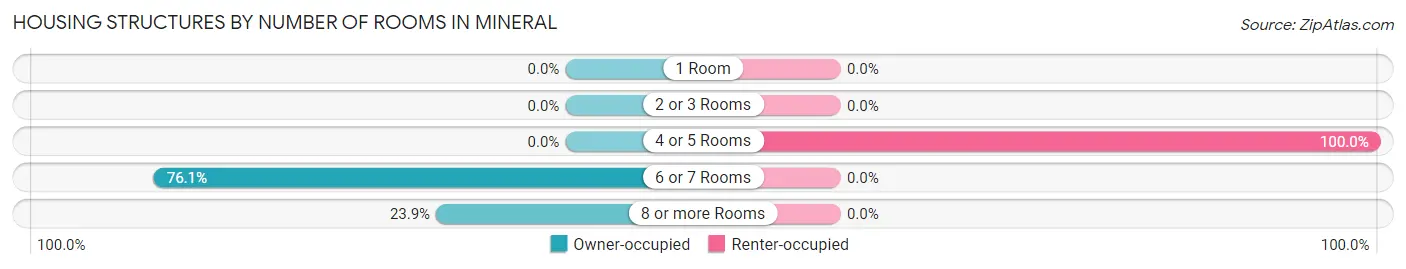
Housing Structures by Number of Rooms in Mineral
| Number of Rooms | Owner-occupied | Renter-occupied |
| 1 Room | 0 (0.0%) | 0 (0.0%) |
| 2 or 3 Rooms | 0 (0.0%) | 0 (0.0%) |
| 4 or 5 Rooms | 0 (0.0%) | 13 (100.0%) |
| 6 or 7 Rooms | 35 (76.1%) | 0 (0.0%) |
| 8 or more Rooms | 11 (23.9%) | 0 (0.0%) |
| Total | 46 (100.0%) | 13 (100.0%) |
Housing Structure by Heating Type in Mineral
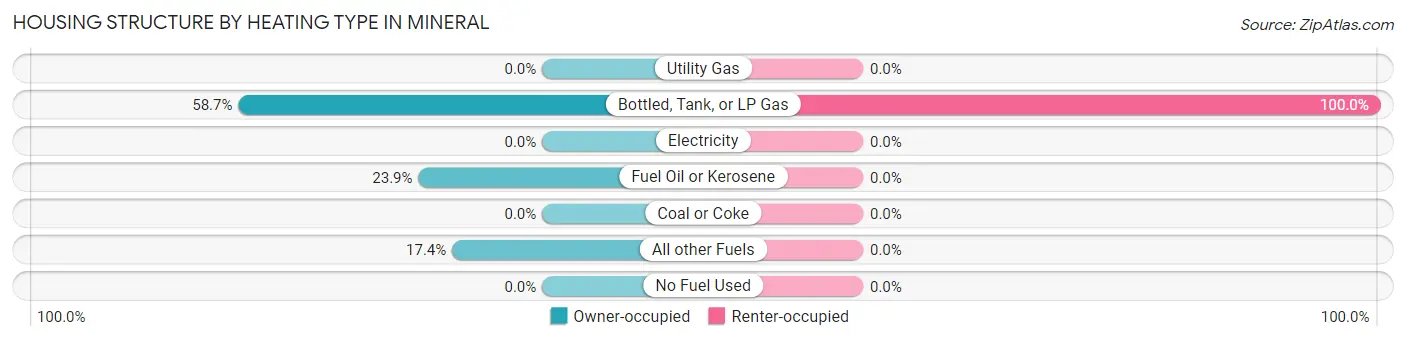
| Heating Type | Owner-occupied | Renter-occupied |
| Utility Gas | 0 (0.0%) | 0 (0.0%) |
| Bottled, Tank, or LP Gas | 27 (58.7%) | 13 (100.0%) |
| Electricity | 0 (0.0%) | 0 (0.0%) |
| Fuel Oil or Kerosene | 11 (23.9%) | 0 (0.0%) |
| Coal or Coke | 0 (0.0%) | 0 (0.0%) |
| All other Fuels | 8 (17.4%) | 0 (0.0%) |
| No Fuel Used | 0 (0.0%) | 0 (0.0%) |
| Total | 46 (100.0%) | 13 (100.0%) |
Household Vehicle Usage in Mineral
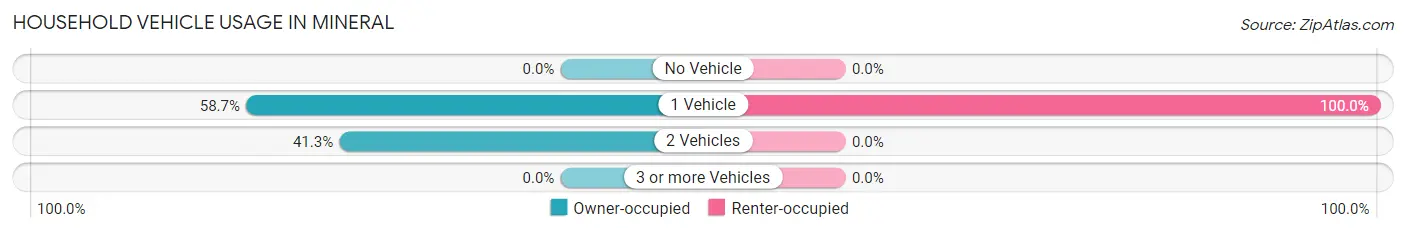
| Vehicles per Household | Owner-occupied | Renter-occupied |
| No Vehicle | 0 (0.0%) | 0 (0.0%) |
| 1 Vehicle | 27 (58.7%) | 13 (100.0%) |
| 2 Vehicles | 19 (41.3%) | 0 (0.0%) |
| 3 or more Vehicles | 0 (0.0%) | 0 (0.0%) |
| Total | 46 (100.0%) | 13 (100.0%) |
Real Estate & Mortgages in Mineral
Real Estate and Mortgage Overview in Mineral
| Characteristic | Without Mortgage | With Mortgage |
| Housing Units | 8 | 38 |
| Median Property Value | - | - |
| Median Household Income | - | - |
| Monthly Housing Costs | - | - |
| Real Estate Taxes | - | - |
Property Value by Mortgage Status in Mineral
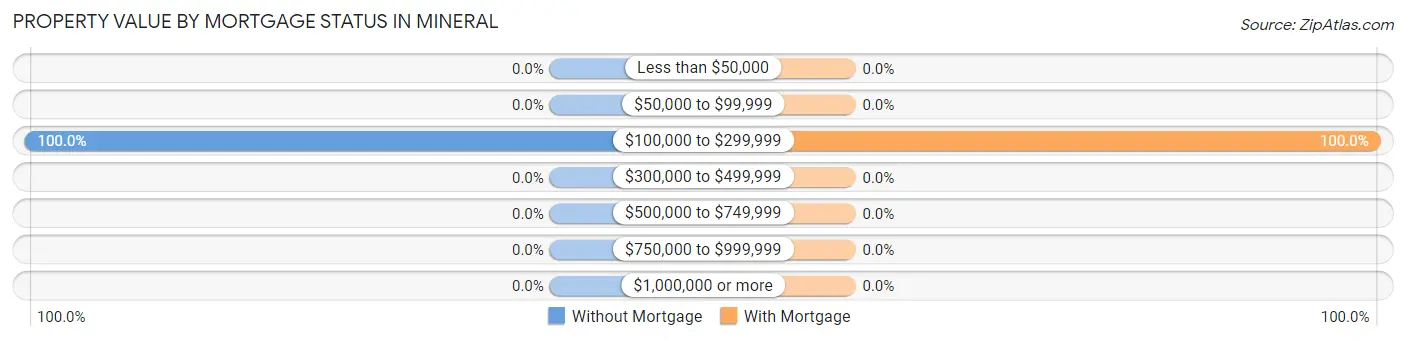
| Property Value | Without Mortgage | With Mortgage |
| Less than $50,000 | 0 (0.0%) | 0 (0.0%) |
| $50,000 to $99,999 | 0 (0.0%) | 0 (0.0%) |
| $100,000 to $299,999 | 8 (100.0%) | 38 (100.0%) |
| $300,000 to $499,999 | 0 (0.0%) | 0 (0.0%) |
| $500,000 to $749,999 | 0 (0.0%) | 0 (0.0%) |
| $750,000 to $999,999 | 0 (0.0%) | 0 (0.0%) |
| $1,000,000 or more | 0 (0.0%) | 0 (0.0%) |
| Total | 8 (100.0%) | 38 (100.0%) |
Household Income by Mortgage Status in Mineral
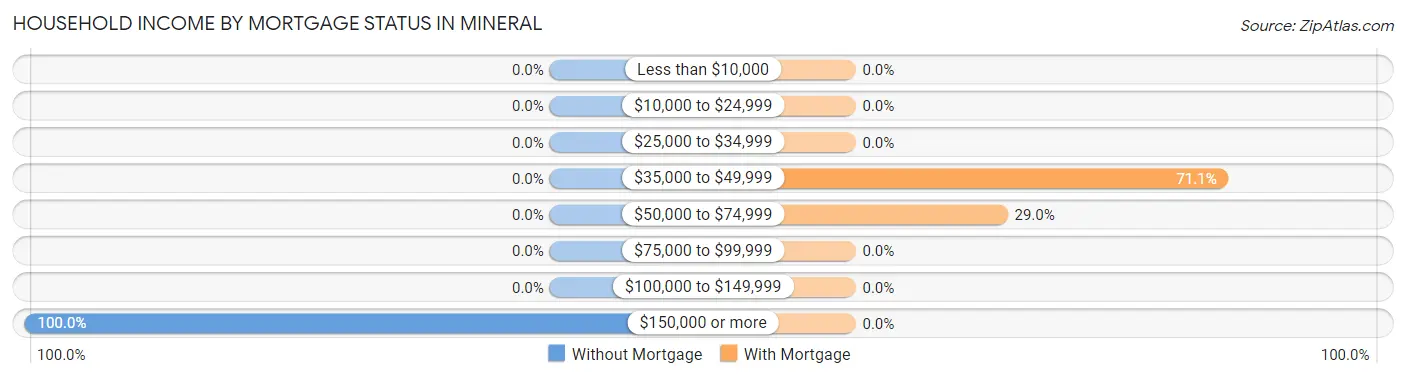
| Household Income | Without Mortgage | With Mortgage |
| Less than $10,000 | 0 (0.0%) | 0 (0.0%) |
| $10,000 to $24,999 | 0 (0.0%) | 0 (0.0%) |
| $25,000 to $34,999 | 0 (0.0%) | 0 (0.0%) |
| $35,000 to $49,999 | 0 (0.0%) | 27 (71.1%) |
| $50,000 to $74,999 | 0 (0.0%) | 11 (28.9%) |
| $75,000 to $99,999 | 0 (0.0%) | 0 (0.0%) |
| $100,000 to $149,999 | 0 (0.0%) | 0 (0.0%) |
| $150,000 or more | 8 (100.0%) | 0 (0.0%) |
| Total | 8 (100.0%) | 38 (100.0%) |
Property Value to Household Income Ratio in Mineral
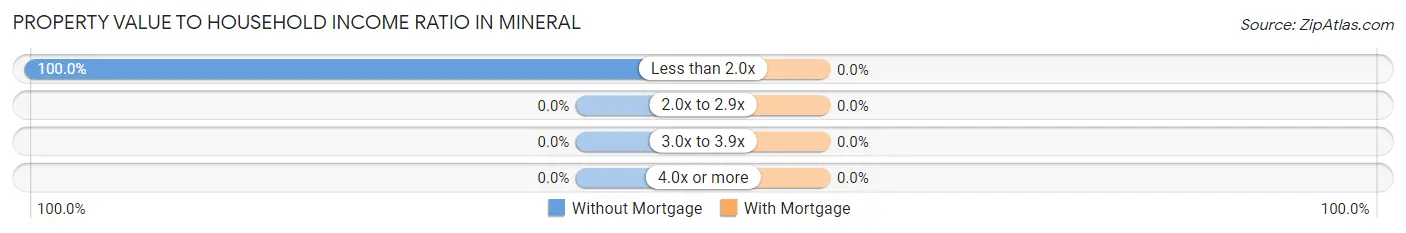
| Value-to-Income Ratio | Without Mortgage | With Mortgage |
| Less than 2.0x | 8 (100.0%) | 0 (0.0%) |
| 2.0x to 2.9x | 0 (0.0%) | 0 (0.0%) |
| 3.0x to 3.9x | 0 (0.0%) | 0 (0.0%) |
| 4.0x or more | 0 (0.0%) | 0 (0.0%) |
| Total | 8 (100.0%) | 38 (100.0%) |
Real Estate Taxes by Mortgage Status in Mineral
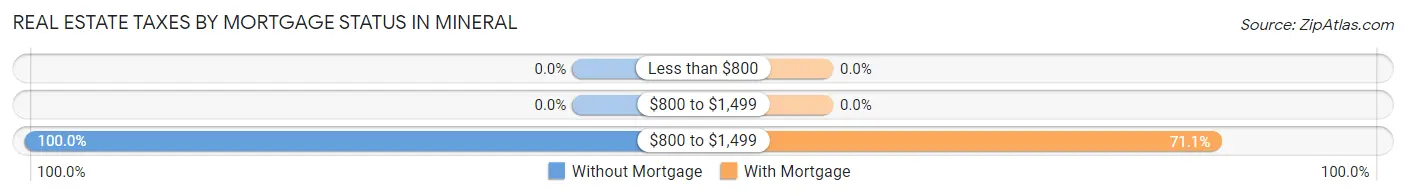
| Property Taxes | Without Mortgage | With Mortgage |
| Less than $800 | 0 (0.0%) | 0 (0.0%) |
| $800 to $1,499 | 0 (0.0%) | 0 (0.0%) |
| $800 to $1,499 | 8 (100.0%) | 27 (71.1%) |
| Total | 8 (100.0%) | 38 (100.0%) |
Health & Disability in Mineral
Health Insurance Coverage by Age in Mineral
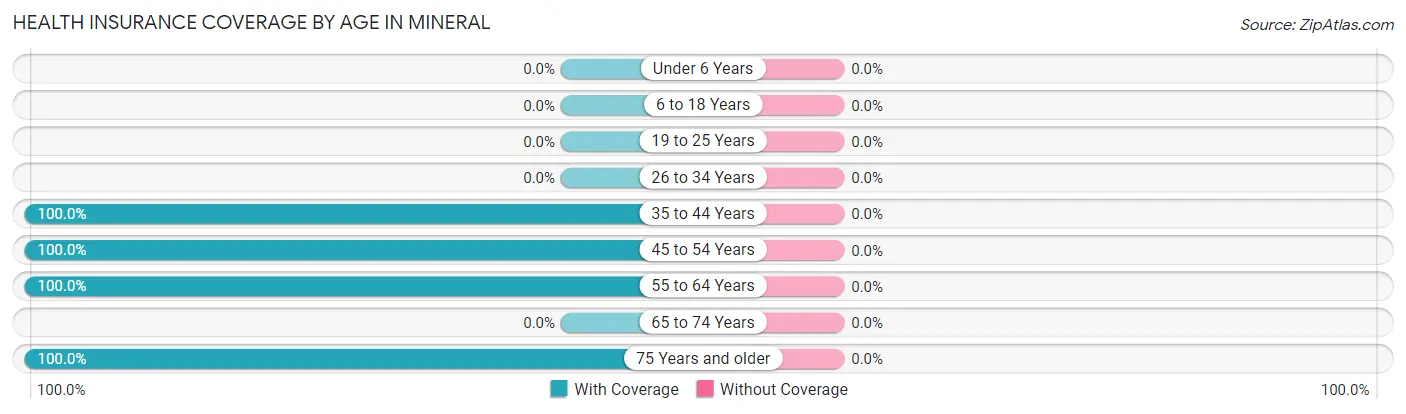
| Age Bracket | With Coverage | Without Coverage |
| Under 6 Years | 0 (0.0%) | 0 (0.0%) |
| 6 to 18 Years | 0 (0.0%) | 0 (0.0%) |
| 19 to 25 Years | 0 (0.0%) | 0 (0.0%) |
| 26 to 34 Years | 0 (0.0%) | 0 (0.0%) |
| 35 to 44 Years | 27 (100.0%) | 0 (0.0%) |
| 45 to 54 Years | 13 (100.0%) | 0 (0.0%) |
| 55 to 64 Years | 18 (100.0%) | 0 (0.0%) |
| 65 to 74 Years | 0 (0.0%) | 0 (0.0%) |
| 75 Years and older | 19 (100.0%) | 0 (0.0%) |
| Total | 77 (100.0%) | 0 (0.0%) |
Health Insurance Coverage by Citizenship Status in Mineral
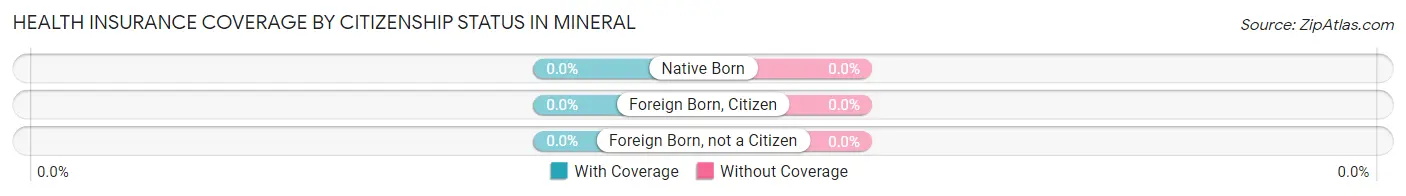
| Citizenship Status | With Coverage | Without Coverage |
| Native Born | 0 (0.0%) | 0 (0.0%) |
| Foreign Born, Citizen | 0 (0.0%) | 0 (0.0%) |
| Foreign Born, not a Citizen | 0 (0.0%) | 0 (0.0%) |
Health Insurance Coverage by Household Income in Mineral
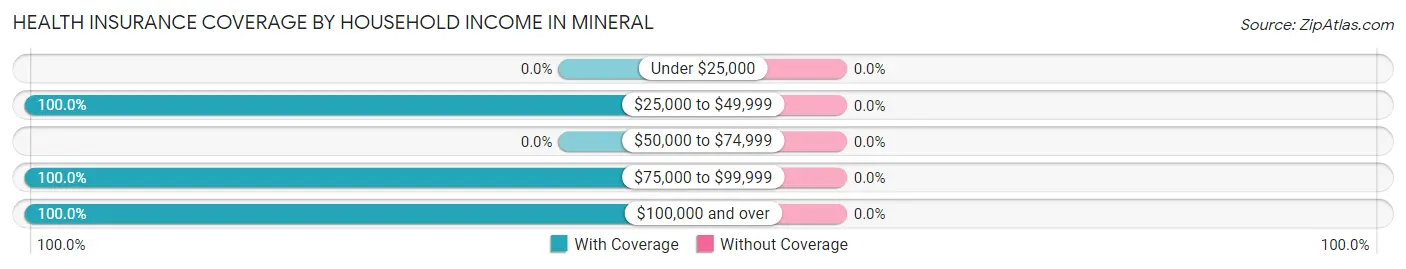
| Household Income | With Coverage | Without Coverage |
| Under $25,000 | 0 (0.0%) | 0 (0.0%) |
| $25,000 to $49,999 | 46 (100.0%) | 0 (0.0%) |
| $50,000 to $74,999 | 0 (0.0%) | 0 (0.0%) |
| $75,000 to $99,999 | 13 (100.0%) | 0 (0.0%) |
| $100,000 and over | 18 (100.0%) | 0 (0.0%) |
Public vs Private Health Insurance Coverage by Age in Mineral
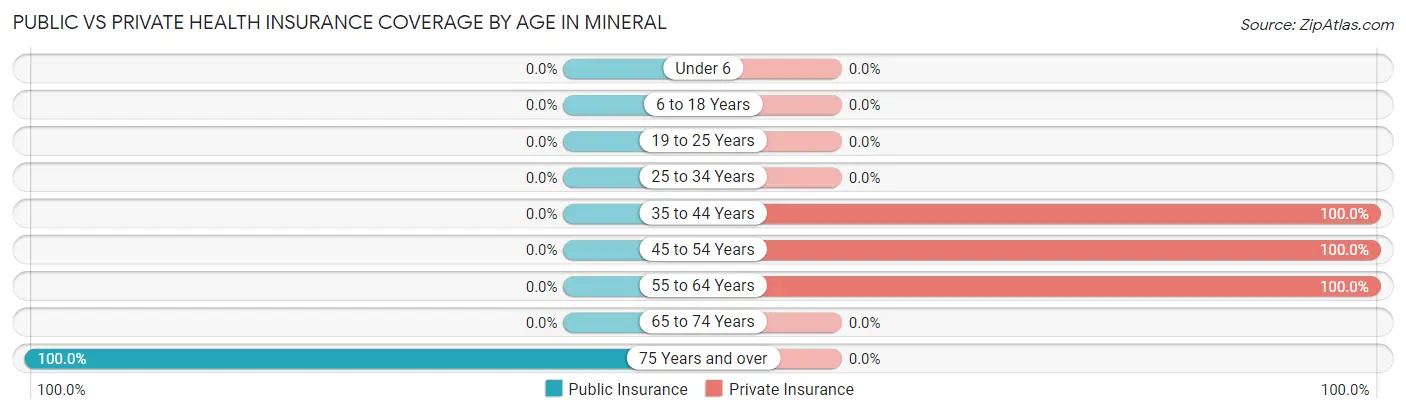
| Age Bracket | Public Insurance | Private Insurance |
| Under 6 | 0 (0.0%) | 0 (0.0%) |
| 6 to 18 Years | 0 (0.0%) | 0 (0.0%) |
| 19 to 25 Years | 0 (0.0%) | 0 (0.0%) |
| 25 to 34 Years | 0 (0.0%) | 0 (0.0%) |
| 35 to 44 Years | 0 (0.0%) | 27 (100.0%) |
| 45 to 54 Years | 0 (0.0%) | 13 (100.0%) |
| 55 to 64 Years | 0 (0.0%) | 18 (100.0%) |
| 65 to 74 Years | 0 (0.0%) | 0 (0.0%) |
| 75 Years and over | 19 (100.0%) | 0 (0.0%) |
| Total | 19 (24.7%) | 58 (75.3%) |
Disability Status by Sex by Age in Mineral
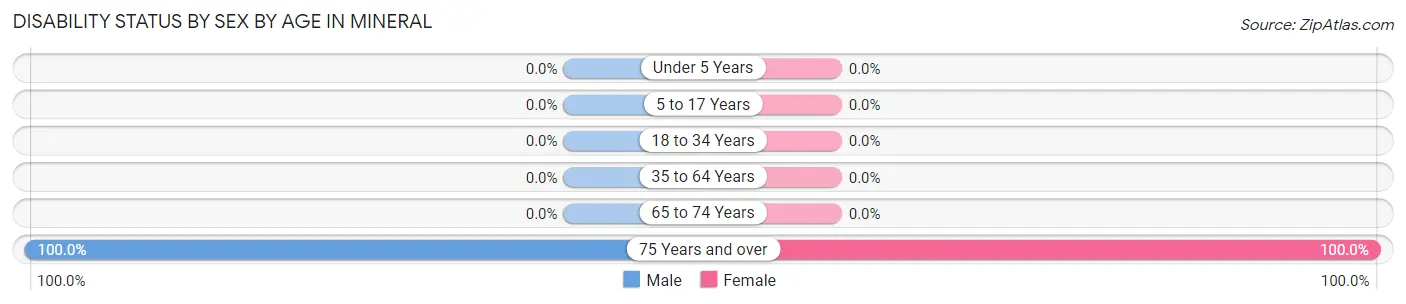
| Age Bracket | Male | Female |
| Under 5 Years | 0 (0.0%) | 0 (0.0%) |
| 5 to 17 Years | 0 (0.0%) | 0 (0.0%) |
| 18 to 34 Years | 0 (0.0%) | 0 (0.0%) |
| 35 to 64 Years | 0 (0.0%) | 0 (0.0%) |
| 65 to 74 Years | 0 (0.0%) | 0 (0.0%) |
| 75 Years and over | 8 (100.0%) | 11 (100.0%) |
Disability Class by Sex by Age in Mineral
Disability Class: Hearing Difficulty
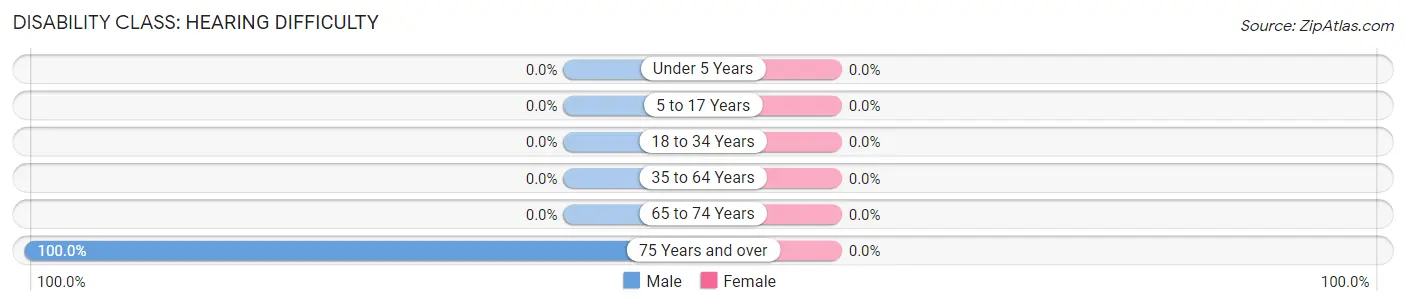
| Age Bracket | Male | Female |
| Under 5 Years | 0 (0.0%) | 0 (0.0%) |
| 5 to 17 Years | 0 (0.0%) | 0 (0.0%) |
| 18 to 34 Years | 0 (0.0%) | 0 (0.0%) |
| 35 to 64 Years | 0 (0.0%) | 0 (0.0%) |
| 65 to 74 Years | 0 (0.0%) | 0 (0.0%) |
| 75 Years and over | 8 (100.0%) | 0 (0.0%) |
Disability Class: Vision Difficulty
| Age Bracket | Male | Female |
| Under 5 Years | 0 (0.0%) | 0 (0.0%) |
| 5 to 17 Years | 0 (0.0%) | 0 (0.0%) |
| 18 to 34 Years | 0 (0.0%) | 0 (0.0%) |
| 35 to 64 Years | 0 (0.0%) | 0 (0.0%) |
| 65 to 74 Years | 0 (0.0%) | 0 (0.0%) |
| 75 Years and over | 0 (0.0%) | 0 (0.0%) |
Disability Class: Cognitive Difficulty
| Age Bracket | Male | Female |
| 5 to 17 Years | 0 (0.0%) | 0 (0.0%) |
| 18 to 34 Years | 0 (0.0%) | 0 (0.0%) |
| 35 to 64 Years | 0 (0.0%) | 0 (0.0%) |
| 65 to 74 Years | 0 (0.0%) | 0 (0.0%) |
| 75 Years and over | 0 (0.0%) | 0 (0.0%) |
Disability Class: Ambulatory Difficulty
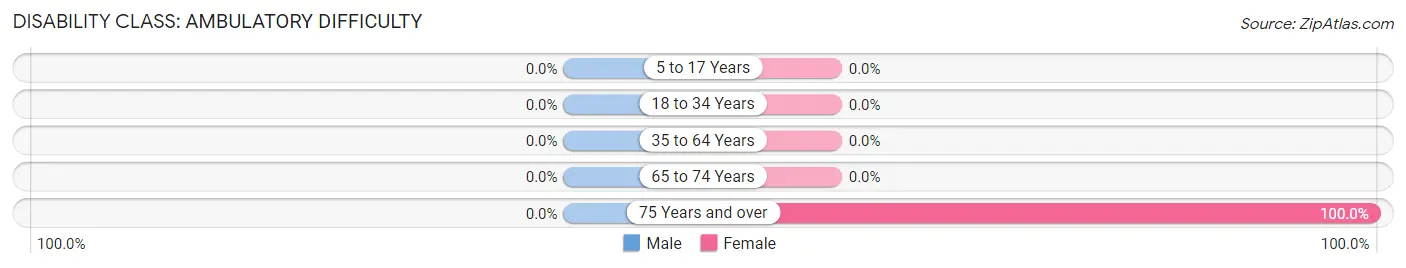
| Age Bracket | Male | Female |
| 5 to 17 Years | 0 (0.0%) | 0 (0.0%) |
| 18 to 34 Years | 0 (0.0%) | 0 (0.0%) |
| 35 to 64 Years | 0 (0.0%) | 0 (0.0%) |
| 65 to 74 Years | 0 (0.0%) | 0 (0.0%) |
| 75 Years and over | 0 (0.0%) | 11 (100.0%) |
Disability Class: Self-Care Difficulty
| Age Bracket | Male | Female |
| 5 to 17 Years | 0 (0.0%) | 0 (0.0%) |
| 18 to 34 Years | 0 (0.0%) | 0 (0.0%) |
| 35 to 64 Years | 0 (0.0%) | 0 (0.0%) |
| 65 to 74 Years | 0 (0.0%) | 0 (0.0%) |
| 75 Years and over | 0 (0.0%) | 0 (0.0%) |
Technology Access in Mineral
Computing Device Access in Mineral
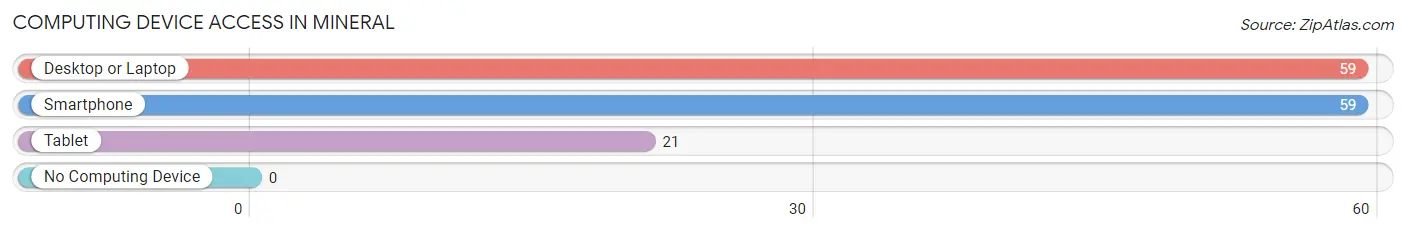
| Device Type | # Households | % Households |
| Desktop or Laptop | 59 | 100.0% |
| Smartphone | 59 | 100.0% |
| Tablet | 21 | 35.6% |
| No Computing Device | 0 | 0.0% |
| Total | 59 | 100.0% |
Internet Access in Mineral
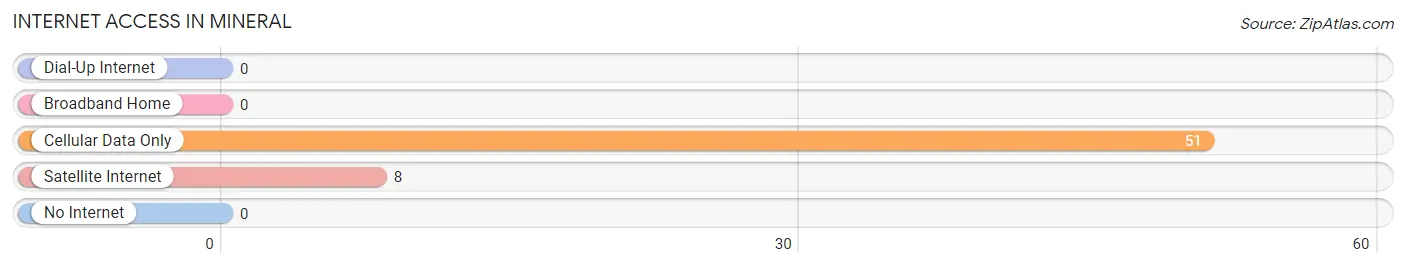
| Internet Type | # Households | % Households |
| Dial-Up Internet | 0 | 0.0% |
| Broadband Home | 0 | 0.0% |
| Cellular Data Only | 51 | 86.4% |
| Satellite Internet | 8 | 13.6% |
| No Internet | 0 | 0.0% |
| Total | 59 | 100.0% |
Mineral Summary
Mineral, California is a small unincorporated community located in the Sierra Nevada foothills of El Dorado County. It is situated at an elevation of 2,400 feet and is approximately 25 miles northeast of Placerville. The town was founded in 1851 and is one of the oldest settlements in the county. It is home to a population of approximately 500 people and is known for its rich history, stunning geography, and vibrant economy.
History
Mineral was founded in 1851 by a group of miners who were searching for gold in the area. The town was originally called “Minersville” but was later changed to “Mineral” in 1854. The town quickly grew and by 1856 it had a population of over 500 people. During this time, the town was a bustling center of commerce and was home to several businesses, including a hotel, saloon, and general store.
In the late 1800s, the town began to decline as the gold rush ended and the population dwindled. However, the town was revitalized in the early 1900s when the railroad came to town. This allowed for the transportation of goods and services to and from Mineral, which helped to revive the local economy.
Geography
Mineral is located in the Sierra Nevada foothills of El Dorado County. It is situated at an elevation of 2,400 feet and is approximately 25 miles northeast of Placerville. The town is surrounded by rolling hills and is home to several creeks and streams. The area is known for its stunning views of the Sierra Nevada Mountains and is a popular destination for outdoor activities such as hiking, camping, and fishing.
Economy
Mineral’s economy is largely based on tourism and agriculture. The town is home to several wineries and vineyards, which attract visitors from all over the world. The area is also known for its apple orchards, which produce a variety of apples for local consumption and export.
In addition to agriculture, Mineral is home to several small businesses, including restaurants, shops, and galleries. The town is also home to a number of bed and breakfasts, which attract visitors from all over the world.
Demographics
As of the 2010 census, Mineral had a population of 500 people. The racial makeup of the town was 94.2% White, 0.6% African American, 0.2% Native American, 0.2% Asian, 0.2% Pacific Islander, and 4.8% from other races. The median household income was $45,000 and the median age was 44.
Conclusion
Mineral, California is a small unincorporated community located in the Sierra Nevada foothills of El Dorado County. It is home to a population of approximately 500 people and is known for its rich history, stunning geography, and vibrant economy. The town is largely based on tourism and agriculture, and is home to several wineries, vineyards, apple orchards, restaurants, shops, and galleries. The area is also known for its stunning views of the Sierra Nevada Mountains and is a popular destination for outdoor activities such as hiking, camping, and fishing.
Common Questions
What is Per Capita Income in Mineral?
Per Capita income in Mineral is $47,827.
What is Inequality or Gini Index in Mineral?
Inequality or Gini Index in Mineral is 0.36.
What is the Total Population of Mineral?
Total Population of Mineral is 77.
What is the Total Male Population of Mineral?
Total Male Population of Mineral is 56.
What is the Total Female Population of Mineral?
Total Female Population of Mineral is 21.
What is the Ratio of Males per 100 Females in Mineral?
There are 266.67 Males per 100 Females in Mineral.
What is the Ratio of Females per 100 Males in Mineral?
There are 37.50 Females per 100 Males in Mineral.
What is the Median Population Age in Mineral?
Median Population Age in Mineral is 48.9 Years.
What is the Average Family Size in Mineral
Average Family Size in Mineral is 2.2 People.
What is the Average Household Size in Mineral
Average Household Size in Mineral is 1.3 People.
How Large is the Labor Force in Mineral?
There are 48 People in the Labor Forcein in Mineral.
What is the Percentage of People in the Labor Force in Mineral?
62.3% of People are in the Labor Force in Mineral.