Cities with the Highest Percentage of Population Employed in Computer, Engineering & Science in New York
RELATED REPORTS & OPTIONS
Computer, Engineering & Science
New York
Compare Cities
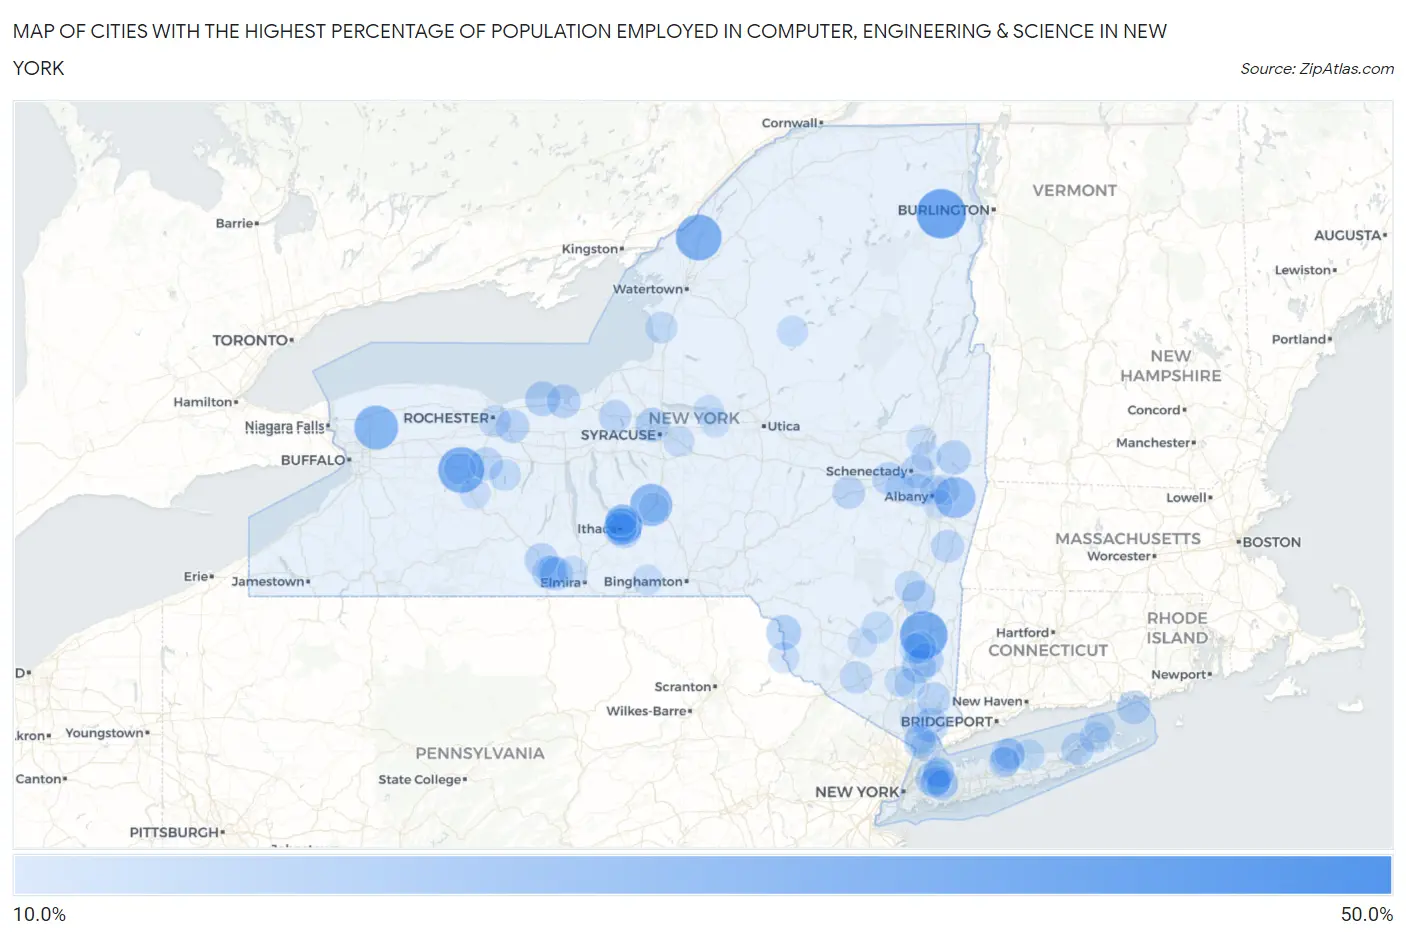
Map of Cities with the Highest Percentage of Population Employed in Computer, Engineering & Science in New York
0.0%
50.0%
Cities with the Highest Percentage of Population Employed in Computer, Engineering & Science in New York
| City | % Employed | vs State | vs National | |
| 1. | North Bay | 45.8% | 5.8%(+39.9)#1 | 6.8%(+39.0)#87 |
| 2. | Au Sable Forks | 36.1% | 5.8%(+30.2)#2 | 6.8%(+29.3)#145 |
| 3. | Pleasant Valley | 33.6% | 5.8%(+27.7)#3 | 6.8%(+26.8)#162 |
| 4. | Haines Falls | 33.3% | 5.8%(+27.5)#4 | 6.8%(+26.6)#163 |
| 5. | Wadsworth | 31.5% | 5.8%(+25.7)#5 | 6.8%(+24.7)#192 |
| 6. | Redwood | 31.1% | 5.8%(+25.2)#6 | 6.8%(+24.3)#202 |
| 7. | Rapids | 28.6% | 5.8%(+22.8)#7 | 6.8%(+21.8)#243 |
| 8. | Rochester Institute Of Technology | 27.5% | 5.8%(+21.6)#8 | 6.8%(+20.7)#273 |
| 9. | Cortland West | 26.3% | 5.8%(+20.5)#9 | 6.8%(+19.6)#302 |
| 10. | Averill Park | 24.8% | 5.8%(+18.9)#10 | 6.8%(+18.0)#340 |
| 11. | Varna | 21.3% | 5.8%(+15.5)#11 | 6.8%(+14.5)#482 |
| 12. | Northeast Ithaca | 20.7% | 5.8%(+14.9)#12 | 6.8%(+13.9)#525 |
| 13. | Clifton Gardens | 19.9% | 5.8%(+14.0)#13 | 6.8%(+13.1)#561 |
| 14. | Forest Home | 19.0% | 5.8%(+13.2)#14 | 6.8%(+12.2)#636 |
| 15. | Saddle Rock Estates | 18.4% | 5.8%(+12.6)#15 | 6.8%(+11.6)#691 |
| 16. | Callicoon | 17.0% | 5.8%(+11.2)#16 | 6.8%(+10.2)#831 |
| 17. | Pultneyville | 16.9% | 5.8%(+11.1)#17 | 6.8%(+10.1)#847 |
| 18. | Liverpool | 16.4% | 5.8%(+10.6)#18 | 6.8%(+9.65)#903 |
| 19. | Merritt Park | 16.4% | 5.8%(+10.6)#19 | 6.8%(+9.61)#911 |
| 20. | Valley Falls | 16.3% | 5.8%(+10.5)#20 | 6.8%(+9.51)#918 |
| 21. | Hopewell Junction | 16.3% | 5.8%(+10.5)#21 | 6.8%(+9.51)#920 |
| 22. | Chappaqua | 16.2% | 5.8%(+10.4)#22 | 6.8%(+9.48)#926 |
| 23. | Westford | 15.9% | 5.8%(+10.1)#23 | 6.8%(+9.14)#972 |
| 24. | East Ithaca | 15.9% | 5.8%(+10.1)#24 | 6.8%(+9.14)#974 |
| 25. | Sodus Point | 15.7% | 5.8%(+9.92)#25 | 6.8%(+8.97)#998 |
| 26. | Otter Lake | 15.6% | 5.8%(+9.74)#26 | 6.8%(+8.79)#1,027 |
| 27. | Campbell | 15.5% | 5.8%(+9.67)#27 | 6.8%(+8.72)#1,038 |
| 28. | Red Hook | 15.4% | 5.8%(+9.62)#28 | 6.8%(+8.67)#1,049 |
| 29. | Niskayuna | 15.4% | 5.8%(+9.59)#29 | 6.8%(+8.64)#1,054 |
| 30. | Gang Mills | 15.4% | 5.8%(+9.58)#30 | 6.8%(+8.63)#1,056 |
| 31. | Fishers Island | 15.4% | 5.8%(+9.57)#31 | 6.8%(+8.62)#1,067 |
| 32. | Fairport | 15.2% | 5.8%(+9.40)#32 | 6.8%(+8.45)#1,098 |
| 33. | Corning | 15.1% | 5.8%(+9.26)#33 | 6.8%(+8.31)#1,121 |
| 34. | Cayuga Heights | 15.0% | 5.8%(+9.19)#34 | 6.8%(+8.24)#1,134 |
| 35. | Shenorock | 15.0% | 5.8%(+9.18)#35 | 6.8%(+8.24)#1,136 |
| 36. | Ithaca | 14.9% | 5.8%(+9.12)#36 | 6.8%(+8.17)#1,154 |
| 37. | Duanesburg | 14.9% | 5.8%(+9.10)#37 | 6.8%(+8.15)#1,158 |
| 38. | South Lima | 14.9% | 5.8%(+9.07)#38 | 6.8%(+8.12)#1,160 |
| 39. | York | 14.9% | 5.8%(+9.04)#39 | 6.8%(+8.09)#1,164 |
| 40. | Poquott | 14.8% | 5.8%(+9.02)#40 | 6.8%(+8.07)#1,169 |
| 41. | Wells Bridge | 14.8% | 5.8%(+8.96)#41 | 6.8%(+8.01)#1,181 |
| 42. | East Frankfort | 14.5% | 5.8%(+8.68)#42 | 6.8%(+7.73)#1,238 |
| 43. | Ghent | 14.4% | 5.8%(+8.63)#43 | 6.8%(+7.68)#1,243 |
| 44. | Cobleskill | 14.4% | 5.8%(+8.57)#44 | 6.8%(+7.62)#1,246 |
| 45. | Westmere | 14.2% | 5.8%(+8.37)#45 | 6.8%(+7.42)#1,290 |
| 46. | New Suffolk | 14.2% | 5.8%(+8.36)#46 | 6.8%(+7.41)#1,293 |
| 47. | Meridian | 14.1% | 5.8%(+8.25)#47 | 6.8%(+7.30)#1,318 |
| 48. | Washington Heights | 14.0% | 5.8%(+8.18)#48 | 6.8%(+7.23)#1,337 |
| 49. | Brighton | 13.8% | 5.8%(+8.03)#49 | 6.8%(+7.08)#1,381 |
| 50. | Titusville | 13.8% | 5.8%(+8.02)#50 | 6.8%(+7.08)#1,383 |
| 51. | Greigsville | 13.6% | 5.8%(+7.82)#51 | 6.8%(+6.87)#1,442 |
| 52. | Irvington | 13.6% | 5.8%(+7.80)#52 | 6.8%(+6.85)#1,451 |
| 53. | Brooktondale | 13.4% | 5.8%(+7.59)#53 | 6.8%(+6.64)#1,519 |
| 54. | Accord | 13.3% | 5.8%(+7.52)#54 | 6.8%(+6.57)#1,534 |
| 55. | Ellisburg | 13.3% | 5.8%(+7.52)#55 | 6.8%(+6.57)#1,536 |
| 56. | Nassau Lake | 13.3% | 5.8%(+7.49)#56 | 6.8%(+6.54)#1,547 |
| 57. | Painted Post | 13.1% | 5.8%(+7.31)#57 | 6.8%(+6.36)#1,592 |
| 58. | Baxter Estates | 13.1% | 5.8%(+7.25)#58 | 6.8%(+6.30)#1,610 |
| 59. | Honeoye | 13.1% | 5.8%(+7.24)#59 | 6.8%(+6.29)#1,611 |
| 60. | Slaterville Springs | 13.0% | 5.8%(+7.23)#60 | 6.8%(+6.28)#1,617 |
| 61. | Saugerties South | 12.7% | 5.8%(+6.93)#61 | 6.8%(+5.98)#1,710 |
| 62. | Shoreham | 12.6% | 5.8%(+6.83)#62 | 6.8%(+5.88)#1,739 |
| 63. | Nelsonville | 12.6% | 5.8%(+6.79)#63 | 6.8%(+5.84)#1,750 |
| 64. | Lansing | 12.6% | 5.8%(+6.79)#64 | 6.8%(+5.84)#1,752 |
| 65. | Searingtown | 12.6% | 5.8%(+6.77)#65 | 6.8%(+5.82)#1,755 |
| 66. | Milton Cdp Saratoga County | 12.6% | 5.8%(+6.76)#66 | 6.8%(+5.81)#1,757 |
| 67. | Hartsdale | 12.4% | 5.8%(+6.62)#67 | 6.8%(+5.67)#1,798 |
| 68. | Swan Lake | 12.4% | 5.8%(+6.55)#68 | 6.8%(+5.61)#1,817 |
| 69. | Spackenkill | 12.3% | 5.8%(+6.50)#69 | 6.8%(+5.55)#1,834 |
| 70. | Shelter Island Heights | 12.3% | 5.8%(+6.50)#70 | 6.8%(+5.55)#1,837 |
| 71. | Old Forge | 12.3% | 5.8%(+6.48)#71 | 6.8%(+5.53)#1,842 |
| 72. | Manlius | 12.2% | 5.8%(+6.42)#72 | 6.8%(+5.47)#1,864 |
| 73. | Stony Brook | 12.1% | 5.8%(+6.29)#73 | 6.8%(+5.34)#1,914 |
| 74. | Narrowsburg | 12.1% | 5.8%(+6.27)#74 | 6.8%(+5.32)#1,918 |
| 75. | Firthcliffe | 11.9% | 5.8%(+6.12)#75 | 6.8%(+5.17)#1,963 |
| 76. | Big Flats | 11.9% | 5.8%(+6.12)#76 | 6.8%(+5.17)#1,965 |
| 77. | Crest View Heights | 11.8% | 5.8%(+5.94)#77 | 6.8%(+4.99)#2,029 |
| 78. | Owego | 11.7% | 5.8%(+5.93)#78 | 6.8%(+4.98)#2,030 |
| 79. | Herricks | 11.7% | 5.8%(+5.90)#79 | 6.8%(+4.95)#2,040 |
| 80. | Port Washington North | 11.6% | 5.8%(+5.81)#80 | 6.8%(+4.86)#2,059 |
| 81. | Groveland Station | 11.6% | 5.8%(+5.78)#81 | 6.8%(+4.83)#2,071 |
| 82. | Belle Terre | 11.6% | 5.8%(+5.77)#82 | 6.8%(+4.82)#2,073 |
| 83. | Tarrytown | 11.5% | 5.8%(+5.68)#83 | 6.8%(+4.73)#2,119 |
| 84. | Orient | 11.3% | 5.8%(+5.52)#84 | 6.8%(+4.58)#2,207 |
| 85. | Croton On Hudson | 11.3% | 5.8%(+5.44)#85 | 6.8%(+4.50)#2,238 |
| 86. | New Hackensack | 11.3% | 5.8%(+5.44)#86 | 6.8%(+4.49)#2,240 |
| 87. | Sylvan Beach | 11.2% | 5.8%(+5.41)#87 | 6.8%(+4.46)#2,261 |
| 88. | Wynantskill | 11.2% | 5.8%(+5.38)#88 | 6.8%(+4.43)#2,271 |
| 89. | University Gardens | 11.2% | 5.8%(+5.36)#89 | 6.8%(+4.41)#2,279 |
| 90. | Macdonnell Heights | 11.2% | 5.8%(+5.35)#90 | 6.8%(+4.41)#2,282 |
| 91. | Munsons Corners | 11.2% | 5.8%(+5.35)#91 | 6.8%(+4.41)#2,283 |
| 92. | Menands | 11.1% | 5.8%(+5.28)#92 | 6.8%(+4.33)#2,329 |
| 93. | Altamont | 11.1% | 5.8%(+5.25)#93 | 6.8%(+4.30)#2,345 |
| 94. | Stony Brook University | 11.1% | 5.8%(+5.24)#94 | 6.8%(+4.29)#2,349 |
| 95. | Ellenville | 11.0% | 5.8%(+5.15)#95 | 6.8%(+4.20)#2,388 |
| 96. | East Greenbush | 11.0% | 5.8%(+5.15)#96 | 6.8%(+4.20)#2,391 |
| 97. | Thomaston | 10.9% | 5.8%(+5.05)#97 | 6.8%(+4.10)#2,438 |
| 98. | Durhamville | 10.9% | 5.8%(+5.04)#98 | 6.8%(+4.09)#2,442 |
| 99. | Ballston Spa | 10.8% | 5.8%(+5.02)#99 | 6.8%(+4.07)#2,452 |
| 100. | Country Knolls | 10.8% | 5.8%(+4.98)#100 | 6.8%(+4.03)#2,469 |
Common Questions
What are the Top 10 Cities with the Highest Percentage of Population Employed in Computer, Engineering & Science in New York?
Top 10 Cities with the Highest Percentage of Population Employed in Computer, Engineering & Science in New York are:
#1
36.1%
#2
33.6%
#3
31.5%
#4
31.1%
#5
28.6%
#6
26.3%
#7
24.8%
#8
20.7%
#9
19.0%
#10
18.4%
What city has the Highest Percentage of Population Employed in Computer, Engineering & Science in New York?
Au Sable Forks has the Highest Percentage of Population Employed in Computer, Engineering & Science in New York with 36.1%.
What is the Percentage of Population Employed in Computer, Engineering & Science in the State of New York?
Percentage of Population Employed in Computer, Engineering & Science in New York is 5.8%.
What is the Percentage of Population Employed in Computer, Engineering & Science in the United States?
Percentage of Population Employed in Computer, Engineering & Science in the United States is 6.8%.