Emeryville, CA Map & Demographics
Emeryville Map
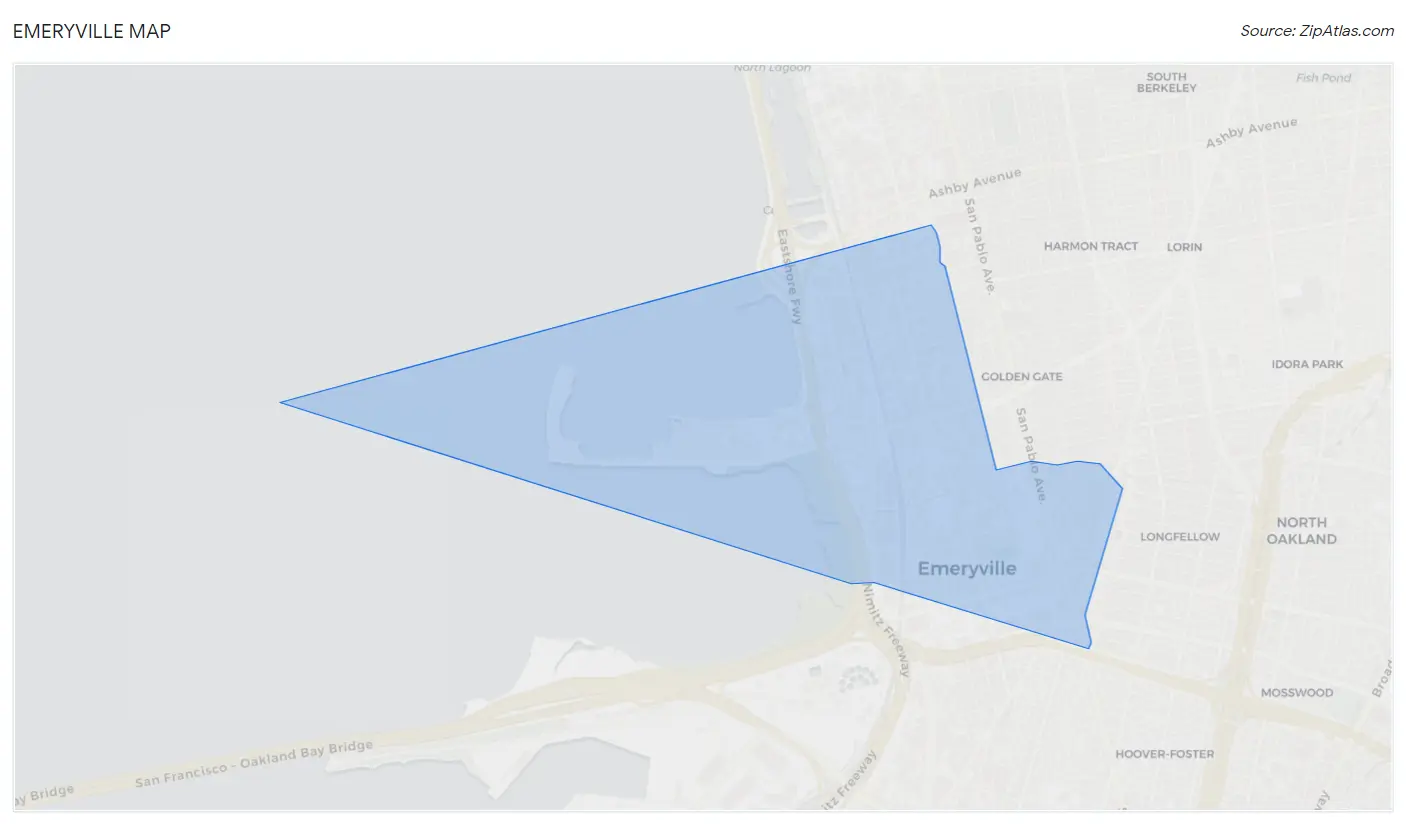
Emeryville Overview
$83,173
PER CAPITA INCOME
$168,813
AVG FAMILY INCOME
$114,345
AVG HOUSEHOLD INCOME
21.5%
WAGE / INCOME GAP [ % ]
78.5¢/ $1
WAGE / INCOME GAP [ $ ]
0.44
INEQUALITY / GINI INDEX
12,840
TOTAL POPULATION
6,339
MALE POPULATION
6,501
FEMALE POPULATION
97.51
MALES / 100 FEMALES
102.56
FEMALES / 100 MALES
35.8
MEDIAN AGE
2.5
AVG FAMILY SIZE
1.8
AVG HOUSEHOLD SIZE
9,209
LABOR FORCE [ PEOPLE ]
77.3%
PERCENT IN LABOR FORCE
4.9%
UNEMPLOYMENT RATE
Emeryville Zip Codes
Emeryville Area Codes
Income in Emeryville
Income Overview in Emeryville
Per Capita Income in Emeryville is $83,173, while median incomes of families and households are $168,813 and $114,345 respectively.
| Characteristic | Number | Measure |
| Per Capita Income | 12,840 | $83,173 |
| Median Family Income | 2,311 | $168,813 |
| Mean Family Income | 2,311 | $193,331 |
| Median Household Income | 7,233 | $114,345 |
| Mean Household Income | 7,233 | $144,869 |
| Income Deficit | 2,311 | $0 |
| Wage / Income Gap (%) | 12,840 | 21.46% |
| Wage / Income Gap ($) | 12,840 | 78.54¢ per $1 |
| Gini / Inequality Index | 12,840 | 0.44 |
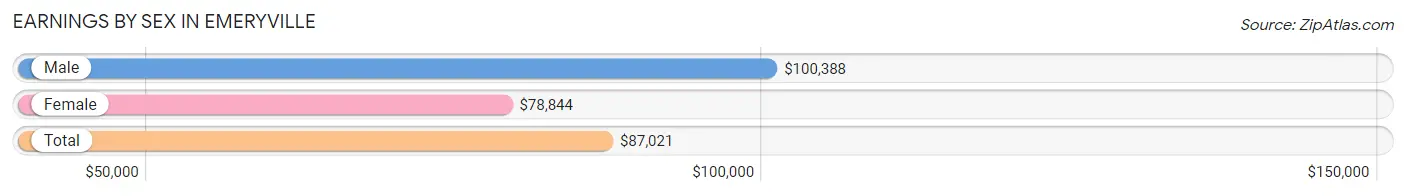
Earnings by Sex in Emeryville
Average Earnings in Emeryville are $87,021, $100,388 for men and $78,844 for women, a difference of 21.5%.
| Sex | Number | Average Earnings |
| Male | 4,723 (49.9%) | $100,388 |
| Female | 4,736 (50.1%) | $78,844 |
| Total | 9,459 (100.0%) | $87,021 |
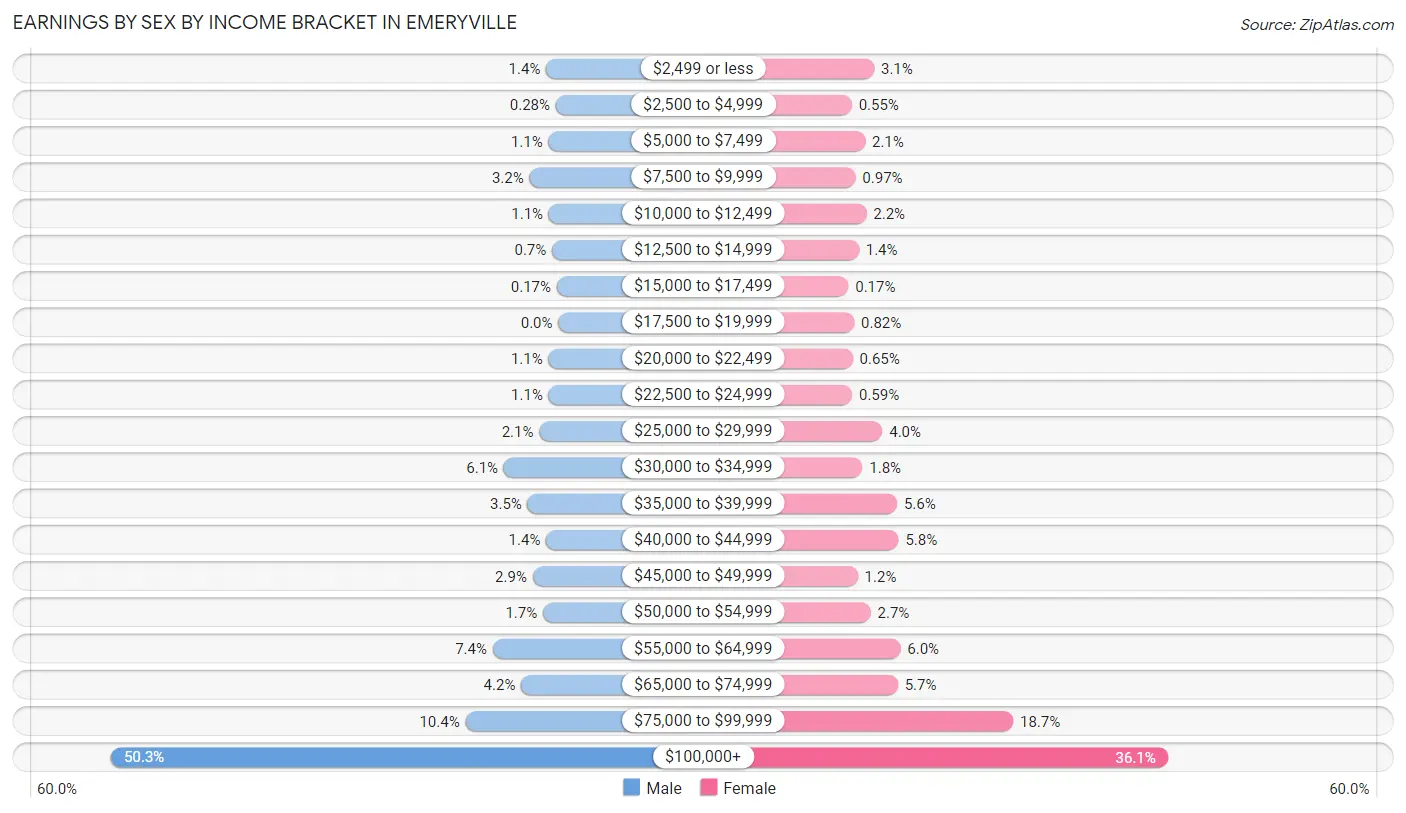
Earnings by Sex by Income Bracket in Emeryville
The most common earnings brackets in Emeryville are $100,000+ for men (2,375 | 50.3%) and $100,000+ for women (1,708 | 36.1%).
| Income | Male | Female |
| $2,499 or less | 64 (1.4%) | 145 (3.1%) |
| $2,500 to $4,999 | 13 (0.3%) | 26 (0.5%) |
| $5,000 to $7,499 | 52 (1.1%) | 97 (2.1%) |
| $7,500 to $9,999 | 153 (3.2%) | 46 (1.0%) |
| $10,000 to $12,499 | 50 (1.1%) | 104 (2.2%) |
| $12,500 to $14,999 | 33 (0.7%) | 64 (1.3%) |
| $15,000 to $17,499 | 8 (0.2%) | 8 (0.2%) |
| $17,500 to $19,999 | 0 (0.0%) | 39 (0.8%) |
| $20,000 to $22,499 | 52 (1.1%) | 31 (0.6%) |
| $22,500 to $24,999 | 51 (1.1%) | 28 (0.6%) |
| $25,000 to $29,999 | 101 (2.1%) | 189 (4.0%) |
| $30,000 to $34,999 | 289 (6.1%) | 83 (1.8%) |
| $35,000 to $39,999 | 163 (3.5%) | 267 (5.6%) |
| $40,000 to $44,999 | 64 (1.4%) | 275 (5.8%) |
| $45,000 to $49,999 | 136 (2.9%) | 58 (1.2%) |
| $50,000 to $54,999 | 81 (1.7%) | 127 (2.7%) |
| $55,000 to $64,999 | 348 (7.4%) | 285 (6.0%) |
| $65,000 to $74,999 | 197 (4.2%) | 271 (5.7%) |
| $75,000 to $99,999 | 493 (10.4%) | 885 (18.7%) |
| $100,000+ | 2,375 (50.3%) | 1,708 (36.1%) |
| Total | 4,723 (100.0%) | 4,736 (100.0%) |
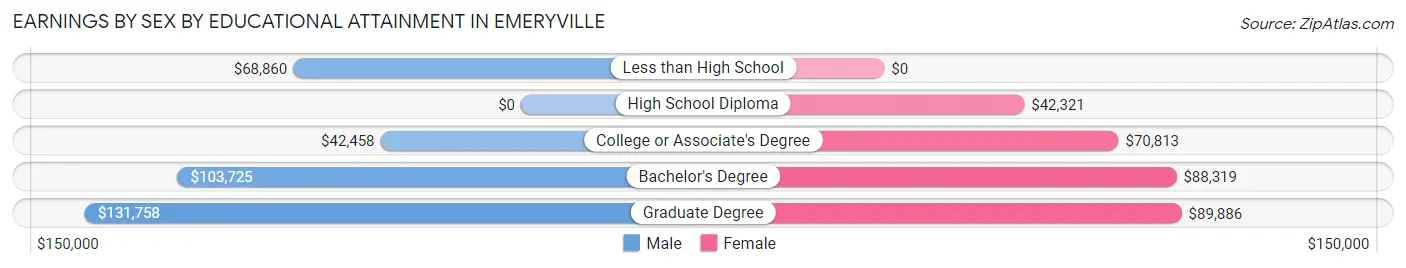
Earnings by Sex by Educational Attainment in Emeryville
Average earnings in Emeryville are $102,825 for men and $84,719 for women, a difference of 17.6%. Men with an educational attainment of graduate degree enjoy the highest average annual earnings of $131,758, while those with college or associate's degree education earn the least with $42,458. Women with an educational attainment of graduate degree earn the most with the average annual earnings of $89,886, while those with high school diploma education have the smallest earnings of $42,321.
| Educational Attainment | Male Income | Female Income |
| Less than High School | $68,860 | $0 |
| High School Diploma | - | - |
| College or Associate's Degree | $42,458 | $70,813 |
| Bachelor's Degree | $103,725 | $88,319 |
| Graduate Degree | $131,758 | $89,886 |
| Total | $102,825 | $84,719 |
Family Income in Emeryville
Family Income Brackets in Emeryville
According to the Emeryville family income data, there are 1,003 families falling into the $200,000+ income range, which is the most common income bracket and makes up 43.4% of all families. Conversely, the $10,000 to $14,999 income bracket is the least frequent group with only 12 families (0.5%) belonging to this category.
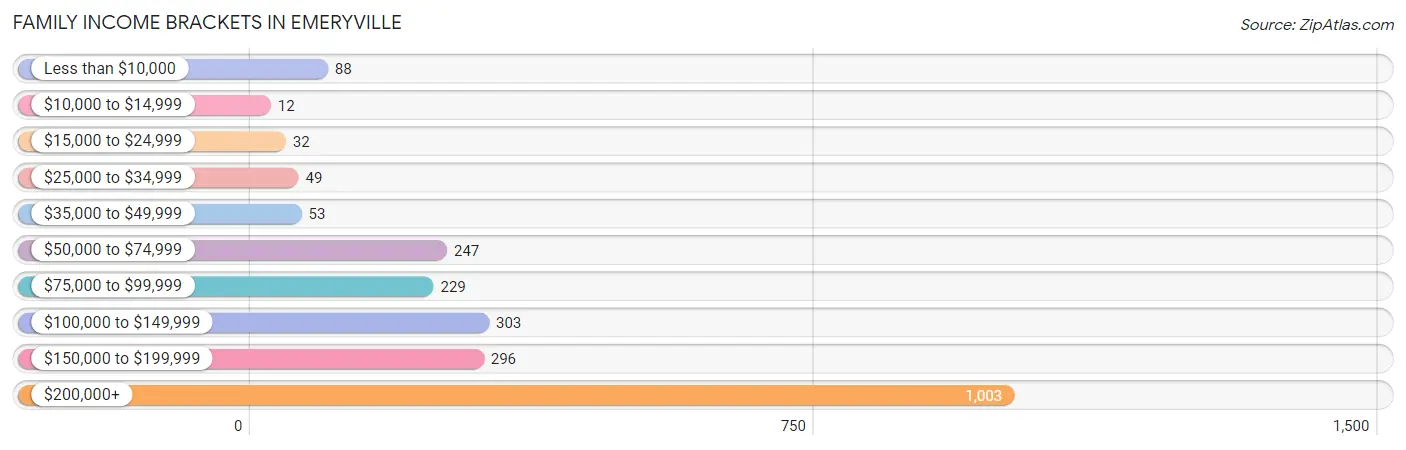
| Income Bracket | # Families | % Families |
| Less than $10,000 | 88 | 3.8% |
| $10,000 to $14,999 | 12 | 0.5% |
| $15,000 to $24,999 | 32 | 1.4% |
| $25,000 to $34,999 | 49 | 2.1% |
| $35,000 to $49,999 | 53 | 2.3% |
| $50,000 to $74,999 | 247 | 10.7% |
| $75,000 to $99,999 | 229 | 9.9% |
| $100,000 to $149,999 | 303 | 13.1% |
| $150,000 to $199,999 | 296 | 12.8% |
| $200,000+ | 1,003 | 43.4% |
Family Income by Famaliy Size in Emeryville
3-person families (585 | 25.3%) account for the highest median family income in Emeryville with $172,917 per family, while 2-person families (1,572 | 68.0%) have the highest median income of $85,216 per family member.
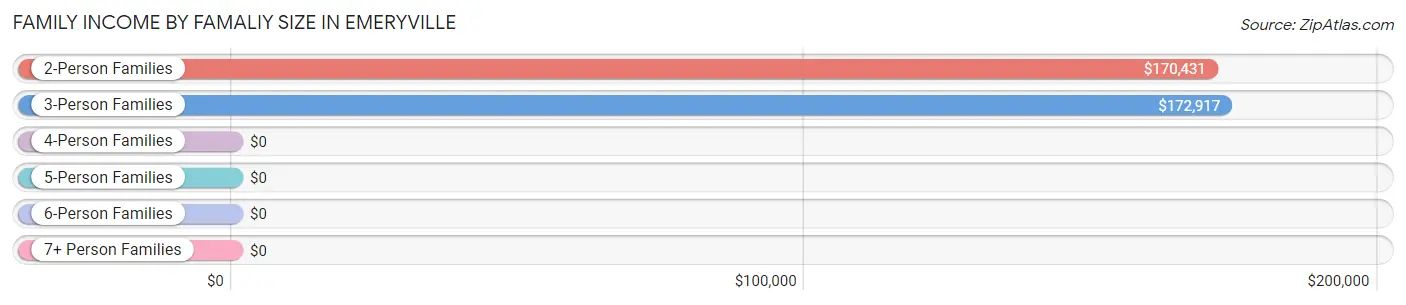
| Income Bracket | # Families | Median Income |
| 2-Person Families | 1,572 (68.0%) | $170,431 |
| 3-Person Families | 585 (25.3%) | $172,917 |
| 4-Person Families | 110 (4.8%) | $0 |
| 5-Person Families | 27 (1.2%) | $0 |
| 6-Person Families | 11 (0.5%) | $0 |
| 7+ Person Families | 6 (0.3%) | $0 |
| Total | 2,311 (100.0%) | $168,813 |
Family Income by Number of Earners in Emeryville
The median family income in Emeryville is $168,813, with families comprising 2 earners (1,298) having the highest median family income of $231,696, while families with no earners (83) have the lowest median family income of $38,083, accounting for 56.2% and 3.6% of families, respectively.
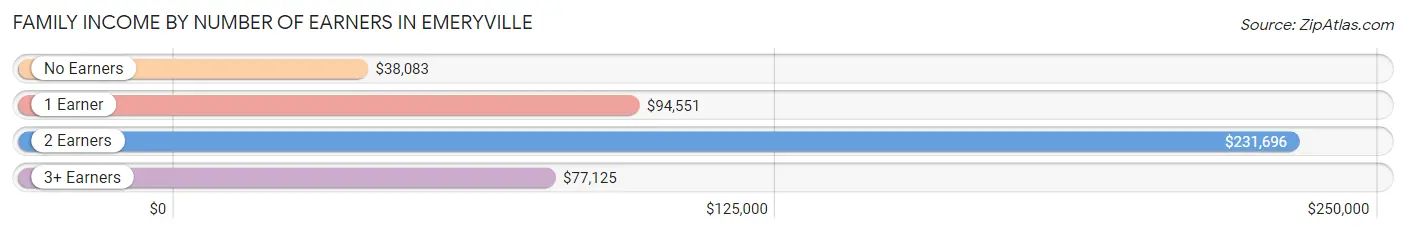
| Number of Earners | # Families | Median Income |
| No Earners | 83 (3.6%) | $38,083 |
| 1 Earner | 867 (37.5%) | $94,551 |
| 2 Earners | 1,298 (56.2%) | $231,696 |
| 3+ Earners | 63 (2.7%) | $77,125 |
| Total | 2,311 (100.0%) | $168,813 |
Household Income in Emeryville
Household Income Brackets in Emeryville
With 2,018 households falling in the category, the $200,000+ income range is the most frequent in Emeryville, accounting for 27.9% of all households. In contrast, only 203 households (2.8%) fall into the $10,000 to $14,999 income bracket, making it the least populous group.
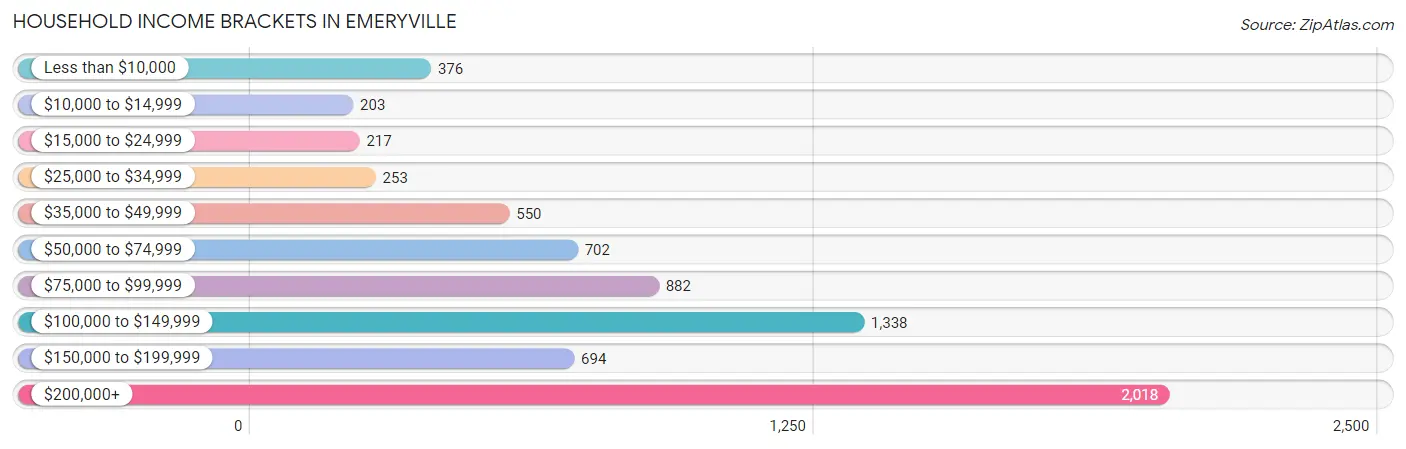
| Income Bracket | # Households | % Households |
| Less than $10,000 | 376 | 5.2% |
| $10,000 to $14,999 | 203 | 2.8% |
| $15,000 to $24,999 | 217 | 3.0% |
| $25,000 to $34,999 | 253 | 3.5% |
| $35,000 to $49,999 | 550 | 7.6% |
| $50,000 to $74,999 | 702 | 9.7% |
| $75,000 to $99,999 | 882 | 12.2% |
| $100,000 to $149,999 | 1,338 | 18.5% |
| $150,000 to $199,999 | 694 | 9.6% |
| $200,000+ | 2,018 | 27.9% |
Household Income by Householder Age in Emeryville
The median household income in Emeryville is $114,345, with the highest median household income of $138,373 found in the 25 to 44 years age bracket for the primary householder. A total of 4,165 households (57.6%) fall into this category. Meanwhile, the 65+ years age bracket for the primary householder has the lowest median household income of $69,167, with 1,066 households (14.7%) in this group.
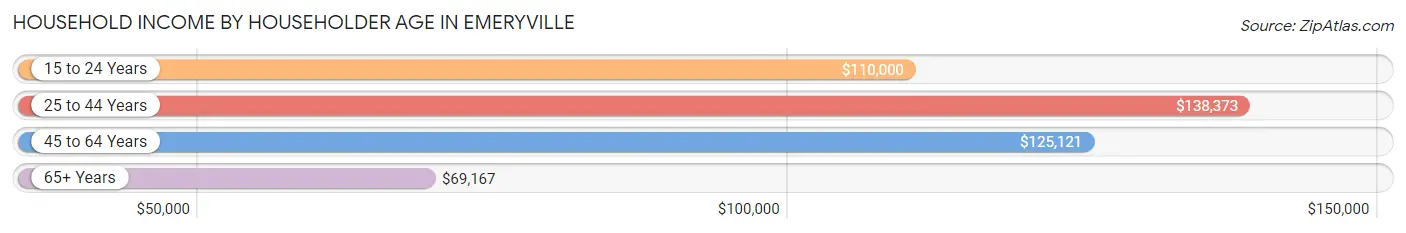
| Income Bracket | # Households | Median Income |
| 15 to 24 Years | 350 (4.8%) | $110,000 |
| 25 to 44 Years | 4,165 (57.6%) | $138,373 |
| 45 to 64 Years | 1,652 (22.8%) | $125,121 |
| 65+ Years | 1,066 (14.7%) | $69,167 |
| Total | 7,233 (100.0%) | $114,345 |
Poverty in Emeryville
Income Below Poverty by Sex and Age in Emeryville
With 11.8% poverty level for males and 12.4% for females among the residents of Emeryville, 18 to 24 year old males and 5 year old females are the most vulnerable to poverty, with 207 males (37.8%) and 7 females (100.0%) in their respective age groups living below the poverty level.
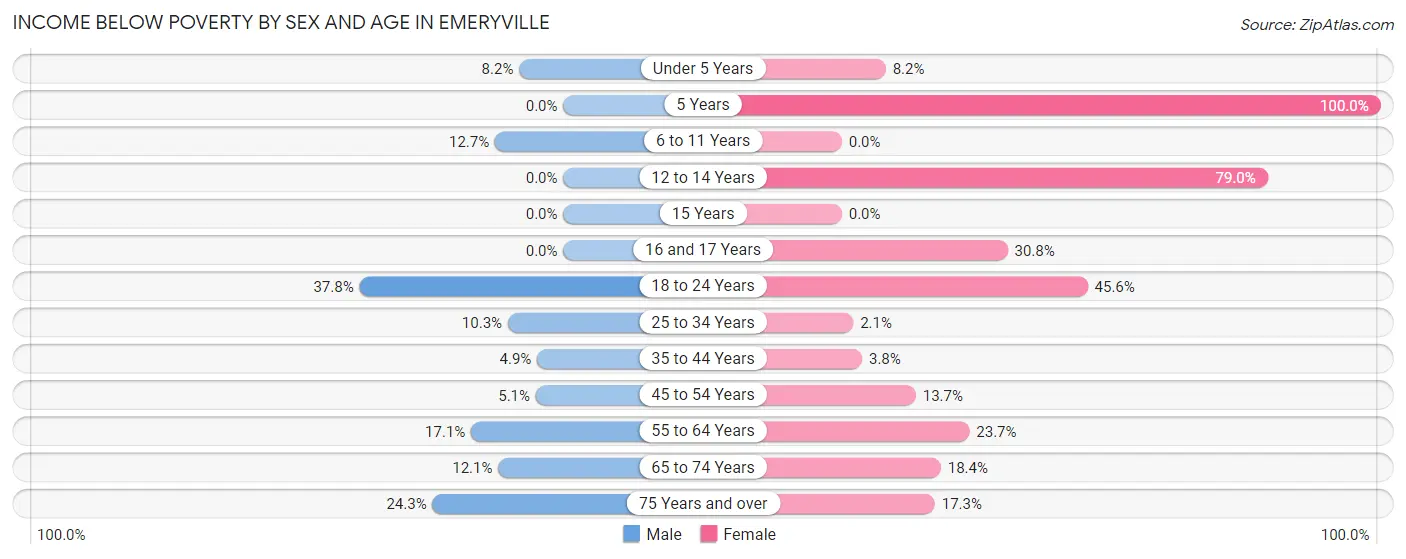
| Age Bracket | Male | Female |
| Under 5 Years | 19 (8.2%) | 20 (8.2%) |
| 5 Years | 0 (0.0%) | 7 (100.0%) |
| 6 to 11 Years | 26 (12.7%) | 0 (0.0%) |
| 12 to 14 Years | 0 (0.0%) | 49 (79.0%) |
| 15 Years | 0 (0.0%) | 0 (0.0%) |
| 16 and 17 Years | 0 (0.0%) | 20 (30.8%) |
| 18 to 24 Years | 207 (37.8%) | 235 (45.6%) |
| 25 to 34 Years | 195 (10.3%) | 48 (2.1%) |
| 35 to 44 Years | 73 (4.9%) | 43 (3.8%) |
| 45 to 54 Years | 37 (5.1%) | 93 (13.7%) |
| 55 to 64 Years | 83 (17.1%) | 130 (23.7%) |
| 65 to 74 Years | 42 (12.1%) | 107 (18.4%) |
| 75 Years and over | 68 (24.3%) | 57 (17.3%) |
| Total | 750 (11.8%) | 809 (12.4%) |
Income Above Poverty by Sex and Age in Emeryville
According to the poverty statistics in Emeryville, males aged 5 years and females aged 6 to 11 years are the age groups that are most secure financially, with 100.0% of males and 100.0% of females in these age groups living above the poverty line.
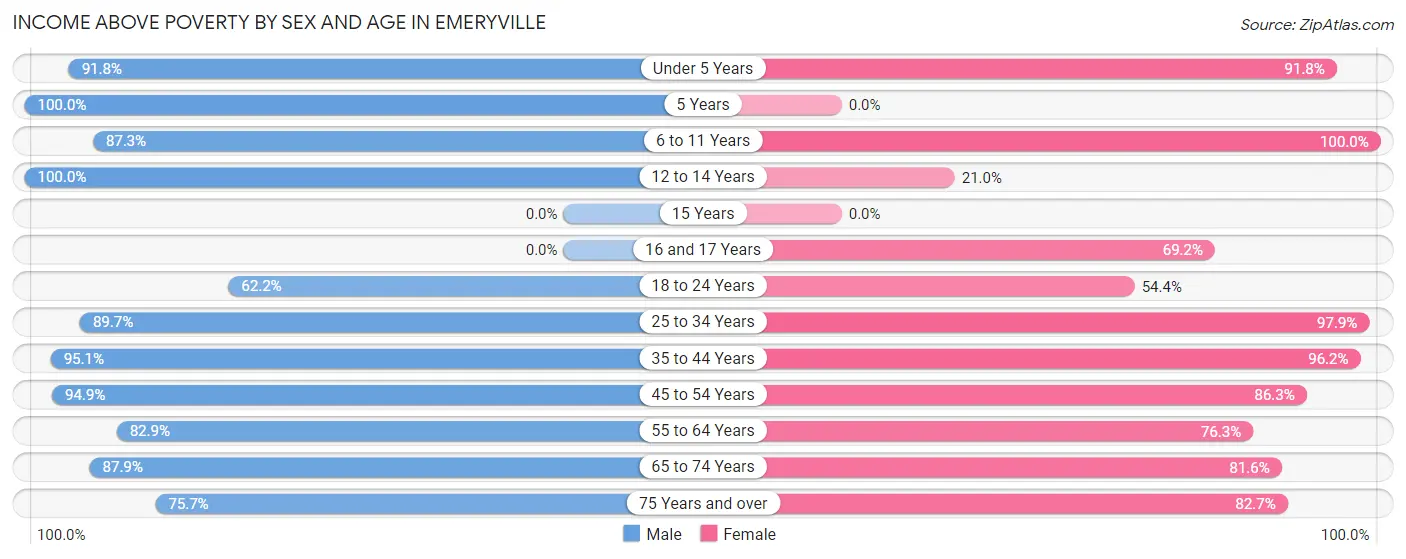
| Age Bracket | Male | Female |
| Under 5 Years | 213 (91.8%) | 225 (91.8%) |
| 5 Years | 60 (100.0%) | 0 (0.0%) |
| 6 to 11 Years | 179 (87.3%) | 58 (100.0%) |
| 12 to 14 Years | 47 (100.0%) | 13 (21.0%) |
| 15 Years | 0 (0.0%) | 0 (0.0%) |
| 16 and 17 Years | 0 (0.0%) | 45 (69.2%) |
| 18 to 24 Years | 340 (62.2%) | 280 (54.4%) |
| 25 to 34 Years | 1,700 (89.7%) | 2,220 (97.9%) |
| 35 to 44 Years | 1,430 (95.1%) | 1,100 (96.2%) |
| 45 to 54 Years | 689 (94.9%) | 584 (86.3%) |
| 55 to 64 Years | 402 (82.9%) | 419 (76.3%) |
| 65 to 74 Years | 306 (87.9%) | 475 (81.6%) |
| 75 Years and over | 212 (75.7%) | 273 (82.7%) |
| Total | 5,578 (88.1%) | 5,692 (87.6%) |
Income Below Poverty Among Married-Couple Families in Emeryville
The poverty statistics for married-couple families in Emeryville show that 6.8% or 113 of the total 1,660 families live below the poverty line. Families with 1 or 2 children have the highest poverty rate of 10.4%, comprising of 42 families. On the other hand, families with 3 or 4 children have the lowest poverty rate of 0.0%, which includes 0 families.
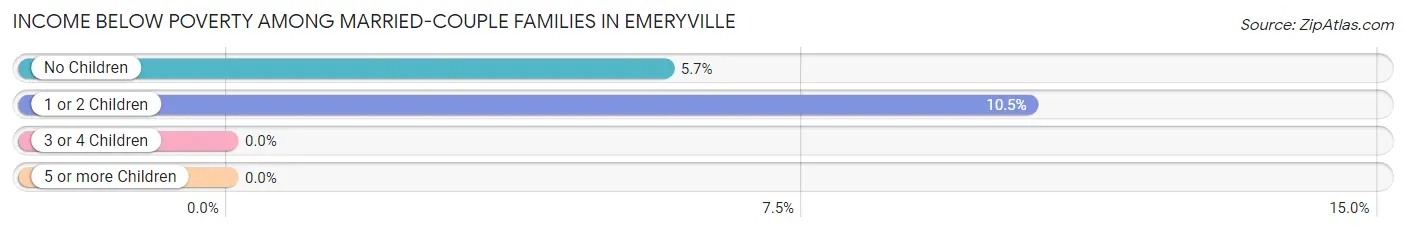
| Children | Above Poverty | Below Poverty |
| No Children | 1,176 (94.3%) | 71 (5.7%) |
| 1 or 2 Children | 360 (89.5%) | 42 (10.4%) |
| 3 or 4 Children | 11 (100.0%) | 0 (0.0%) |
| 5 or more Children | 0 (0.0%) | 0 (0.0%) |
| Total | 1,547 (93.2%) | 113 (6.8%) |
Income Below Poverty Among Single-Parent Households in Emeryville
According to the poverty data in Emeryville, 10.8% or 26 single-father households and 5.9% or 24 single-mother households are living below the poverty line. Among single-father households, those with no children have the highest poverty rate, with 18 households (12.3%) experiencing poverty. Likewise, among single-mother households, those with 3 or 4 children have the highest poverty rate, with 16 households (100.0%) falling below the poverty line.
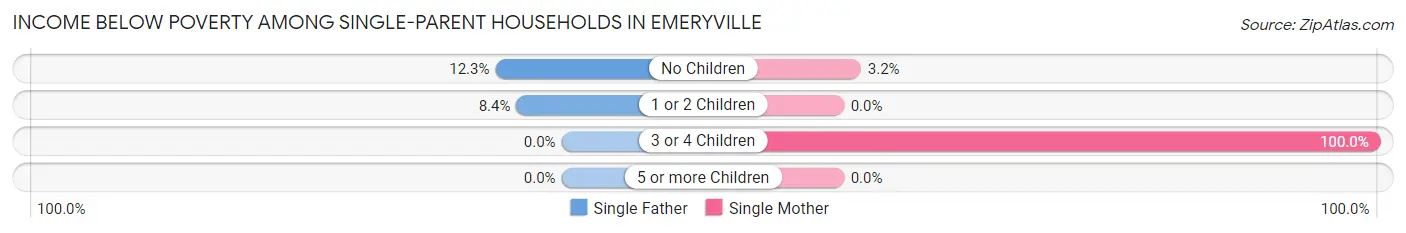
| Children | Single Father | Single Mother |
| No Children | 18 (12.3%) | 8 (3.2%) |
| 1 or 2 Children | 8 (8.4%) | 0 (0.0%) |
| 3 or 4 Children | 0 (0.0%) | 16 (100.0%) |
| 5 or more Children | 0 (0.0%) | 0 (0.0%) |
| Total | 26 (10.8%) | 24 (5.9%) |
Income Below Poverty Among Married-Couple vs Single-Parent Households in Emeryville
The poverty data for Emeryville shows that 113 of the married-couple family households (6.8%) and 50 of the single-parent households (7.7%) are living below the poverty level. Within the married-couple family households, those with 1 or 2 children have the highest poverty rate, with 42 households (10.4%) falling below the poverty line. Among the single-parent households, those with 3 or 4 children have the highest poverty rate, with 16 household (100.0%) living below poverty.
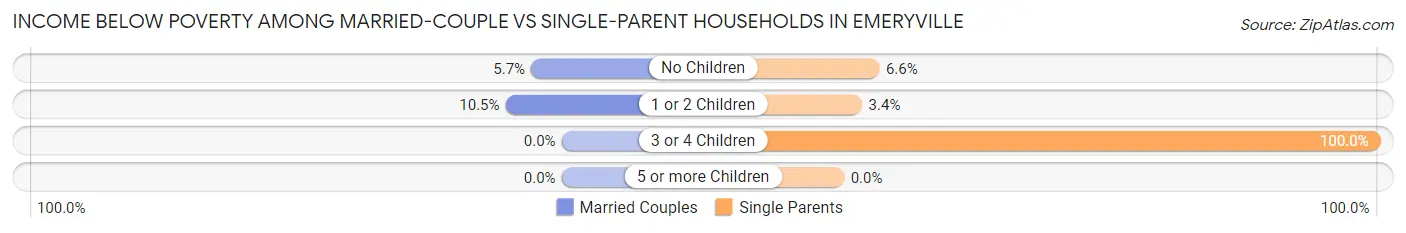
| Children | Married-Couple Families | Single-Parent Households |
| No Children | 71 (5.7%) | 26 (6.6%) |
| 1 or 2 Children | 42 (10.4%) | 8 (3.4%) |
| 3 or 4 Children | 0 (0.0%) | 16 (100.0%) |
| 5 or more Children | 0 (0.0%) | 0 (0.0%) |
| Total | 113 (6.8%) | 50 (7.7%) |
Race in Emeryville
The most populous races in Emeryville are White / Caucasian (5,092 | 39.7%), Asian (3,896 | 30.3%), and Black / African American (2,267 | 17.7%).
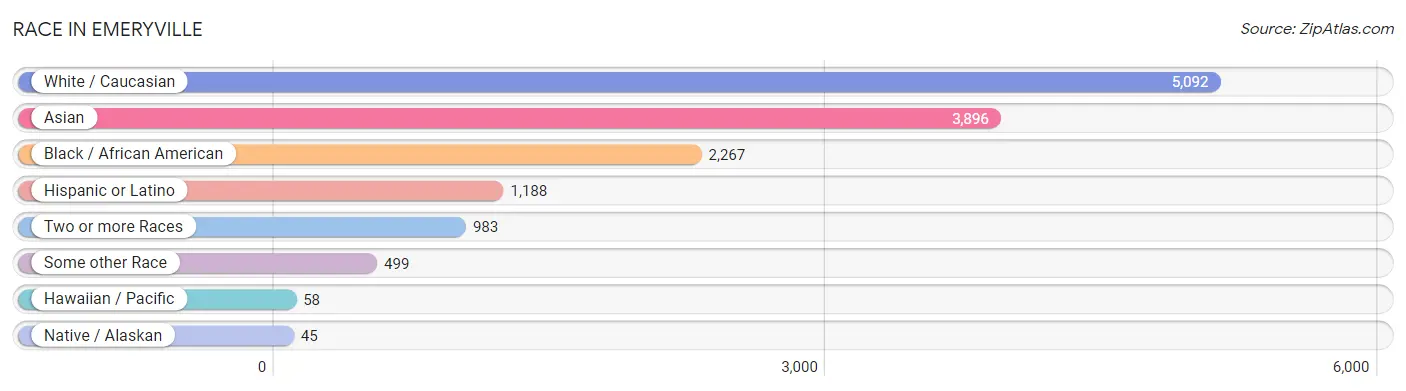
| Race | # Population | % Population |
| Asian | 3,896 | 30.3% |
| Black / African American | 2,267 | 17.7% |
| Hawaiian / Pacific | 58 | 0.4% |
| Hispanic or Latino | 1,188 | 9.2% |
| Native / Alaskan | 45 | 0.4% |
| White / Caucasian | 5,092 | 39.7% |
| Two or more Races | 983 | 7.7% |
| Some other Race | 499 | 3.9% |
| Total | 12,840 | 100.0% |
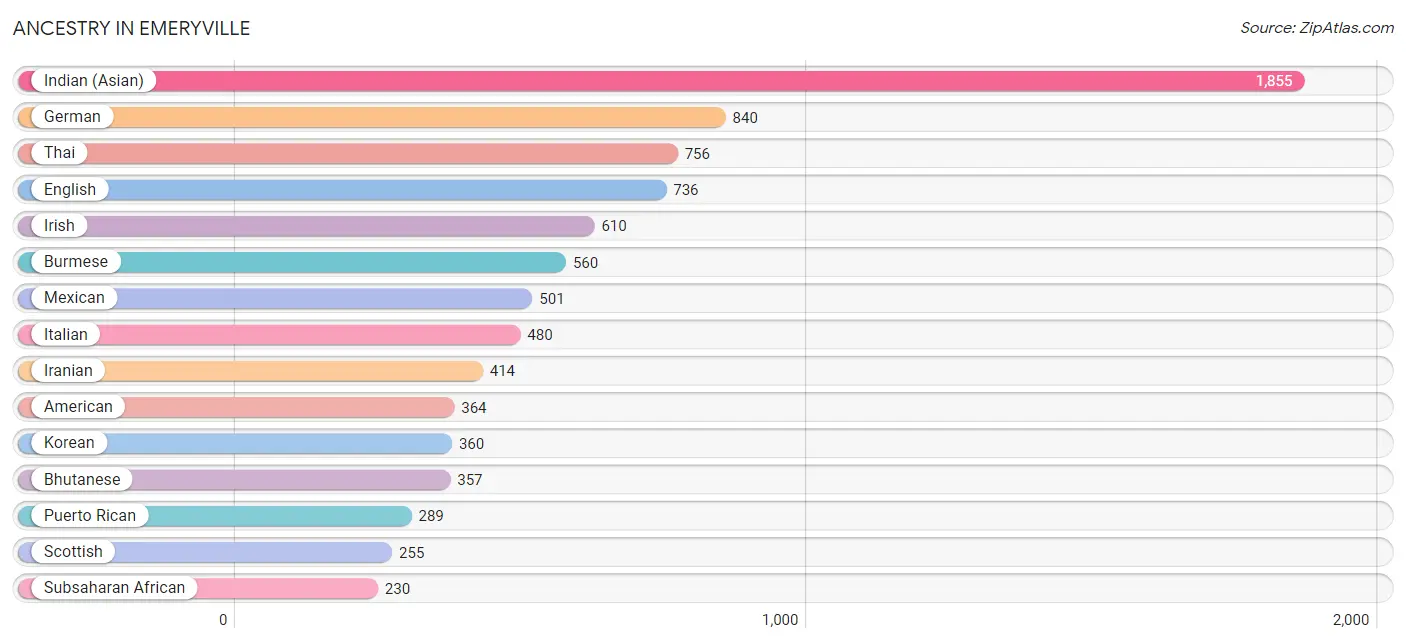
Ancestry in Emeryville
The most populous ancestries reported in Emeryville are Indian (Asian) (1,855 | 14.4%), German (840 | 6.5%), Thai (756 | 5.9%), English (736 | 5.7%), and Irish (610 | 4.8%), together accounting for 37.4% of all Emeryville residents.
| Ancestry | # Population | % Population |
| African | 31 | 0.2% |
| American | 364 | 2.8% |
| Arab | 106 | 0.8% |
| Austrian | 156 | 1.2% |
| Bangladeshi | 10 | 0.1% |
| Basque | 6 | 0.1% |
| Belgian | 22 | 0.2% |
| Belizean | 20 | 0.2% |
| Bhutanese | 357 | 2.8% |
| Blackfeet | 8 | 0.1% |
| British | 108 | 0.8% |
| Burmese | 560 | 4.4% |
| Canadian | 29 | 0.2% |
| Celtic | 10 | 0.1% |
| Central American | 159 | 1.2% |
| Cherokee | 20 | 0.2% |
| Colombian | 73 | 0.6% |
| Costa Rican | 7 | 0.1% |
| Cuban | 9 | 0.1% |
| Czech | 37 | 0.3% |
| Czechoslovakian | 28 | 0.2% |
| Danish | 98 | 0.8% |
| Dominican | 9 | 0.1% |
| Dutch | 157 | 1.2% |
| Eastern European | 40 | 0.3% |
| Ecuadorian | 15 | 0.1% |
| Egyptian | 8 | 0.1% |
| English | 736 | 5.7% |
| Ethiopian | 136 | 1.1% |
| European | 122 | 0.9% |
| Filipino | 160 | 1.3% |
| Finnish | 8 | 0.1% |
| French | 144 | 1.1% |
| French Canadian | 35 | 0.3% |
| German | 840 | 6.5% |
| German Russian | 7 | 0.1% |
| Ghanaian | 63 | 0.5% |
| Greek | 47 | 0.4% |
| Guamanian / Chamorro | 8 | 0.1% |
| Guatemalan | 60 | 0.5% |
| Haitian | 64 | 0.5% |
| Hungarian | 188 | 1.5% |
| Indian (Asian) | 1,855 | 14.4% |
| Iranian | 414 | 3.2% |
| Irish | 610 | 4.8% |
| Israeli | 4 | 0.0% |
| Italian | 480 | 3.7% |
| Jamaican | 106 | 0.8% |
| Jordanian | 11 | 0.1% |
| Korean | 360 | 2.8% |
| Laotian | 48 | 0.4% |
| Lithuanian | 60 | 0.5% |
| Mexican | 501 | 3.9% |
| Mexican American Indian | 26 | 0.2% |
| Native Hawaiian | 96 | 0.7% |
| Navajo | 5 | 0.0% |
| Nicaraguan | 24 | 0.2% |
| Northern European | 96 | 0.7% |
| Norwegian | 87 | 0.7% |
| Pakistani | 48 | 0.4% |
| Panamanian | 9 | 0.1% |
| Pennsylvania German | 9 | 0.1% |
| Peruvian | 20 | 0.2% |
| Polish | 193 | 1.5% |
| Portuguese | 58 | 0.4% |
| Puerto Rican | 289 | 2.2% |
| Romanian | 86 | 0.7% |
| Russian | 149 | 1.2% |
| Salvadoran | 59 | 0.5% |
| Scandinavian | 10 | 0.1% |
| Scotch-Irish | 72 | 0.6% |
| Scottish | 255 | 2.0% |
| Sioux | 34 | 0.3% |
| Slavic | 27 | 0.2% |
| Slovene | 9 | 0.1% |
| South American | 127 | 1.0% |
| Spaniard | 19 | 0.2% |
| Spanish | 37 | 0.3% |
| Sri Lankan | 195 | 1.5% |
| Subsaharan African | 230 | 1.8% |
| Swedish | 129 | 1.0% |
| Swiss | 25 | 0.2% |
| Thai | 756 | 5.9% |
| Tongan | 67 | 0.5% |
| Trinidadian and Tobagonian | 8 | 0.1% |
| Turkish | 34 | 0.3% |
| Ukrainian | 89 | 0.7% |
| Venezuelan | 19 | 0.2% |
| Welsh | 73 | 0.6% |
| Yugoslavian | 6 | 0.1% | View All 90 Rows |
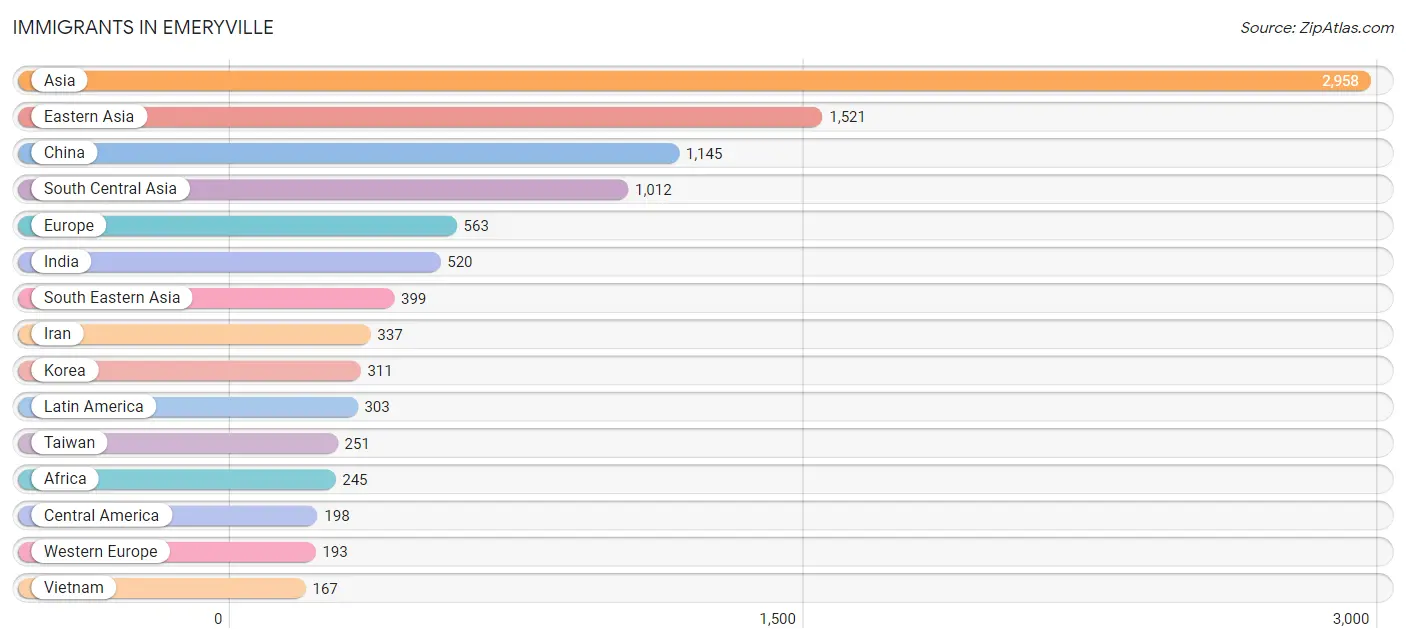
Immigrants in Emeryville
The most numerous immigrant groups reported in Emeryville came from Asia (2,958 | 23.0%), Eastern Asia (1,521 | 11.8%), China (1,145 | 8.9%), South Central Asia (1,012 | 7.9%), and Europe (563 | 4.4%), together accounting for 56.1% of all Emeryville residents.
| Immigration Origin | # Population | % Population |
| Africa | 245 | 1.9% |
| Argentina | 9 | 0.1% |
| Asia | 2,958 | 23.0% |
| Bosnia and Herzegovina | 6 | 0.1% |
| Canada | 129 | 1.0% |
| Caribbean | 26 | 0.2% |
| Central America | 198 | 1.5% |
| China | 1,145 | 8.9% |
| Colombia | 8 | 0.1% |
| Eastern Africa | 142 | 1.1% |
| Eastern Asia | 1,521 | 11.8% |
| Eastern Europe | 140 | 1.1% |
| Ecuador | 15 | 0.1% |
| England | 19 | 0.2% |
| Eritrea | 11 | 0.1% |
| Ethiopia | 103 | 0.8% |
| Europe | 563 | 4.4% |
| France | 88 | 0.7% |
| Germany | 86 | 0.7% |
| Ghana | 63 | 0.5% |
| Greece | 8 | 0.1% |
| Guatemala | 35 | 0.3% |
| Hong Kong | 41 | 0.3% |
| Hungary | 34 | 0.3% |
| India | 520 | 4.1% |
| Indonesia | 105 | 0.8% |
| Iran | 337 | 2.6% |
| Italy | 5 | 0.0% |
| Jamaica | 26 | 0.2% |
| Japan | 65 | 0.5% |
| Kazakhstan | 13 | 0.1% |
| Kenya | 5 | 0.0% |
| Korea | 311 | 2.4% |
| Latin America | 303 | 2.4% |
| Malaysia | 36 | 0.3% |
| Mexico | 163 | 1.3% |
| Moldova | 7 | 0.1% |
| Nepal | 79 | 0.6% |
| Nigeria | 12 | 0.1% |
| Northern Europe | 132 | 1.0% |
| Oceania | 31 | 0.2% |
| Pakistan | 51 | 0.4% |
| Peru | 19 | 0.2% |
| Philippines | 76 | 0.6% |
| Portugal | 28 | 0.2% |
| Romania | 28 | 0.2% |
| Russia | 28 | 0.2% |
| Scotland | 5 | 0.0% |
| South Africa | 12 | 0.1% |
| South America | 79 | 0.6% |
| South Central Asia | 1,012 | 7.9% |
| South Eastern Asia | 399 | 3.1% |
| Southern Europe | 41 | 0.3% |
| Sri Lanka | 12 | 0.1% |
| Switzerland | 19 | 0.2% |
| Taiwan | 251 | 1.9% |
| Thailand | 15 | 0.1% |
| Turkey | 17 | 0.1% |
| Uganda | 11 | 0.1% |
| Ukraine | 15 | 0.1% |
| Venezuela | 28 | 0.2% |
| Vietnam | 167 | 1.3% |
| Western Africa | 91 | 0.7% |
| Western Asia | 26 | 0.2% |
| Western Europe | 193 | 1.5% | View All 65 Rows |
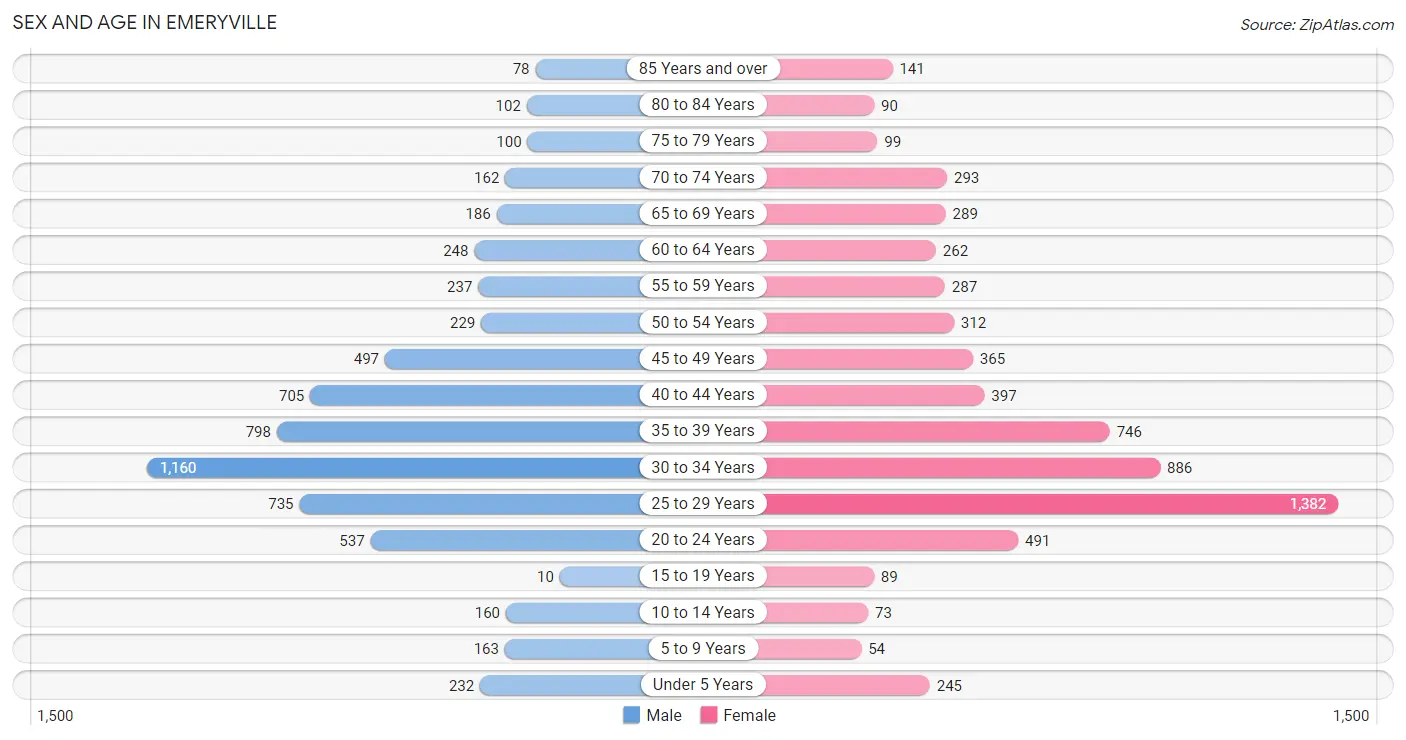
Sex and Age in Emeryville
Sex and Age in Emeryville
The most populous age groups in Emeryville are 30 to 34 Years (1,160 | 18.3%) for men and 25 to 29 Years (1,382 | 21.3%) for women.
| Age Bracket | Male | Female |
| Under 5 Years | 232 (3.7%) | 245 (3.8%) |
| 5 to 9 Years | 163 (2.6%) | 54 (0.8%) |
| 10 to 14 Years | 160 (2.5%) | 73 (1.1%) |
| 15 to 19 Years | 10 (0.2%) | 89 (1.4%) |
| 20 to 24 Years | 537 (8.5%) | 491 (7.5%) |
| 25 to 29 Years | 735 (11.6%) | 1,382 (21.3%) |
| 30 to 34 Years | 1,160 (18.3%) | 886 (13.6%) |
| 35 to 39 Years | 798 (12.6%) | 746 (11.5%) |
| 40 to 44 Years | 705 (11.1%) | 397 (6.1%) |
| 45 to 49 Years | 497 (7.8%) | 365 (5.6%) |
| 50 to 54 Years | 229 (3.6%) | 312 (4.8%) |
| 55 to 59 Years | 237 (3.7%) | 287 (4.4%) |
| 60 to 64 Years | 248 (3.9%) | 262 (4.0%) |
| 65 to 69 Years | 186 (2.9%) | 289 (4.4%) |
| 70 to 74 Years | 162 (2.6%) | 293 (4.5%) |
| 75 to 79 Years | 100 (1.6%) | 99 (1.5%) |
| 80 to 84 Years | 102 (1.6%) | 90 (1.4%) |
| 85 Years and over | 78 (1.2%) | 141 (2.2%) |
| Total | 6,339 (100.0%) | 6,501 (100.0%) |
Families and Households in Emeryville
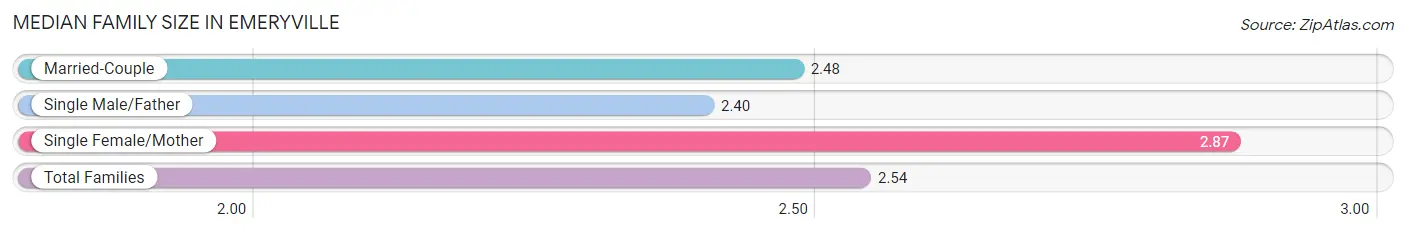
Median Family Size in Emeryville
The median family size in Emeryville is 2.54 persons per family, with single female/mother families (410 | 17.7%) accounting for the largest median family size of 2.87 persons per family. On the other hand, single male/father families (241 | 10.4%) represent the smallest median family size with 2.40 persons per family.
| Family Type | # Families | Family Size |
| Married-Couple | 1,660 (71.8%) | 2.48 |
| Single Male/Father | 241 (10.4%) | 2.40 |
| Single Female/Mother | 410 (17.7%) | 2.87 |
| Total Families | 2,311 (100.0%) | 2.54 |
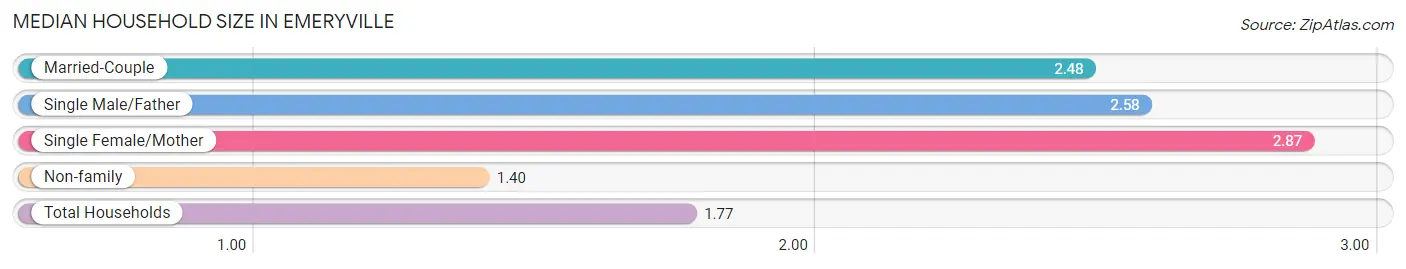
Median Household Size in Emeryville
The median household size in Emeryville is 1.77 persons per household, with single female/mother households (410 | 5.7%) accounting for the largest median household size of 2.87 persons per household. non-family households (4,922 | 68.0%) represent the smallest median household size with 1.40 persons per household.
| Household Type | # Households | Household Size |
| Married-Couple | 1,660 (23.0%) | 2.48 |
| Single Male/Father | 241 (3.3%) | 2.58 |
| Single Female/Mother | 410 (5.7%) | 2.87 |
| Non-family | 4,922 (68.0%) | 1.40 |
| Total Households | 7,233 (100.0%) | 1.77 |
Household Size by Marriage Status in Emeryville
Out of a total of 7,233 households in Emeryville, 2,311 (32.0%) are family households, while 4,922 (68.0%) are nonfamily households. The most numerous type of family households are 2-person households, comprising 1,542, and the most common type of nonfamily households are 1-person households, comprising 3,702.
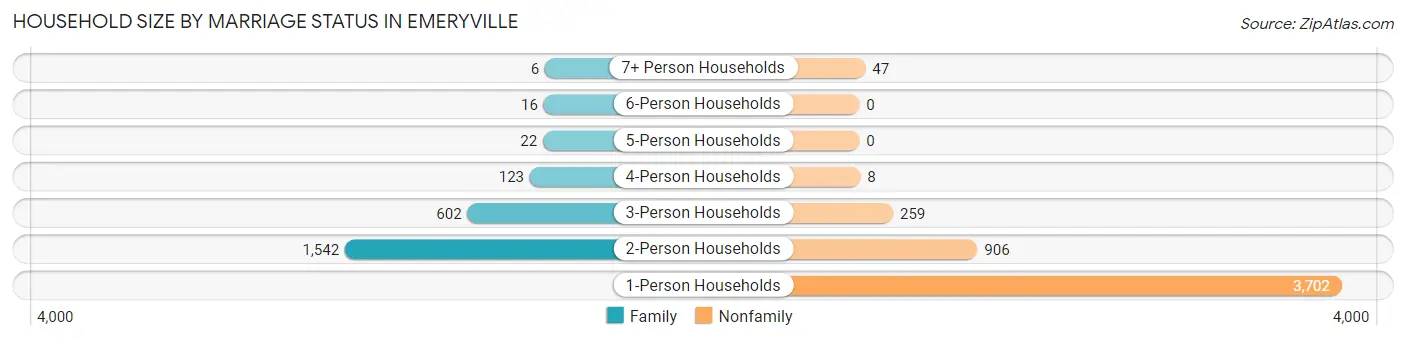
| Household Size | Family Households | Nonfamily Households |
| 1-Person Households | - | 3,702 (51.2%) |
| 2-Person Households | 1,542 (21.3%) | 906 (12.5%) |
| 3-Person Households | 602 (8.3%) | 259 (3.6%) |
| 4-Person Households | 123 (1.7%) | 8 (0.1%) |
| 5-Person Households | 22 (0.3%) | 0 (0.0%) |
| 6-Person Households | 16 (0.2%) | 0 (0.0%) |
| 7+ Person Households | 6 (0.1%) | 47 (0.6%) |
| Total | 2,311 (32.0%) | 4,922 (68.0%) |
Female Fertility in Emeryville
Fertility by Age in Emeryville
Average fertility rate in Emeryville is 19.0 births per 1,000 women. Women in the age bracket of 35 to 50 years have the highest fertility rate with 42.0 births per 1,000 women. Women in the age bracket of 35 to 50 years acount for 78.6% of all women with births.
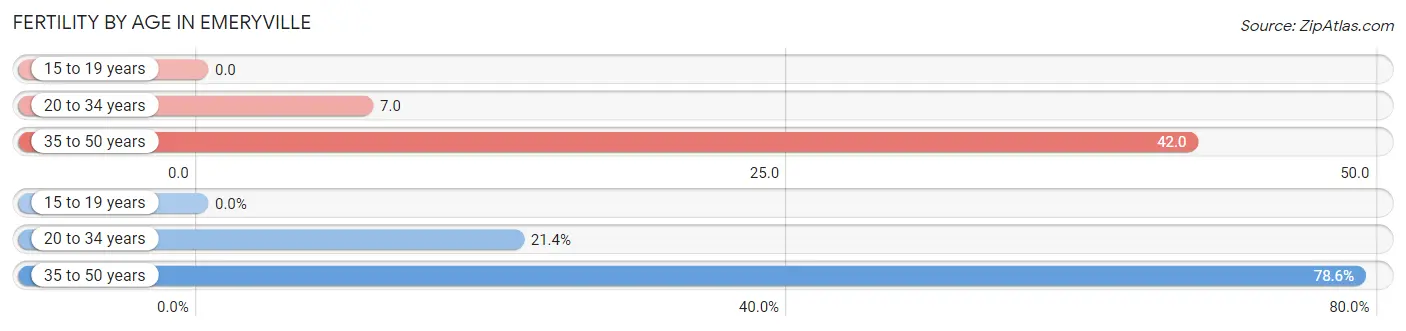
| Age Bracket | Women with Births | Births / 1,000 Women |
| 15 to 19 years | 0 (0.0%) | 0.0 |
| 20 to 34 years | 18 (21.4%) | 7.0 |
| 35 to 50 years | 66 (78.6%) | 42.0 |
| Total | 84 (100.0%) | 19.0 |
Fertility by Age by Marriage Status in Emeryville
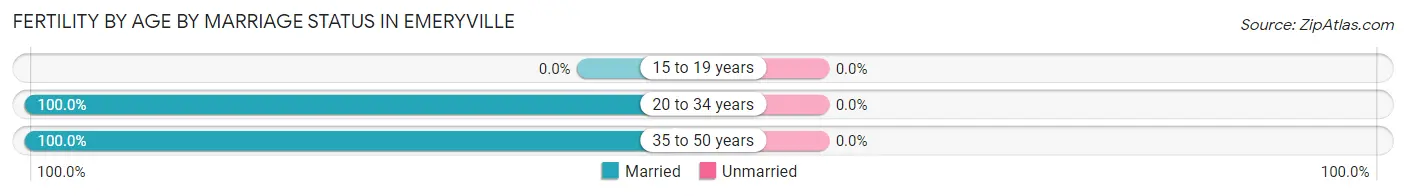
| Age Bracket | Married | Unmarried |
| 15 to 19 years | 0 (0.0%) | 0 (0.0%) |
| 20 to 34 years | 18 (100.0%) | 0 (0.0%) |
| 35 to 50 years | 66 (100.0%) | 0 (0.0%) |
| Total | 84 (100.0%) | 0 (0.0%) |
Fertility by Education in Emeryville
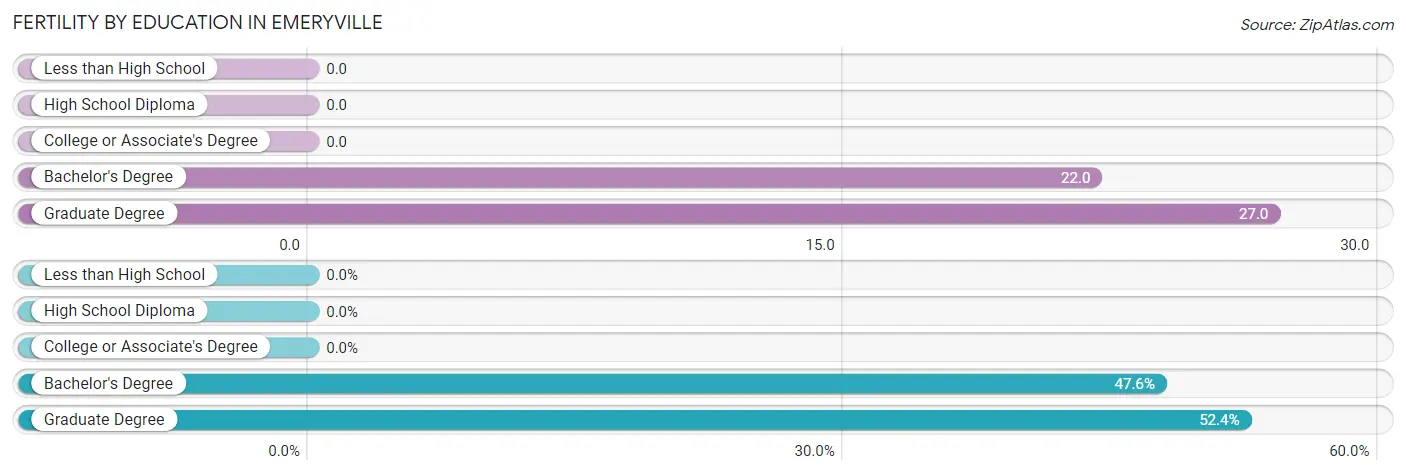
| Educational Attainment | Women with Births | Births / 1,000 Women |
| Less than High School | 0 (0.0%) | 0.0 |
| High School Diploma | 0 (0.0%) | 0.0 |
| College or Associate's Degree | 0 (0.0%) | 0.0 |
| Bachelor's Degree | 40 (47.6%) | 22.0 |
| Graduate Degree | 44 (52.4%) | 27.0 |
| Total | 84 (100.0%) | 19.0 |
Fertility by Education by Marriage Status in Emeryville
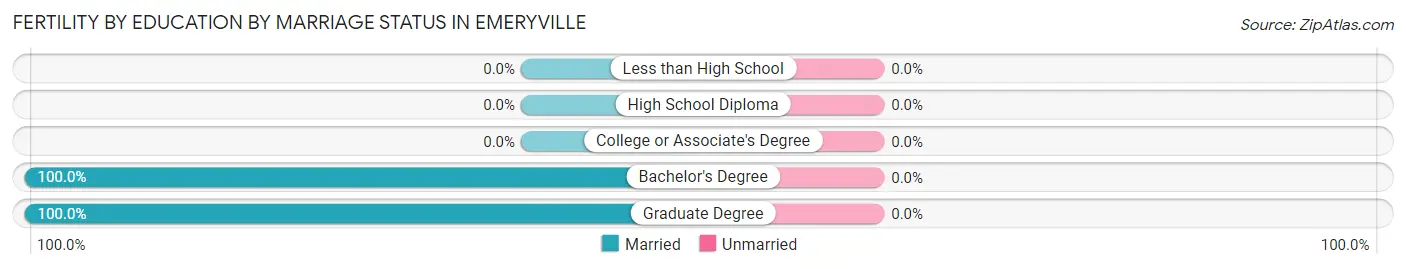
| Educational Attainment | Married | Unmarried |
| Less than High School | 0 (0.0%) | 0 (0.0%) |
| High School Diploma | 0 (0.0%) | 0 (0.0%) |
| College or Associate's Degree | 0 (0.0%) | 0 (0.0%) |
| Bachelor's Degree | 40 (100.0%) | 0 (0.0%) |
| Graduate Degree | 44 (100.0%) | 0 (0.0%) |
| Total | 84 (100.0%) | 0 (0.0%) |
Employment Characteristics in Emeryville
Employment by Class of Employer in Emeryville
Among the 8,669 employed individuals in Emeryville, private company employees (5,524 | 63.7%), not-for-profit organizations (952 | 11.0%), and self-employed (not incorporated) (779 | 9.0%) make up the most common classes of employment.
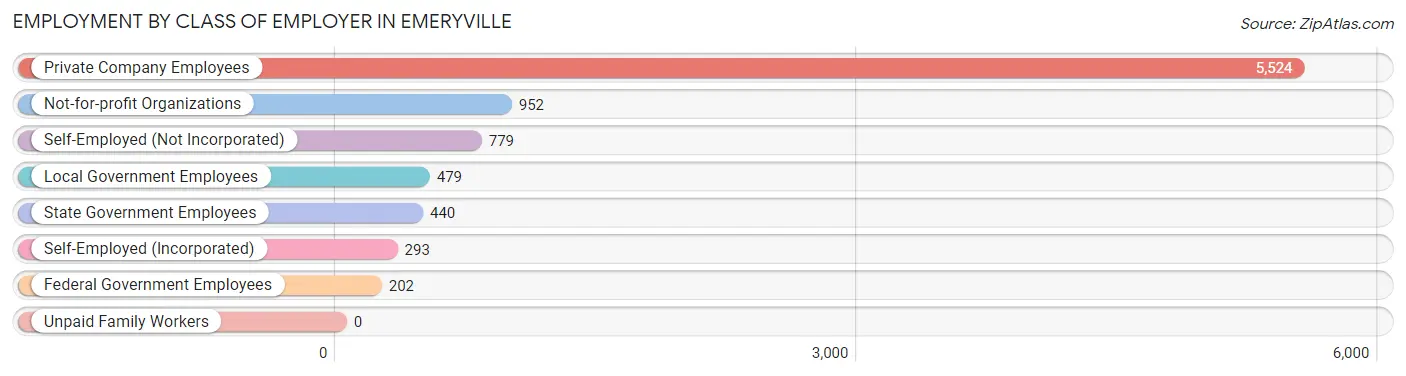
| Employer Class | # Employees | % Employees |
| Private Company Employees | 5,524 | 63.7% |
| Self-Employed (Incorporated) | 293 | 3.4% |
| Self-Employed (Not Incorporated) | 779 | 9.0% |
| Not-for-profit Organizations | 952 | 11.0% |
| Local Government Employees | 479 | 5.5% |
| State Government Employees | 440 | 5.1% |
| Federal Government Employees | 202 | 2.3% |
| Unpaid Family Workers | 0 | 0.0% |
| Total | 8,669 | 100.0% |
Employment Status by Age in Emeryville
According to the labor force statistics for Emeryville, out of the total population over 16 years of age (11,913), 77.3% or 9,209 individuals are in the labor force, with 4.9% or 451 of them unemployed. The age group with the highest labor force participation rate is 25 to 29 years, with 93.8% or 1,986 individuals in the labor force. Within the labor force, the 75 years and over age range has the highest percentage of unemployed individuals, with 15.4% or 8 of them being unemployed.
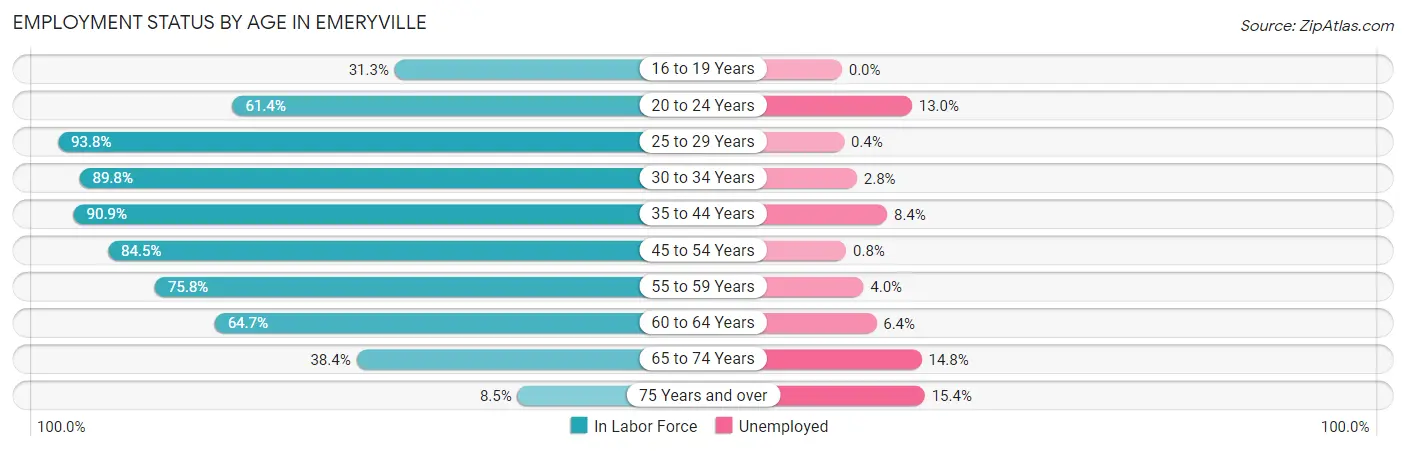
| Age Bracket | In Labor Force | Unemployed |
| 16 to 19 Years | 31 (31.3%) | 0 (0.0%) |
| 20 to 24 Years | 631 (61.4%) | 82 (13.0%) |
| 25 to 29 Years | 1,986 (93.8%) | 8 (0.4%) |
| 30 to 34 Years | 1,837 (89.8%) | 51 (2.8%) |
| 35 to 44 Years | 2,405 (90.9%) | 202 (8.4%) |
| 45 to 54 Years | 1,186 (84.5%) | 9 (0.8%) |
| 55 to 59 Years | 397 (75.8%) | 16 (4.0%) |
| 60 to 64 Years | 330 (64.7%) | 21 (6.4%) |
| 65 to 74 Years | 357 (38.4%) | 53 (14.8%) |
| 75 Years and over | 52 (8.5%) | 8 (15.4%) |
| Total | 9,209 (77.3%) | 451 (4.9%) |
Employment Status by Educational Attainment in Emeryville
According to labor force statistics for Emeryville, 88.0% of individuals (8,136) out of the total population between 25 and 64 years of age (9,246) are in the labor force, with 3.8% or 309 of them being unemployed. The group with the highest labor force participation rate are those with the educational attainment of bachelor's degree or higher, with 90.3% or 6,227 individuals in the labor force. Within the labor force, individuals with college / associate degree education have the highest percentage of unemployment, with 9.7% or 141 of them being unemployed.
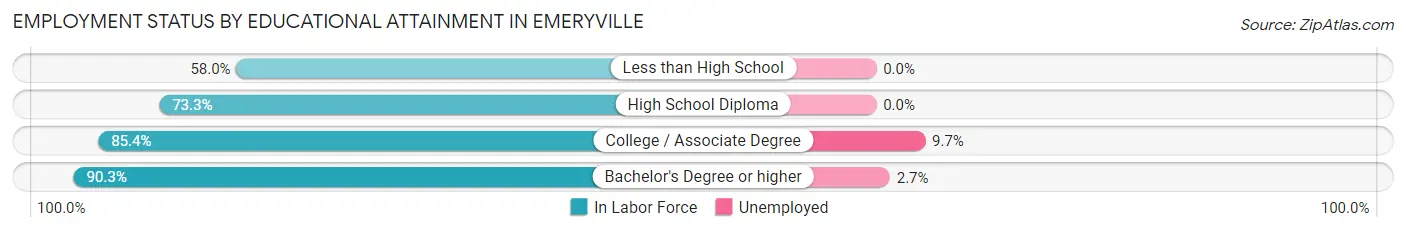
| Educational Attainment | In Labor Force | Unemployed |
| Less than High School | 65 (58.0%) | 0 (0.0%) |
| High School Diploma | 396 (73.3%) | 0 (0.0%) |
| College / Associate Degree | 1,450 (85.4%) | 165 (9.7%) |
| Bachelor's Degree or higher | 6,227 (90.3%) | 186 (2.7%) |
| Total | 8,136 (88.0%) | 351 (3.8%) |
Employment Occupations by Sex in Emeryville
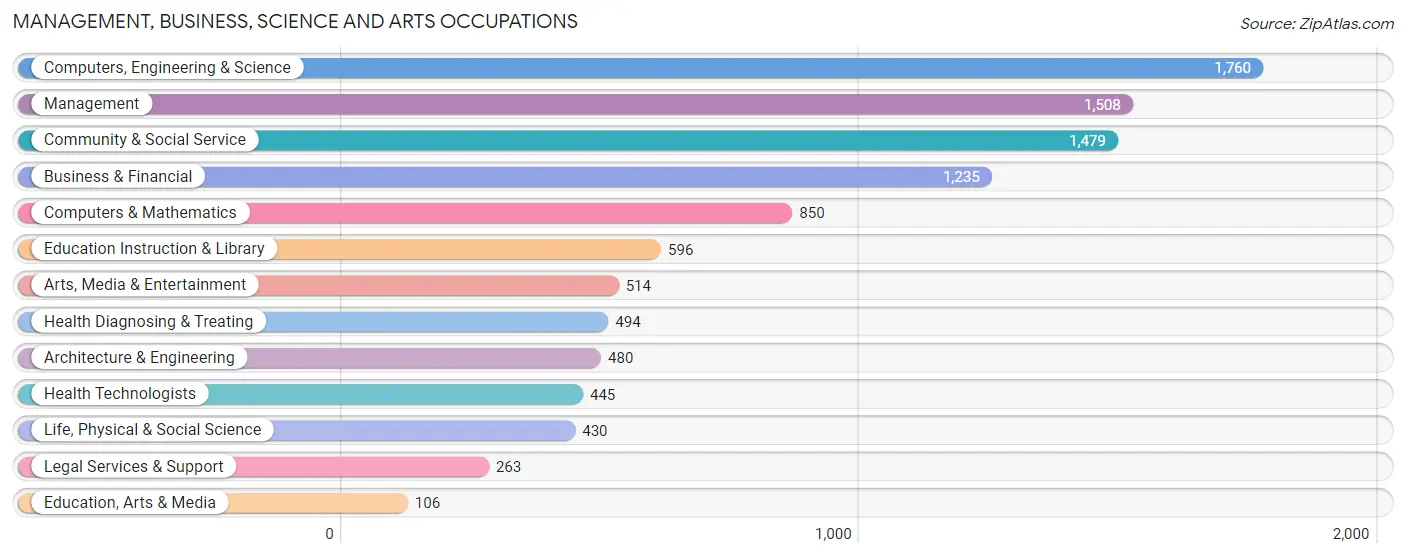
Management, Business, Science and Arts Occupations
The most common Management, Business, Science and Arts occupations in Emeryville are Computers, Engineering & Science (1,760 | 20.1%), Management (1,508 | 17.3%), Community & Social Service (1,479 | 16.9%), Business & Financial (1,235 | 14.1%), and Computers & Mathematics (850 | 9.7%).
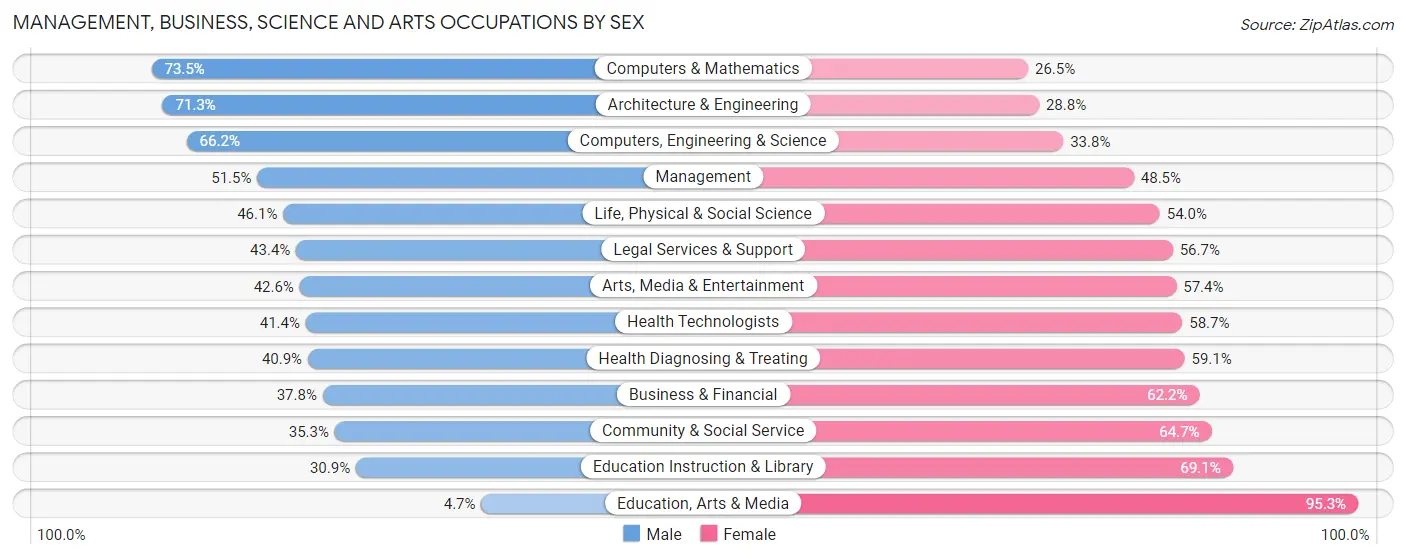
Management, Business, Science and Arts Occupations by Sex
Within the Management, Business, Science and Arts occupations in Emeryville, the most male-oriented occupations are Computers & Mathematics (73.5%), Architecture & Engineering (71.3%), and Computers, Engineering & Science (66.2%), while the most female-oriented occupations are Education, Arts & Media (95.3%), Education Instruction & Library (69.1%), and Community & Social Service (64.7%).
| Occupation | Male | Female |
| Management | 776 (51.5%) | 732 (48.5%) |
| Business & Financial | 467 (37.8%) | 768 (62.2%) |
| Computers, Engineering & Science | 1,165 (66.2%) | 595 (33.8%) |
| Computers & Mathematics | 625 (73.5%) | 225 (26.5%) |
| Architecture & Engineering | 342 (71.3%) | 138 (28.7%) |
| Life, Physical & Social Science | 198 (46.1%) | 232 (53.9%) |
| Community & Social Service | 522 (35.3%) | 957 (64.7%) |
| Education, Arts & Media | 5 (4.7%) | 101 (95.3%) |
| Legal Services & Support | 114 (43.3%) | 149 (56.7%) |
| Education Instruction & Library | 184 (30.9%) | 412 (69.1%) |
| Arts, Media & Entertainment | 219 (42.6%) | 295 (57.4%) |
| Health Diagnosing & Treating | 202 (40.9%) | 292 (59.1%) |
| Health Technologists | 184 (41.3%) | 261 (58.7%) |
| Total (Category) | 3,132 (48.4%) | 3,344 (51.6%) |
| Total (Overall) | 4,296 (49.2%) | 4,441 (50.8%) |
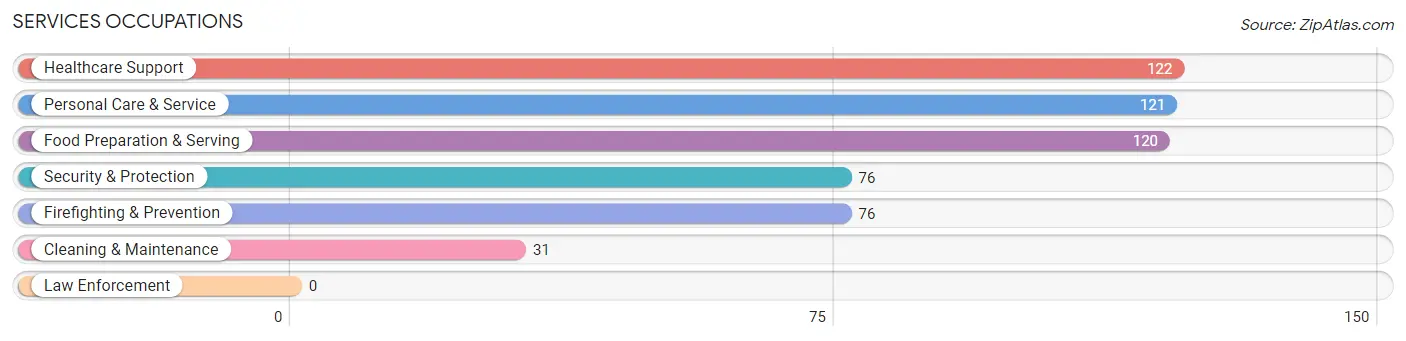
Services Occupations
The most common Services occupations in Emeryville are Healthcare Support (122 | 1.4%), Personal Care & Service (121 | 1.4%), Food Preparation & Serving (120 | 1.4%), Security & Protection (76 | 0.9%), and Firefighting & Prevention (76 | 0.9%).
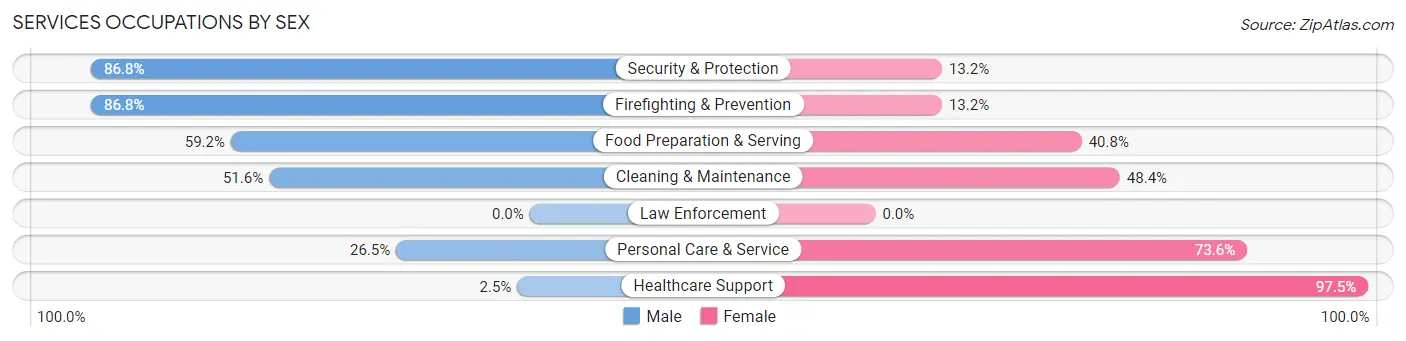
Services Occupations by Sex
Within the Services occupations in Emeryville, the most male-oriented occupations are Security & Protection (86.8%), Firefighting & Prevention (86.8%), and Food Preparation & Serving (59.2%), while the most female-oriented occupations are Healthcare Support (97.5%), Personal Care & Service (73.6%), and Cleaning & Maintenance (48.4%).
| Occupation | Male | Female |
| Healthcare Support | 3 (2.5%) | 119 (97.5%) |
| Security & Protection | 66 (86.8%) | 10 (13.2%) |
| Firefighting & Prevention | 66 (86.8%) | 10 (13.2%) |
| Law Enforcement | 0 (0.0%) | 0 (0.0%) |
| Food Preparation & Serving | 71 (59.2%) | 49 (40.8%) |
| Cleaning & Maintenance | 16 (51.6%) | 15 (48.4%) |
| Personal Care & Service | 32 (26.5%) | 89 (73.6%) |
| Total (Category) | 188 (40.0%) | 282 (60.0%) |
| Total (Overall) | 4,296 (49.2%) | 4,441 (50.8%) |
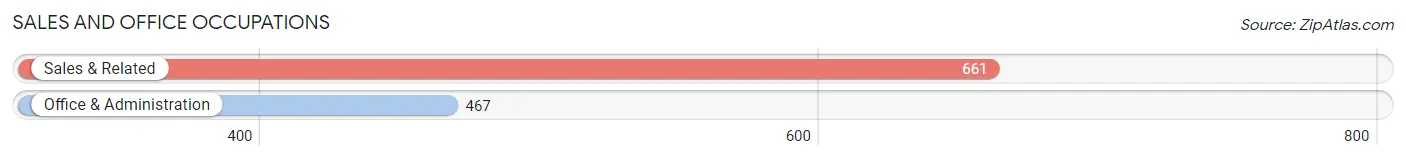
Sales and Office Occupations
The most common Sales and Office occupations in Emeryville are Sales & Related (661 | 7.6%), and Office & Administration (467 | 5.3%).
Sales and Office Occupations by Sex
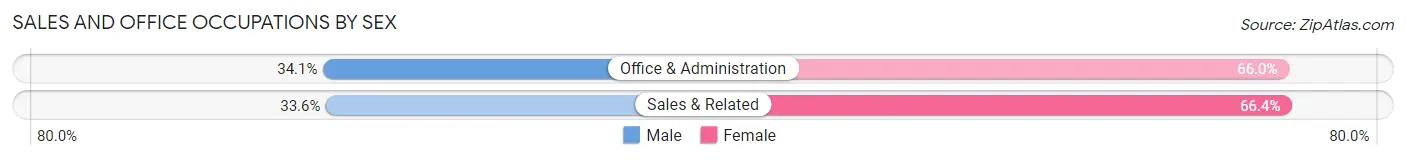
| Occupation | Male | Female |
| Sales & Related | 222 (33.6%) | 439 (66.4%) |
| Office & Administration | 159 (34.1%) | 308 (65.9%) |
| Total (Category) | 381 (33.8%) | 747 (66.2%) |
| Total (Overall) | 4,296 (49.2%) | 4,441 (50.8%) |
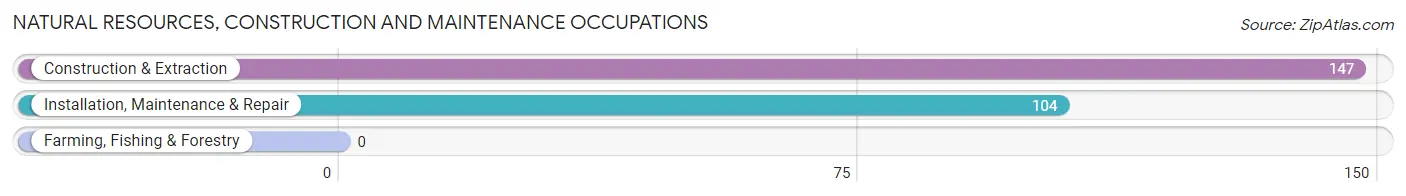
Natural Resources, Construction and Maintenance Occupations
The most common Natural Resources, Construction and Maintenance occupations in Emeryville are Construction & Extraction (147 | 1.7%), and Installation, Maintenance & Repair (104 | 1.2%).
Natural Resources, Construction and Maintenance Occupations by Sex
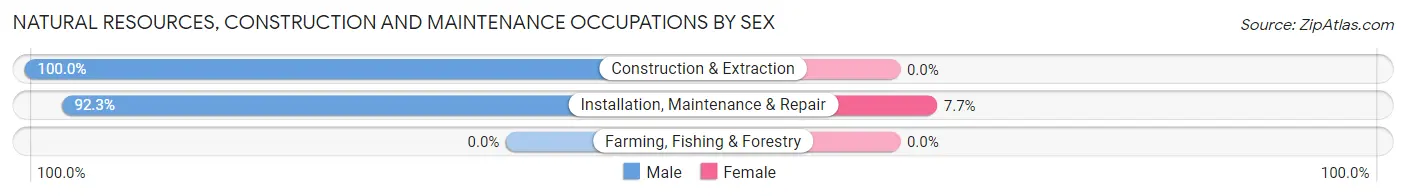
| Occupation | Male | Female |
| Farming, Fishing & Forestry | 0 (0.0%) | 0 (0.0%) |
| Construction & Extraction | 147 (100.0%) | 0 (0.0%) |
| Installation, Maintenance & Repair | 96 (92.3%) | 8 (7.7%) |
| Total (Category) | 243 (96.8%) | 8 (3.2%) |
| Total (Overall) | 4,296 (49.2%) | 4,441 (50.8%) |
Production, Transportation and Moving Occupations
The most common Production, Transportation and Moving occupations in Emeryville are Material Moving (212 | 2.4%), Transportation (193 | 2.2%), and Production (7 | 0.1%).
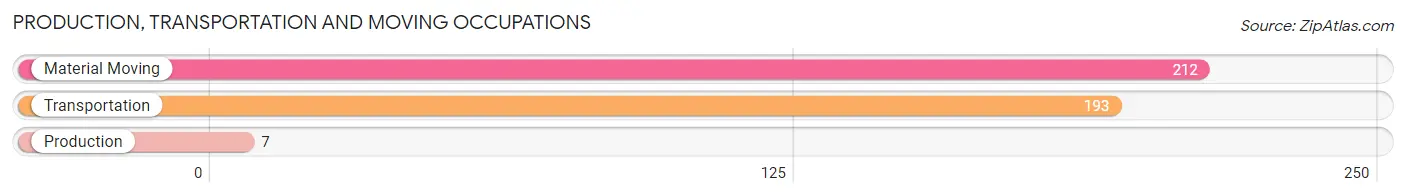
Production, Transportation and Moving Occupations by Sex
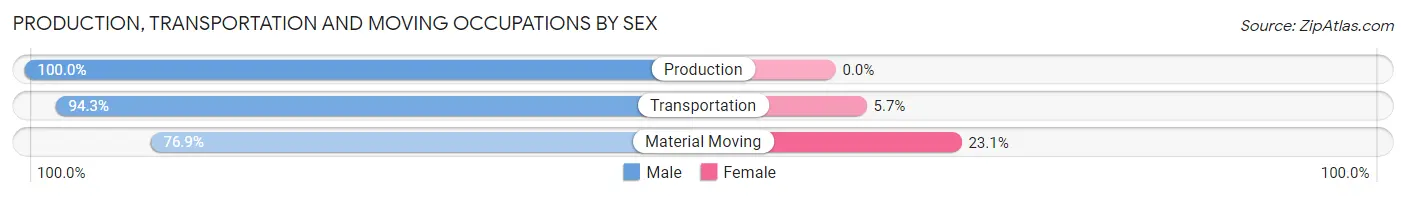
| Occupation | Male | Female |
| Production | 7 (100.0%) | 0 (0.0%) |
| Transportation | 182 (94.3%) | 11 (5.7%) |
| Material Moving | 163 (76.9%) | 49 (23.1%) |
| Total (Category) | 352 (85.4%) | 60 (14.6%) |
| Total (Overall) | 4,296 (49.2%) | 4,441 (50.8%) |
Employment Industries by Sex in Emeryville
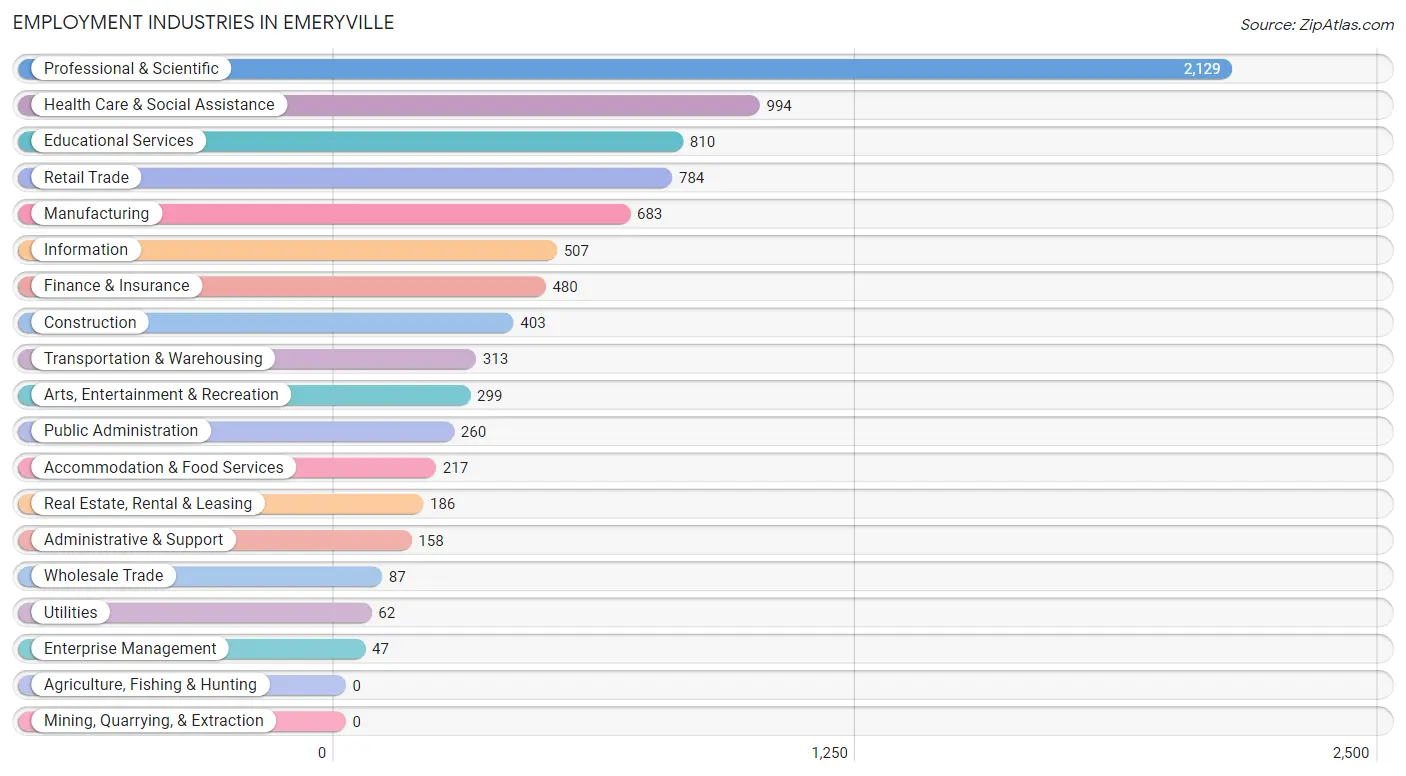
Employment Industries in Emeryville
The major employment industries in Emeryville include Professional & Scientific (2,129 | 24.4%), Health Care & Social Assistance (994 | 11.4%), Educational Services (810 | 9.3%), Retail Trade (784 | 9.0%), and Manufacturing (683 | 7.8%).
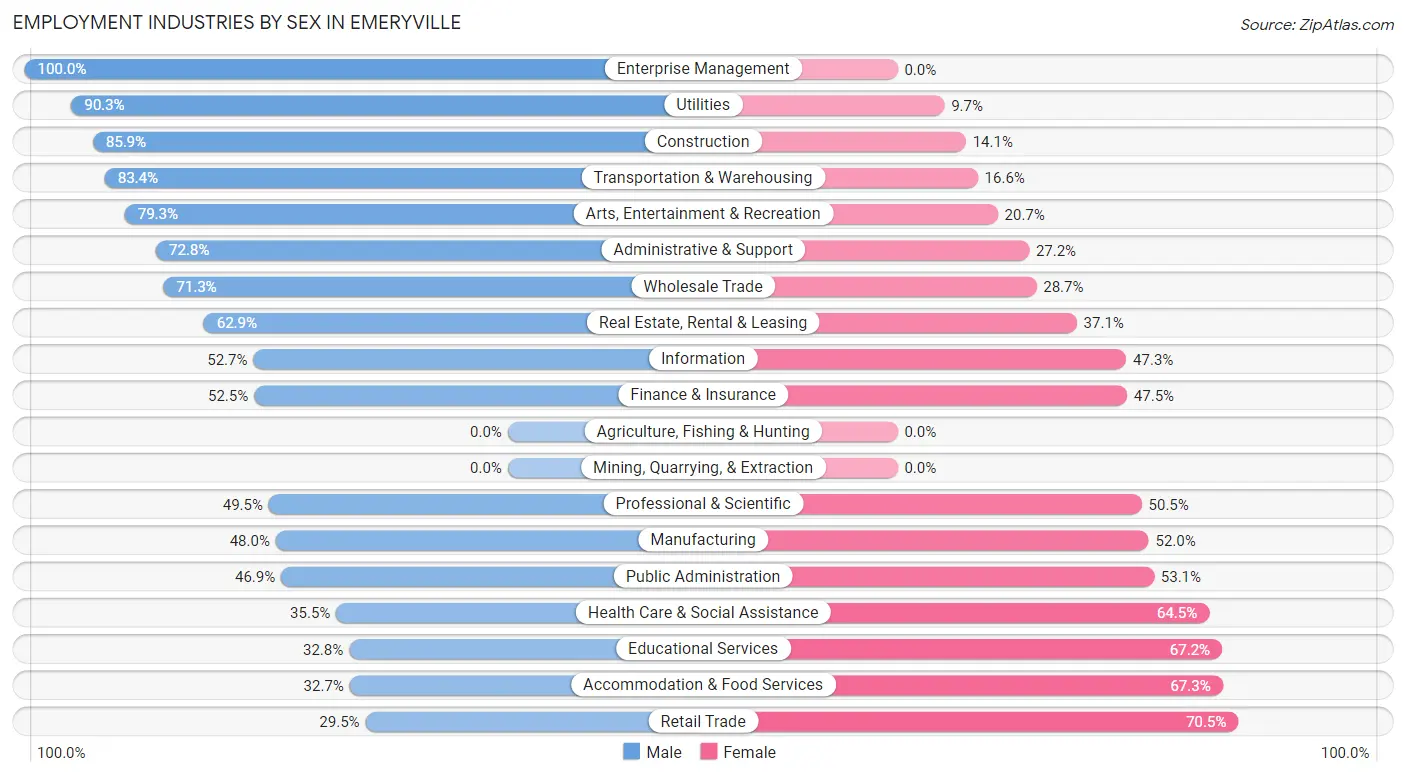
Employment Industries by Sex in Emeryville
The Emeryville industries that see more men than women are Enterprise Management (100.0%), Utilities (90.3%), and Construction (85.9%), whereas the industries that tend to have a higher number of women are Retail Trade (70.5%), Accommodation & Food Services (67.3%), and Educational Services (67.2%).
| Industry | Male | Female |
| Agriculture, Fishing & Hunting | 0 (0.0%) | 0 (0.0%) |
| Mining, Quarrying, & Extraction | 0 (0.0%) | 0 (0.0%) |
| Construction | 346 (85.9%) | 57 (14.1%) |
| Manufacturing | 328 (48.0%) | 355 (52.0%) |
| Wholesale Trade | 62 (71.3%) | 25 (28.7%) |
| Retail Trade | 231 (29.5%) | 553 (70.5%) |
| Transportation & Warehousing | 261 (83.4%) | 52 (16.6%) |
| Utilities | 56 (90.3%) | 6 (9.7%) |
| Information | 267 (52.7%) | 240 (47.3%) |
| Finance & Insurance | 252 (52.5%) | 228 (47.5%) |
| Real Estate, Rental & Leasing | 117 (62.9%) | 69 (37.1%) |
| Professional & Scientific | 1,053 (49.5%) | 1,076 (50.5%) |
| Enterprise Management | 47 (100.0%) | 0 (0.0%) |
| Administrative & Support | 115 (72.8%) | 43 (27.2%) |
| Educational Services | 266 (32.8%) | 544 (67.2%) |
| Health Care & Social Assistance | 353 (35.5%) | 641 (64.5%) |
| Arts, Entertainment & Recreation | 237 (79.3%) | 62 (20.7%) |
| Accommodation & Food Services | 71 (32.7%) | 146 (67.3%) |
| Public Administration | 122 (46.9%) | 138 (53.1%) |
| Total | 4,296 (49.2%) | 4,441 (50.8%) |
Education in Emeryville
School Enrollment in Emeryville
The most common levels of schooling among the 2,003 students in Emeryville are college / undergraduate (864 | 43.1%), graduate / professional (563 | 28.1%), and elementary school (178 | 8.9%).
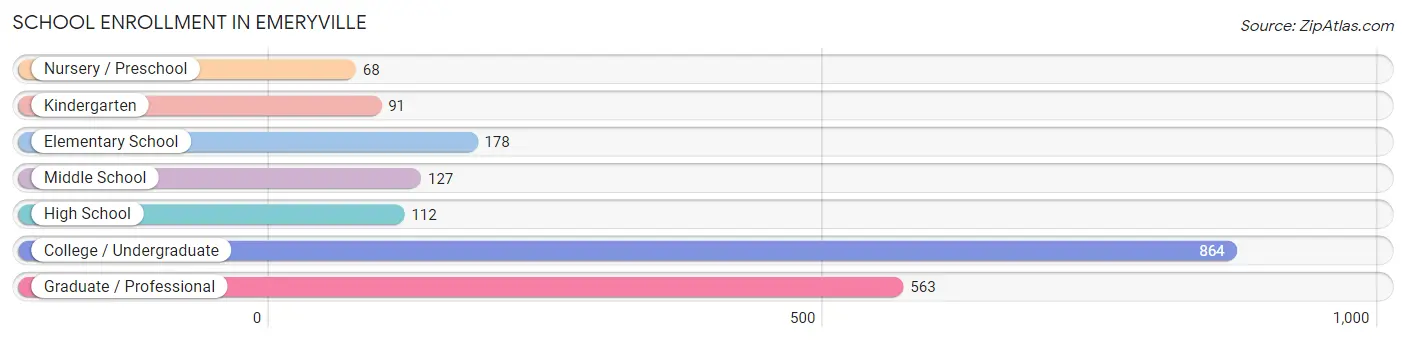
| School Level | # Students | % Students |
| Nursery / Preschool | 68 | 3.4% |
| Kindergarten | 91 | 4.5% |
| Elementary School | 178 | 8.9% |
| Middle School | 127 | 6.3% |
| High School | 112 | 5.6% |
| College / Undergraduate | 864 | 43.1% |
| Graduate / Professional | 563 | 28.1% |
| Total | 2,003 | 100.0% |
School Enrollment by Age by Funding Source in Emeryville
Out of a total of 2,003 students who are enrolled in schools in Emeryville, 419 (20.9%) attend a private institution, while the remaining 1,584 (79.1%) are enrolled in public schools. The age group of 3 to 4 year olds has the highest likelihood of being enrolled in private schools, with 68 (100.0% in the age bracket) enrolled. Conversely, the age group of 15 to 17 year olds has the lowest likelihood of being enrolled in a private school, with 65 (100.0% in the age bracket) attending a public institution.
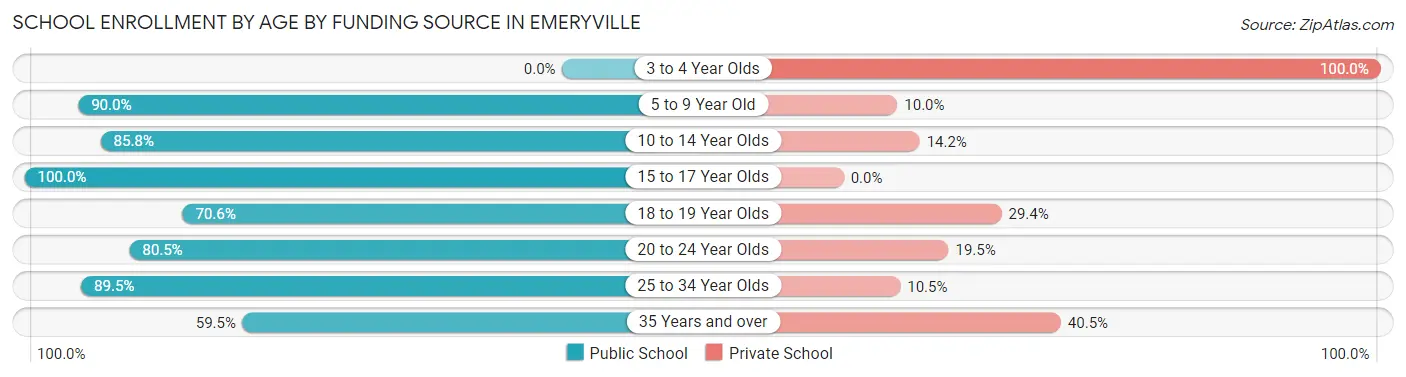
| Age Bracket | Public School | Private School |
| 3 to 4 Year Olds | 0 (0.0%) | 68 (100.0%) |
| 5 to 9 Year Old | 189 (90.0%) | 21 (10.0%) |
| 10 to 14 Year Olds | 200 (85.8%) | 33 (14.2%) |
| 15 to 17 Year Olds | 65 (100.0%) | 0 (0.0%) |
| 18 to 19 Year Olds | 24 (70.6%) | 10 (29.4%) |
| 20 to 24 Year Olds | 441 (80.5%) | 107 (19.5%) |
| 25 to 34 Year Olds | 484 (89.5%) | 57 (10.5%) |
| 35 Years and over | 181 (59.5%) | 123 (40.5%) |
| Total | 1,584 (79.1%) | 419 (20.9%) |
Educational Attainment by Field of Study in Emeryville
Social sciences (1,297 | 14.9%), business (1,122 | 12.9%), engineering (894 | 10.3%), bio, nature & agricultural (769 | 8.8%), and computers & mathematics (744 | 8.6%) are the most common fields of study among 8,700 individuals in Emeryville who have obtained a bachelor's degree or higher.
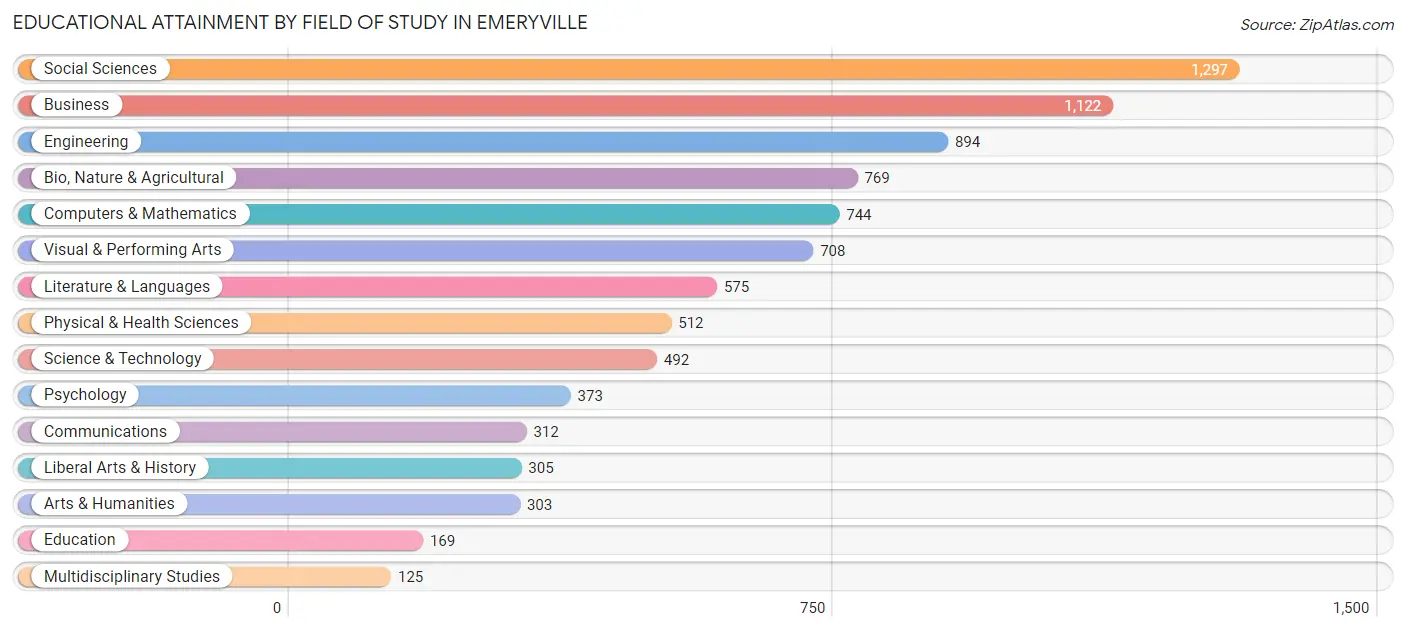
| Field of Study | # Graduates | % Graduates |
| Computers & Mathematics | 744 | 8.6% |
| Bio, Nature & Agricultural | 769 | 8.8% |
| Physical & Health Sciences | 512 | 5.9% |
| Psychology | 373 | 4.3% |
| Social Sciences | 1,297 | 14.9% |
| Engineering | 894 | 10.3% |
| Multidisciplinary Studies | 125 | 1.4% |
| Science & Technology | 492 | 5.7% |
| Business | 1,122 | 12.9% |
| Education | 169 | 1.9% |
| Literature & Languages | 575 | 6.6% |
| Liberal Arts & History | 305 | 3.5% |
| Visual & Performing Arts | 708 | 8.1% |
| Communications | 312 | 3.6% |
| Arts & Humanities | 303 | 3.5% |
| Total | 8,700 | 100.0% |
Transportation & Commute in Emeryville
Vehicle Availability by Sex in Emeryville
The most prevalent vehicle ownership categories in Emeryville are males with 1 vehicle (2,142, accounting for 50.4%) and females with 1 vehicle (2,280, making up 48.5%).
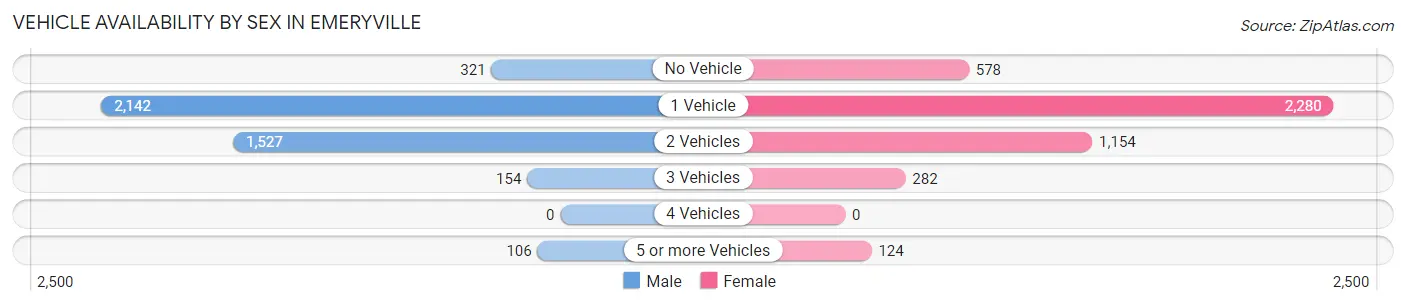
| Vehicles Available | Male | Female |
| No Vehicle | 321 (7.5%) | 578 (13.1%) |
| 1 Vehicle | 2,142 (50.4%) | 2,280 (51.6%) |
| 2 Vehicles | 1,527 (35.9%) | 1,154 (26.1%) |
| 3 Vehicles | 154 (3.6%) | 282 (6.4%) |
| 4 Vehicles | 0 (0.0%) | 0 (0.0%) |
| 5 or more Vehicles | 106 (2.5%) | 124 (2.8%) |
| Total | 4,250 (100.0%) | 4,418 (100.0%) |
Commute Time in Emeryville
The most frequently occuring commute durations in Emeryville are 45 to 59 minutes (977 commuters, 16.0%), 20 to 24 minutes (889 commuters, 14.6%), and 30 to 34 minutes (787 commuters, 12.9%).
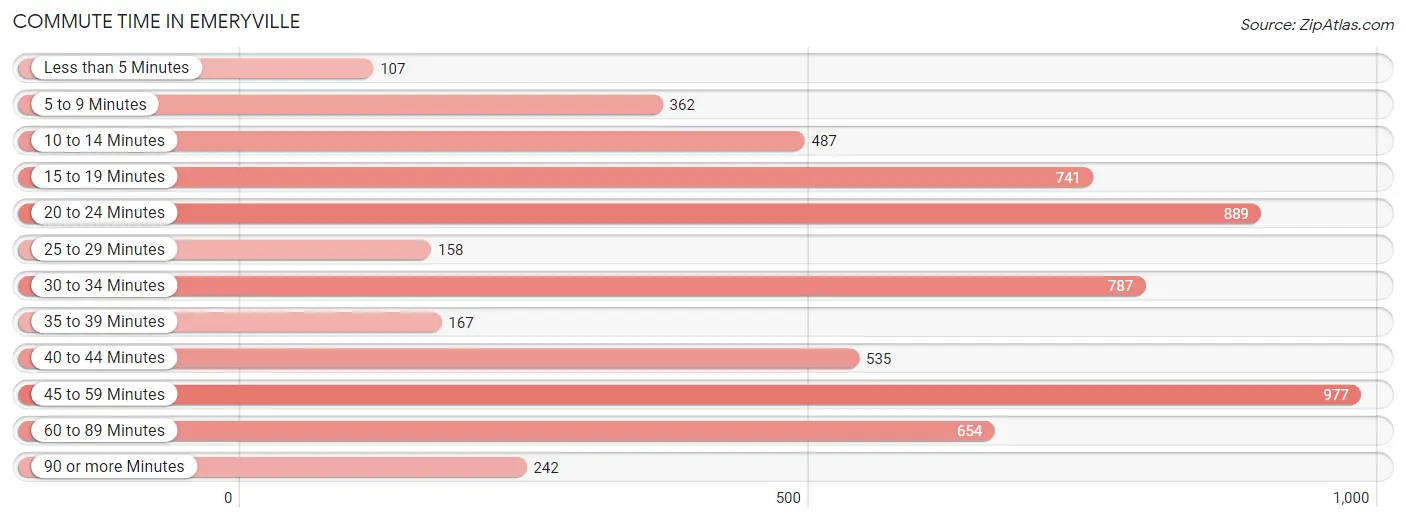
| Commute Time | # Commuters | % Commuters |
| Less than 5 Minutes | 107 | 1.8% |
| 5 to 9 Minutes | 362 | 5.9% |
| 10 to 14 Minutes | 487 | 8.0% |
| 15 to 19 Minutes | 741 | 12.1% |
| 20 to 24 Minutes | 889 | 14.6% |
| 25 to 29 Minutes | 158 | 2.6% |
| 30 to 34 Minutes | 787 | 12.9% |
| 35 to 39 Minutes | 167 | 2.7% |
| 40 to 44 Minutes | 535 | 8.8% |
| 45 to 59 Minutes | 977 | 16.0% |
| 60 to 89 Minutes | 654 | 10.7% |
| 90 or more Minutes | 242 | 4.0% |
Commute Time by Sex in Emeryville
The most common commute times in Emeryville are 45 to 59 minutes (554 commuters, 17.5%) for males and 20 to 24 minutes (513 commuters, 17.5%) for females.
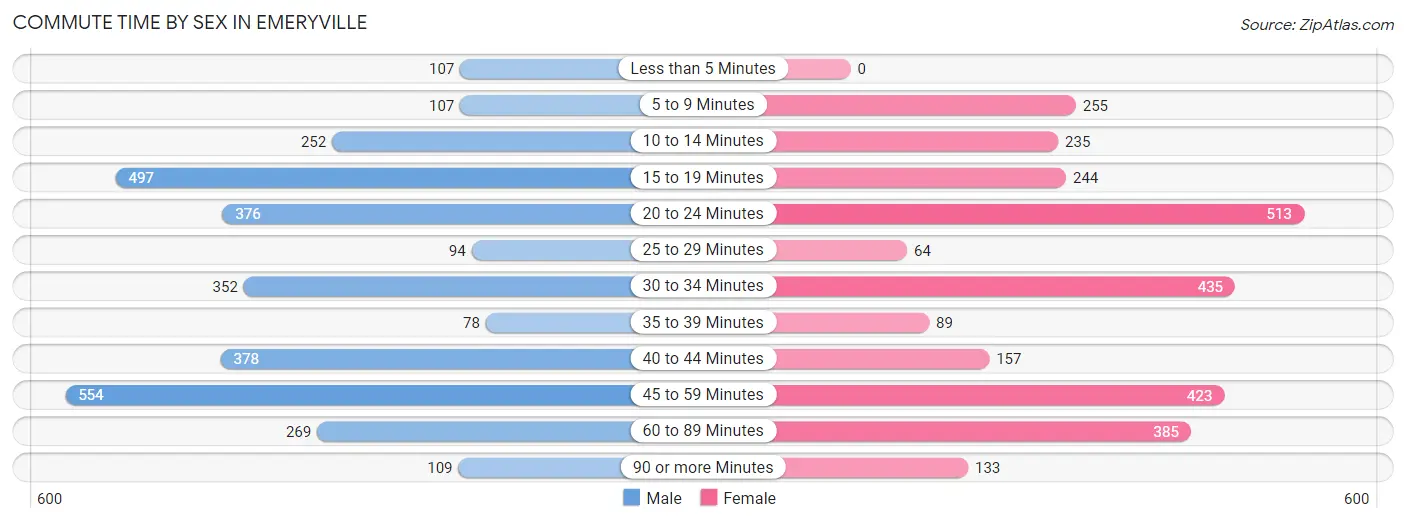
| Commute Time | Male | Female |
| Less than 5 Minutes | 107 (3.4%) | 0 (0.0%) |
| 5 to 9 Minutes | 107 (3.4%) | 255 (8.7%) |
| 10 to 14 Minutes | 252 (7.9%) | 235 (8.0%) |
| 15 to 19 Minutes | 497 (15.7%) | 244 (8.3%) |
| 20 to 24 Minutes | 376 (11.8%) | 513 (17.5%) |
| 25 to 29 Minutes | 94 (3.0%) | 64 (2.2%) |
| 30 to 34 Minutes | 352 (11.1%) | 435 (14.8%) |
| 35 to 39 Minutes | 78 (2.5%) | 89 (3.0%) |
| 40 to 44 Minutes | 378 (11.9%) | 157 (5.3%) |
| 45 to 59 Minutes | 554 (17.5%) | 423 (14.4%) |
| 60 to 89 Minutes | 269 (8.5%) | 385 (13.1%) |
| 90 or more Minutes | 109 (3.4%) | 133 (4.5%) |
Time of Departure to Work by Sex in Emeryville
The most frequent times of departure to work in Emeryville are 8:00 AM to 8:29 AM (667, 21.0%) for males and 9:00 AM to 9:59 AM (521, 17.8%) for females.
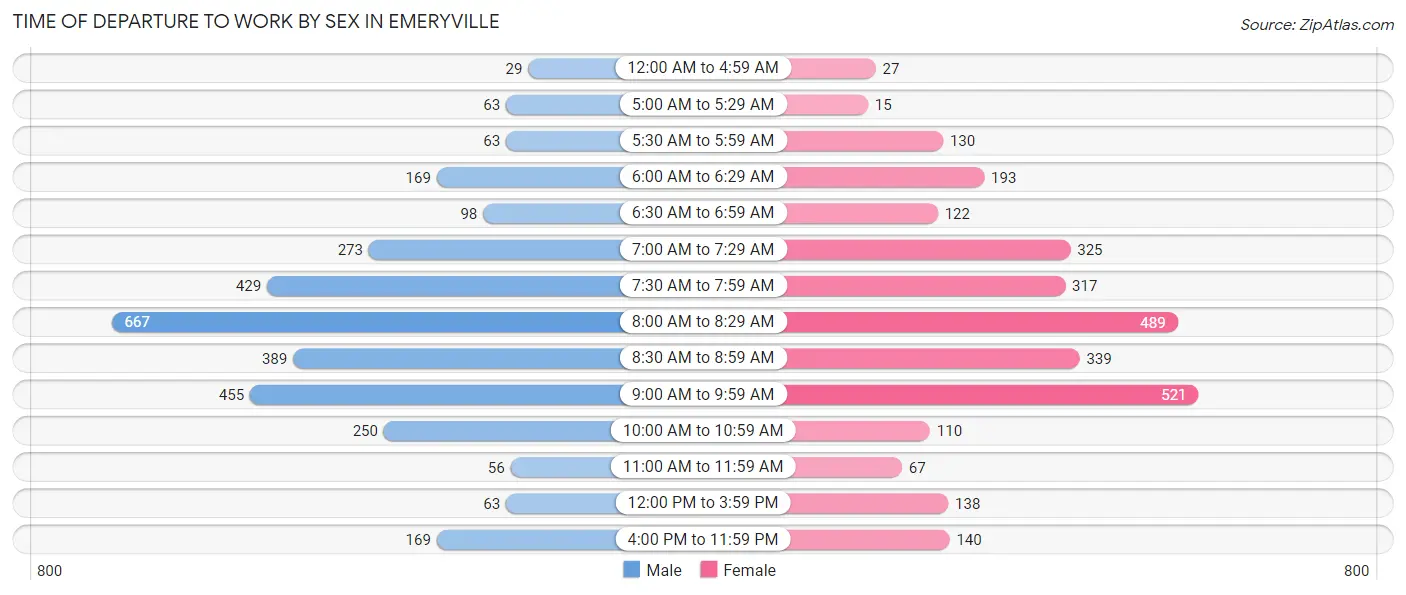
| Time of Departure | Male | Female |
| 12:00 AM to 4:59 AM | 29 (0.9%) | 27 (0.9%) |
| 5:00 AM to 5:29 AM | 63 (2.0%) | 15 (0.5%) |
| 5:30 AM to 5:59 AM | 63 (2.0%) | 130 (4.4%) |
| 6:00 AM to 6:29 AM | 169 (5.3%) | 193 (6.6%) |
| 6:30 AM to 6:59 AM | 98 (3.1%) | 122 (4.2%) |
| 7:00 AM to 7:29 AM | 273 (8.6%) | 325 (11.1%) |
| 7:30 AM to 7:59 AM | 429 (13.5%) | 317 (10.8%) |
| 8:00 AM to 8:29 AM | 667 (21.0%) | 489 (16.7%) |
| 8:30 AM to 8:59 AM | 389 (12.3%) | 339 (11.6%) |
| 9:00 AM to 9:59 AM | 455 (14.3%) | 521 (17.8%) |
| 10:00 AM to 10:59 AM | 250 (7.9%) | 110 (3.7%) |
| 11:00 AM to 11:59 AM | 56 (1.8%) | 67 (2.3%) |
| 12:00 PM to 3:59 PM | 63 (2.0%) | 138 (4.7%) |
| 4:00 PM to 11:59 PM | 169 (5.3%) | 140 (4.8%) |
| Total | 3,173 (100.0%) | 2,933 (100.0%) |
Housing Occupancy in Emeryville
Occupancy by Ownership in Emeryville
Of the total 7,233 dwellings in Emeryville, owner-occupied units account for 2,183 (30.2%), while renter-occupied units make up 5,050 (69.8%).
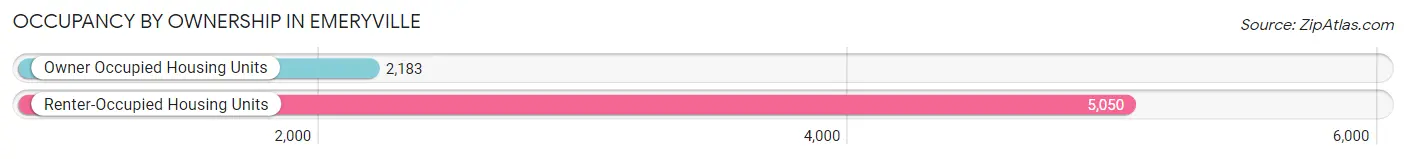
| Occupancy | # Housing Units | % Housing Units |
| Owner Occupied Housing Units | 2,183 | 30.2% |
| Renter-Occupied Housing Units | 5,050 | 69.8% |
| Total Occupied Housing Units | 7,233 | 100.0% |
Occupancy by Household Size in Emeryville
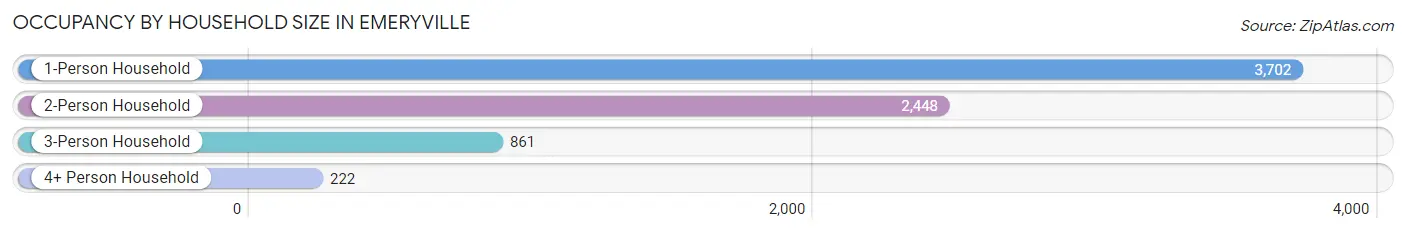
| Household Size | # Housing Units | % Housing Units |
| 1-Person Household | 3,702 | 51.2% |
| 2-Person Household | 2,448 | 33.8% |
| 3-Person Household | 861 | 11.9% |
| 4+ Person Household | 222 | 3.1% |
| Total Housing Units | 7,233 | 100.0% |
Occupancy by Ownership by Household Size in Emeryville
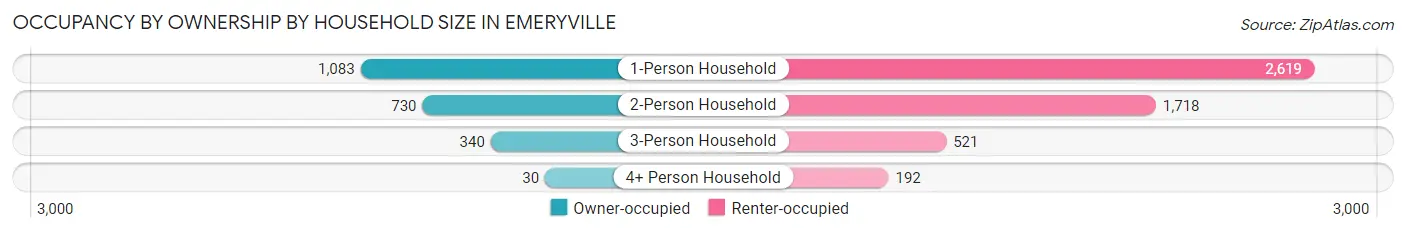
| Household Size | Owner-occupied | Renter-occupied |
| 1-Person Household | 1,083 (29.2%) | 2,619 (70.8%) |
| 2-Person Household | 730 (29.8%) | 1,718 (70.2%) |
| 3-Person Household | 340 (39.5%) | 521 (60.5%) |
| 4+ Person Household | 30 (13.5%) | 192 (86.5%) |
| Total Housing Units | 2,183 (30.2%) | 5,050 (69.8%) |
Occupancy by Educational Attainment in Emeryville
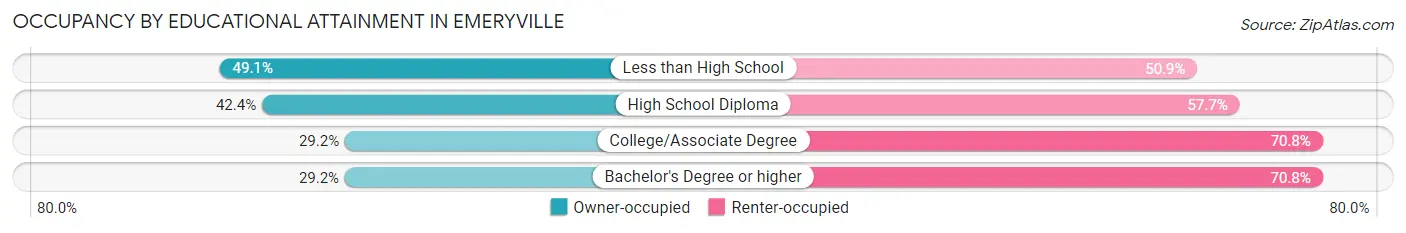
| Household Size | Owner-occupied | Renter-occupied |
| Less than High School | 78 (49.1%) | 81 (50.9%) |
| High School Diploma | 130 (42.3%) | 177 (57.7%) |
| College/Associate Degree | 435 (29.2%) | 1,056 (70.8%) |
| Bachelor's Degree or higher | 1,540 (29.2%) | 3,736 (70.8%) |
Occupancy by Age of Householder in Emeryville
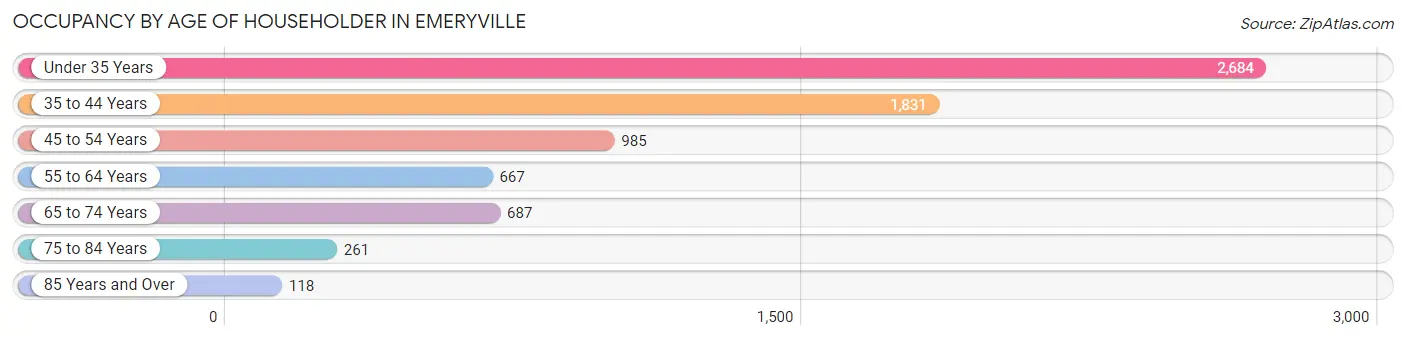
| Age Bracket | # Households | % Households |
| Under 35 Years | 2,684 | 37.1% |
| 35 to 44 Years | 1,831 | 25.3% |
| 45 to 54 Years | 985 | 13.6% |
| 55 to 64 Years | 667 | 9.2% |
| 65 to 74 Years | 687 | 9.5% |
| 75 to 84 Years | 261 | 3.6% |
| 85 Years and Over | 118 | 1.6% |
| Total | 7,233 | 100.0% |
Housing Finances in Emeryville
Median Income by Occupancy in Emeryville
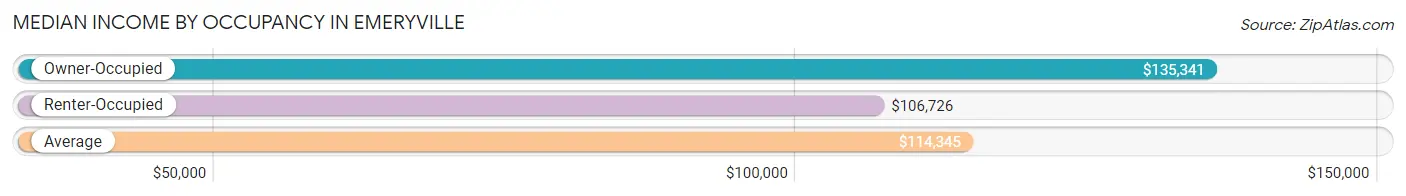
| Occupancy Type | # Households | Median Income |
| Owner-Occupied | 2,183 (30.2%) | $135,341 |
| Renter-Occupied | 5,050 (69.8%) | $106,726 |
| Average | 7,233 (100.0%) | $114,345 |
Occupancy by Householder Income Bracket in Emeryville
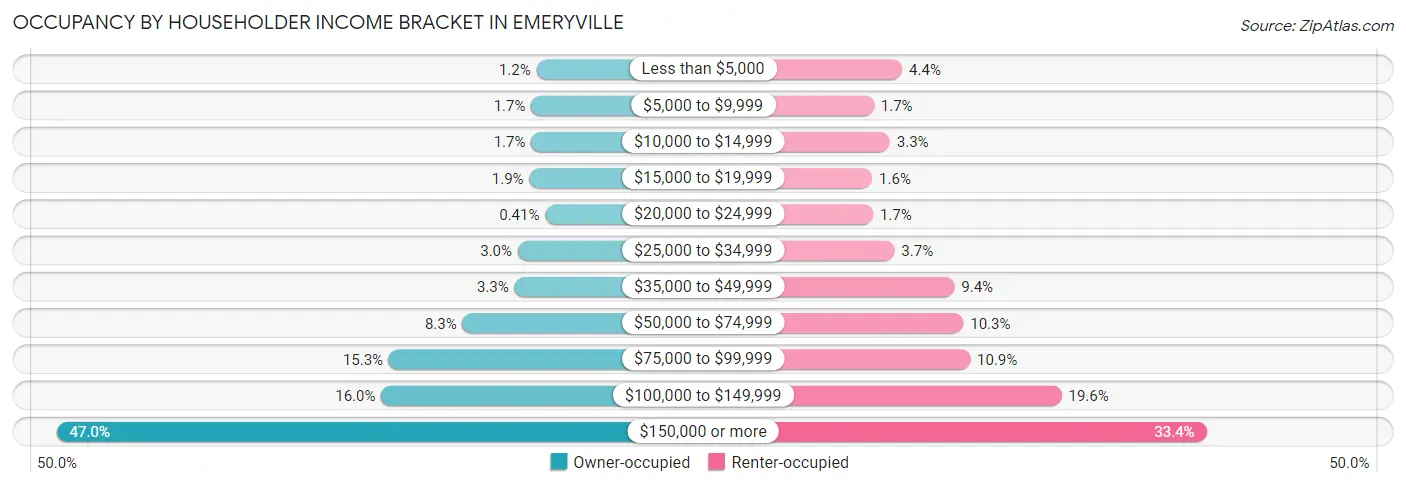
| Income Bracket | Owner-occupied | Renter-occupied |
| Less than $5,000 | 27 (1.2%) | 224 (4.4%) |
| $5,000 to $9,999 | 38 (1.7%) | 88 (1.7%) |
| $10,000 to $14,999 | 38 (1.7%) | 165 (3.3%) |
| $15,000 to $19,999 | 42 (1.9%) | 80 (1.6%) |
| $20,000 to $24,999 | 9 (0.4%) | 84 (1.7%) |
| $25,000 to $34,999 | 66 (3.0%) | 187 (3.7%) |
| $35,000 to $49,999 | 73 (3.3%) | 475 (9.4%) |
| $50,000 to $74,999 | 181 (8.3%) | 518 (10.3%) |
| $75,000 to $99,999 | 334 (15.3%) | 551 (10.9%) |
| $100,000 to $149,999 | 350 (16.0%) | 991 (19.6%) |
| $150,000 or more | 1,025 (46.9%) | 1,687 (33.4%) |
| Total | 2,183 (100.0%) | 5,050 (100.0%) |
Monthly Housing Cost Tiers in Emeryville
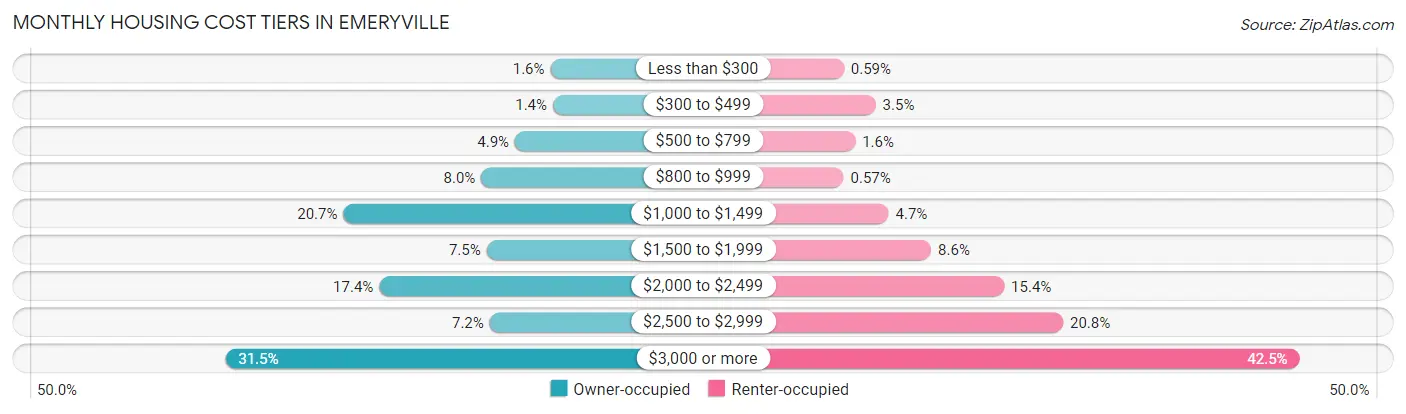
| Monthly Cost | Owner-occupied | Renter-occupied |
| Less than $300 | 35 (1.6%) | 30 (0.6%) |
| $300 to $499 | 30 (1.4%) | 178 (3.5%) |
| $500 to $799 | 106 (4.9%) | 83 (1.6%) |
| $800 to $999 | 174 (8.0%) | 29 (0.6%) |
| $1,000 to $1,499 | 451 (20.7%) | 238 (4.7%) |
| $1,500 to $1,999 | 163 (7.5%) | 436 (8.6%) |
| $2,000 to $2,499 | 379 (17.4%) | 775 (15.3%) |
| $2,500 to $2,999 | 157 (7.2%) | 1,049 (20.8%) |
| $3,000 or more | 688 (31.5%) | 2,148 (42.5%) |
| Total | 2,183 (100.0%) | 5,050 (100.0%) |
Physical Housing Characteristics in Emeryville
Housing Structures in Emeryville
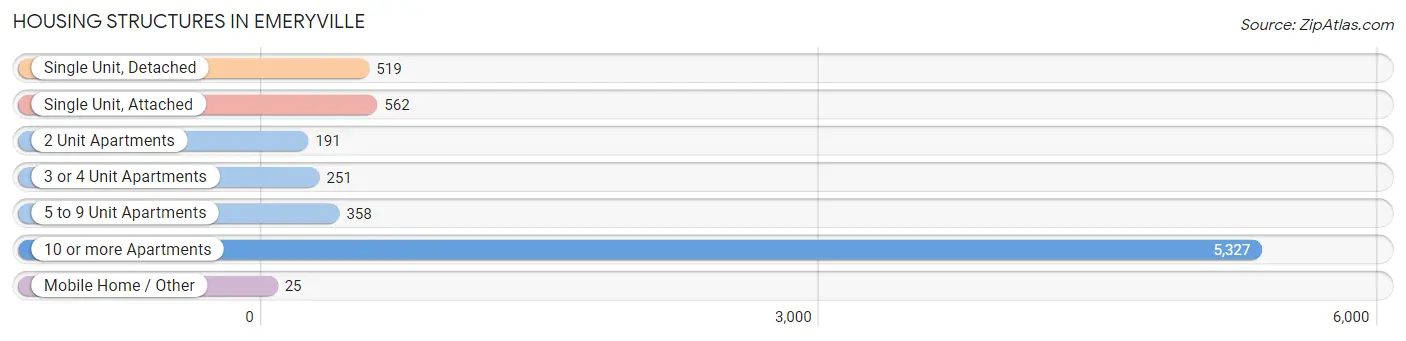
| Structure Type | # Housing Units | % Housing Units |
| Single Unit, Detached | 519 | 7.2% |
| Single Unit, Attached | 562 | 7.8% |
| 2 Unit Apartments | 191 | 2.6% |
| 3 or 4 Unit Apartments | 251 | 3.5% |
| 5 to 9 Unit Apartments | 358 | 5.0% |
| 10 or more Apartments | 5,327 | 73.7% |
| Mobile Home / Other | 25 | 0.4% |
| Total | 7,233 | 100.0% |
Housing Structures by Occupancy in Emeryville
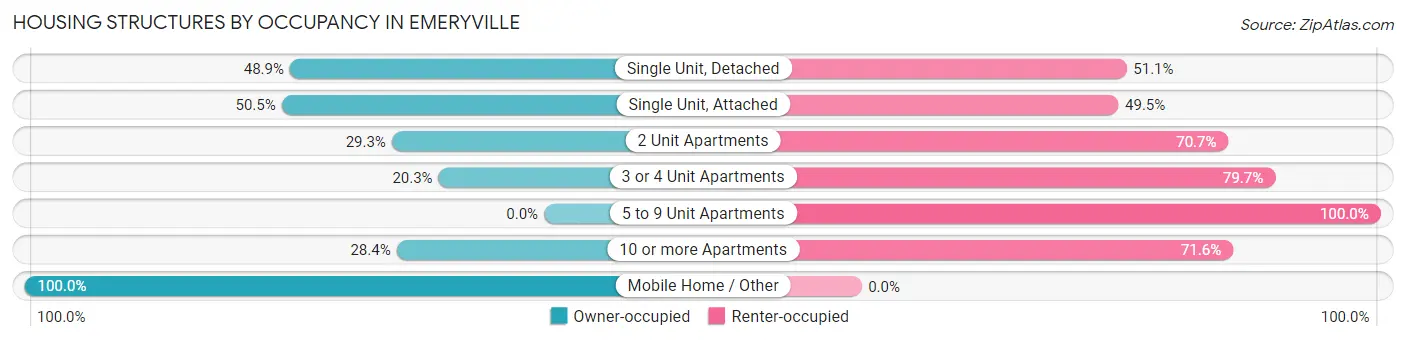
| Structure Type | Owner-occupied | Renter-occupied |
| Single Unit, Detached | 254 (48.9%) | 265 (51.1%) |
| Single Unit, Attached | 284 (50.5%) | 278 (49.5%) |
| 2 Unit Apartments | 56 (29.3%) | 135 (70.7%) |
| 3 or 4 Unit Apartments | 51 (20.3%) | 200 (79.7%) |
| 5 to 9 Unit Apartments | 0 (0.0%) | 358 (100.0%) |
| 10 or more Apartments | 1,513 (28.4%) | 3,814 (71.6%) |
| Mobile Home / Other | 25 (100.0%) | 0 (0.0%) |
| Total | 2,183 (30.2%) | 5,050 (69.8%) |
Housing Structures by Number of Rooms in Emeryville
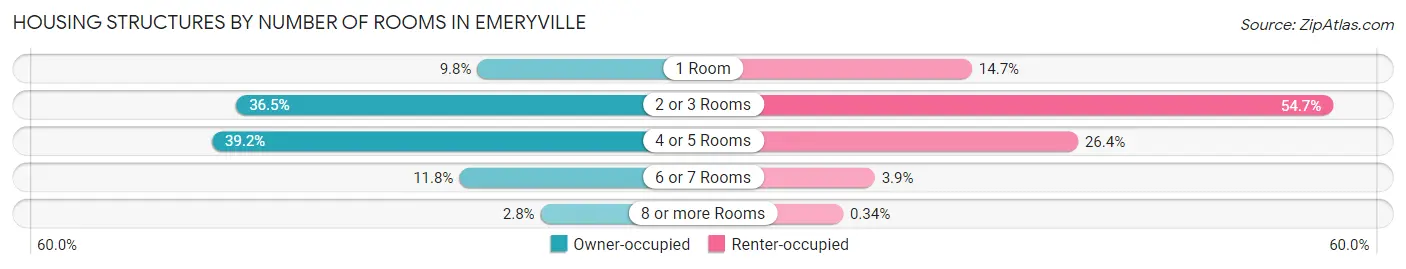
| Number of Rooms | Owner-occupied | Renter-occupied |
| 1 Room | 213 (9.8%) | 740 (14.6%) |
| 2 or 3 Rooms | 797 (36.5%) | 2,764 (54.7%) |
| 4 or 5 Rooms | 856 (39.2%) | 1,334 (26.4%) |
| 6 or 7 Rooms | 257 (11.8%) | 195 (3.9%) |
| 8 or more Rooms | 60 (2.8%) | 17 (0.3%) |
| Total | 2,183 (100.0%) | 5,050 (100.0%) |
Housing Structure by Heating Type in Emeryville
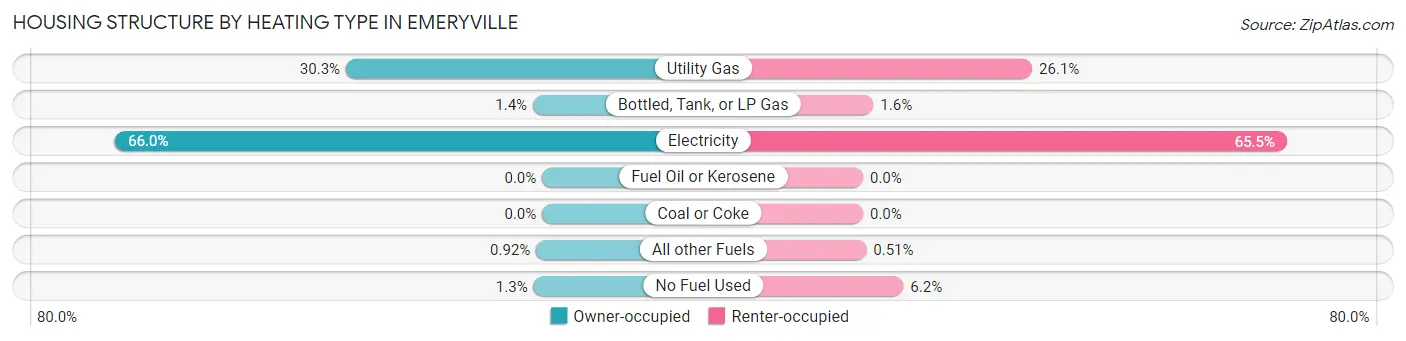
| Heating Type | Owner-occupied | Renter-occupied |
| Utility Gas | 662 (30.3%) | 1,320 (26.1%) |
| Bottled, Tank, or LP Gas | 31 (1.4%) | 81 (1.6%) |
| Electricity | 1,441 (66.0%) | 3,308 (65.5%) |
| Fuel Oil or Kerosene | 0 (0.0%) | 0 (0.0%) |
| Coal or Coke | 0 (0.0%) | 0 (0.0%) |
| All other Fuels | 20 (0.9%) | 26 (0.5%) |
| No Fuel Used | 29 (1.3%) | 315 (6.2%) |
| Total | 2,183 (100.0%) | 5,050 (100.0%) |
Household Vehicle Usage in Emeryville
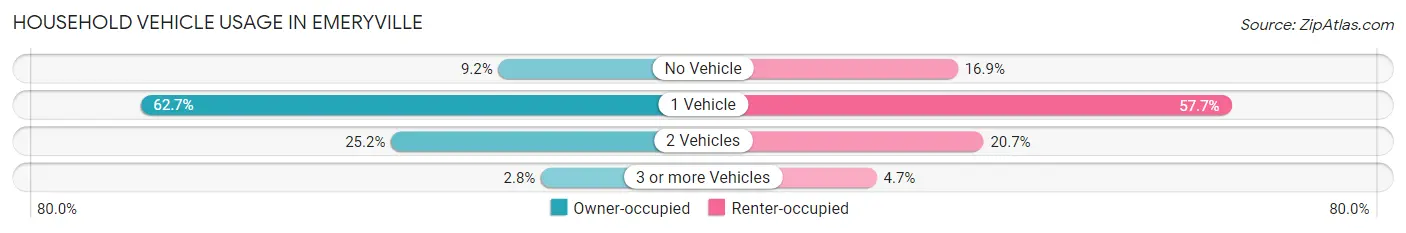
| Vehicles per Household | Owner-occupied | Renter-occupied |
| No Vehicle | 201 (9.2%) | 851 (16.9%) |
| 1 Vehicle | 1,369 (62.7%) | 2,915 (57.7%) |
| 2 Vehicles | 551 (25.2%) | 1,045 (20.7%) |
| 3 or more Vehicles | 62 (2.8%) | 239 (4.7%) |
| Total | 2,183 (100.0%) | 5,050 (100.0%) |
Real Estate & Mortgages in Emeryville
Real Estate and Mortgage Overview in Emeryville
| Characteristic | Without Mortgage | With Mortgage |
| Housing Units | 754 | 1,429 |
| Median Property Value | $575,200 | $656,000 |
| Median Household Income | $82,075 | $843 |
| Monthly Housing Costs | $1,074 | $688 |
| Real Estate Taxes | $5,407 | $84 |
Property Value by Mortgage Status in Emeryville
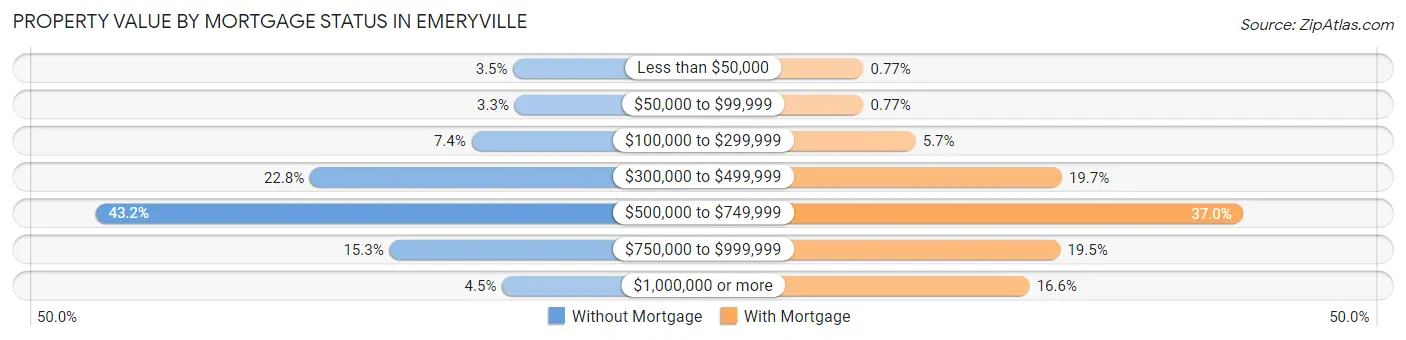
| Property Value | Without Mortgage | With Mortgage |
| Less than $50,000 | 26 (3.5%) | 11 (0.8%) |
| $50,000 to $99,999 | 25 (3.3%) | 11 (0.8%) |
| $100,000 to $299,999 | 56 (7.4%) | 82 (5.7%) |
| $300,000 to $499,999 | 172 (22.8%) | 281 (19.7%) |
| $500,000 to $749,999 | 326 (43.2%) | 528 (36.9%) |
| $750,000 to $999,999 | 115 (15.2%) | 279 (19.5%) |
| $1,000,000 or more | 34 (4.5%) | 237 (16.6%) |
| Total | 754 (100.0%) | 1,429 (100.0%) |
Household Income by Mortgage Status in Emeryville
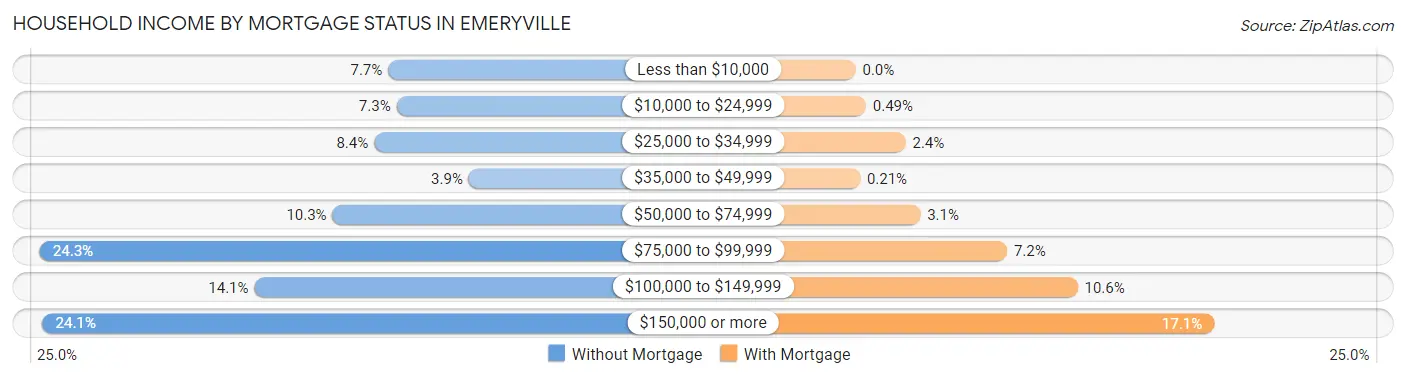
| Household Income | Without Mortgage | With Mortgage |
| Less than $10,000 | 58 (7.7%) | 0 (0.0%) |
| $10,000 to $24,999 | 55 (7.3%) | 7 (0.5%) |
| $25,000 to $34,999 | 63 (8.4%) | 34 (2.4%) |
| $35,000 to $49,999 | 29 (3.8%) | 3 (0.2%) |
| $50,000 to $74,999 | 78 (10.3%) | 44 (3.1%) |
| $75,000 to $99,999 | 183 (24.3%) | 103 (7.2%) |
| $100,000 to $149,999 | 106 (14.1%) | 151 (10.6%) |
| $150,000 or more | 182 (24.1%) | 244 (17.1%) |
| Total | 754 (100.0%) | 1,429 (100.0%) |
Property Value to Household Income Ratio in Emeryville
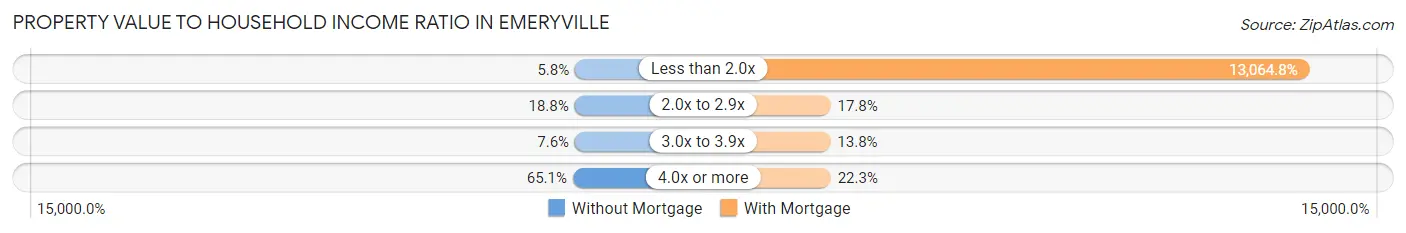
| Value-to-Income Ratio | Without Mortgage | With Mortgage |
| Less than 2.0x | 44 (5.8%) | 186,696 (13,064.8%) |
| 2.0x to 2.9x | 142 (18.8%) | 254 (17.8%) |
| 3.0x to 3.9x | 57 (7.6%) | 197 (13.8%) |
| 4.0x or more | 491 (65.1%) | 318 (22.3%) |
| Total | 754 (100.0%) | 1,429 (100.0%) |
Real Estate Taxes by Mortgage Status in Emeryville
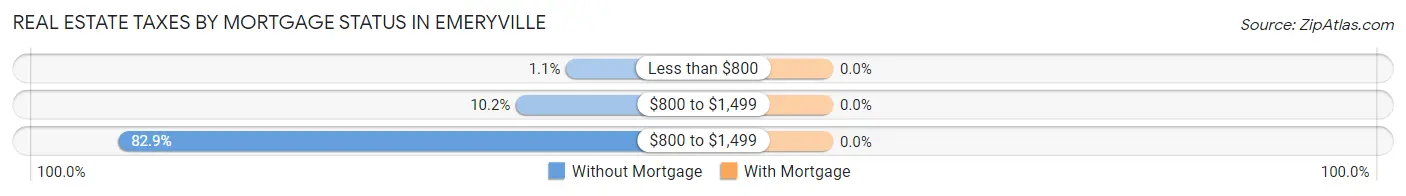
| Property Taxes | Without Mortgage | With Mortgage |
| Less than $800 | 8 (1.1%) | 0 (0.0%) |
| $800 to $1,499 | 77 (10.2%) | 0 (0.0%) |
| $800 to $1,499 | 625 (82.9%) | 0 (0.0%) |
| Total | 754 (100.0%) | 1,429 (100.0%) |
Health & Disability in Emeryville
Health Insurance Coverage by Age in Emeryville
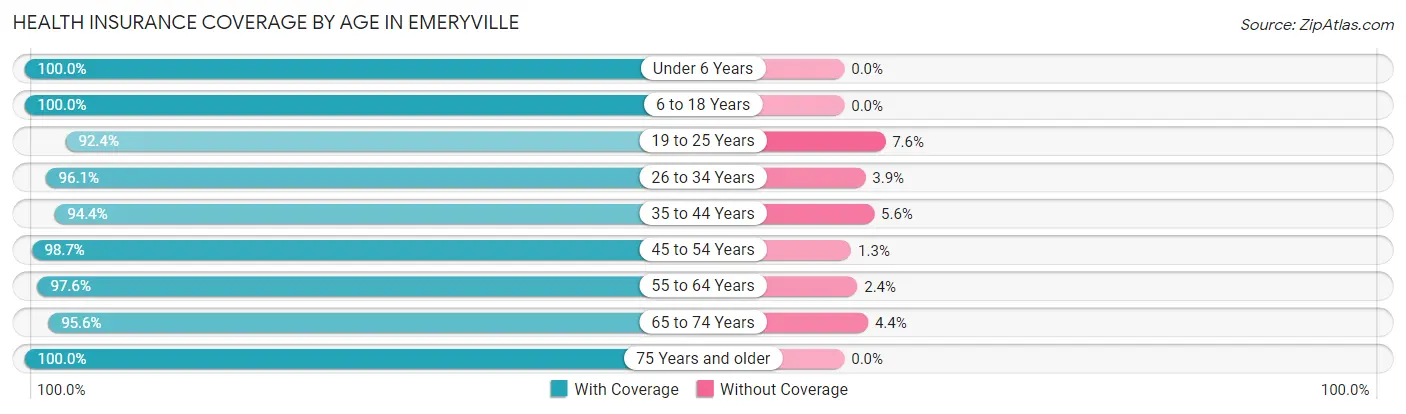
| Age Bracket | With Coverage | Without Coverage |
| Under 6 Years | 544 (100.0%) | 0 (0.0%) |
| 6 to 18 Years | 458 (100.0%) | 0 (0.0%) |
| 19 to 25 Years | 1,272 (92.4%) | 105 (7.6%) |
| 26 to 34 Years | 3,664 (96.1%) | 150 (3.9%) |
| 35 to 44 Years | 2,499 (94.4%) | 147 (5.6%) |
| 45 to 54 Years | 1,385 (98.7%) | 18 (1.3%) |
| 55 to 64 Years | 1,009 (97.6%) | 25 (2.4%) |
| 65 to 74 Years | 889 (95.6%) | 41 (4.4%) |
| 75 Years and older | 610 (100.0%) | 0 (0.0%) |
| Total | 12,330 (96.2%) | 486 (3.8%) |
Health Insurance Coverage by Citizenship Status in Emeryville
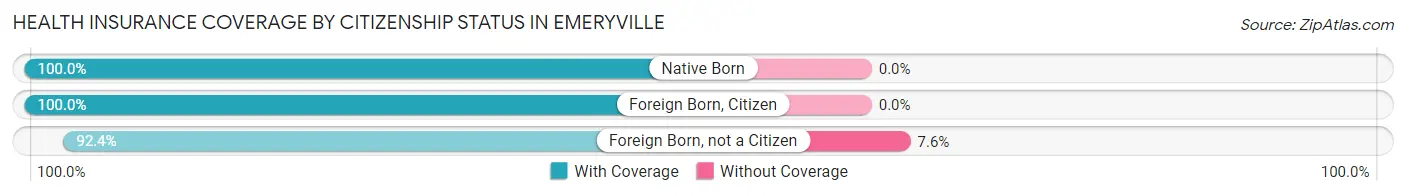
| Citizenship Status | With Coverage | Without Coverage |
| Native Born | 544 (100.0%) | 0 (0.0%) |
| Foreign Born, Citizen | 458 (100.0%) | 0 (0.0%) |
| Foreign Born, not a Citizen | 1,272 (92.4%) | 105 (7.6%) |
Health Insurance Coverage by Household Income in Emeryville
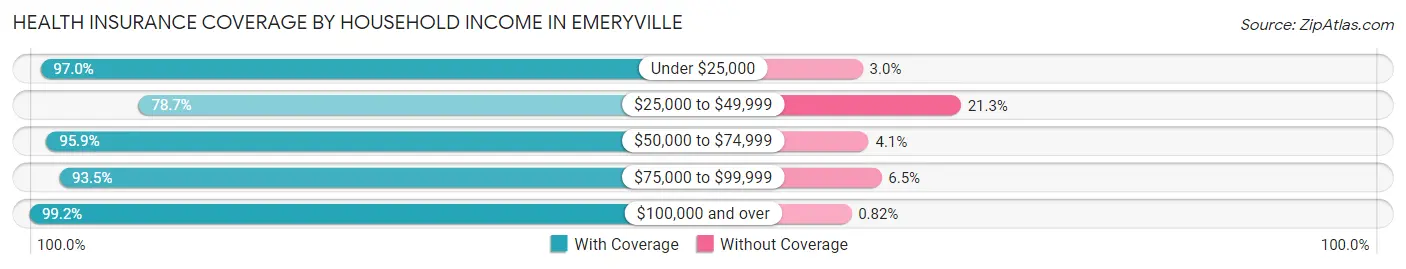
| Household Income | With Coverage | Without Coverage |
| Under $25,000 | 1,014 (97.0%) | 31 (3.0%) |
| $25,000 to $49,999 | 918 (78.7%) | 249 (21.3%) |
| $50,000 to $74,999 | 1,084 (95.9%) | 46 (4.1%) |
| $75,000 to $99,999 | 1,358 (93.5%) | 94 (6.5%) |
| $100,000 and over | 7,944 (99.2%) | 66 (0.8%) |
Public vs Private Health Insurance Coverage by Age in Emeryville
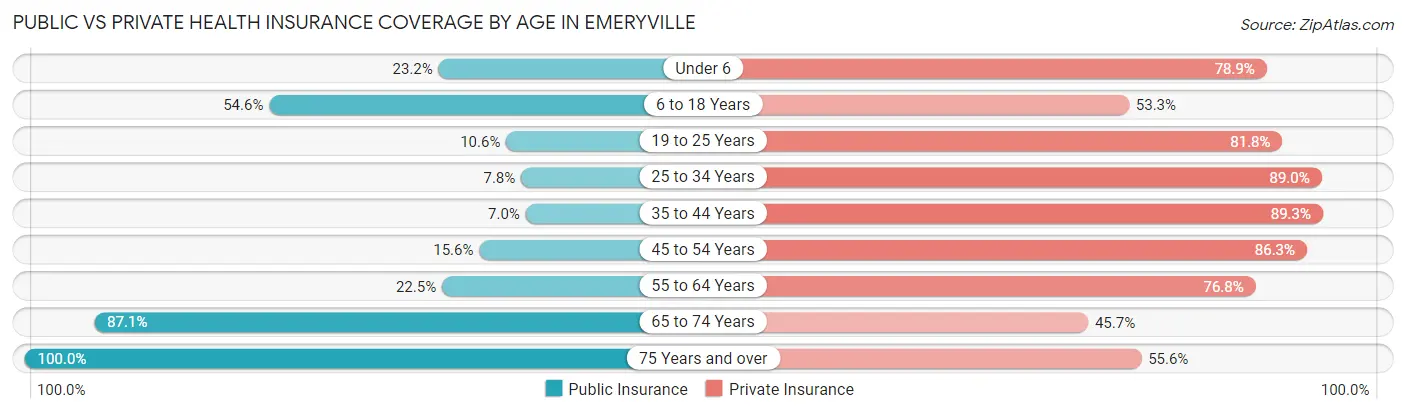
| Age Bracket | Public Insurance | Private Insurance |
| Under 6 | 126 (23.2%) | 429 (78.9%) |
| 6 to 18 Years | 250 (54.6%) | 244 (53.3%) |
| 19 to 25 Years | 146 (10.6%) | 1,126 (81.8%) |
| 25 to 34 Years | 299 (7.8%) | 3,396 (89.0%) |
| 35 to 44 Years | 185 (7.0%) | 2,362 (89.3%) |
| 45 to 54 Years | 219 (15.6%) | 1,211 (86.3%) |
| 55 to 64 Years | 233 (22.5%) | 794 (76.8%) |
| 65 to 74 Years | 810 (87.1%) | 425 (45.7%) |
| 75 Years and over | 610 (100.0%) | 339 (55.6%) |
| Total | 2,878 (22.5%) | 10,326 (80.6%) |
Disability Status by Sex by Age in Emeryville
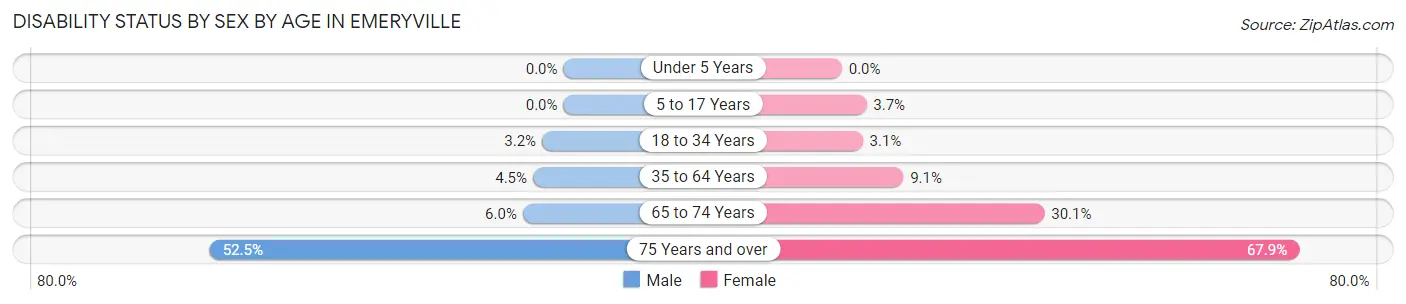
| Age Bracket | Male | Female |
| Under 5 Years | 0 (0.0%) | 0 (0.0%) |
| 5 to 17 Years | 0 (0.0%) | 7 (3.6%) |
| 18 to 34 Years | 77 (3.2%) | 86 (3.1%) |
| 35 to 64 Years | 123 (4.5%) | 216 (9.1%) |
| 65 to 74 Years | 21 (6.0%) | 175 (30.1%) |
| 75 Years and over | 147 (52.5%) | 224 (67.9%) |
Disability Class by Sex by Age in Emeryville
Disability Class: Hearing Difficulty
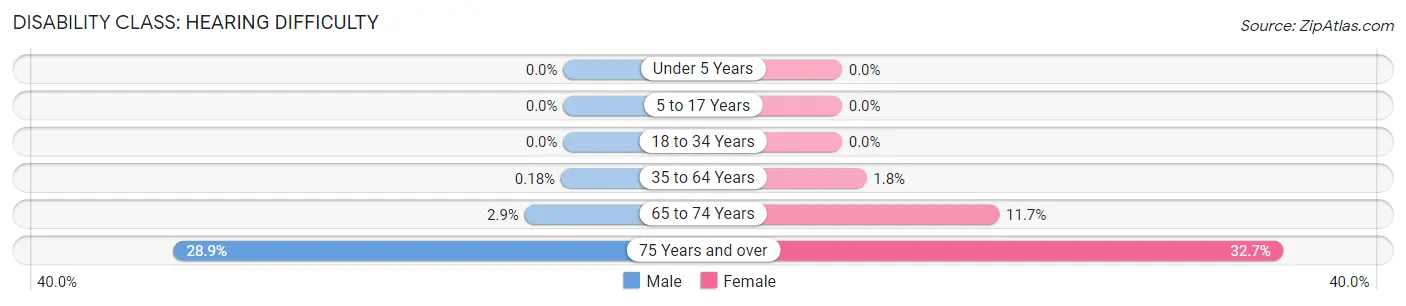
| Age Bracket | Male | Female |
| Under 5 Years | 0 (0.0%) | 0 (0.0%) |
| 5 to 17 Years | 0 (0.0%) | 0 (0.0%) |
| 18 to 34 Years | 0 (0.0%) | 0 (0.0%) |
| 35 to 64 Years | 5 (0.2%) | 43 (1.8%) |
| 65 to 74 Years | 10 (2.9%) | 68 (11.7%) |
| 75 Years and over | 81 (28.9%) | 108 (32.7%) |
Disability Class: Vision Difficulty
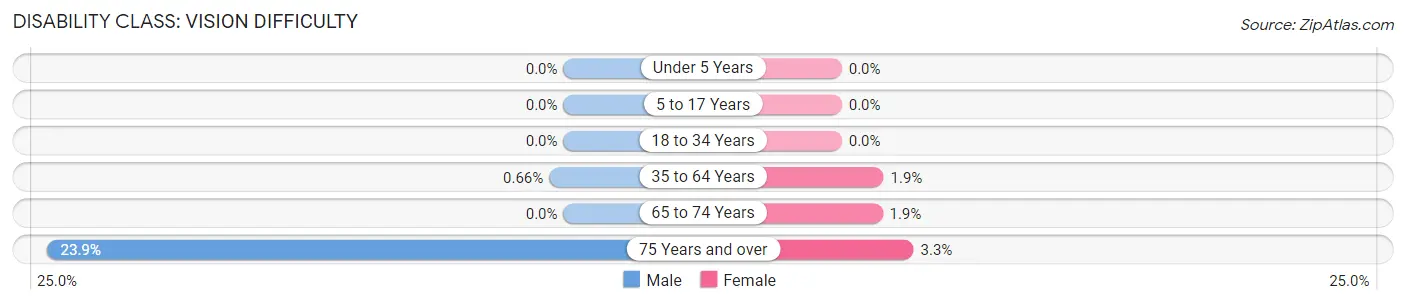
| Age Bracket | Male | Female |
| Under 5 Years | 0 (0.0%) | 0 (0.0%) |
| 5 to 17 Years | 0 (0.0%) | 0 (0.0%) |
| 18 to 34 Years | 0 (0.0%) | 0 (0.0%) |
| 35 to 64 Years | 18 (0.7%) | 46 (1.9%) |
| 65 to 74 Years | 0 (0.0%) | 11 (1.9%) |
| 75 Years and over | 67 (23.9%) | 11 (3.3%) |
Disability Class: Cognitive Difficulty
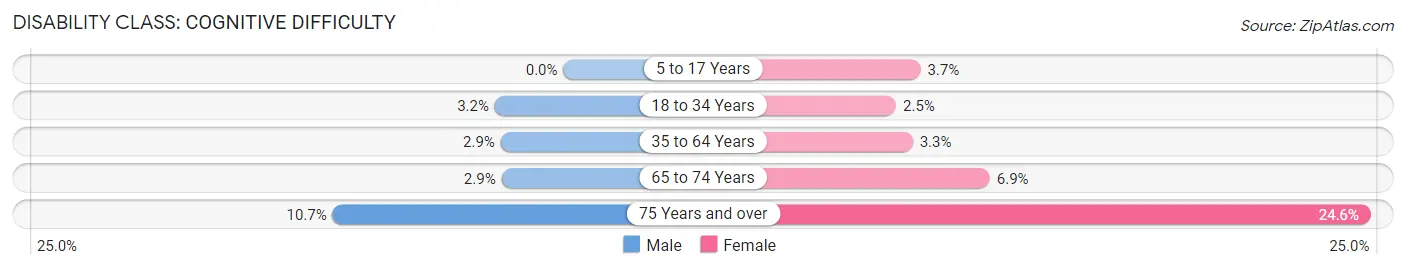
| Age Bracket | Male | Female |
| 5 to 17 Years | 0 (0.0%) | 7 (3.6%) |
| 18 to 34 Years | 77 (3.2%) | 70 (2.5%) |
| 35 to 64 Years | 79 (2.9%) | 78 (3.3%) |
| 65 to 74 Years | 10 (2.9%) | 40 (6.9%) |
| 75 Years and over | 30 (10.7%) | 81 (24.5%) |
Disability Class: Ambulatory Difficulty
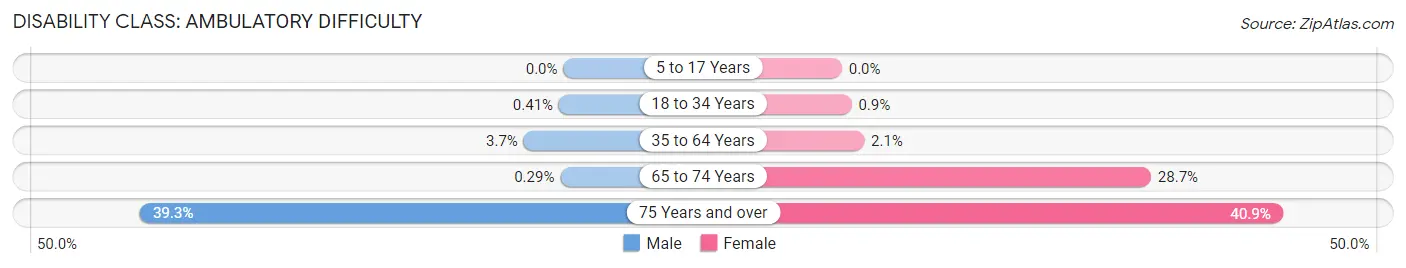
| Age Bracket | Male | Female |
| 5 to 17 Years | 0 (0.0%) | 0 (0.0%) |
| 18 to 34 Years | 10 (0.4%) | 25 (0.9%) |
| 35 to 64 Years | 100 (3.7%) | 49 (2.1%) |
| 65 to 74 Years | 1 (0.3%) | 167 (28.7%) |
| 75 Years and over | 110 (39.3%) | 135 (40.9%) |
Disability Class: Self-Care Difficulty
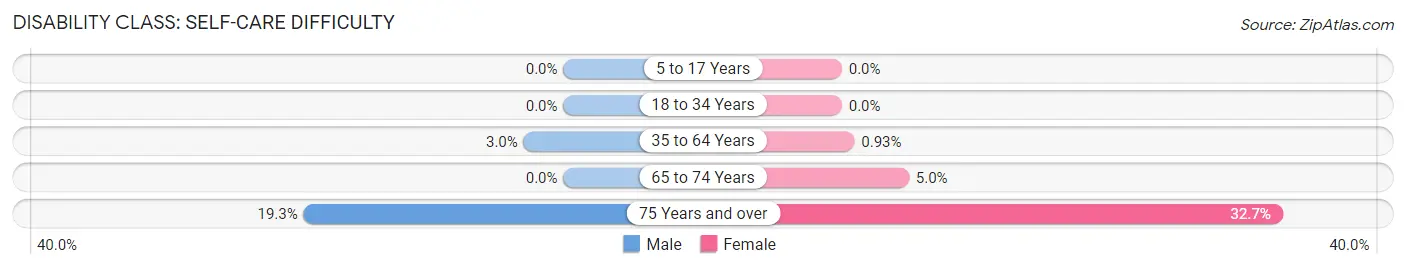
| Age Bracket | Male | Female |
| 5 to 17 Years | 0 (0.0%) | 0 (0.0%) |
| 18 to 34 Years | 0 (0.0%) | 0 (0.0%) |
| 35 to 64 Years | 80 (2.9%) | 22 (0.9%) |
| 65 to 74 Years | 0 (0.0%) | 29 (5.0%) |
| 75 Years and over | 54 (19.3%) | 108 (32.7%) |
Technology Access in Emeryville
Computing Device Access in Emeryville
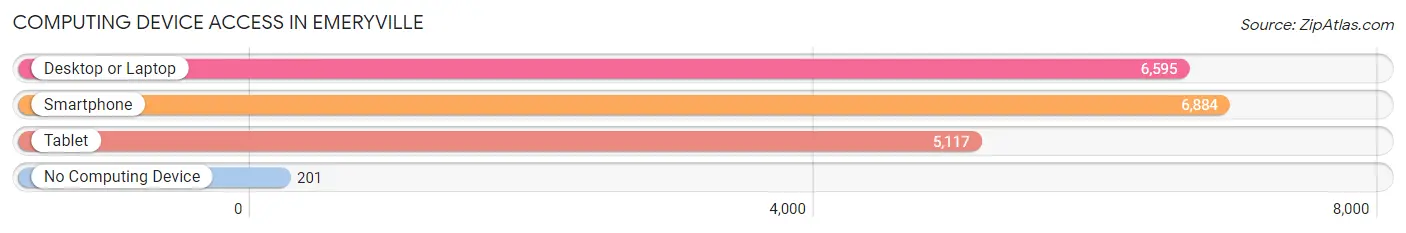
| Device Type | # Households | % Households |
| Desktop or Laptop | 6,595 | 91.2% |
| Smartphone | 6,884 | 95.2% |
| Tablet | 5,117 | 70.8% |
| No Computing Device | 201 | 2.8% |
| Total | 7,233 | 100.0% |
Internet Access in Emeryville
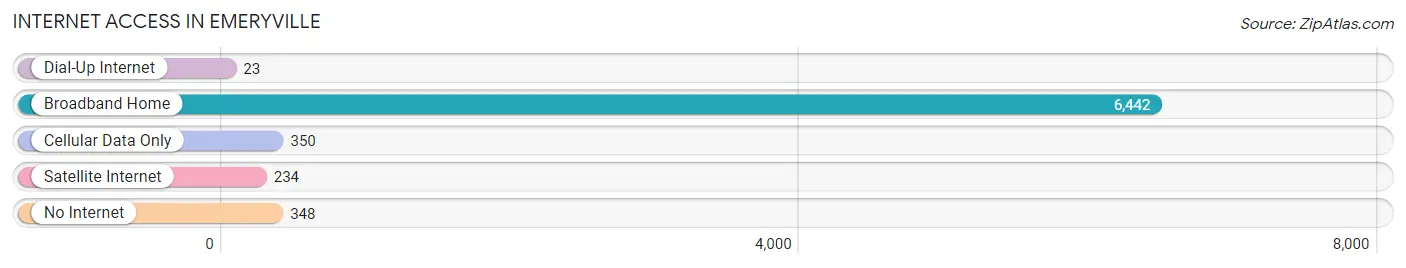
| Internet Type | # Households | % Households |
| Dial-Up Internet | 23 | 0.3% |
| Broadband Home | 6,442 | 89.1% |
| Cellular Data Only | 350 | 4.8% |
| Satellite Internet | 234 | 3.2% |
| No Internet | 348 | 4.8% |
| Total | 7,233 | 100.0% |
Emeryville Summary
Emeryville, California is a small city located in the San Francisco Bay Area, just north of Oakland. It is bordered by Berkeley to the south, Oakland to the east, and the San Francisco Bay to the west. The city is home to a population of approximately 10,000 people, making it one of the smallest cities in the Bay Area.
History
The area that is now Emeryville was originally inhabited by the Ohlone people, who lived in the area for thousands of years before the arrival of Europeans. The first Europeans to settle in the area were the Spanish, who established a mission in the area in 1776. The area was then part of the Rancho San Antonio land grant, which was granted to Luis Maria Peralta in 1820.
In the late 19th century, the area was developed as a resort town, with the opening of the Emeryville Race Track in 1881. The track was a popular destination for horse racing and gambling, and it attracted many visitors from the Bay Area and beyond. The track closed in 1898, but the area continued to be developed as a resort town, with the opening of the Emeryville Hotel in 1901.
In the early 20th century, the area began to be developed as an industrial center, with the opening of the Pacific Coast Steel Company in 1906. The company was the first steel mill in the Bay Area, and it attracted many workers to the area. The city of Emeryville was incorporated in 1917, and the city continued to grow as an industrial center throughout the 20th century.
Geography
Emeryville is located in the San Francisco Bay Area, just north of Oakland. It is bordered by Berkeley to the south, Oakland to the east, and the San Francisco Bay to the west. The city covers an area of 2.5 square miles, and it is located at an elevation of 13 feet above sea level.
The city is located on the eastern shore of San Francisco Bay, and it is connected to the rest of the Bay Area by the Bay Bridge and the San Francisco-Oakland Bay Bridge. The city is also served by several major highways, including Interstate 80, Interstate 580, and Interstate 880.
Economy
Emeryville is home to a diverse economy, with a mix of industries including retail, manufacturing, technology, and biotechnology. The city is home to several major employers, including Pixar Animation Studios, Novartis, Clorox, and Peet's Coffee & Tea.
The city is also home to a number of shopping centers, including Bay Street Emeryville, which is home to a variety of stores and restaurants. The city is also home to a number of art galleries, theaters, and other cultural attractions.
Demographics
As of the 2010 census, Emeryville had a population of 10,080 people. The population is racially diverse, with the largest racial groups being White (44.3%), African American (25.2%), Asian (17.2%), and Hispanic or Latino (7.7%).
The median household income in Emeryville is $76,837, and the median home value is $717,400. The city has a high cost of living, with the median rent being $2,400 per month.
Conclusion
Emeryville, California is a small city located in the San Francisco Bay Area, just north of Oakland. It is bordered by Berkeley to the south, Oakland to the east, and the San Francisco Bay to the west. The city is home to a population of approximately 10,000 people, making it one of the smallest cities in the Bay Area. The city has a diverse economy, with a mix of industries including retail, manufacturing, technology, and biotechnology. The population is racially diverse, with the largest racial groups being White, African American, Asian, and Hispanic or Latino. The city has a high cost of living, with the median rent being $2,400 per month.
Common Questions
What is Per Capita Income in Emeryville?
Per Capita income in Emeryville is $83,173.
What is the Median Family Income in Emeryville?
Median Family Income in Emeryville is $168,813.
What is the Median Household income in Emeryville?
Median Household Income in Emeryville is $114,345.
What is Income or Wage Gap in Emeryville?
Income or Wage Gap in Emeryville is 21.5%.
Women in Emeryville earn 78.5 cents for every dollar earned by a man.
What is Inequality or Gini Index in Emeryville?
Inequality or Gini Index in Emeryville is 0.44.
What is the Total Population of Emeryville?
Total Population of Emeryville is 12,840.
What is the Total Male Population of Emeryville?
Total Male Population of Emeryville is 6,339.
What is the Total Female Population of Emeryville?
Total Female Population of Emeryville is 6,501.
What is the Ratio of Males per 100 Females in Emeryville?
There are 97.51 Males per 100 Females in Emeryville.
What is the Ratio of Females per 100 Males in Emeryville?
There are 102.56 Females per 100 Males in Emeryville.
What is the Median Population Age in Emeryville?
Median Population Age in Emeryville is 35.8 Years.
What is the Average Family Size in Emeryville
Average Family Size in Emeryville is 2.5 People.
What is the Average Household Size in Emeryville
Average Household Size in Emeryville is 1.8 People.
How Large is the Labor Force in Emeryville?
There are 9,209 People in the Labor Forcein in Emeryville.
What is the Percentage of People in the Labor Force in Emeryville?
77.3% of People are in the Labor Force in Emeryville.
What is the Unemployment Rate in Emeryville?
Unemployment Rate in Emeryville is 4.9%.