Cities with the Highest Percentage of Population Employed in Computer, Engineering & Science in Indiana
RELATED REPORTS & OPTIONS
Computer, Engineering & Science
Indiana
Compare Cities
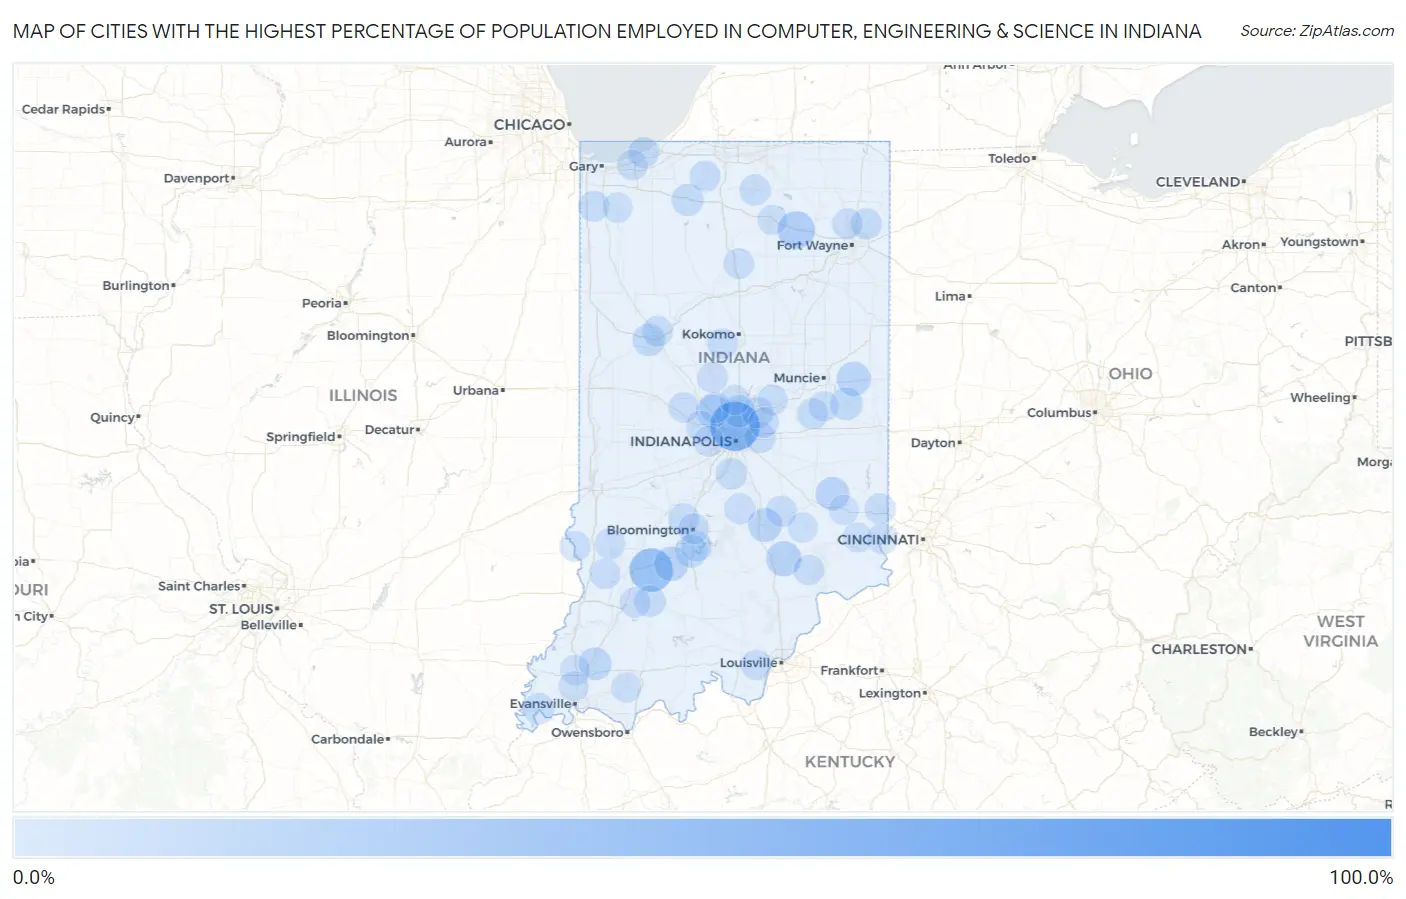
Map of Cities with the Highest Percentage of Population Employed in Computer, Engineering & Science in Indiana
0.0%
100.0%
Cities with the Highest Percentage of Population Employed in Computer, Engineering & Science in Indiana
| City | % Employed | vs State | vs National | |
| 1. | Sandusky | 100.0% | 5.5%(+94.5)#1 | 6.8%(+93.2)#19 |
| 2. | Lake Cicott | 67.6% | 5.5%(+62.2)#2 | 6.8%(+60.9)#34 |
| 3. | North Crows Nest | 58.1% | 5.5%(+52.7)#3 | 6.8%(+51.4)#43 |
| 4. | Linnsburg | 52.6% | 5.5%(+47.2)#4 | 6.8%(+45.9)#64 |
| 5. | Crane | 42.4% | 5.5%(+37.0)#5 | 6.8%(+35.7)#104 |
| 6. | Centerton | 41.3% | 5.5%(+35.8)#6 | 6.8%(+34.5)#107 |
| 7. | Petroleum | 37.5% | 5.5%(+32.0)#7 | 6.8%(+30.7)#133 |
| 8. | Andersonville | 36.0% | 5.5%(+30.5)#8 | 6.8%(+29.2)#146 |
| 9. | Craigville | 34.9% | 5.5%(+29.5)#9 | 6.8%(+28.2)#155 |
| 10. | Rob Roy | 31.8% | 5.5%(+26.4)#10 | 6.8%(+25.1)#185 |
| 11. | Hoffman Lake | 31.3% | 5.5%(+25.8)#11 | 6.8%(+24.5)#197 |
| 12. | Marietta | 29.6% | 5.5%(+24.1)#12 | 6.8%(+22.8)#228 |
| 13. | Larwill | 26.5% | 5.5%(+21.0)#13 | 6.8%(+19.7)#299 |
| 14. | Beaver Dam | 25.9% | 5.5%(+20.5)#14 | 6.8%(+19.2)#309 |
| 15. | Fair Oaks | 25.0% | 5.5%(+19.5)#15 | 6.8%(+18.2)#330 |
| 16. | East Oolitic | 24.1% | 5.5%(+18.7)#16 | 6.8%(+17.4)#358 |
| 17. | Arcola | 23.3% | 5.5%(+17.8)#17 | 6.8%(+16.5)#384 |
| 18. | Schaefer Lake | 23.1% | 5.5%(+17.6)#18 | 6.8%(+16.3)#394 |
| 19. | Groverton | 22.2% | 5.5%(+16.8)#19 | 6.8%(+15.5)#432 |
| 20. | Pleasant Mills | 21.7% | 5.5%(+16.2)#20 | 6.8%(+14.9)#465 |
| 21. | Otter Lake | 21.1% | 5.5%(+15.7)#21 | 6.8%(+14.4)#499 |
| 22. | Hayden | 20.9% | 5.5%(+15.4)#22 | 6.8%(+14.1)#514 |
| 23. | Nineveh | 19.8% | 5.5%(+14.4)#23 | 6.8%(+13.1)#563 |
| 24. | St. Omer | 19.4% | 5.5%(+14.0)#24 | 6.8%(+12.7)#596 |
| 25. | Brimfield | 19.3% | 5.5%(+13.8)#25 | 6.8%(+12.5)#607 |
| 26. | Owensburg | 19.0% | 5.5%(+13.6)#26 | 6.8%(+12.3)#627 |
| 27. | Farmland | 18.5% | 5.5%(+13.0)#27 | 6.8%(+11.7)#680 |
| 28. | Belleville | 18.0% | 5.5%(+12.5)#28 | 6.8%(+11.2)#735 |
| 29. | Columbus | 17.9% | 5.5%(+12.4)#29 | 6.8%(+11.1)#738 |
| 30. | Stewartsville | 17.5% | 5.5%(+12.1)#30 | 6.8%(+10.8)#770 |
| 31. | Lake Santee | 16.9% | 5.5%(+11.5)#31 | 6.8%(+10.2)#839 |
| 32. | Charlottesville | 16.2% | 5.5%(+10.7)#32 | 6.8%(+9.45)#929 |
| 33. | Whitestown | 16.1% | 5.5%(+10.7)#33 | 6.8%(+9.35)#946 |
| 34. | Ireland | 15.9% | 5.5%(+10.4)#34 | 6.8%(+9.11)#981 |
| 35. | St. Anthony | 15.8% | 5.5%(+10.4)#35 | 6.8%(+9.06)#988 |
| 36. | Mackey | 15.4% | 5.5%(+9.92)#36 | 6.8%(+8.62)#1,062 |
| 37. | Wawaka | 15.4% | 5.5%(+9.92)#37 | 6.8%(+8.62)#1,064 |
| 38. | Losantville | 14.8% | 5.5%(+9.35)#38 | 6.8%(+8.05)#1,172 |
| 39. | Harrodsburg | 14.5% | 5.5%(+9.04)#39 | 6.8%(+7.74)#1,235 |
| 40. | West Lafayette | 14.3% | 5.5%(+8.81)#40 | 6.8%(+7.51)#1,282 |
| 41. | Carmel | 13.9% | 5.5%(+8.46)#41 | 6.8%(+7.17)#1,350 |
| 42. | Fishersburg | 13.3% | 5.5%(+7.80)#42 | 6.8%(+6.50)#1,559 |
| 43. | Hamlet | 13.0% | 5.5%(+7.55)#43 | 6.8%(+6.25)#1,625 |
| 44. | Cory | 12.8% | 5.5%(+7.32)#44 | 6.8%(+6.03)#1,699 |
| 45. | Loogootee | 11.8% | 5.5%(+6.37)#45 | 6.8%(+5.07)#1,995 |
| 46. | Bargersville | 11.6% | 5.5%(+6.11)#46 | 6.8%(+4.81)#2,081 |
| 47. | Pleasant Lake | 11.5% | 5.5%(+6.02)#47 | 6.8%(+4.72)#2,124 |
| 48. | Mount Vernon | 11.4% | 5.5%(+5.92)#48 | 6.8%(+4.63)#2,171 |
| 49. | Cumberland | 11.4% | 5.5%(+5.92)#49 | 6.8%(+4.62)#2,175 |
| 50. | Antioch | 11.1% | 5.5%(+5.64)#50 | 6.8%(+4.35)#2,316 |
| 51. | Leo Cedarville | 11.1% | 5.5%(+5.63)#51 | 6.8%(+4.33)#2,332 |
| 52. | Fishers | 11.0% | 5.5%(+5.57)#52 | 6.8%(+4.27)#2,356 |
| 53. | Hope | 11.0% | 5.5%(+5.49)#53 | 6.8%(+4.19)#2,396 |
| 54. | Cadiz | 10.9% | 5.5%(+5.44)#54 | 6.8%(+4.14)#2,412 |
| 55. | Smithville Sanders | 10.9% | 5.5%(+5.40)#55 | 6.8%(+4.10)#2,439 |
| 56. | Nappanee | 10.8% | 5.5%(+5.29)#56 | 6.8%(+3.99)#2,487 |
| 57. | Lake Dalecarlia | 10.8% | 5.5%(+5.29)#57 | 6.8%(+3.99)#2,491 |
| 58. | Beverly Shores | 10.7% | 5.5%(+5.25)#58 | 6.8%(+3.95)#2,510 |
| 59. | North Liberty | 10.6% | 5.5%(+5.13)#59 | 6.8%(+3.83)#2,580 |
| 60. | New Trenton | 10.6% | 5.5%(+5.09)#60 | 6.8%(+3.79)#2,603 |
| 61. | Ellettsville | 10.6% | 5.5%(+5.08)#61 | 6.8%(+3.79)#2,608 |
| 62. | Zionsville | 10.4% | 5.5%(+4.95)#62 | 6.8%(+3.65)#2,681 |
| 63. | Kirklin | 10.4% | 5.5%(+4.93)#63 | 6.8%(+3.63)#2,699 |
| 64. | Pittsboro | 10.3% | 5.5%(+4.85)#64 | 6.8%(+3.56)#2,742 |
| 65. | Merom | 10.2% | 5.5%(+4.70)#65 | 6.8%(+3.40)#2,837 |
| 66. | Dugger | 10.1% | 5.5%(+4.66)#66 | 6.8%(+3.37)#2,863 |
| 67. | Bloomington | 10.1% | 5.5%(+4.59)#67 | 6.8%(+3.29)#2,912 |
| 68. | Floyds Knobs | 10.0% | 5.5%(+4.57)#68 | 6.8%(+3.27)#2,917 |
| 69. | Russiaville | 10.0% | 5.5%(+4.53)#69 | 6.8%(+3.24)#2,940 |
| 70. | Battle Ground | 9.9% | 5.5%(+4.47)#70 | 6.8%(+3.17)#2,985 |
| 71. | Cordry Sweetwater Lakes | 9.9% | 5.5%(+4.45)#71 | 6.8%(+3.15)#2,996 |
| 72. | Montgomery | 9.9% | 5.5%(+4.42)#72 | 6.8%(+3.13)#3,010 |
| 73. | Huntertown | 9.8% | 5.5%(+4.35)#73 | 6.8%(+3.06)#3,058 |
| 74. | Underwood | 9.8% | 5.5%(+4.31)#74 | 6.8%(+3.01)#3,090 |
| 75. | Avon | 9.7% | 5.5%(+4.28)#75 | 6.8%(+2.98)#3,117 |
| 76. | Lawrenceburg | 9.7% | 5.5%(+4.26)#76 | 6.8%(+2.96)#3,137 |
| 77. | Macy | 9.7% | 5.5%(+4.25)#77 | 6.8%(+2.96)#3,141 |
| 78. | Newbern | 9.6% | 5.5%(+4.11)#78 | 6.8%(+2.81)#3,258 |
| 79. | Freelandville | 9.5% | 5.5%(+4.04)#79 | 6.8%(+2.74)#3,310 |
| 80. | Chesterton | 9.4% | 5.5%(+3.98)#80 | 6.8%(+2.68)#3,352 |
| 81. | Lapel | 9.3% | 5.5%(+3.84)#81 | 6.8%(+2.54)#3,459 |
| 82. | Lake Of The Woods | 9.2% | 5.5%(+3.72)#82 | 6.8%(+2.42)#3,559 |
| 83. | Dupont | 9.2% | 5.5%(+3.71)#83 | 6.8%(+2.41)#3,565 |
| 84. | Advance | 9.2% | 5.5%(+3.70)#84 | 6.8%(+2.41)#3,569 |
| 85. | Lanesville | 9.2% | 5.5%(+3.68)#85 | 6.8%(+2.39)#3,584 |
| 86. | Flat Rock | 9.1% | 5.5%(+3.62)#86 | 6.8%(+2.33)#3,632 |
| 87. | Mccordsville | 9.1% | 5.5%(+3.62)#87 | 6.8%(+2.32)#3,645 |
| 88. | Tennyson | 9.0% | 5.5%(+3.49)#88 | 6.8%(+2.19)#3,751 |
| 89. | Mount Summit | 8.9% | 5.5%(+3.39)#89 | 6.8%(+2.10)#3,847 |
| 90. | Hebron | 8.8% | 5.5%(+3.37)#90 | 6.8%(+2.07)#3,876 |
| 91. | Warsaw | 8.7% | 5.5%(+3.27)#91 | 6.8%(+1.97)#3,953 |
| 92. | Westfield | 8.6% | 5.5%(+3.17)#92 | 6.8%(+1.87)#4,037 |
| 93. | Moores Hill | 8.4% | 5.5%(+2.93)#93 | 6.8%(+1.64)#4,265 |
| 94. | Benton | 8.4% | 5.5%(+2.93)#94 | 6.8%(+1.63)#4,270 |
| 95. | Westport | 8.4% | 5.5%(+2.93)#95 | 6.8%(+1.63)#4,275 |
| 96. | Duneland Beach | 8.3% | 5.5%(+2.87)#96 | 6.8%(+1.57)#4,332 |
| 97. | Batesville | 8.3% | 5.5%(+2.84)#97 | 6.8%(+1.54)#4,369 |
| 98. | Haubstadt | 8.3% | 5.5%(+2.83)#98 | 6.8%(+1.53)#4,376 |
| 99. | Reddington | 8.2% | 5.5%(+2.77)#99 | 6.8%(+1.47)#4,433 |
| 100. | Darmstadt | 8.2% | 5.5%(+2.75)#100 | 6.8%(+1.45)#4,449 |
Common Questions
What are the Top 10 Cities with the Highest Percentage of Population Employed in Computer, Engineering & Science in Indiana?
Top 10 Cities with the Highest Percentage of Population Employed in Computer, Engineering & Science in Indiana are:
#1
58.1%
#2
42.4%
#3
26.5%
#4
20.9%
#5
19.0%
#6
18.5%
#7
17.9%
#8
16.9%
#9
16.1%
#10
15.4%
What city has the Highest Percentage of Population Employed in Computer, Engineering & Science in Indiana?
North Crows Nest has the Highest Percentage of Population Employed in Computer, Engineering & Science in Indiana with 58.1%.
What is the Percentage of Population Employed in Computer, Engineering & Science in the State of Indiana?
Percentage of Population Employed in Computer, Engineering & Science in Indiana is 5.5%.
What is the Percentage of Population Employed in Computer, Engineering & Science in the United States?
Percentage of Population Employed in Computer, Engineering & Science in the United States is 6.8%.