Zip Codes with the Highest Percentage of Population Employed in Computer, Engineering & Science in Oroville, CA
RELATED REPORTS & OPTIONS
Computer, Engineering & Science
Oroville
Compare Zip Codes
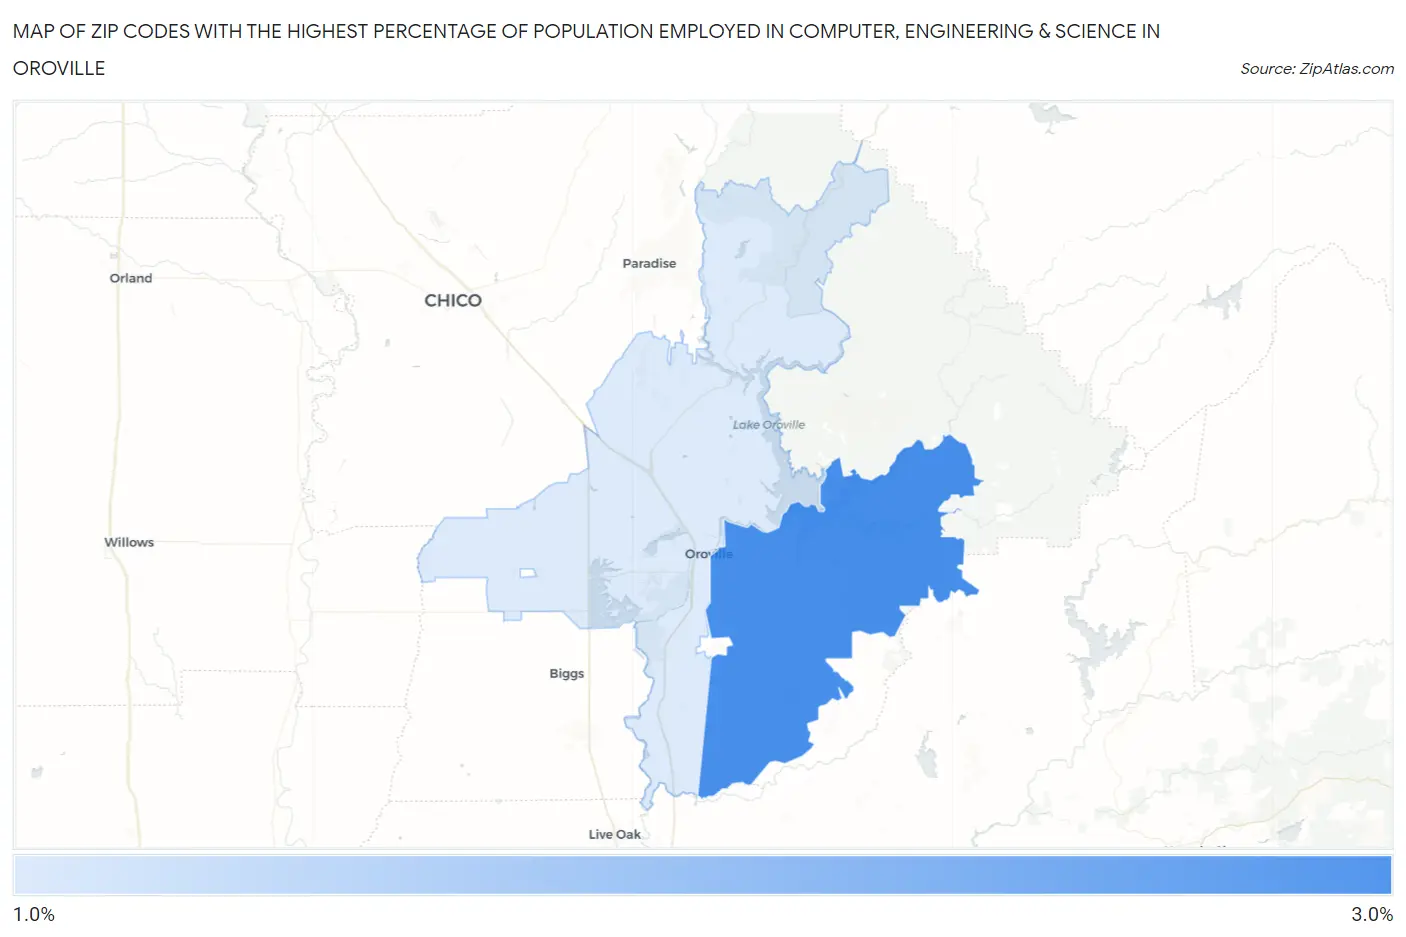
Map of Zip Codes with the Highest Percentage of Population Employed in Computer, Engineering & Science in Oroville
1.3%
2.9%
Zip Codes with the Highest Percentage of Population Employed in Computer, Engineering & Science in Oroville, CA
| Zip Code | % Employed | vs State | vs National | |
| 1. | 95966 | 2.9% | 8.0%(-5.06)#1,201 | 6.8%(-3.86)#18,464 |
| 2. | 95965 | 1.3% | 8.0%(-6.65)#1,423 | 6.8%(-5.45)#24,160 |
1
Common Questions
What are the Top Zip Codes with the Highest Percentage of Population Employed in Computer, Engineering & Science in Oroville, CA?
Top Zip Codes with the Highest Percentage of Population Employed in Computer, Engineering & Science in Oroville, CA are:
What zip code has the Highest Percentage of Population Employed in Computer, Engineering & Science in Oroville, CA?
95966 has the Highest Percentage of Population Employed in Computer, Engineering & Science in Oroville, CA with 2.9%.
What is the Percentage of Population Employed in Computer, Engineering & Science in Oroville, CA?
Percentage of Population Employed in Computer, Engineering & Science in Oroville is 2.6%.
What is the Percentage of Population Employed in Computer, Engineering & Science in California?
Percentage of Population Employed in Computer, Engineering & Science in California is 8.0%.
What is the Percentage of Population Employed in Computer, Engineering & Science in the United States?
Percentage of Population Employed in Computer, Engineering & Science in the United States is 6.8%.