Zip Codes with the Highest Percentage of Population Employed in Computer, Engineering & Science in Rancho Cordova, CA
RELATED REPORTS & OPTIONS
Computer, Engineering & Science
Rancho Cordova
Compare Zip Codes
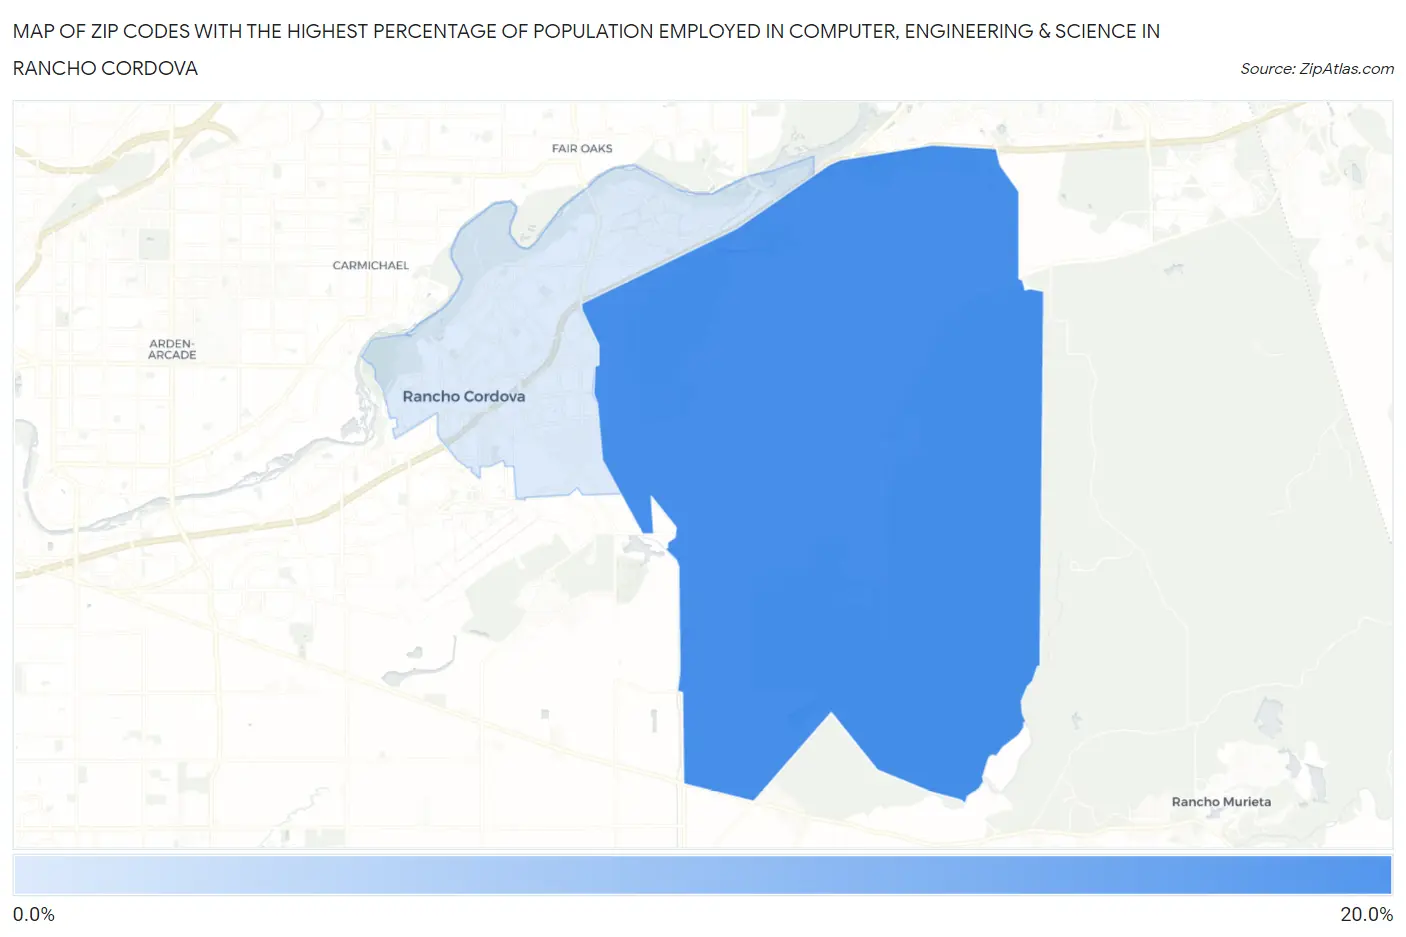
Map of Zip Codes with the Highest Percentage of Population Employed in Computer, Engineering & Science in Rancho Cordova
9.7%
16.0%
Zip Codes with the Highest Percentage of Population Employed in Computer, Engineering & Science in Rancho Cordova, CA
| Zip Code | % Employed | vs State | vs National | |
| 1. | 95742 | 16.0% | 8.0%(+8.03)#145 | 6.8%(+9.23)#954 |
| 2. | 95670 | 9.7% | 8.0%(+1.77)#362 | 6.8%(+2.97)#3,412 |
1
Common Questions
What are the Top Zip Codes with the Highest Percentage of Population Employed in Computer, Engineering & Science in Rancho Cordova, CA?
Top Zip Codes with the Highest Percentage of Population Employed in Computer, Engineering & Science in Rancho Cordova, CA are:
What zip code has the Highest Percentage of Population Employed in Computer, Engineering & Science in Rancho Cordova, CA?
95742 has the Highest Percentage of Population Employed in Computer, Engineering & Science in Rancho Cordova, CA with 16.0%.
What is the Percentage of Population Employed in Computer, Engineering & Science in Rancho Cordova, CA?
Percentage of Population Employed in Computer, Engineering & Science in Rancho Cordova is 9.7%.
What is the Percentage of Population Employed in Computer, Engineering & Science in California?
Percentage of Population Employed in Computer, Engineering & Science in California is 8.0%.
What is the Percentage of Population Employed in Computer, Engineering & Science in the United States?
Percentage of Population Employed in Computer, Engineering & Science in the United States is 6.8%.