Cities with the Highest Percentage of Population Employed in Computer, Engineering & Science in Missouri
RELATED REPORTS & OPTIONS
Computer, Engineering & Science
Missouri
Compare Cities
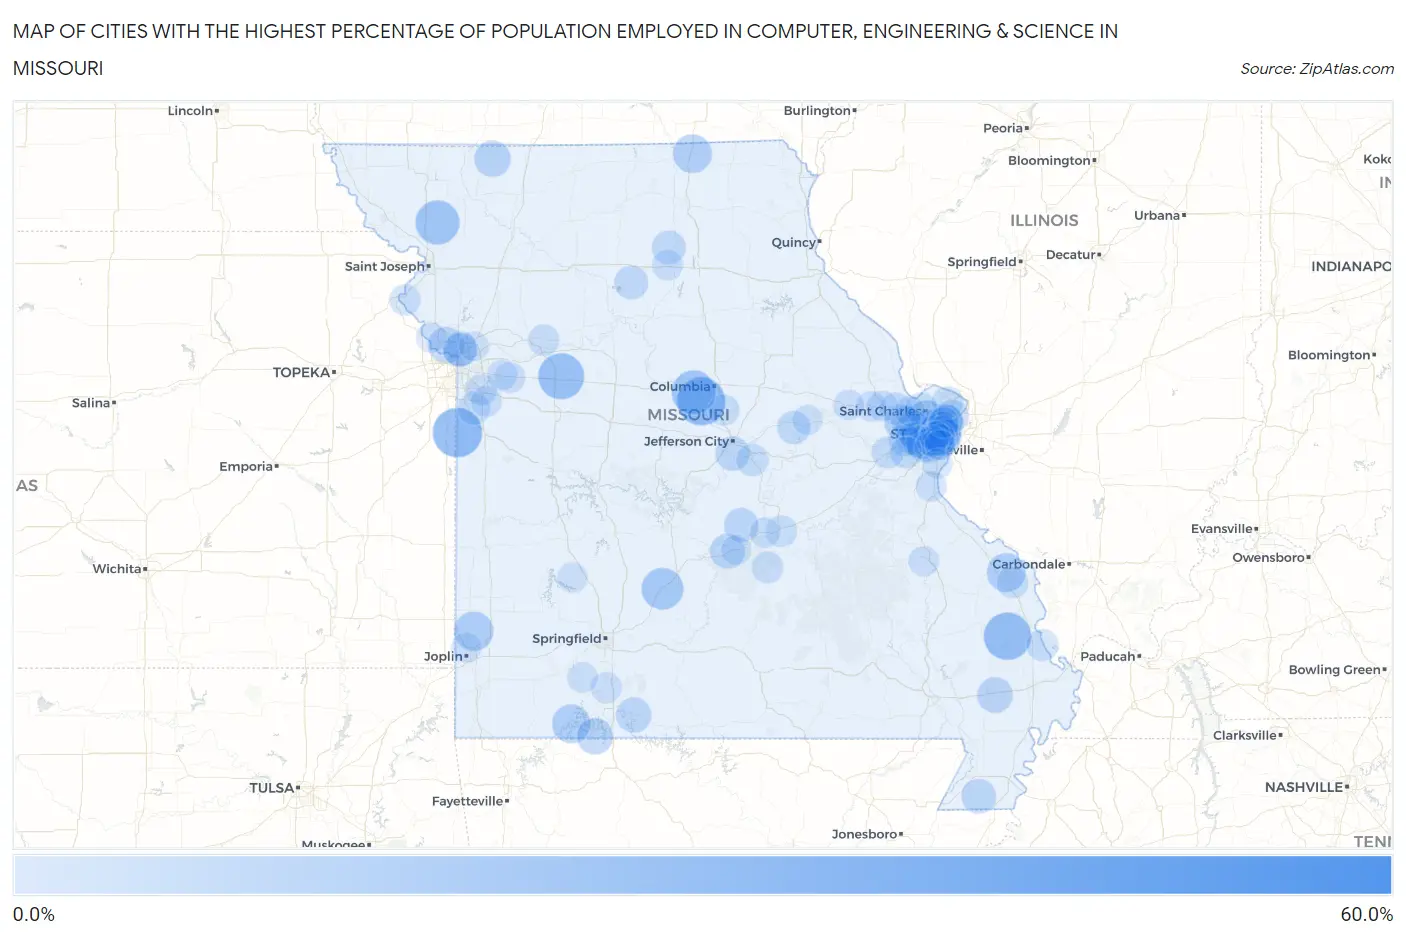
Map of Cities with the Highest Percentage of Population Employed in Computer, Engineering & Science in Missouri
0.0%
60.0%
Cities with the Highest Percentage of Population Employed in Computer, Engineering & Science in Missouri
| City | % Employed | vs State | vs National | |
| 1. | New Market | 59.2% | 5.9%(+53.3)#1 | 6.8%(+52.4)#41 |
| 2. | West Line | 31.7% | 5.9%(+25.8)#2 | 6.8%(+24.9)#189 |
| 3. | Grayson | 30.6% | 5.9%(+24.7)#3 | 6.8%(+23.8)#212 |
| 4. | Lupus | 30.0% | 5.9%(+24.1)#4 | 6.8%(+23.2)#224 |
| 5. | Allenville | 29.0% | 5.9%(+23.2)#5 | 6.8%(+22.3)#237 |
| 6. | Aullville | 27.5% | 5.9%(+21.6)#6 | 6.8%(+20.7)#274 |
| 7. | Rea | 25.0% | 5.9%(+19.1)#7 | 6.8%(+18.2)#333 |
| 8. | Wooldridge | 25.0% | 5.9%(+19.1)#8 | 6.8%(+18.2)#334 |
| 9. | Briarwood Estates | 24.2% | 5.9%(+18.3)#9 | 6.8%(+17.4)#356 |
| 10. | Phillipsburg | 22.1% | 5.9%(+16.2)#10 | 6.8%(+15.3)#438 |
| 11. | White Branch | 20.3% | 5.9%(+14.4)#11 | 6.8%(+13.5)#543 |
| 12. | Neck City | 19.2% | 5.9%(+13.3)#12 | 6.8%(+12.4)#617 |
| 13. | Maryland Heights | 19.0% | 5.9%(+13.2)#13 | 6.8%(+12.3)#631 |
| 14. | Longtown | 18.5% | 5.9%(+12.6)#14 | 6.8%(+11.7)#682 |
| 15. | Creve Coeur | 18.4% | 5.9%(+12.5)#15 | 6.8%(+11.6)#692 |
| 16. | Lancaster | 18.4% | 5.9%(+12.5)#16 | 6.8%(+11.6)#693 |
| 17. | Shell Knob | 18.2% | 5.9%(+12.3)#17 | 6.8%(+11.4)#714 |
| 18. | Manchester | 16.6% | 5.9%(+10.8)#18 | 6.8%(+9.87)#882 |
| 19. | Richmond Heights | 16.3% | 5.9%(+10.4)#19 | 6.8%(+9.49)#924 |
| 20. | Chesterfield | 15.8% | 5.9%(+9.96)#20 | 6.8%(+9.08)#985 |
| 21. | Brentwood | 15.7% | 5.9%(+9.82)#21 | 6.8%(+8.93)#1,007 |
| 22. | Weatherby Lake | 15.6% | 5.9%(+9.70)#22 | 6.8%(+8.81)#1,023 |
| 23. | Allendale | 15.4% | 5.9%(+9.51)#23 | 6.8%(+8.62)#1,066 |
| 24. | Blue Eye | 15.3% | 5.9%(+9.44)#24 | 6.8%(+8.56)#1,083 |
| 25. | Weldon Spring Heights | 15.3% | 5.9%(+9.38)#25 | 6.8%(+8.49)#1,093 |
| 26. | Essex | 14.8% | 5.9%(+8.87)#26 | 6.8%(+7.99)#1,185 |
| 27. | Crystal Lake Park | 14.7% | 5.9%(+8.86)#27 | 6.8%(+7.97)#1,190 |
| 28. | Maplewood | 14.4% | 5.9%(+8.53)#28 | 6.8%(+7.65)#1,245 |
| 29. | Kissee Mills | 14.1% | 5.9%(+8.26)#29 | 6.8%(+7.38)#1,301 |
| 30. | Waynesville | 13.9% | 5.9%(+7.97)#30 | 6.8%(+7.09)#1,377 |
| 31. | Oakview | 13.7% | 5.9%(+7.78)#31 | 6.8%(+6.89)#1,434 |
| 32. | Frontenac | 13.6% | 5.9%(+7.72)#32 | 6.8%(+6.83)#1,456 |
| 33. | Ballwin | 13.5% | 5.9%(+7.60)#33 | 6.8%(+6.71)#1,487 |
| 34. | Bellerive Acres | 13.5% | 5.9%(+7.58)#34 | 6.8%(+6.70)#1,495 |
| 35. | Glen Echo Park | 13.3% | 5.9%(+7.45)#35 | 6.8%(+6.57)#1,537 |
| 36. | Rives | 13.3% | 5.9%(+7.45)#36 | 6.8%(+6.57)#1,538 |
| 37. | Wardsville | 13.1% | 5.9%(+7.27)#37 | 6.8%(+6.38)#1,589 |
| 38. | Dixon | 13.0% | 5.9%(+7.12)#38 | 6.8%(+6.23)#1,631 |
| 39. | Olivette | 12.9% | 5.9%(+7.06)#39 | 6.8%(+6.18)#1,645 |
| 40. | Rothville | 12.5% | 5.9%(+6.62)#40 | 6.8%(+5.74)#1,772 |
| 41. | Ethel | 12.5% | 5.9%(+6.62)#41 | 6.8%(+5.74)#1,773 |
| 42. | Valley Park | 12.4% | 5.9%(+6.57)#42 | 6.8%(+5.68)#1,794 |
| 43. | Glendale | 12.0% | 5.9%(+6.14)#43 | 6.8%(+5.26)#1,930 |
| 44. | Oakwood | 12.0% | 5.9%(+6.12)#44 | 6.8%(+5.24)#1,940 |
| 45. | Morrison | 11.8% | 5.9%(+5.89)#45 | 6.8%(+5.00)#2,025 |
| 46. | Stanton | 11.6% | 5.9%(+5.73)#46 | 6.8%(+4.85)#2,066 |
| 47. | Shrewsbury | 11.4% | 5.9%(+5.55)#47 | 6.8%(+4.66)#2,151 |
| 48. | Twin Oaks | 11.2% | 5.9%(+5.36)#48 | 6.8%(+4.48)#2,247 |
| 49. | Wildwood | 11.1% | 5.9%(+5.26)#49 | 6.8%(+4.37)#2,297 |
| 50. | O Fallon | 10.8% | 5.9%(+4.95)#50 | 6.8%(+4.06)#2,455 |
| 51. | Pasadena Hills | 10.8% | 5.9%(+4.94)#51 | 6.8%(+4.05)#2,458 |
| 52. | Ellisville | 10.8% | 5.9%(+4.89)#52 | 6.8%(+4.01)#2,480 |
| 53. | Moline Acres | 10.6% | 5.9%(+4.75)#53 | 6.8%(+3.87)#2,561 |
| 54. | Raymore | 10.6% | 5.9%(+4.75)#54 | 6.8%(+3.86)#2,564 |
| 55. | University City | 10.6% | 5.9%(+4.73)#55 | 6.8%(+3.84)#2,574 |
| 56. | Westphalia | 10.6% | 5.9%(+4.70)#56 | 6.8%(+3.81)#2,596 |
| 57. | St Charles | 10.4% | 5.9%(+4.54)#57 | 6.8%(+3.66)#2,676 |
| 58. | Eureka | 10.4% | 5.9%(+4.53)#58 | 6.8%(+3.64)#2,692 |
| 59. | Medill | 10.3% | 5.9%(+4.42)#59 | 6.8%(+3.54)#2,753 |
| 60. | Gray Summit | 10.3% | 5.9%(+4.39)#60 | 6.8%(+3.50)#2,777 |
| 61. | Crestwood | 10.2% | 5.9%(+4.34)#61 | 6.8%(+3.46)#2,803 |
| 62. | Commerce | 10.0% | 5.9%(+4.12)#62 | 6.8%(+3.24)#2,951 |
| 63. | Millersville | 9.9% | 5.9%(+4.06)#63 | 6.8%(+3.18)#2,981 |
| 64. | Old Jamestown | 9.9% | 5.9%(+4.00)#64 | 6.8%(+3.12)#3,017 |
| 65. | Rolla | 9.8% | 5.9%(+3.97)#65 | 6.8%(+3.08)#3,042 |
| 66. | Rock Hill | 9.8% | 5.9%(+3.93)#66 | 6.8%(+3.05)#3,065 |
| 67. | Edgar Springs | 9.8% | 5.9%(+3.92)#67 | 6.8%(+3.04)#3,068 |
| 68. | Old Appleton | 9.8% | 5.9%(+3.92)#68 | 6.8%(+3.04)#3,069 |
| 69. | Clayton | 9.6% | 5.9%(+3.70)#69 | 6.8%(+2.81)#3,253 |
| 70. | Webster Groves | 9.5% | 5.9%(+3.60)#70 | 6.8%(+2.72)#3,320 |
| 71. | Hardin | 9.5% | 5.9%(+3.58)#71 | 6.8%(+2.69)#3,346 |
| 72. | Lee S Summit | 9.4% | 5.9%(+3.54)#72 | 6.8%(+2.66)#3,372 |
| 73. | Fenton | 9.3% | 5.9%(+3.39)#73 | 6.8%(+2.50)#3,492 |
| 74. | Lewis And Clark Village | 9.3% | 5.9%(+3.38)#74 | 6.8%(+2.49)#3,506 |
| 75. | Ashland | 9.1% | 5.9%(+3.24)#75 | 6.8%(+2.36)#3,603 |
| 76. | Spokane | 9.1% | 5.9%(+3.21)#76 | 6.8%(+2.33)#3,634 |
| 77. | Greenwood | 9.0% | 5.9%(+3.15)#77 | 6.8%(+2.27)#3,682 |
| 78. | Kirkwood | 8.9% | 5.9%(+3.05)#78 | 6.8%(+2.17)#3,772 |
| 79. | New Cambria | 8.9% | 5.9%(+3.01)#79 | 6.8%(+2.12)#3,823 |
| 80. | Wentzville | 8.9% | 5.9%(+2.98)#80 | 6.8%(+2.09)#3,849 |
| 81. | Horine | 8.7% | 5.9%(+2.80)#81 | 6.8%(+1.92)#3,994 |
| 82. | Oak Grove | 8.7% | 5.9%(+2.79)#82 | 6.8%(+1.90)#4,009 |
| 83. | Bel Nor | 8.7% | 5.9%(+2.78)#83 | 6.8%(+1.90)#4,012 |
| 84. | Warson Woods | 8.5% | 5.9%(+2.65)#84 | 6.8%(+1.77)#4,142 |
| 85. | Hurley | 8.5% | 5.9%(+2.57)#85 | 6.8%(+1.69)#4,221 |
| 86. | Foristell | 8.4% | 5.9%(+2.48)#86 | 6.8%(+1.59)#4,304 |
| 87. | Warrenton | 8.3% | 5.9%(+2.46)#87 | 6.8%(+1.58)#4,318 |
| 88. | Doe Run | 8.3% | 5.9%(+2.39)#88 | 6.8%(+1.50)#4,394 |
| 89. | Grain Valley | 8.3% | 5.9%(+2.38)#89 | 6.8%(+1.50)#4,397 |
| 90. | Weldon Spring | 8.2% | 5.9%(+2.33)#90 | 6.8%(+1.44)#4,469 |
| 91. | Arnold | 8.2% | 5.9%(+2.32)#91 | 6.8%(+1.43)#4,477 |
| 92. | Airport Drive | 8.1% | 5.9%(+2.24)#92 | 6.8%(+1.36)#4,557 |
| 93. | Farley | 8.1% | 5.9%(+2.21)#93 | 6.8%(+1.32)#4,596 |
| 94. | Grantwood Village | 8.0% | 5.9%(+2.15)#94 | 6.8%(+1.26)#4,669 |
| 95. | St Robert | 8.0% | 5.9%(+2.12)#95 | 6.8%(+1.24)#4,693 |
| 96. | Rhineland | 8.0% | 5.9%(+2.12)#96 | 6.8%(+1.24)#4,701 |
| 97. | St Peters | 8.0% | 5.9%(+2.12)#97 | 6.8%(+1.23)#4,709 |
| 98. | Doolittle | 7.9% | 5.9%(+2.06)#98 | 6.8%(+1.17)#4,775 |
| 99. | Fair Play | 7.9% | 5.9%(+2.03)#99 | 6.8%(+1.14)#4,813 |
| 100. | Glenaire | 7.8% | 5.9%(+1.94)#100 | 6.8%(+1.05)#4,915 |
Common Questions
What are the Top 10 Cities with the Highest Percentage of Population Employed in Computer, Engineering & Science in Missouri?
Top 10 Cities with the Highest Percentage of Population Employed in Computer, Engineering & Science in Missouri are:
#1
31.7%
#2
30.0%
#3
29.0%
#4
27.5%
#5
25.0%
#6
25.0%
#7
22.1%
#8
19.2%
#9
19.0%
#10
18.5%
What city has the Highest Percentage of Population Employed in Computer, Engineering & Science in Missouri?
West Line has the Highest Percentage of Population Employed in Computer, Engineering & Science in Missouri with 31.7%.
What is the Percentage of Population Employed in Computer, Engineering & Science in the State of Missouri?
Percentage of Population Employed in Computer, Engineering & Science in Missouri is 5.9%.
What is the Percentage of Population Employed in Computer, Engineering & Science in the United States?
Percentage of Population Employed in Computer, Engineering & Science in the United States is 6.8%.