San Francisco, CA Map & Demographics
San Francisco Map
San Francisco Overview
$86,186
PER CAPITA INCOME
$159,981
AVG FAMILY INCOME
$136,689
AVG HOUSEHOLD INCOME
19.8%
WAGE / INCOME GAP [ % ]
80.2¢/ $1
WAGE / INCOME GAP [ $ ]
$9,949
FAMILY INCOME DEFICIT
0.52
INEQUALITY / GINI INDEX
851,036
TOTAL POPULATION
438,093
MALE POPULATION
412,943
FEMALE POPULATION
106.09
MALES / 100 FEMALES
94.26
FEMALES / 100 MALES
39.3
MEDIAN AGE
3.1
AVG FAMILY SIZE
2.3
AVG HOUSEHOLD SIZE
526,288
LABOR FORCE [ PEOPLE ]
70.4%
PERCENT IN LABOR FORCE
5.4%
UNEMPLOYMENT RATE
San Francisco Zip Codes
Income in San Francisco
Income Overview in San Francisco
Per Capita Income in San Francisco is $86,186, while median incomes of families and households are $159,981 and $136,689 respectively.
| Characteristic | Number | Measure |
| Per Capita Income | 851,036 | $86,186 |
| Median Family Income | 169,685 | $159,981 |
| Mean Family Income | 169,685 | $232,466 |
| Median Household Income | 360,842 | $136,689 |
| Mean Household Income | 360,842 | $197,408 |
| Income Deficit | 169,685 | $9,949 |
| Wage / Income Gap (%) | 851,036 | 19.83% |
| Wage / Income Gap ($) | 851,036 | 80.17¢ per $1 |
| Gini / Inequality Index | 851,036 | 0.52 |
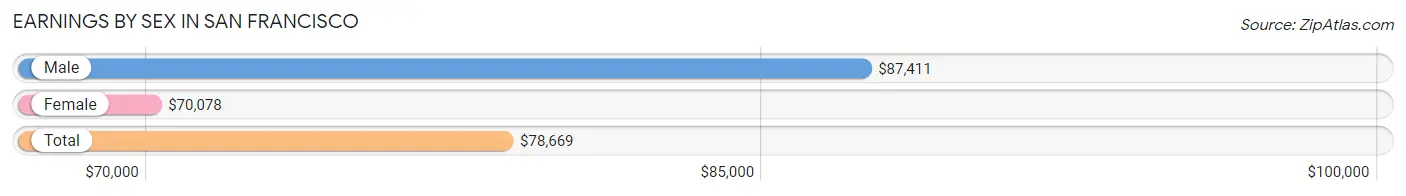
Earnings by Sex in San Francisco
Average Earnings in San Francisco are $78,669, $87,411 for men and $70,078 for women, a difference of 19.8%.
| Sex | Number | Average Earnings |
| Male | 290,965 (54.0%) | $87,411 |
| Female | 248,122 (46.0%) | $70,078 |
| Total | 539,087 (100.0%) | $78,669 |
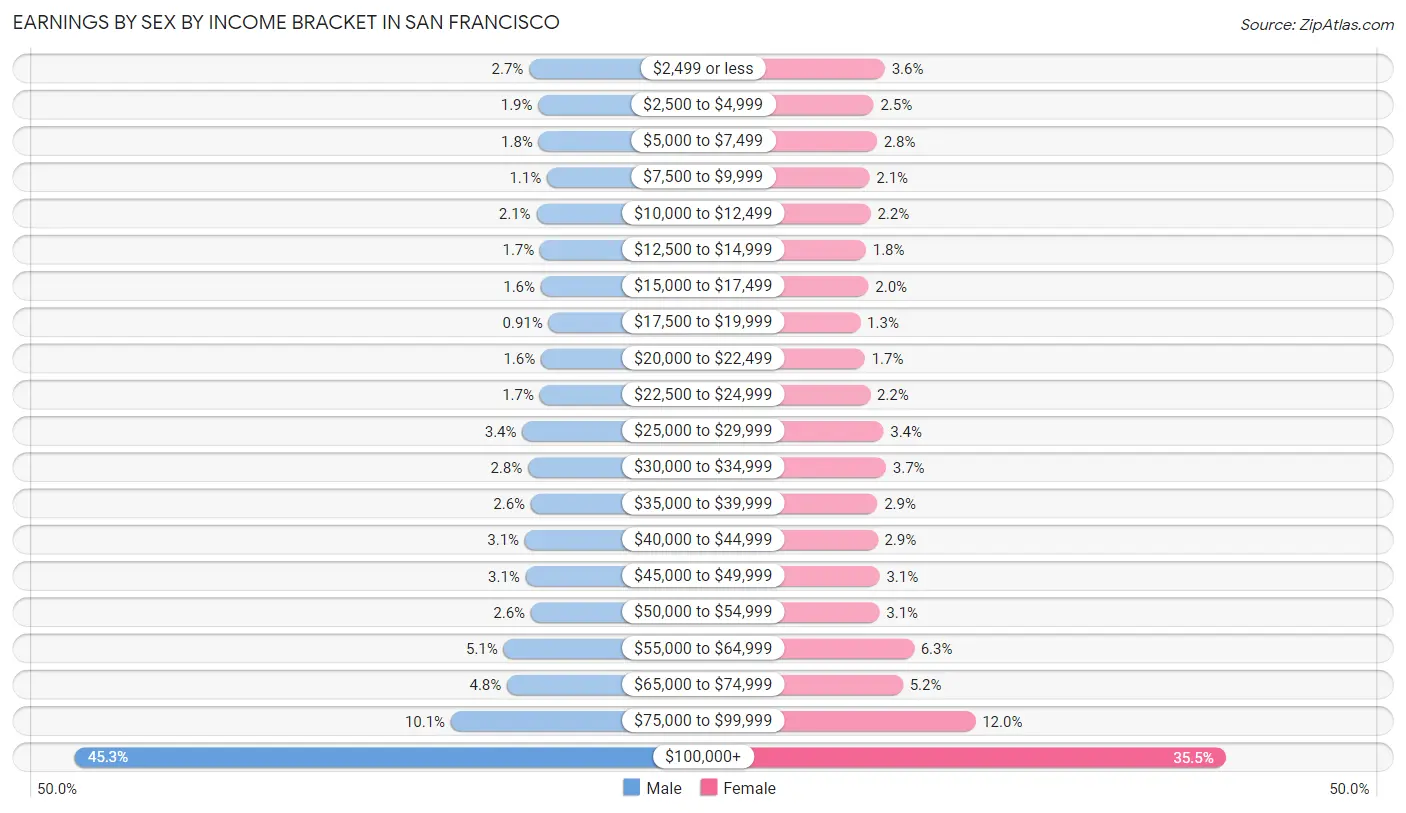
Earnings by Sex by Income Bracket in San Francisco
The most common earnings brackets in San Francisco are $100,000+ for men (131,786 | 45.3%) and $100,000+ for women (88,012 | 35.5%).
| Income | Male | Female |
| $2,499 or less | 7,951 (2.7%) | 8,820 (3.5%) |
| $2,500 to $4,999 | 5,452 (1.9%) | 6,195 (2.5%) |
| $5,000 to $7,499 | 5,362 (1.8%) | 6,957 (2.8%) |
| $7,500 to $9,999 | 3,082 (1.1%) | 5,242 (2.1%) |
| $10,000 to $12,499 | 5,970 (2.1%) | 5,516 (2.2%) |
| $12,500 to $14,999 | 4,978 (1.7%) | 4,428 (1.8%) |
| $15,000 to $17,499 | 4,781 (1.6%) | 5,000 (2.0%) |
| $17,500 to $19,999 | 2,644 (0.9%) | 3,096 (1.3%) |
| $20,000 to $22,499 | 4,722 (1.6%) | 4,173 (1.7%) |
| $22,500 to $24,999 | 5,049 (1.7%) | 5,388 (2.2%) |
| $25,000 to $29,999 | 9,799 (3.4%) | 8,479 (3.4%) |
| $30,000 to $34,999 | 8,274 (2.8%) | 9,076 (3.7%) |
| $35,000 to $39,999 | 7,476 (2.6%) | 7,064 (2.9%) |
| $40,000 to $44,999 | 9,097 (3.1%) | 7,123 (2.9%) |
| $45,000 to $49,999 | 8,899 (3.1%) | 7,582 (3.1%) |
| $50,000 to $54,999 | 7,476 (2.6%) | 7,556 (3.0%) |
| $55,000 to $64,999 | 14,922 (5.1%) | 15,547 (6.3%) |
| $65,000 to $74,999 | 13,965 (4.8%) | 13,007 (5.2%) |
| $75,000 to $99,999 | 29,280 (10.1%) | 29,861 (12.0%) |
| $100,000+ | 131,786 (45.3%) | 88,012 (35.5%) |
| Total | 290,965 (100.0%) | 248,122 (100.0%) |
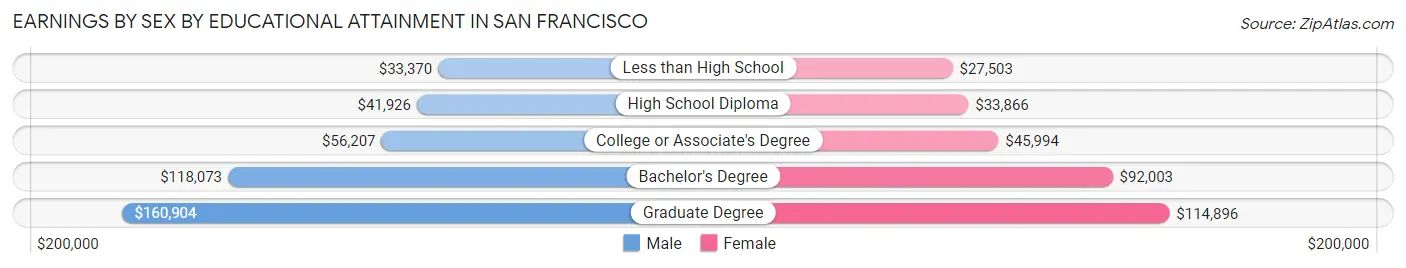
Earnings by Sex by Educational Attainment in San Francisco
Average earnings in San Francisco are $94,088 for men and $77,182 for women, a difference of 18.0%. Men with an educational attainment of graduate degree enjoy the highest average annual earnings of $160,904, while those with less than high school education earn the least with $33,370. Women with an educational attainment of graduate degree earn the most with the average annual earnings of $114,896, while those with less than high school education have the smallest earnings of $27,503.
| Educational Attainment | Male Income | Female Income |
| Less than High School | $33,370 | $27,503 |
| High School Diploma | $41,926 | $33,866 |
| College or Associate's Degree | $56,207 | $45,994 |
| Bachelor's Degree | $118,073 | $92,003 |
| Graduate Degree | $160,904 | $114,896 |
| Total | $94,088 | $77,182 |
Family Income in San Francisco
Family Income Brackets in San Francisco
According to the San Francisco family income data, there are 69,231 families falling into the $200,000+ income range, which is the most common income bracket and makes up 40.8% of all families. Conversely, the $10,000 to $14,999 income bracket is the least frequent group with only 2,545 families (1.5%) belonging to this category.
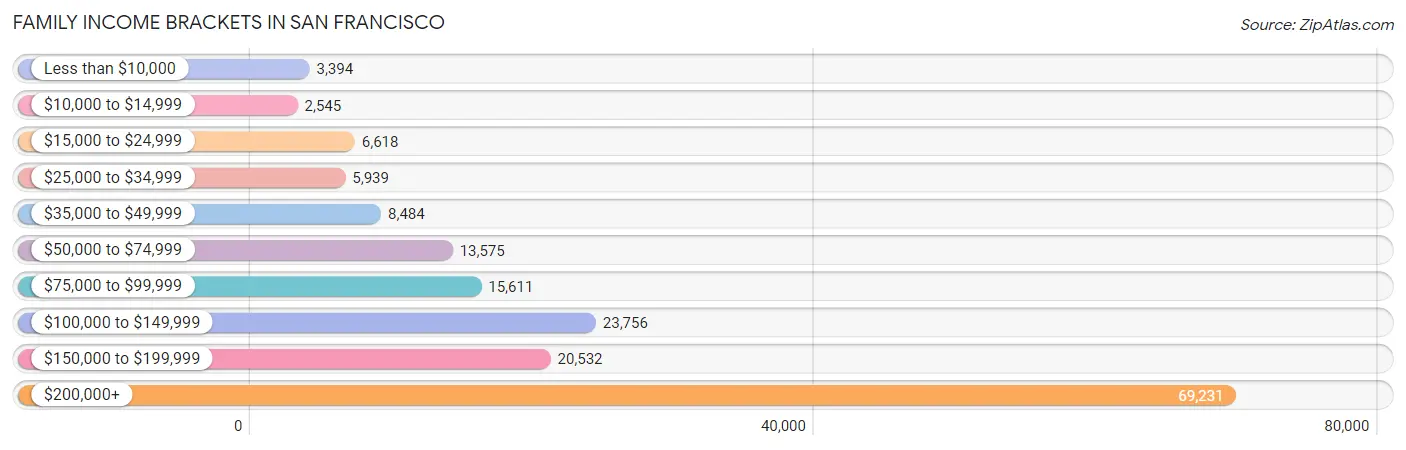
| Income Bracket | # Families | % Families |
| Less than $10,000 | 3,394 | 2.0% |
| $10,000 to $14,999 | 2,545 | 1.5% |
| $15,000 to $24,999 | 6,618 | 3.9% |
| $25,000 to $34,999 | 5,939 | 3.5% |
| $35,000 to $49,999 | 8,484 | 5.0% |
| $50,000 to $74,999 | 13,575 | 8.0% |
| $75,000 to $99,999 | 15,611 | 9.2% |
| $100,000 to $149,999 | 23,756 | 14.0% |
| $150,000 to $199,999 | 20,532 | 12.1% |
| $200,000+ | 69,231 | 40.8% |
Family Income by Famaliy Size in San Francisco
4-person families (30,322 | 17.9%) account for the highest median family income in San Francisco with $194,815 per family, while 2-person families (83,821 | 49.4%) have the highest median income of $73,421 per family member.
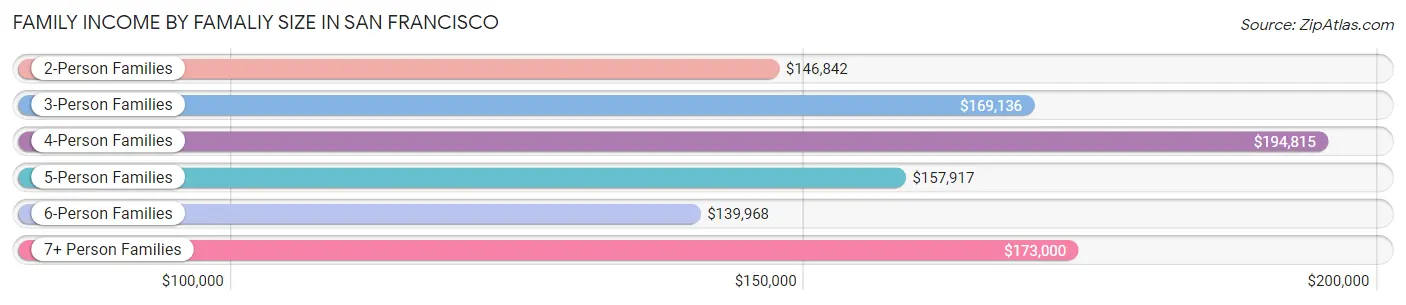
| Income Bracket | # Families | Median Income |
| 2-Person Families | 83,821 (49.4%) | $146,842 |
| 3-Person Families | 38,287 (22.6%) | $169,136 |
| 4-Person Families | 30,322 (17.9%) | $194,815 |
| 5-Person Families | 10,421 (6.1%) | $157,917 |
| 6-Person Families | 4,078 (2.4%) | $139,968 |
| 7+ Person Families | 2,756 (1.6%) | $173,000 |
| Total | 169,685 (100.0%) | $159,981 |
Family Income by Number of Earners in San Francisco
The median family income in San Francisco is $159,981, with families comprising 2 earners (85,585) having the highest median family income of $227,645, while families with no earners (21,058) have the lowest median family income of $50,105, accounting for 50.4% and 12.4% of families, respectively.
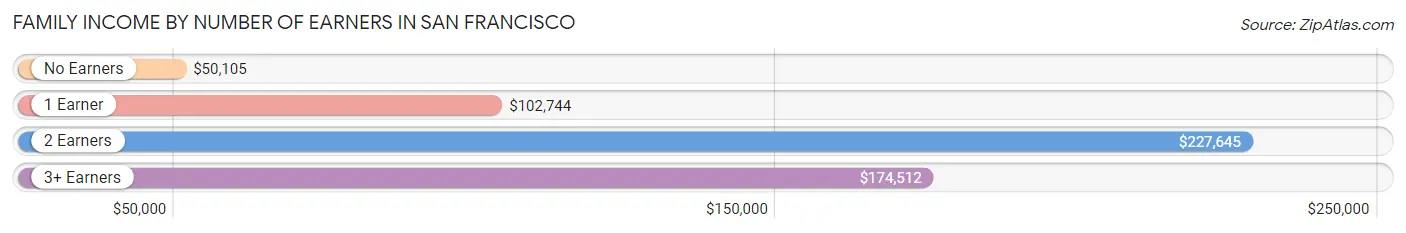
| Number of Earners | # Families | Median Income |
| No Earners | 21,058 (12.4%) | $50,105 |
| 1 Earner | 43,311 (25.5%) | $102,744 |
| 2 Earners | 85,585 (50.4%) | $227,645 |
| 3+ Earners | 19,731 (11.6%) | $174,512 |
| Total | 169,685 (100.0%) | $159,981 |
Household Income in San Francisco
Household Income Brackets in San Francisco
With 126,295 households falling in the category, the $200,000+ income range is the most frequent in San Francisco, accounting for 35.0% of all households. In contrast, only 15,155 households (4.2%) fall into the less than $10,000 income bracket, making it the least populous group.
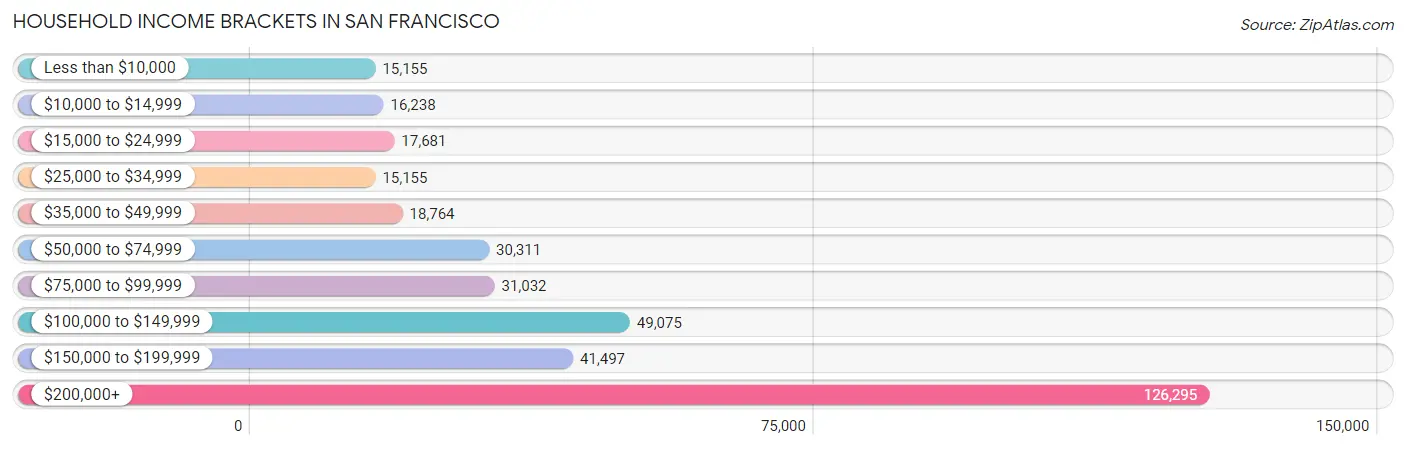
| Income Bracket | # Households | % Households |
| Less than $10,000 | 15,155 | 4.2% |
| $10,000 to $14,999 | 16,238 | 4.5% |
| $15,000 to $24,999 | 17,681 | 4.9% |
| $25,000 to $34,999 | 15,155 | 4.2% |
| $35,000 to $49,999 | 18,764 | 5.2% |
| $50,000 to $74,999 | 30,311 | 8.4% |
| $75,000 to $99,999 | 31,032 | 8.6% |
| $100,000 to $149,999 | 49,075 | 13.6% |
| $150,000 to $199,999 | 41,497 | 11.5% |
| $200,000+ | 126,295 | 35.0% |
Household Income by Householder Age in San Francisco
The median household income in San Francisco is $136,689, with the highest median household income of $194,281 found in the 25 to 44 years age bracket for the primary householder. A total of 149,236 households (41.4%) fall into this category. Meanwhile, the 65+ years age bracket for the primary householder has the lowest median household income of $65,369, with 84,354 households (23.4%) in this group.
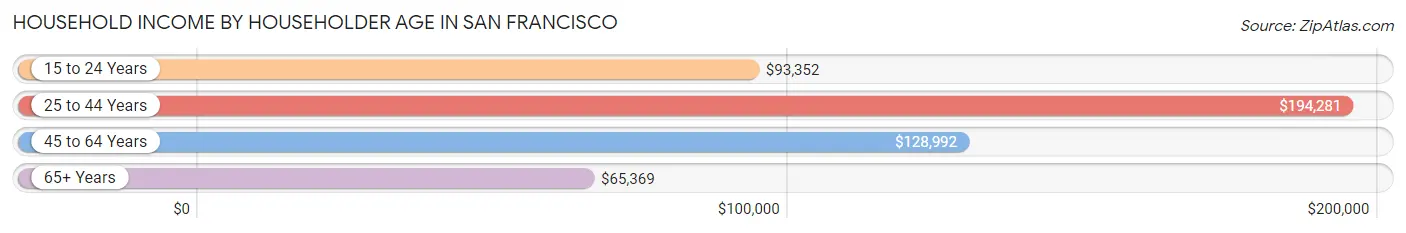
| Income Bracket | # Households | Median Income |
| 15 to 24 Years | 10,066 (2.8%) | $93,352 |
| 25 to 44 Years | 149,236 (41.4%) | $194,281 |
| 45 to 64 Years | 117,186 (32.5%) | $128,992 |
| 65+ Years | 84,354 (23.4%) | $65,369 |
| Total | 360,842 (100.0%) | $136,689 |
Poverty in San Francisco
Income Below Poverty by Sex and Age in San Francisco
With 10.0% poverty level for males and 11.0% for females among the residents of San Francisco, 18 to 24 year old males and 18 to 24 year old females are the most vulnerable to poverty, with 5,251 males (21.0%) and 5,766 females (23.4%) in their respective age groups living below the poverty level.
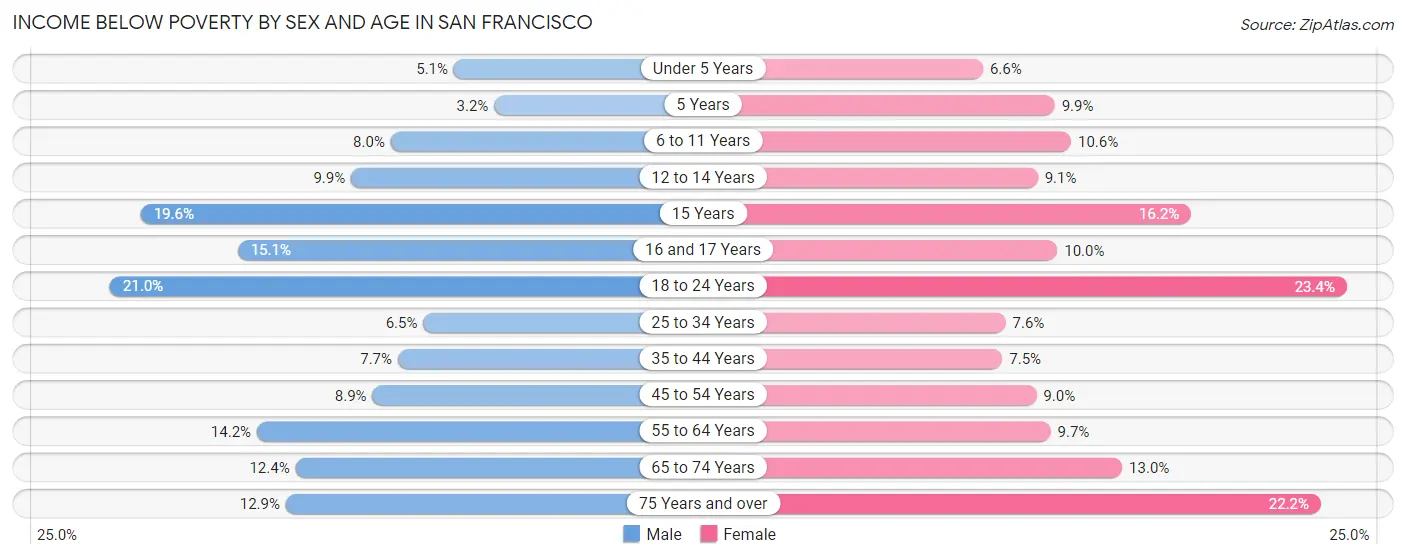
| Age Bracket | Male | Female |
| Under 5 Years | 907 (5.1%) | 1,149 (6.6%) |
| 5 Years | 94 (3.2%) | 290 (9.9%) |
| 6 to 11 Years | 1,479 (8.0%) | 1,895 (10.6%) |
| 12 to 14 Years | 929 (9.9%) | 788 (9.1%) |
| 15 Years | 481 (19.6%) | 492 (16.2%) |
| 16 and 17 Years | 933 (15.1%) | 551 (10.0%) |
| 18 to 24 Years | 5,251 (21.0%) | 5,766 (23.4%) |
| 25 to 34 Years | 6,330 (6.5%) | 6,698 (7.6%) |
| 35 to 44 Years | 5,669 (7.7%) | 4,751 (7.4%) |
| 45 to 54 Years | 5,440 (8.9%) | 4,609 (9.0%) |
| 55 to 64 Years | 7,608 (14.2%) | 4,552 (9.7%) |
| 65 to 74 Years | 4,781 (12.4%) | 5,287 (13.0%) |
| 75 Years and over | 3,244 (12.9%) | 7,875 (22.2%) |
| Total | 43,146 (10.0%) | 44,703 (11.0%) |
Income Above Poverty by Sex and Age in San Francisco
According to the poverty statistics in San Francisco, males aged 5 years and females aged under 5 years are the age groups that are most secure financially, with 96.8% of males and 93.4% of females in these age groups living above the poverty line.
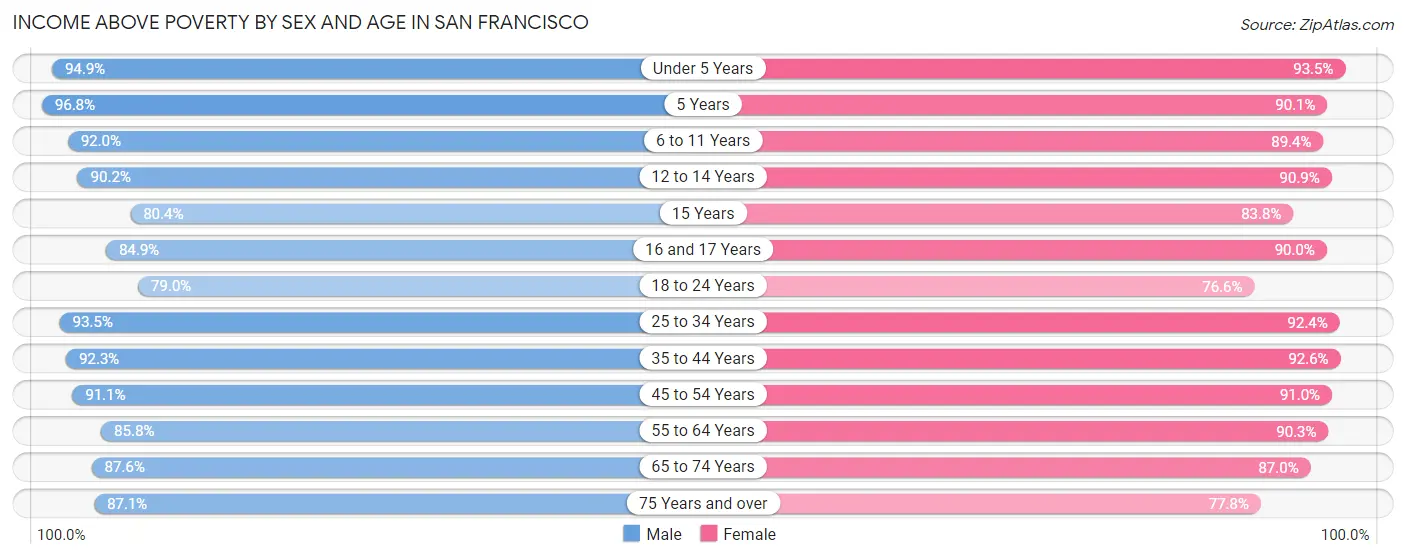
| Age Bracket | Male | Female |
| Under 5 Years | 16,935 (94.9%) | 16,385 (93.4%) |
| 5 Years | 2,832 (96.8%) | 2,644 (90.1%) |
| 6 to 11 Years | 16,984 (92.0%) | 15,908 (89.4%) |
| 12 to 14 Years | 8,499 (90.1%) | 7,883 (90.9%) |
| 15 Years | 1,972 (80.4%) | 2,543 (83.8%) |
| 16 and 17 Years | 5,242 (84.9%) | 4,958 (90.0%) |
| 18 to 24 Years | 19,706 (79.0%) | 18,845 (76.6%) |
| 25 to 34 Years | 90,998 (93.5%) | 81,381 (92.4%) |
| 35 to 44 Years | 68,106 (92.3%) | 58,997 (92.5%) |
| 45 to 54 Years | 55,939 (91.1%) | 46,417 (91.0%) |
| 55 to 64 Years | 45,884 (85.8%) | 42,435 (90.3%) |
| 65 to 74 Years | 33,685 (87.6%) | 35,365 (87.0%) |
| 75 Years and over | 21,944 (87.1%) | 27,552 (77.8%) |
| Total | 388,726 (90.0%) | 361,313 (89.0%) |
Income Below Poverty Among Married-Couple Families in San Francisco
The poverty statistics for married-couple families in San Francisco show that 3.4% or 4,347 of the total 129,039 families live below the poverty line. Families with 3 or 4 children have the highest poverty rate of 8.2%, comprising of 406 families. On the other hand, families with 5 or more children have the lowest poverty rate of 0.0%, which includes 0 families.
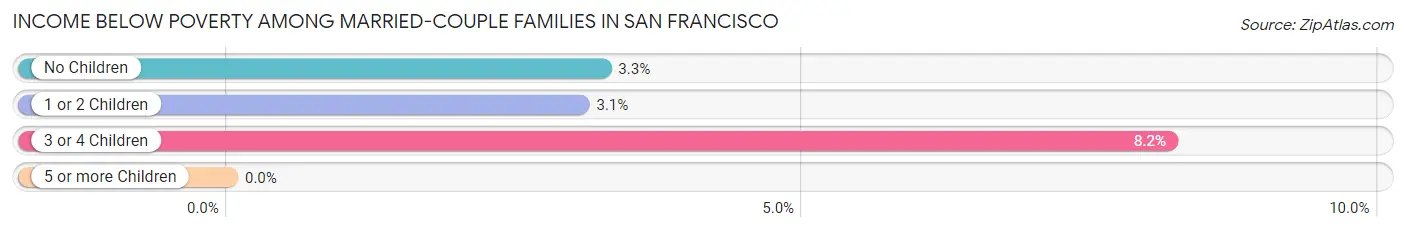
| Children | Above Poverty | Below Poverty |
| No Children | 77,999 (96.8%) | 2,618 (3.3%) |
| 1 or 2 Children | 41,883 (96.9%) | 1,323 (3.1%) |
| 3 or 4 Children | 4,557 (91.8%) | 406 (8.2%) |
| 5 or more Children | 253 (100.0%) | 0 (0.0%) |
| Total | 124,692 (96.6%) | 4,347 (3.4%) |
Income Below Poverty Among Single-Parent Households in San Francisco
According to the poverty data in San Francisco, 6.7% or 879 single-father households and 15.2% or 4,185 single-mother households are living below the poverty line. Among single-father households, those with 3 or 4 children have the highest poverty rate, with 38 households (13.2%) experiencing poverty. Likewise, among single-mother households, those with 5 or more children have the highest poverty rate, with 12 households (26.7%) falling below the poverty line.
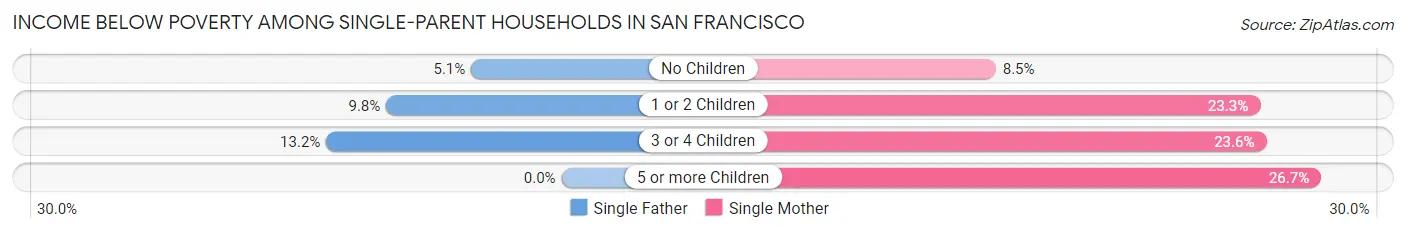
| Children | Single Father | Single Mother |
| No Children | 443 (5.1%) | 1,279 (8.5%) |
| 1 or 2 Children | 398 (9.8%) | 2,623 (23.3%) |
| 3 or 4 Children | 38 (13.2%) | 271 (23.6%) |
| 5 or more Children | 0 (0.0%) | 12 (26.7%) |
| Total | 879 (6.7%) | 4,185 (15.2%) |
Income Below Poverty Among Married-Couple vs Single-Parent Households in San Francisco
The poverty data for San Francisco shows that 4,347 of the married-couple family households (3.4%) and 5,064 of the single-parent households (12.5%) are living below the poverty level. Within the married-couple family households, those with 3 or 4 children have the highest poverty rate, with 406 households (8.2%) falling below the poverty line. Among the single-parent households, those with 5 or more children have the highest poverty rate, with 12 household (26.7%) living below poverty.
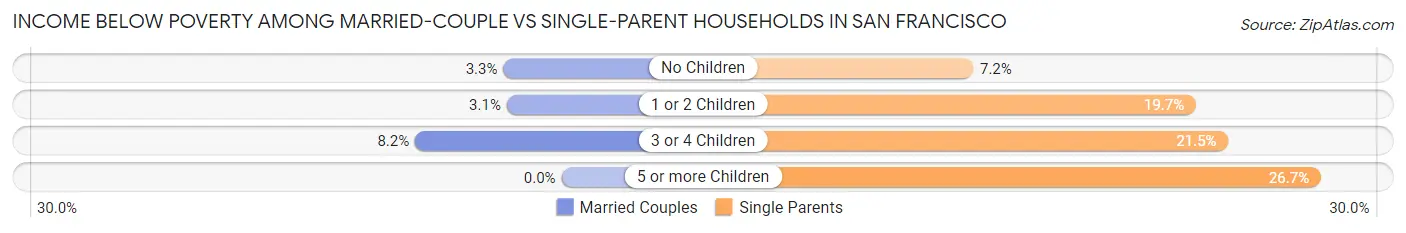
| Children | Married-Couple Families | Single-Parent Households |
| No Children | 2,618 (3.3%) | 1,722 (7.2%) |
| 1 or 2 Children | 1,323 (3.1%) | 3,021 (19.7%) |
| 3 or 4 Children | 406 (8.2%) | 309 (21.5%) |
| 5 or more Children | 0 (0.0%) | 12 (26.7%) |
| Total | 4,347 (3.4%) | 5,064 (12.5%) |
Race in San Francisco
The most populous races in San Francisco are White / Caucasian (356,474 | 41.9%), Asian (296,122 | 34.8%), and Hispanic or Latino (131,517 | 15.4%).
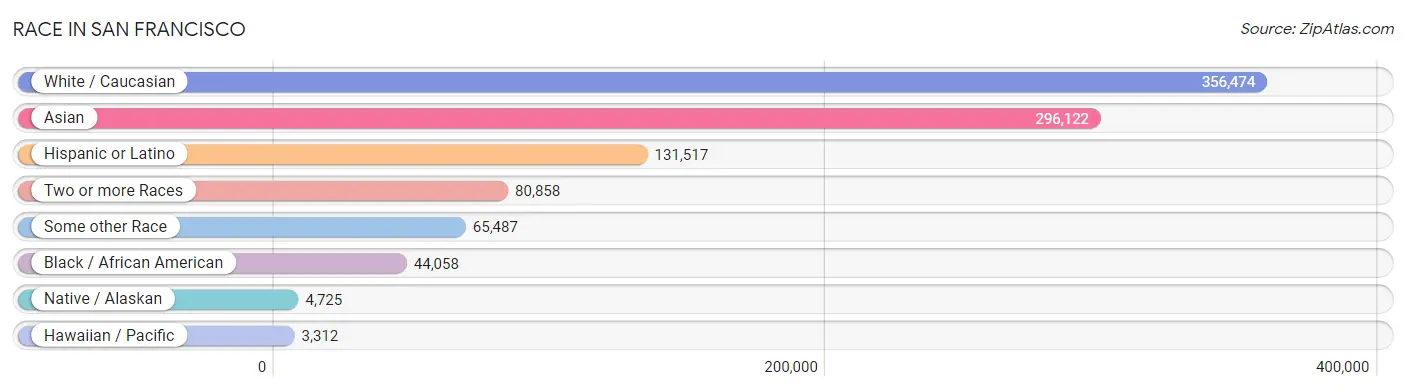
| Race | # Population | % Population |
| Asian | 296,122 | 34.8% |
| Black / African American | 44,058 | 5.2% |
| Hawaiian / Pacific | 3,312 | 0.4% |
| Hispanic or Latino | 131,517 | 15.4% |
| Native / Alaskan | 4,725 | 0.6% |
| White / Caucasian | 356,474 | 41.9% |
| Two or more Races | 80,858 | 9.5% |
| Some other Race | 65,487 | 7.7% |
| Total | 851,036 | 100.0% |
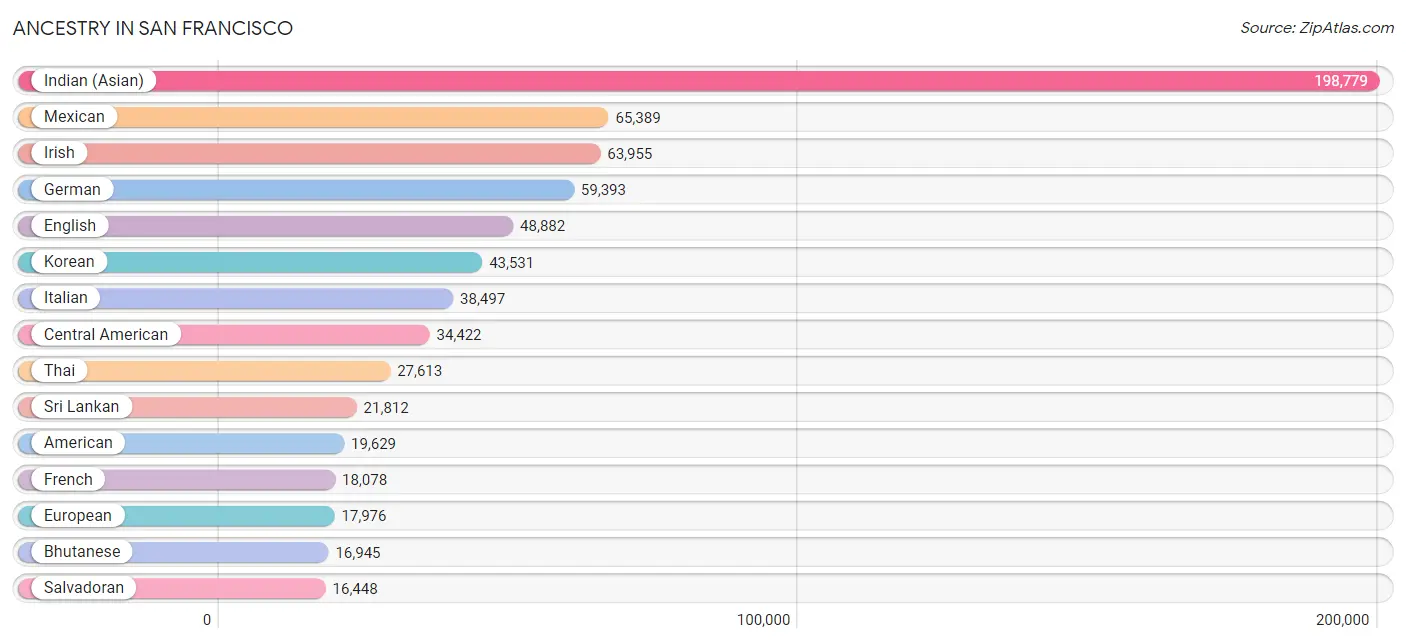
Ancestry in San Francisco
The most populous ancestries reported in San Francisco are Indian (Asian) (198,779 | 23.4%), Mexican (65,389 | 7.7%), Irish (63,955 | 7.5%), German (59,393 | 7.0%), and English (48,882 | 5.7%), together accounting for 51.3% of all San Francisco residents.
| Ancestry | # Population | % Population |
| Afghan | 261 | 0.0% |
| African | 2,232 | 0.3% |
| Alaska Native | 65 | 0.0% |
| Albanian | 226 | 0.0% |
| Aleut | 18 | 0.0% |
| Alsatian | 38 | 0.0% |
| American | 19,629 | 2.3% |
| Apache | 988 | 0.1% |
| Arab | 8,968 | 1.1% |
| Arapaho | 8 | 0.0% |
| Argentinean | 1,335 | 0.2% |
| Armenian | 2,164 | 0.3% |
| Assyrian / Chaldean / Syriac | 463 | 0.1% |
| Australian | 1,094 | 0.1% |
| Austrian | 2,391 | 0.3% |
| Bangladeshi | 307 | 0.0% |
| Barbadian | 81 | 0.0% |
| Basque | 473 | 0.1% |
| Belgian | 1,051 | 0.1% |
| Belizean | 44 | 0.0% |
| Bermudan | 32 | 0.0% |
| Bhutanese | 16,945 | 2.0% |
| Blackfeet | 172 | 0.0% |
| Bolivian | 233 | 0.0% |
| Brazilian | 2,205 | 0.3% |
| British | 6,902 | 0.8% |
| British West Indian | 89 | 0.0% |
| Bulgarian | 564 | 0.1% |
| Burmese | 15,705 | 1.8% |
| Cajun | 85 | 0.0% |
| Cambodian | 538 | 0.1% |
| Canadian | 1,923 | 0.2% |
| Cape Verdean | 163 | 0.0% |
| Celtic | 120 | 0.0% |
| Central American | 34,422 | 4.0% |
| Central American Indian | 1,918 | 0.2% |
| Cherokee | 1,394 | 0.2% |
| Cheyenne | 8 | 0.0% |
| Chickasaw | 120 | 0.0% |
| Chilean | 858 | 0.1% |
| Chinese | 132 | 0.0% |
| Chippewa | 336 | 0.0% |
| Choctaw | 523 | 0.1% |
| Colombian | 2,295 | 0.3% |
| Comanche | 14 | 0.0% |
| Costa Rican | 595 | 0.1% |
| Cree | 27 | 0.0% |
| Creek | 128 | 0.0% |
| Croatian | 1,752 | 0.2% |
| Crow | 63 | 0.0% |
| Cuban | 2,127 | 0.3% |
| Cypriot | 15 | 0.0% |
| Czech | 2,519 | 0.3% |
| Czechoslovakian | 250 | 0.0% |
| Danish | 2,848 | 0.3% |
| Delaware | 50 | 0.0% |
| Dominican | 306 | 0.0% |
| Dutch | 5,477 | 0.6% |
| Dutch West Indian | 83 | 0.0% |
| Eastern European | 6,556 | 0.8% |
| Ecuadorian | 681 | 0.1% |
| Egyptian | 1,002 | 0.1% |
| English | 48,882 | 5.7% |
| Estonian | 14 | 0.0% |
| Ethiopian | 1,671 | 0.2% |
| European | 17,976 | 2.1% |
| Fijian | 7 | 0.0% |
| Filipino | 4,722 | 0.5% |
| Finnish | 1,655 | 0.2% |
| French | 18,078 | 2.1% |
| French American Indian | 45 | 0.0% |
| French Canadian | 2,332 | 0.3% |
| German | 59,393 | 7.0% |
| German Russian | 10 | 0.0% |
| Ghanaian | 173 | 0.0% |
| Greek | 4,907 | 0.6% |
| Guamanian / Chamorro | 682 | 0.1% |
| Guatemalan | 5,978 | 0.7% |
| Guyanese | 201 | 0.0% |
| Haitian | 366 | 0.0% |
| Honduran | 3,132 | 0.4% |
| Hopi | 68 | 0.0% |
| Hungarian | 3,166 | 0.4% |
| Icelander | 160 | 0.0% |
| Indian (Asian) | 198,779 | 23.4% |
| Indonesian | 936 | 0.1% |
| Iranian | 3,642 | 0.4% |
| Iraqi | 639 | 0.1% |
| Irish | 63,955 | 7.5% |
| Iroquois | 201 | 0.0% |
| Israeli | 749 | 0.1% |
| Italian | 38,497 | 4.5% |
| Jamaican | 982 | 0.1% |
| Japanese | 1,806 | 0.2% |
| Jordanian | 203 | 0.0% |
| Kenyan | 420 | 0.1% |
| Kiowa | 15 | 0.0% |
| Korean | 43,531 | 5.1% |
| Laotian | 1,160 | 0.1% |
| Latvian | 489 | 0.1% |
| Lebanese | 1,951 | 0.2% |
| Liberian | 138 | 0.0% |
| Lithuanian | 2,360 | 0.3% |
| Lumbee | 20 | 0.0% |
| Luxembourger | 62 | 0.0% |
| Macedonian | 171 | 0.0% |
| Malaysian | 945 | 0.1% |
| Maltese | 222 | 0.0% |
| Menominee | 6 | 0.0% |
| Mexican | 65,389 | 7.7% |
| Mexican American Indian | 1,801 | 0.2% |
| Mongolian | 414 | 0.1% |
| Moroccan | 593 | 0.1% |
| Native Hawaiian | 1,871 | 0.2% |
| Navajo | 448 | 0.1% |
| Nepalese | 7 | 0.0% |
| New Zealander | 208 | 0.0% |
| Nicaraguan | 7,391 | 0.9% |
| Nigerian | 1,007 | 0.1% |
| Northern European | 2,646 | 0.3% |
| Norwegian | 7,299 | 0.9% |
| Okinawan | 162 | 0.0% |
| Osage | 12 | 0.0% |
| Paiute | 104 | 0.0% |
| Pakistani | 2,587 | 0.3% |
| Palestinian | 569 | 0.1% |
| Panamanian | 674 | 0.1% |
| Paraguayan | 134 | 0.0% |
| Pennsylvania German | 74 | 0.0% |
| Peruvian | 4,248 | 0.5% |
| Pima | 18 | 0.0% |
| Polish | 15,213 | 1.8% |
| Portuguese | 4,025 | 0.5% |
| Pueblo | 118 | 0.0% |
| Puerto Rican | 6,022 | 0.7% |
| Romanian | 1,536 | 0.2% |
| Russian | 15,347 | 1.8% |
| Salvadoran | 16,448 | 1.9% |
| Samoan | 2,038 | 0.2% |
| Scandinavian | 1,734 | 0.2% |
| Scotch-Irish | 3,764 | 0.4% |
| Scottish | 11,038 | 1.3% |
| Seminole | 144 | 0.0% |
| Senegalese | 19 | 0.0% |
| Serbian | 661 | 0.1% |
| Sierra Leonean | 43 | 0.0% |
| Sioux | 283 | 0.0% |
| Slavic | 281 | 0.0% |
| Slovak | 933 | 0.1% |
| Slovene | 757 | 0.1% |
| Somali | 12 | 0.0% |
| South African | 431 | 0.1% |
| South American | 11,319 | 1.3% |
| South American Indian | 213 | 0.0% |
| Soviet Union | 48 | 0.0% |
| Spaniard | 3,726 | 0.4% |
| Spanish | 3,092 | 0.4% |
| Spanish American | 68 | 0.0% |
| Spanish American Indian | 68 | 0.0% |
| Sri Lankan | 21,812 | 2.6% |
| Subsaharan African | 6,959 | 0.8% |
| Sudanese | 136 | 0.0% |
| Swedish | 8,696 | 1.0% |
| Swiss | 2,525 | 0.3% |
| Syrian | 671 | 0.1% |
| Taiwanese | 25 | 0.0% |
| Thai | 27,613 | 3.2% |
| Tlingit-Haida | 42 | 0.0% |
| Tongan | 429 | 0.1% |
| Trinidadian and Tobagonian | 59 | 0.0% |
| Turkish | 1,587 | 0.2% |
| U.S. Virgin Islander | 2 | 0.0% |
| Ugandan | 135 | 0.0% |
| Ukrainian | 5,454 | 0.6% |
| Uruguayan | 333 | 0.0% |
| Ute | 14 | 0.0% |
| Venezuelan | 1,111 | 0.1% |
| Vietnamese | 335 | 0.0% |
| Welsh | 3,298 | 0.4% |
| West Indian | 232 | 0.0% |
| Yaqui | 92 | 0.0% |
| Yugoslavian | 244 | 0.0% |
| Yup'ik | 17 | 0.0% |
| Zimbabwean | 45 | 0.0% | View All 184 Rows |
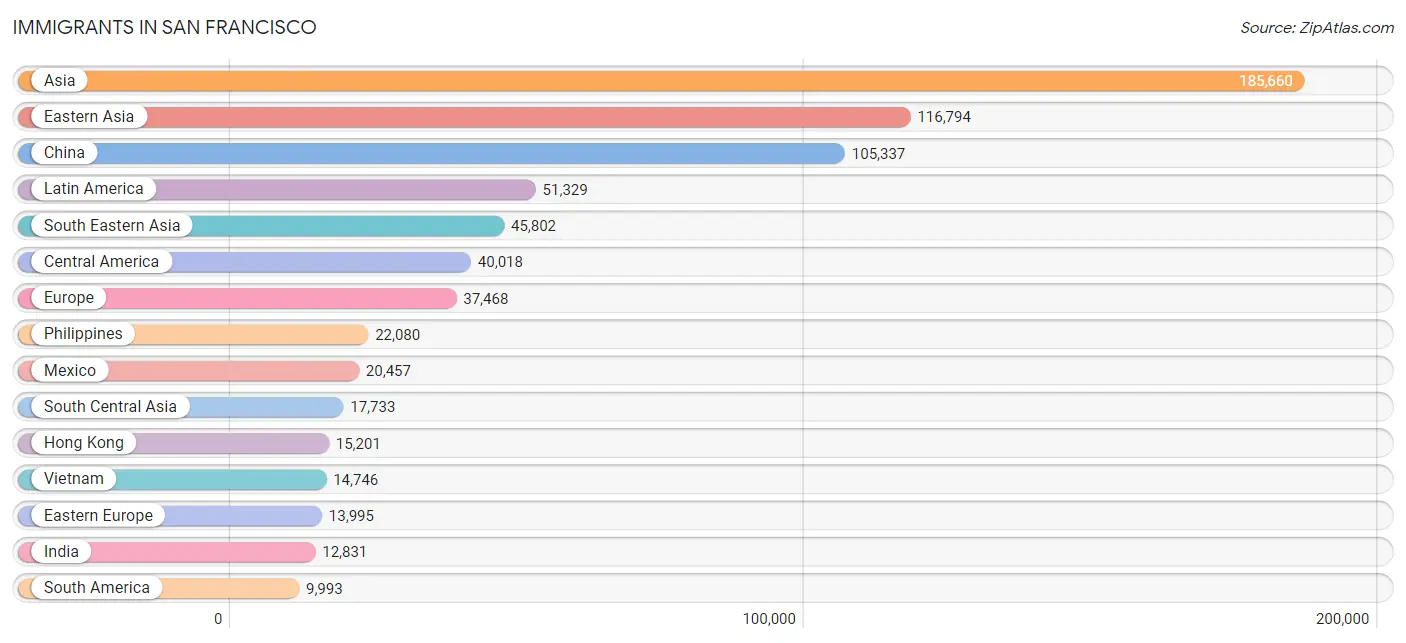
Immigrants in San Francisco
The most numerous immigrant groups reported in San Francisco came from Asia (185,660 | 21.8%), Eastern Asia (116,794 | 13.7%), China (105,337 | 12.4%), Latin America (51,329 | 6.0%), and South Eastern Asia (45,802 | 5.4%), together accounting for 59.3% of all San Francisco residents.
| Immigration Origin | # Population | % Population |
| Afghanistan | 158 | 0.0% |
| Africa | 4,729 | 0.6% |
| Albania | 71 | 0.0% |
| Argentina | 713 | 0.1% |
| Armenia | 331 | 0.0% |
| Asia | 185,660 | 21.8% |
| Australia | 2,009 | 0.2% |
| Austria | 296 | 0.0% |
| Azores | 8 | 0.0% |
| Bahamas | 55 | 0.0% |
| Bangladesh | 406 | 0.1% |
| Barbados | 46 | 0.0% |
| Belarus | 585 | 0.1% |
| Belgium | 906 | 0.1% |
| Belize | 102 | 0.0% |
| Bolivia | 81 | 0.0% |
| Bosnia and Herzegovina | 104 | 0.0% |
| Brazil | 3,010 | 0.4% |
| Bulgaria | 332 | 0.0% |
| Cabo Verde | 80 | 0.0% |
| Cambodia | 887 | 0.1% |
| Cameroon | 52 | 0.0% |
| Canada | 5,354 | 0.6% |
| Caribbean | 1,318 | 0.2% |
| Central America | 40,018 | 4.7% |
| Chile | 310 | 0.0% |
| China | 105,337 | 12.4% |
| Colombia | 1,484 | 0.2% |
| Costa Rica | 249 | 0.0% |
| Croatia | 134 | 0.0% |
| Cuba | 460 | 0.1% |
| Czechoslovakia | 167 | 0.0% |
| Denmark | 349 | 0.0% |
| Dominican Republic | 102 | 0.0% |
| Eastern Africa | 1,666 | 0.2% |
| Eastern Asia | 116,794 | 13.7% |
| Eastern Europe | 13,995 | 1.6% |
| Ecuador | 154 | 0.0% |
| Egypt | 407 | 0.1% |
| El Salvador | 9,240 | 1.1% |
| England | 1,548 | 0.2% |
| Eritrea | 213 | 0.0% |
| Ethiopia | 678 | 0.1% |
| Europe | 37,468 | 4.4% |
| Fiji | 264 | 0.0% |
| France | 4,383 | 0.5% |
| Germany | 3,218 | 0.4% |
| Ghana | 57 | 0.0% |
| Greece | 407 | 0.1% |
| Grenada | 33 | 0.0% |
| Guatemala | 3,718 | 0.4% |
| Guyana | 96 | 0.0% |
| Haiti | 42 | 0.0% |
| Honduras | 2,260 | 0.3% |
| Hong Kong | 15,201 | 1.8% |
| Hungary | 474 | 0.1% |
| India | 12,831 | 1.5% |
| Indonesia | 934 | 0.1% |
| Iran | 2,003 | 0.2% |
| Iraq | 251 | 0.0% |
| Ireland | 2,924 | 0.3% |
| Israel | 781 | 0.1% |
| Italy | 2,077 | 0.2% |
| Jamaica | 440 | 0.1% |
| Japan | 4,505 | 0.5% |
| Jordan | 254 | 0.0% |
| Kazakhstan | 259 | 0.0% |
| Kenya | 491 | 0.1% |
| Korea | 6,705 | 0.8% |
| Kuwait | 86 | 0.0% |
| Laos | 414 | 0.1% |
| Latin America | 51,329 | 6.0% |
| Latvia | 126 | 0.0% |
| Lebanon | 371 | 0.0% |
| Liberia | 111 | 0.0% |
| Lithuania | 178 | 0.0% |
| Malaysia | 1,096 | 0.1% |
| Mexico | 20,457 | 2.4% |
| Middle Africa | 52 | 0.0% |
| Moldova | 395 | 0.1% |
| Morocco | 384 | 0.1% |
| Nepal | 740 | 0.1% |
| Netherlands | 586 | 0.1% |
| Nicaragua | 3,618 | 0.4% |
| Nigeria | 463 | 0.1% |
| North Macedonia | 64 | 0.0% |
| Northern Africa | 1,407 | 0.2% |
| Northern Europe | 9,467 | 1.1% |
| Norway | 247 | 0.0% |
| Oceania | 3,629 | 0.4% |
| Pakistan | 745 | 0.1% |
| Panama | 371 | 0.0% |
| Peru | 2,712 | 0.3% |
| Philippines | 22,080 | 2.6% |
| Poland | 630 | 0.1% |
| Portugal | 102 | 0.0% |
| Romania | 438 | 0.1% |
| Russia | 5,152 | 0.6% |
| Saudi Arabia | 154 | 0.0% |
| Scotland | 214 | 0.0% |
| Senegal | 10 | 0.0% |
| Serbia | 26 | 0.0% |
| Sierra Leone | 13 | 0.0% |
| Singapore | 780 | 0.1% |
| Somalia | 80 | 0.0% |
| South Africa | 582 | 0.1% |
| South America | 9,993 | 1.2% |
| South Central Asia | 17,733 | 2.1% |
| South Eastern Asia | 45,802 | 5.4% |
| Southern Europe | 3,891 | 0.5% |
| Spain | 1,271 | 0.2% |
| Sri Lanka | 277 | 0.0% |
| Sudan | 48 | 0.0% |
| Sweden | 435 | 0.1% |
| Switzerland | 490 | 0.1% |
| Syria | 272 | 0.0% |
| Taiwan | 5,563 | 0.6% |
| Thailand | 1,792 | 0.2% |
| Trinidad and Tobago | 74 | 0.0% |
| Turkey | 1,034 | 0.1% |
| Uganda | 37 | 0.0% |
| Ukraine | 4,106 | 0.5% |
| Uruguay | 250 | 0.0% |
| Uzbekistan | 284 | 0.0% |
| Venezuela | 981 | 0.1% |
| Vietnam | 14,746 | 1.7% |
| West Indies | 4 | 0.0% |
| Western Africa | 940 | 0.1% |
| Western Asia | 5,064 | 0.6% |
| Western Europe | 9,934 | 1.2% |
| Yemen | 847 | 0.1% |
| Zimbabwe | 50 | 0.0% | View All 132 Rows |
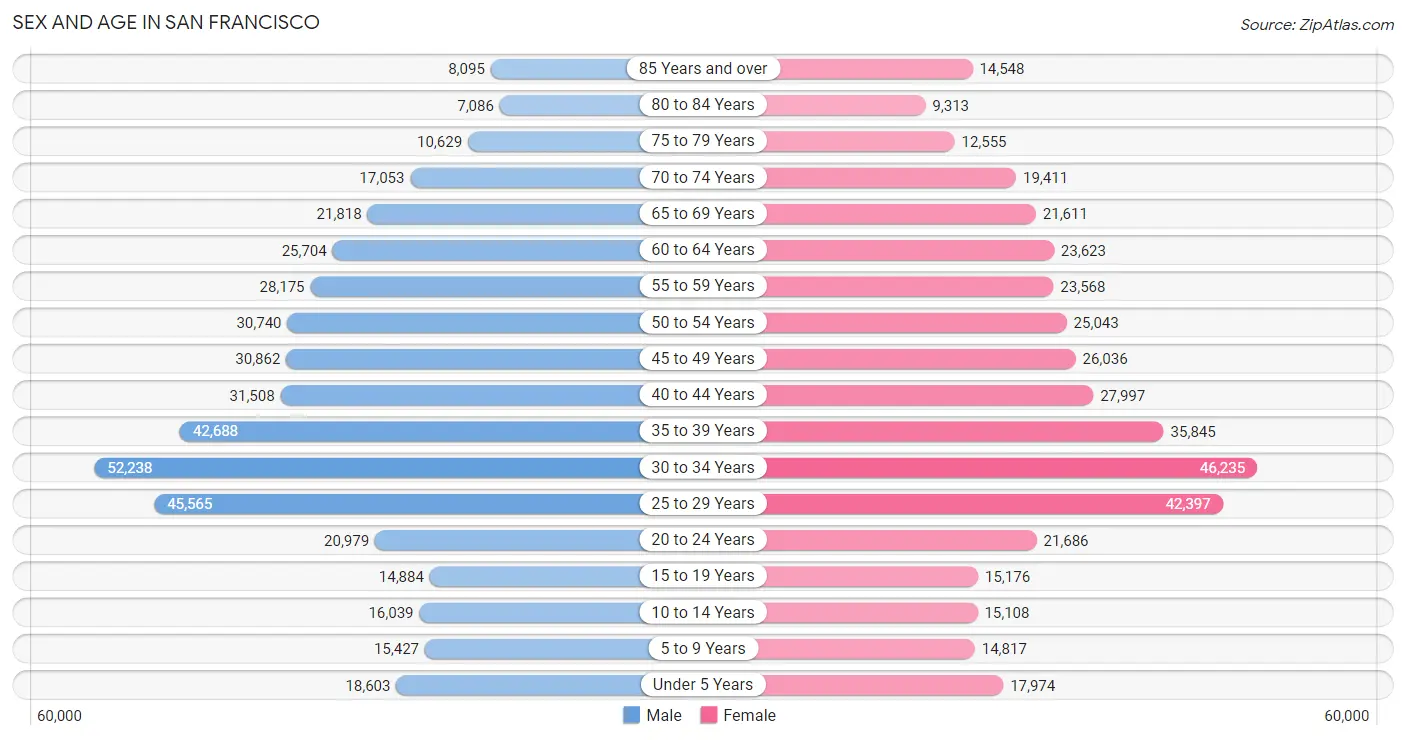
Sex and Age in San Francisco
Sex and Age in San Francisco
The most populous age groups in San Francisco are 30 to 34 Years (52,238 | 11.9%) for men and 30 to 34 Years (46,235 | 11.2%) for women.
| Age Bracket | Male | Female |
| Under 5 Years | 18,603 (4.3%) | 17,974 (4.3%) |
| 5 to 9 Years | 15,427 (3.5%) | 14,817 (3.6%) |
| 10 to 14 Years | 16,039 (3.7%) | 15,108 (3.7%) |
| 15 to 19 Years | 14,884 (3.4%) | 15,176 (3.7%) |
| 20 to 24 Years | 20,979 (4.8%) | 21,686 (5.2%) |
| 25 to 29 Years | 45,565 (10.4%) | 42,397 (10.3%) |
| 30 to 34 Years | 52,238 (11.9%) | 46,235 (11.2%) |
| 35 to 39 Years | 42,688 (9.7%) | 35,845 (8.7%) |
| 40 to 44 Years | 31,508 (7.2%) | 27,997 (6.8%) |
| 45 to 49 Years | 30,862 (7.0%) | 26,036 (6.3%) |
| 50 to 54 Years | 30,740 (7.0%) | 25,043 (6.1%) |
| 55 to 59 Years | 28,175 (6.4%) | 23,568 (5.7%) |
| 60 to 64 Years | 25,704 (5.9%) | 23,623 (5.7%) |
| 65 to 69 Years | 21,818 (5.0%) | 21,611 (5.2%) |
| 70 to 74 Years | 17,053 (3.9%) | 19,411 (4.7%) |
| 75 to 79 Years | 10,629 (2.4%) | 12,555 (3.0%) |
| 80 to 84 Years | 7,086 (1.6%) | 9,313 (2.3%) |
| 85 Years and over | 8,095 (1.8%) | 14,548 (3.5%) |
| Total | 438,093 (100.0%) | 412,943 (100.0%) |
Families and Households in San Francisco
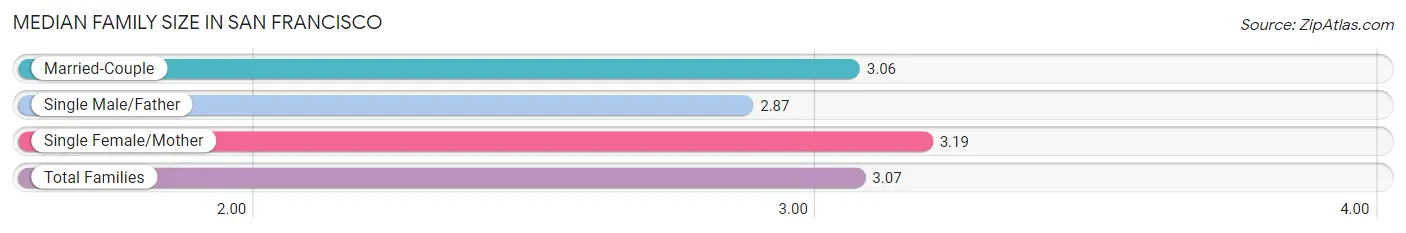
Median Family Size in San Francisco
The median family size in San Francisco is 3.07 persons per family, with single female/mother families (27,515 | 16.2%) accounting for the largest median family size of 3.19 persons per family. On the other hand, single male/father families (13,131 | 7.7%) represent the smallest median family size with 2.87 persons per family.
| Family Type | # Families | Family Size |
| Married-Couple | 129,039 (76.0%) | 3.06 |
| Single Male/Father | 13,131 (7.7%) | 2.87 |
| Single Female/Mother | 27,515 (16.2%) | 3.19 |
| Total Families | 169,685 (100.0%) | 3.07 |
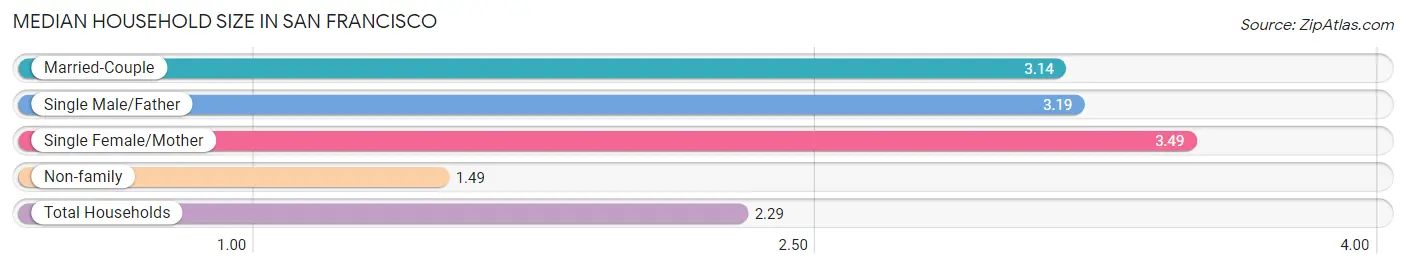
Median Household Size in San Francisco
The median household size in San Francisco is 2.29 persons per household, with single female/mother households (27,515 | 7.6%) accounting for the largest median household size of 3.49 persons per household. non-family households (191,157 | 53.0%) represent the smallest median household size with 1.49 persons per household.
| Household Type | # Households | Household Size |
| Married-Couple | 129,039 (35.8%) | 3.14 |
| Single Male/Father | 13,131 (3.6%) | 3.19 |
| Single Female/Mother | 27,515 (7.6%) | 3.49 |
| Non-family | 191,157 (53.0%) | 1.49 |
| Total Households | 360,842 (100.0%) | 2.29 |
Household Size by Marriage Status in San Francisco
Out of a total of 360,842 households in San Francisco, 169,685 (47.0%) are family households, while 191,157 (53.0%) are nonfamily households. The most numerous type of family households are 2-person households, comprising 77,752, and the most common type of nonfamily households are 1-person households, comprising 133,766.
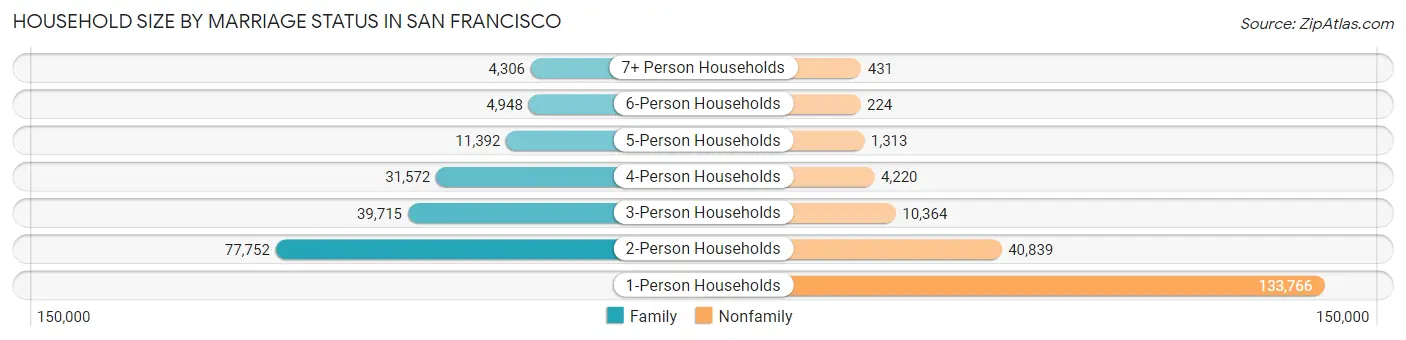
| Household Size | Family Households | Nonfamily Households |
| 1-Person Households | - | 133,766 (37.1%) |
| 2-Person Households | 77,752 (21.5%) | 40,839 (11.3%) |
| 3-Person Households | 39,715 (11.0%) | 10,364 (2.9%) |
| 4-Person Households | 31,572 (8.7%) | 4,220 (1.2%) |
| 5-Person Households | 11,392 (3.2%) | 1,313 (0.4%) |
| 6-Person Households | 4,948 (1.4%) | 224 (0.1%) |
| 7+ Person Households | 4,306 (1.2%) | 431 (0.1%) |
| Total | 169,685 (47.0%) | 191,157 (53.0%) |
Female Fertility in San Francisco
Fertility by Age in San Francisco
Average fertility rate in San Francisco is 37.0 births per 1,000 women. Women in the age bracket of 35 to 50 years have the highest fertility rate with 45.0 births per 1,000 women. Women in the age bracket of 35 to 50 years acount for 52.8% of all women with births.
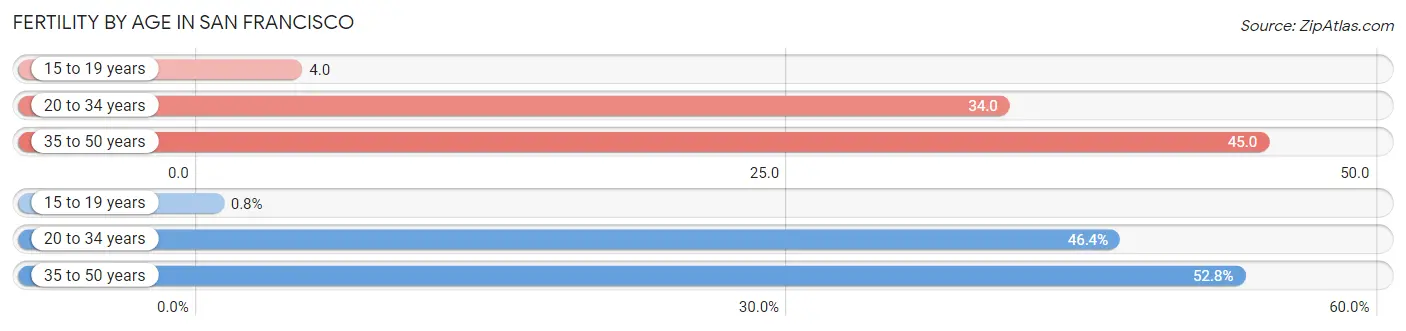
| Age Bracket | Women with Births | Births / 1,000 Women |
| 15 to 19 years | 65 (0.8%) | 4.0 |
| 20 to 34 years | 3,758 (46.4%) | 34.0 |
| 35 to 50 years | 4,274 (52.8%) | 45.0 |
| Total | 8,097 (100.0%) | 37.0 |
Fertility by Age by Marriage Status in San Francisco
82.8% of women with births (8,097) in San Francisco are married. The highest percentage of unmarried women with births falls into 15 to 19 years age bracket with 100.0% of them unmarried at the time of birth, while the lowest percentage of unmarried women with births belong to 35 to 50 years age bracket with 11.6% of them unmarried.
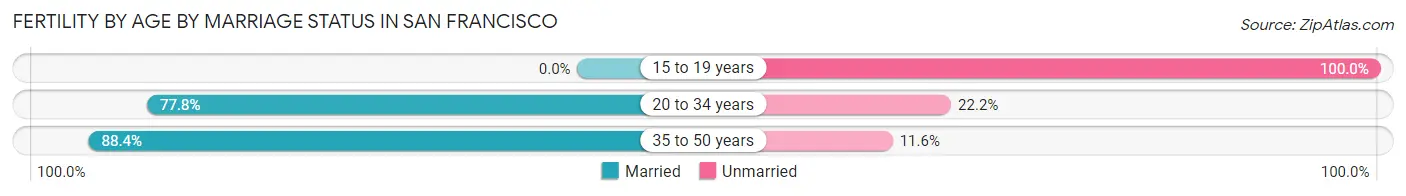
| Age Bracket | Married | Unmarried |
| 15 to 19 years | 0 (0.0%) | 65 (100.0%) |
| 20 to 34 years | 2,924 (77.8%) | 834 (22.2%) |
| 35 to 50 years | 3,778 (88.4%) | 496 (11.6%) |
| Total | 6,704 (82.8%) | 1,393 (17.2%) |
Fertility by Education in San Francisco
Average fertility rate in San Francisco is 37.0 births per 1,000 women. Women with the education attainment of graduate degree have the highest fertility rate of 52.0 births per 1,000 women, while women with the education attainment of less than high school have the lowest fertility at 26.0 births per 1,000 women. Women with the education attainment of graduate degree represent 36.4% of all women with births.
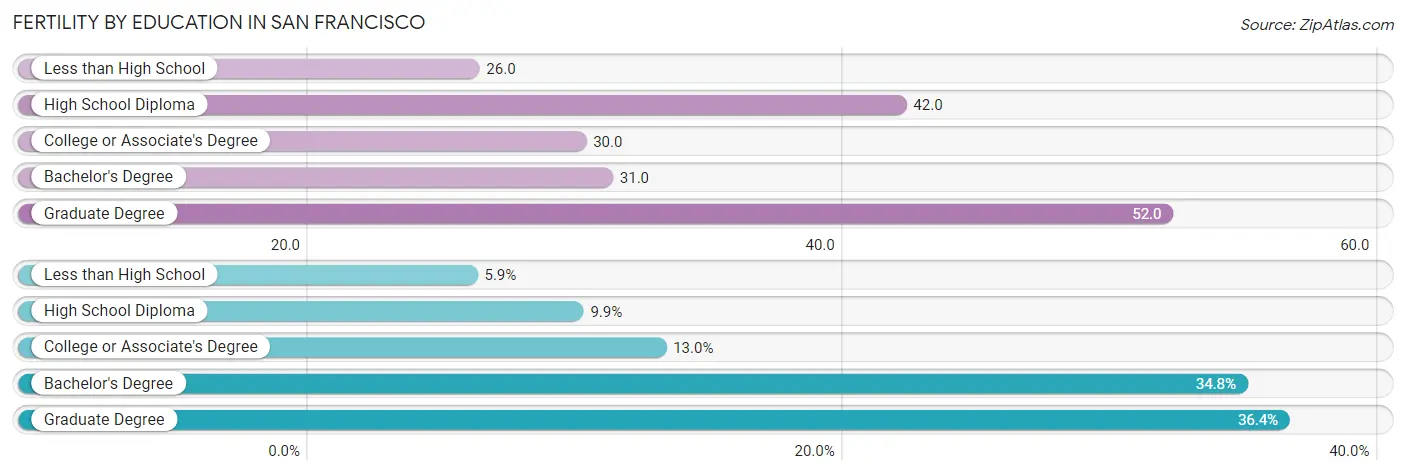
| Educational Attainment | Women with Births | Births / 1,000 Women |
| Less than High School | 480 (5.9%) | 26.0 |
| High School Diploma | 802 (9.9%) | 42.0 |
| College or Associate's Degree | 1,053 (13.0%) | 30.0 |
| Bachelor's Degree | 2,817 (34.8%) | 31.0 |
| Graduate Degree | 2,945 (36.4%) | 52.0 |
| Total | 8,097 (100.0%) | 37.0 |
Fertility by Education by Marriage Status in San Francisco
17.2% of women with births in San Francisco are unmarried. Women with the educational attainment of graduate degree are most likely to be married with 95.0% of them married at childbirth, while women with the educational attainment of less than high school are least likely to be married with 56.0% of them unmarried at childbirth.
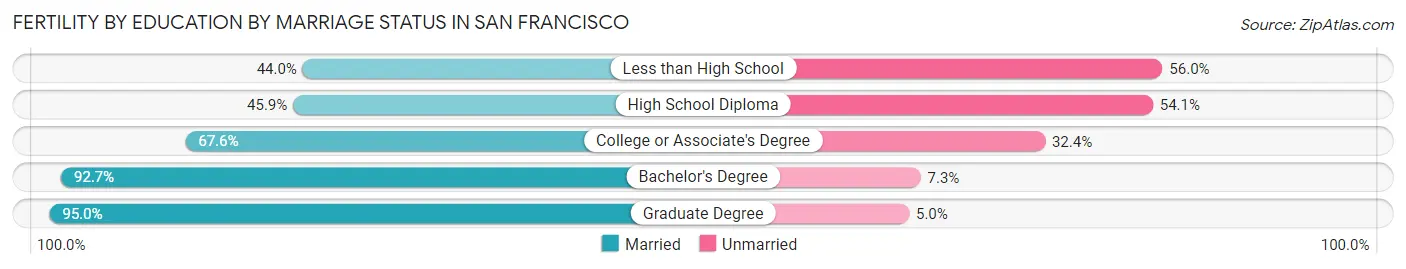
| Educational Attainment | Married | Unmarried |
| Less than High School | 211 (44.0%) | 269 (56.0%) |
| High School Diploma | 368 (45.9%) | 434 (54.1%) |
| College or Associate's Degree | 712 (67.6%) | 341 (32.4%) |
| Bachelor's Degree | 2,611 (92.7%) | 206 (7.3%) |
| Graduate Degree | 2,798 (95.0%) | 147 (5.0%) |
| Total | 6,704 (82.8%) | 1,393 (17.2%) |
Employment Characteristics in San Francisco
Employment by Class of Employer in San Francisco
Among the 487,526 employed individuals in San Francisco, private company employees (333,338 | 68.4%), not-for-profit organizations (44,270 | 9.1%), and self-employed (not incorporated) (33,809 | 6.9%) make up the most common classes of employment.
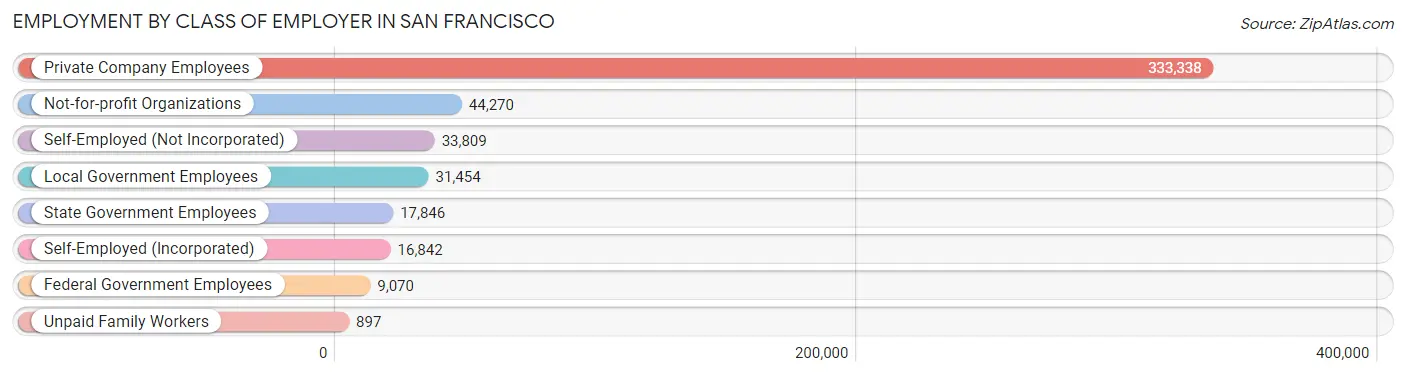
| Employer Class | # Employees | % Employees |
| Private Company Employees | 333,338 | 68.4% |
| Self-Employed (Incorporated) | 16,842 | 3.5% |
| Self-Employed (Not Incorporated) | 33,809 | 6.9% |
| Not-for-profit Organizations | 44,270 | 9.1% |
| Local Government Employees | 31,454 | 6.5% |
| State Government Employees | 17,846 | 3.7% |
| Federal Government Employees | 9,070 | 1.9% |
| Unpaid Family Workers | 897 | 0.2% |
| Total | 487,526 | 100.0% |
Employment Status by Age in San Francisco
According to the labor force statistics for San Francisco, out of the total population over 16 years of age (747,568), 70.4% or 526,288 individuals are in the labor force, with 5.4% or 28,420 of them unemployed. The age group with the highest labor force participation rate is 30 to 34 years, with 92.2% or 90,792 individuals in the labor force. Within the labor force, the 16 to 19 years age range has the highest percentage of unemployed individuals, with 15.6% or 1,230 of them being unemployed.
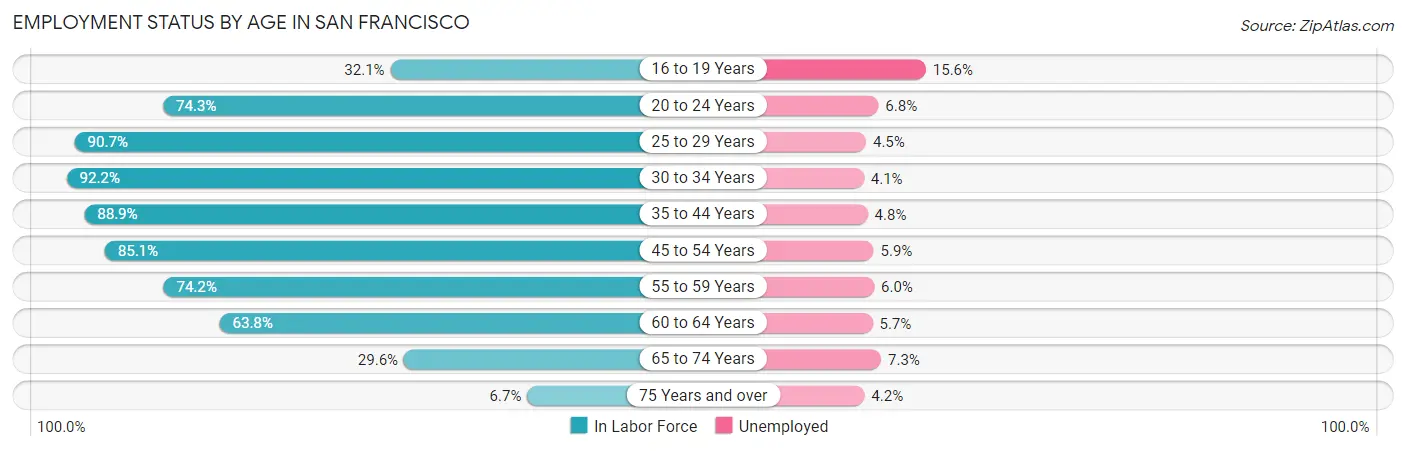
| Age Bracket | In Labor Force | Unemployed |
| 16 to 19 Years | 7,884 (32.1%) | 1,230 (15.6%) |
| 20 to 24 Years | 31,700 (74.3%) | 2,156 (6.8%) |
| 25 to 29 Years | 79,782 (90.7%) | 3,590 (4.5%) |
| 30 to 34 Years | 90,792 (92.2%) | 3,722 (4.1%) |
| 35 to 44 Years | 122,716 (88.9%) | 5,890 (4.8%) |
| 45 to 54 Years | 95,892 (85.1%) | 5,658 (5.9%) |
| 55 to 59 Years | 38,393 (74.2%) | 2,304 (6.0%) |
| 60 to 64 Years | 31,471 (63.8%) | 1,794 (5.7%) |
| 65 to 74 Years | 23,648 (29.6%) | 1,726 (7.3%) |
| 75 Years and over | 4,169 (6.7%) | 175 (4.2%) |
| Total | 526,288 (70.4%) | 28,420 (5.4%) |
Employment Status by Educational Attainment in San Francisco
According to labor force statistics for San Francisco, 85.3% of individuals (459,105) out of the total population between 25 and 64 years of age (538,224) are in the labor force, with 5.0% or 22,955 of them being unemployed. The group with the highest labor force participation rate are those with the educational attainment of bachelor's degree or higher, with 91.0% or 319,498 individuals in the labor force. Within the labor force, individuals with less than high school education have the highest percentage of unemployment, with 9.5% or 2,712 of them being unemployed.
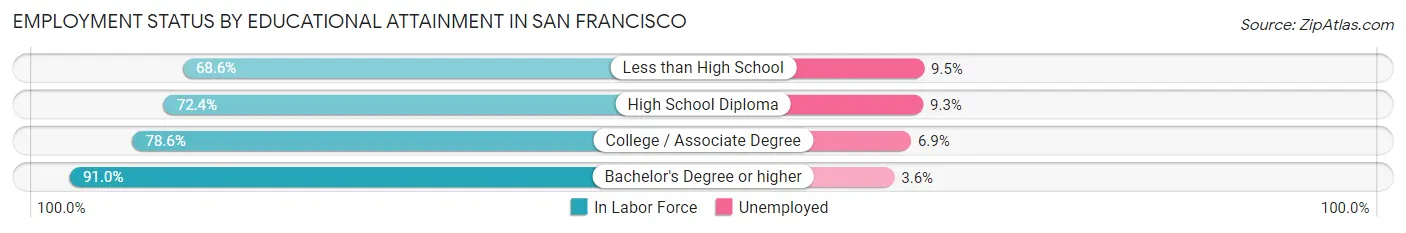
| Educational Attainment | In Labor Force | Unemployed |
| Less than High School | 28,546 (68.6%) | 3,953 (9.5%) |
| High School Diploma | 40,472 (72.4%) | 5,199 (9.3%) |
| College / Associate Degree | 70,437 (78.6%) | 6,183 (6.9%) |
| Bachelor's Degree or higher | 319,498 (91.0%) | 12,639 (3.6%) |
| Total | 459,105 (85.3%) | 26,911 (5.0%) |
Employment Occupations by Sex in San Francisco
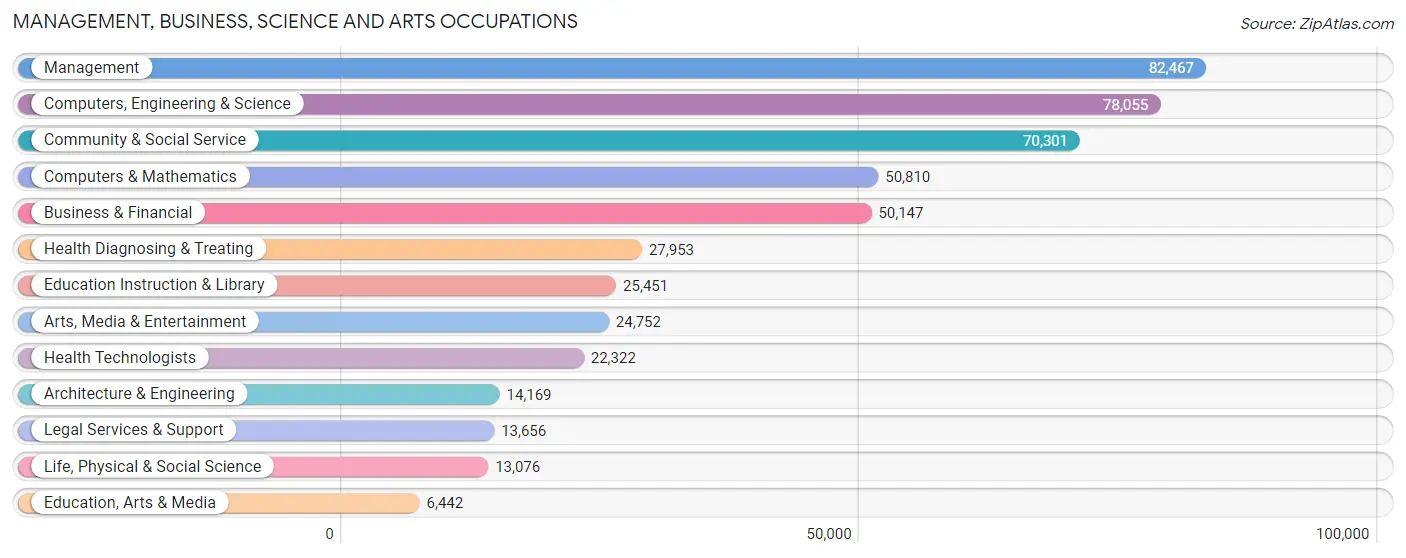
Management, Business, Science and Arts Occupations
The most common Management, Business, Science and Arts occupations in San Francisco are Management (82,467 | 16.6%), Computers, Engineering & Science (78,055 | 15.7%), Community & Social Service (70,301 | 14.1%), Computers & Mathematics (50,810 | 10.2%), and Business & Financial (50,147 | 10.1%).
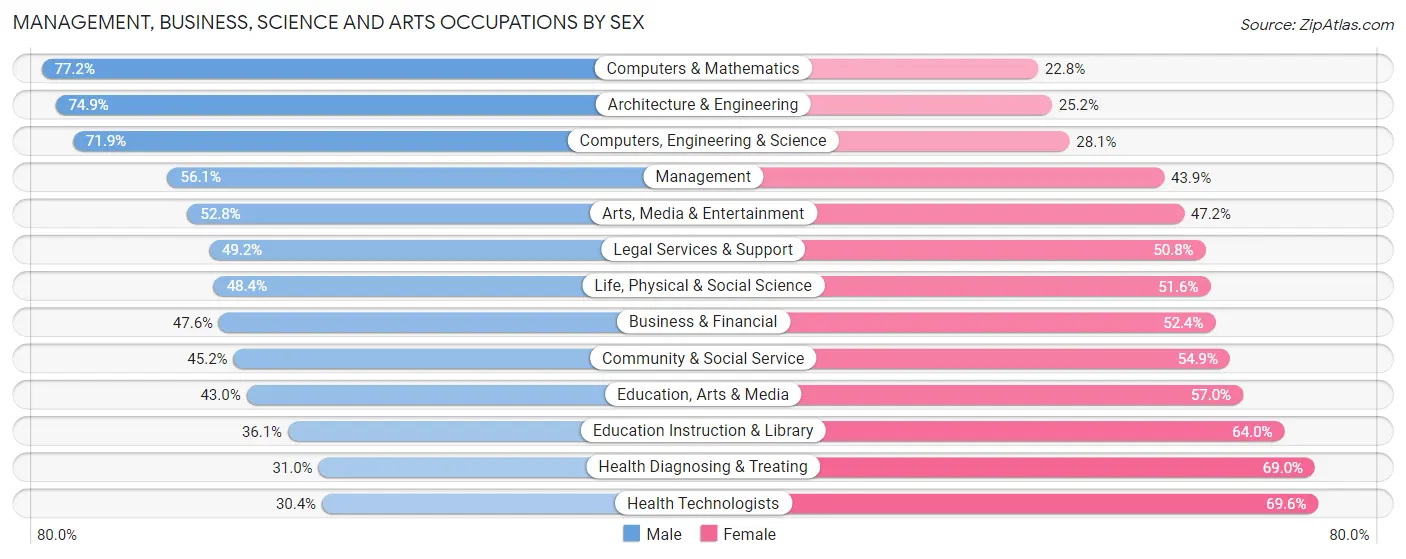
Management, Business, Science and Arts Occupations by Sex
Within the Management, Business, Science and Arts occupations in San Francisco, the most male-oriented occupations are Computers & Mathematics (77.2%), Architecture & Engineering (74.9%), and Computers, Engineering & Science (71.9%), while the most female-oriented occupations are Health Technologists (69.6%), Health Diagnosing & Treating (69.0%), and Education Instruction & Library (63.9%).
| Occupation | Male | Female |
| Management | 46,285 (56.1%) | 36,182 (43.9%) |
| Business & Financial | 23,855 (47.6%) | 26,292 (52.4%) |
| Computers, Engineering & Science | 56,146 (71.9%) | 21,909 (28.1%) |
| Computers & Mathematics | 39,208 (77.2%) | 11,602 (22.8%) |
| Architecture & Engineering | 10,605 (74.9%) | 3,564 (25.2%) |
| Life, Physical & Social Science | 6,333 (48.4%) | 6,743 (51.6%) |
| Community & Social Service | 31,741 (45.2%) | 38,560 (54.8%) |
| Education, Arts & Media | 2,768 (43.0%) | 3,674 (57.0%) |
| Legal Services & Support | 6,723 (49.2%) | 6,933 (50.8%) |
| Education Instruction & Library | 9,176 (36.0%) | 16,275 (63.9%) |
| Arts, Media & Entertainment | 13,074 (52.8%) | 11,678 (47.2%) |
| Health Diagnosing & Treating | 8,654 (31.0%) | 19,299 (69.0%) |
| Health Technologists | 6,782 (30.4%) | 15,540 (69.6%) |
| Total (Category) | 166,681 (54.0%) | 142,242 (46.0%) |
| Total (Overall) | 268,350 (53.9%) | 229,531 (46.1%) |
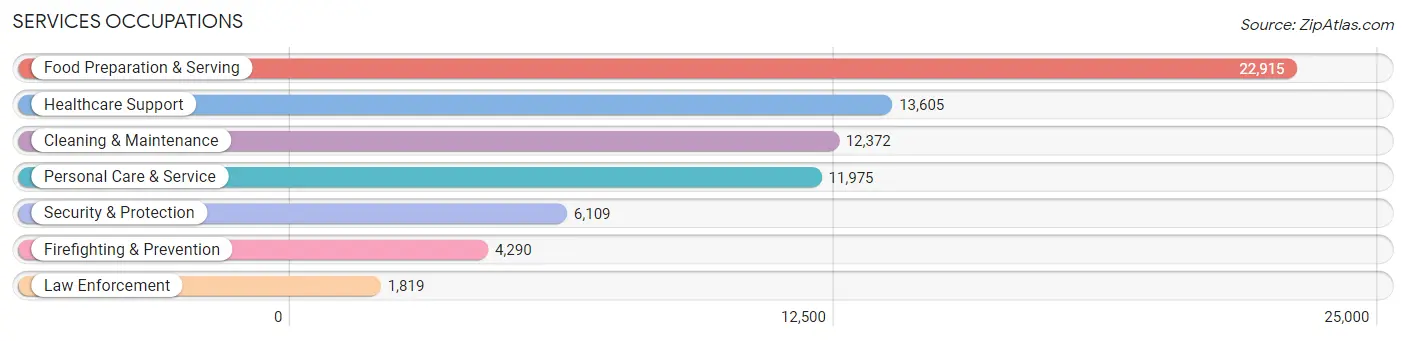
Services Occupations
The most common Services occupations in San Francisco are Food Preparation & Serving (22,915 | 4.6%), Healthcare Support (13,605 | 2.7%), Cleaning & Maintenance (12,372 | 2.5%), Personal Care & Service (11,975 | 2.4%), and Security & Protection (6,109 | 1.2%).
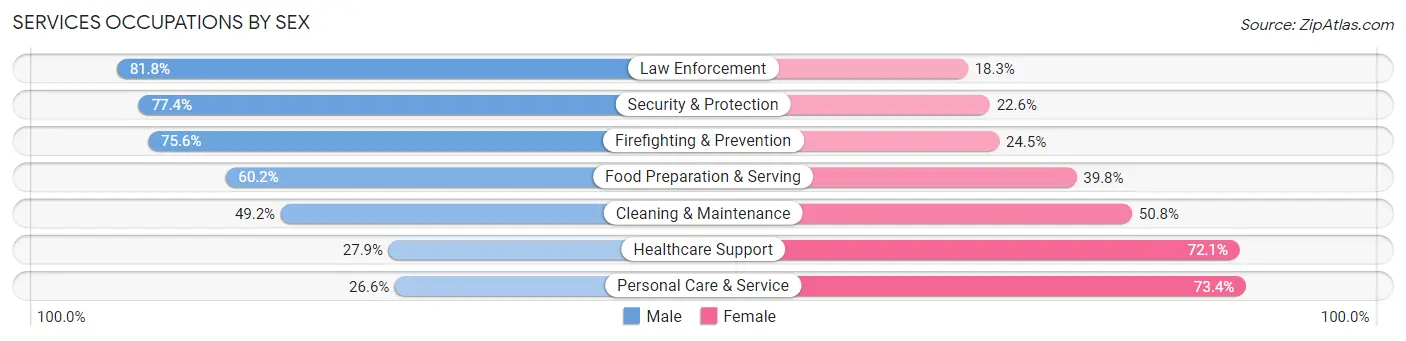
Services Occupations by Sex
Within the Services occupations in San Francisco, the most male-oriented occupations are Law Enforcement (81.8%), Security & Protection (77.4%), and Firefighting & Prevention (75.5%), while the most female-oriented occupations are Personal Care & Service (73.4%), Healthcare Support (72.1%), and Cleaning & Maintenance (50.8%).
| Occupation | Male | Female |
| Healthcare Support | 3,792 (27.9%) | 9,813 (72.1%) |
| Security & Protection | 4,728 (77.4%) | 1,381 (22.6%) |
| Firefighting & Prevention | 3,241 (75.5%) | 1,049 (24.4%) |
| Law Enforcement | 1,487 (81.8%) | 332 (18.2%) |
| Food Preparation & Serving | 13,804 (60.2%) | 9,111 (39.8%) |
| Cleaning & Maintenance | 6,092 (49.2%) | 6,280 (50.8%) |
| Personal Care & Service | 3,188 (26.6%) | 8,787 (73.4%) |
| Total (Category) | 31,604 (47.2%) | 35,372 (52.8%) |
| Total (Overall) | 268,350 (53.9%) | 229,531 (46.1%) |
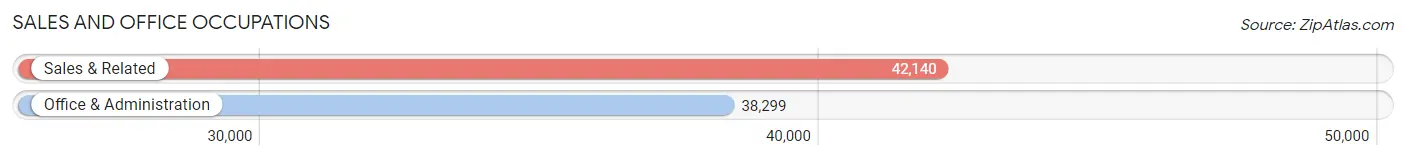
Sales and Office Occupations
The most common Sales and Office occupations in San Francisco are Sales & Related (42,140 | 8.5%), and Office & Administration (38,299 | 7.7%).
Sales and Office Occupations by Sex
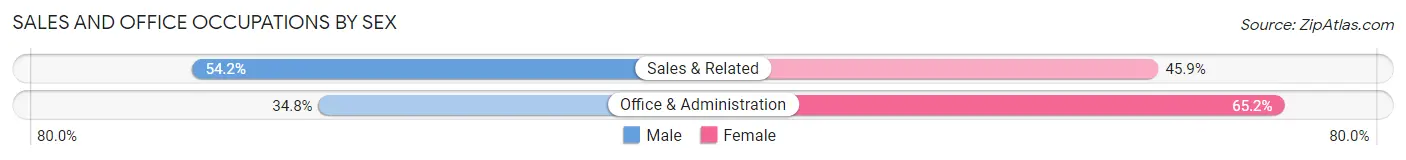
| Occupation | Male | Female |
| Sales & Related | 22,819 (54.1%) | 19,321 (45.9%) |
| Office & Administration | 13,327 (34.8%) | 24,972 (65.2%) |
| Total (Category) | 36,146 (44.9%) | 44,293 (55.1%) |
| Total (Overall) | 268,350 (53.9%) | 229,531 (46.1%) |
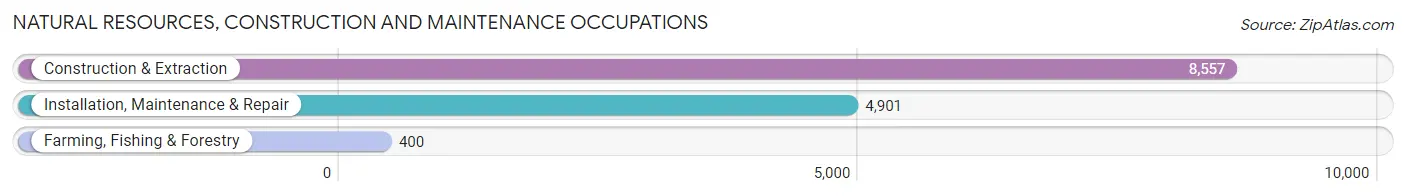
Natural Resources, Construction and Maintenance Occupations
The most common Natural Resources, Construction and Maintenance occupations in San Francisco are Construction & Extraction (8,557 | 1.7%), Installation, Maintenance & Repair (4,901 | 1.0%), and Farming, Fishing & Forestry (400 | 0.1%).
Natural Resources, Construction and Maintenance Occupations by Sex
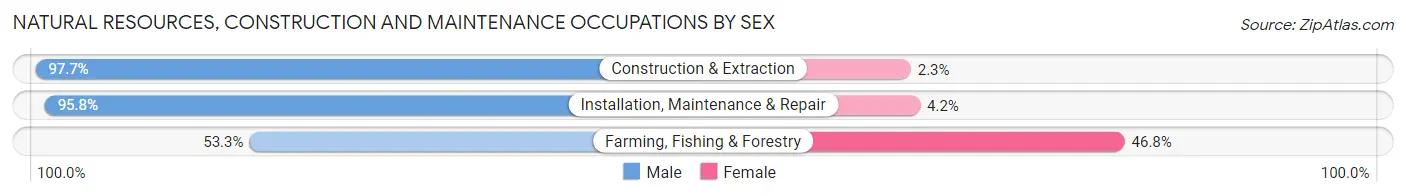
| Occupation | Male | Female |
| Farming, Fishing & Forestry | 213 (53.2%) | 187 (46.8%) |
| Construction & Extraction | 8,364 (97.7%) | 193 (2.3%) |
| Installation, Maintenance & Repair | 4,695 (95.8%) | 206 (4.2%) |
| Total (Category) | 13,272 (95.8%) | 586 (4.2%) |
| Total (Overall) | 268,350 (53.9%) | 229,531 (46.1%) |
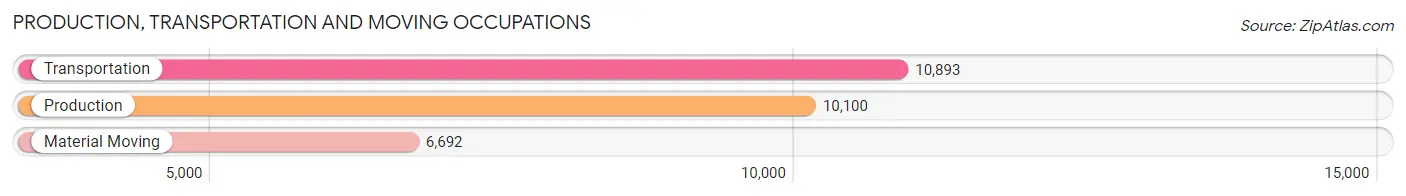
Production, Transportation and Moving Occupations
The most common Production, Transportation and Moving occupations in San Francisco are Transportation (10,893 | 2.2%), Production (10,100 | 2.0%), and Material Moving (6,692 | 1.3%).
Production, Transportation and Moving Occupations by Sex
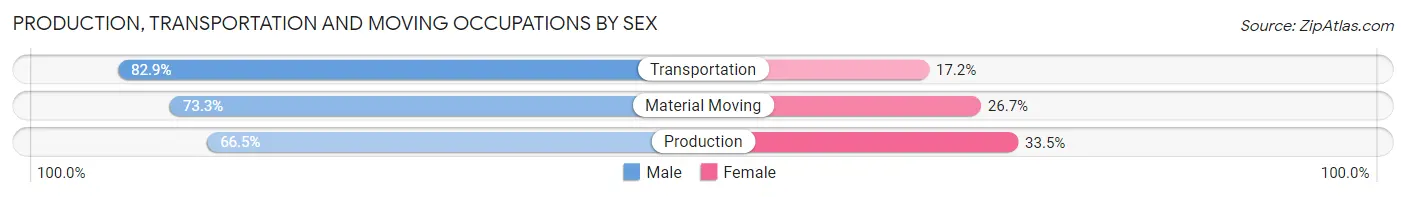
| Occupation | Male | Female |
| Production | 6,715 (66.5%) | 3,385 (33.5%) |
| Transportation | 9,025 (82.9%) | 1,868 (17.2%) |
| Material Moving | 4,907 (73.3%) | 1,785 (26.7%) |
| Total (Category) | 20,647 (74.6%) | 7,038 (25.4%) |
| Total (Overall) | 268,350 (53.9%) | 229,531 (46.1%) |
Employment Industries by Sex in San Francisco
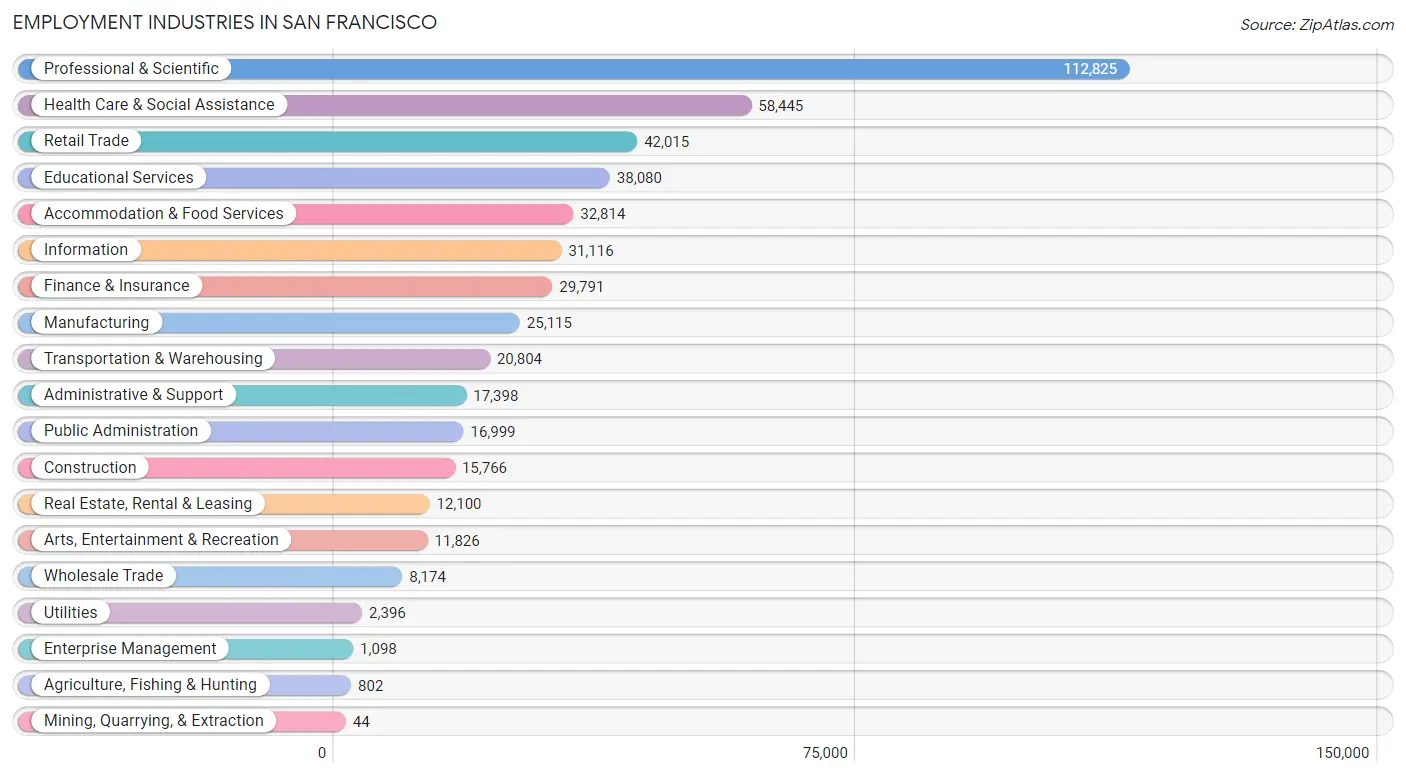
Employment Industries in San Francisco
The major employment industries in San Francisco include Professional & Scientific (112,825 | 22.7%), Health Care & Social Assistance (58,445 | 11.7%), Retail Trade (42,015 | 8.4%), Educational Services (38,080 | 7.6%), and Accommodation & Food Services (32,814 | 6.6%).
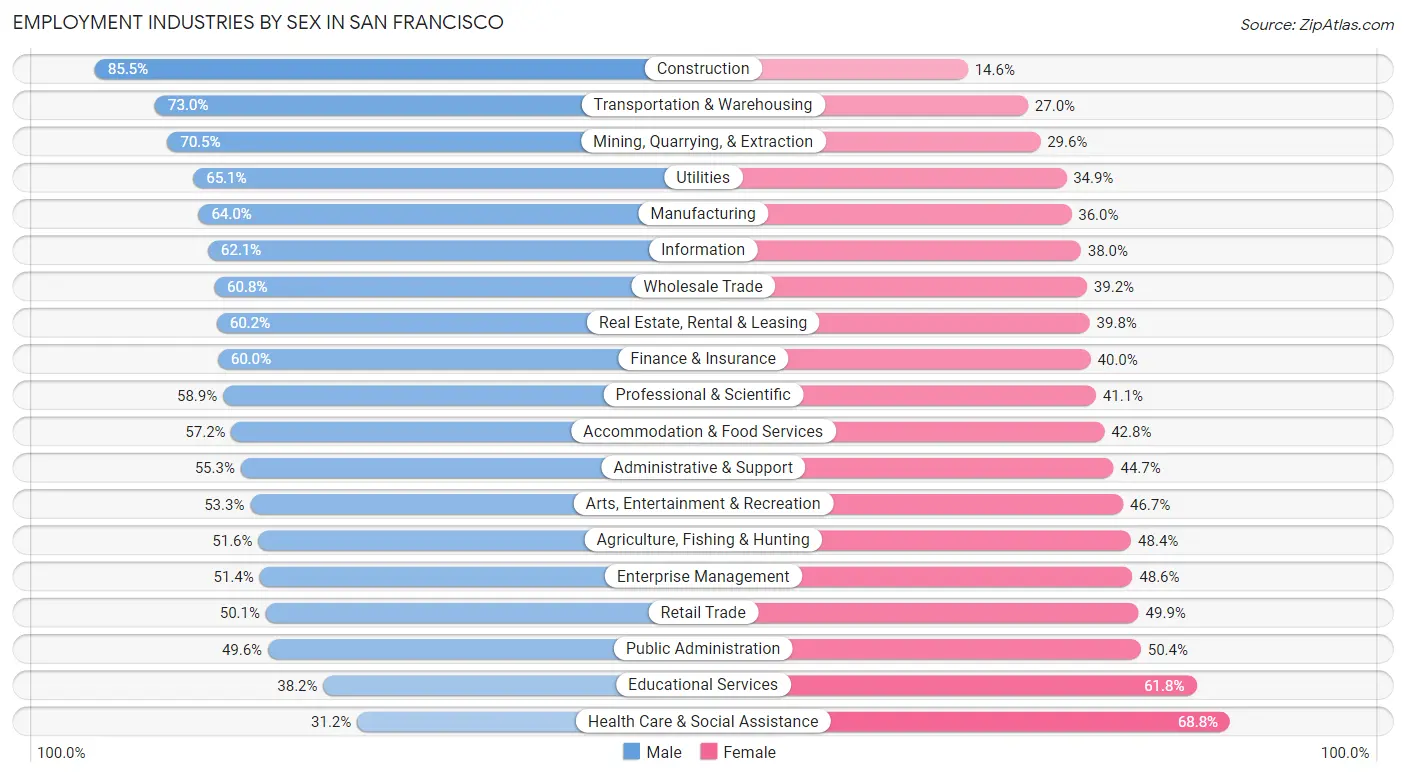
Employment Industries by Sex in San Francisco
The San Francisco industries that see more men than women are Construction (85.5%), Transportation & Warehousing (73.0%), and Mining, Quarrying, & Extraction (70.5%), whereas the industries that tend to have a higher number of women are Health Care & Social Assistance (68.8%), Educational Services (61.8%), and Public Administration (50.4%).
| Industry | Male | Female |
| Agriculture, Fishing & Hunting | 414 (51.6%) | 388 (48.4%) |
| Mining, Quarrying, & Extraction | 31 (70.5%) | 13 (29.5%) |
| Construction | 13,472 (85.5%) | 2,294 (14.5%) |
| Manufacturing | 16,075 (64.0%) | 9,040 (36.0%) |
| Wholesale Trade | 4,968 (60.8%) | 3,206 (39.2%) |
| Retail Trade | 21,036 (50.1%) | 20,979 (49.9%) |
| Transportation & Warehousing | 15,184 (73.0%) | 5,620 (27.0%) |
| Utilities | 1,559 (65.1%) | 837 (34.9%) |
| Information | 19,308 (62.1%) | 11,808 (38.0%) |
| Finance & Insurance | 17,878 (60.0%) | 11,913 (40.0%) |
| Real Estate, Rental & Leasing | 7,286 (60.2%) | 4,814 (39.8%) |
| Professional & Scientific | 66,474 (58.9%) | 46,351 (41.1%) |
| Enterprise Management | 564 (51.4%) | 534 (48.6%) |
| Administrative & Support | 9,614 (55.3%) | 7,784 (44.7%) |
| Educational Services | 14,531 (38.2%) | 23,549 (61.8%) |
| Health Care & Social Assistance | 18,225 (31.2%) | 40,220 (68.8%) |
| Arts, Entertainment & Recreation | 6,303 (53.3%) | 5,523 (46.7%) |
| Accommodation & Food Services | 18,767 (57.2%) | 14,047 (42.8%) |
| Public Administration | 8,437 (49.6%) | 8,562 (50.4%) |
| Total | 268,350 (53.9%) | 229,531 (46.1%) |
Education in San Francisco
School Enrollment in San Francisco
The most common levels of schooling among the 153,429 students in San Francisco are college / undergraduate (43,474 | 28.3%), high school (24,116 | 15.7%), and elementary school (23,993 | 15.6%).
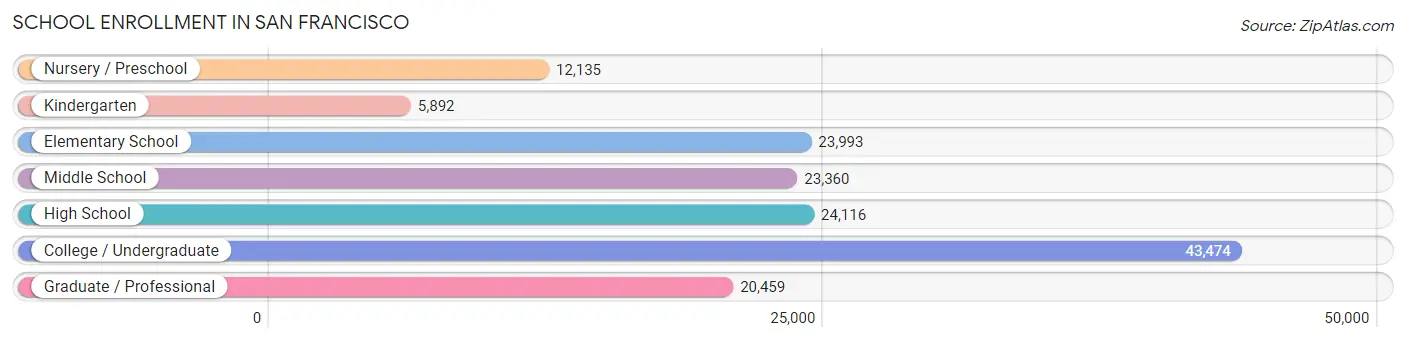
| School Level | # Students | % Students |
| Nursery / Preschool | 12,135 | 7.9% |
| Kindergarten | 5,892 | 3.8% |
| Elementary School | 23,993 | 15.6% |
| Middle School | 23,360 | 15.2% |
| High School | 24,116 | 15.7% |
| College / Undergraduate | 43,474 | 28.3% |
| Graduate / Professional | 20,459 | 13.3% |
| Total | 153,429 | 100.0% |
School Enrollment by Age by Funding Source in San Francisco
Out of a total of 153,429 students who are enrolled in schools in San Francisco, 50,785 (33.1%) attend a private institution, while the remaining 102,644 (66.9%) are enrolled in public schools. The age group of 3 to 4 year olds has the highest likelihood of being enrolled in private schools, with 6,966 (69.7% in the age bracket) enrolled. Conversely, the age group of 15 to 17 year olds has the lowest likelihood of being enrolled in a private school, with 12,685 (74.2% in the age bracket) attending a public institution.
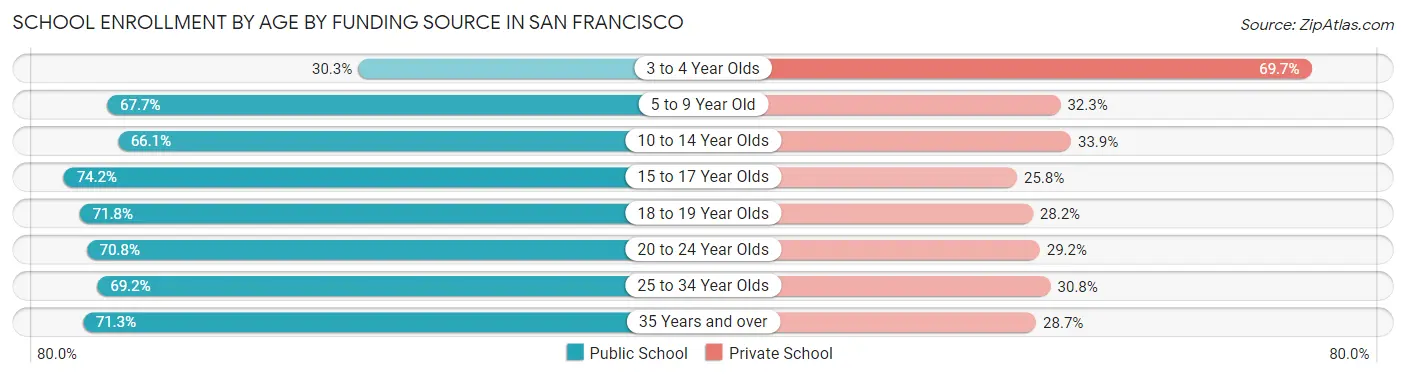
| Age Bracket | Public School | Private School |
| 3 to 4 Year Olds | 3,031 (30.3%) | 6,966 (69.7%) |
| 5 to 9 Year Old | 19,674 (67.7%) | 9,390 (32.3%) |
| 10 to 14 Year Olds | 20,096 (66.1%) | 10,298 (33.9%) |
| 15 to 17 Year Olds | 12,685 (74.2%) | 4,418 (25.8%) |
| 18 to 19 Year Olds | 8,263 (71.8%) | 3,246 (28.2%) |
| 20 to 24 Year Olds | 13,423 (70.8%) | 5,544 (29.2%) |
| 25 to 34 Year Olds | 14,649 (69.2%) | 6,531 (30.8%) |
| 35 Years and over | 10,851 (71.3%) | 4,364 (28.7%) |
| Total | 102,644 (66.9%) | 50,785 (33.1%) |
Educational Attainment by Field of Study in San Francisco
Business (72,860 | 16.2%), social sciences (60,458 | 13.4%), engineering (42,884 | 9.5%), computers & mathematics (37,133 | 8.2%), and bio, nature & agricultural (33,959 | 7.5%) are the most common fields of study among 451,107 individuals in San Francisco who have obtained a bachelor's degree or higher.
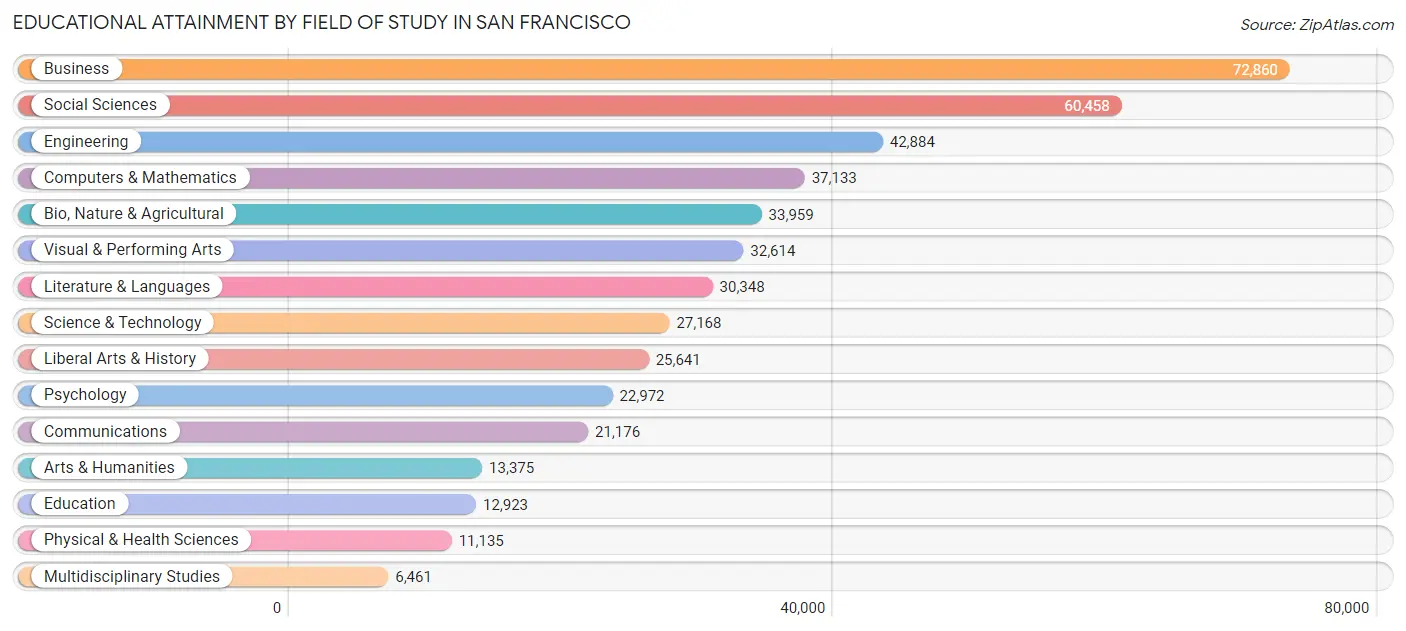
| Field of Study | # Graduates | % Graduates |
| Computers & Mathematics | 37,133 | 8.2% |
| Bio, Nature & Agricultural | 33,959 | 7.5% |
| Physical & Health Sciences | 11,135 | 2.5% |
| Psychology | 22,972 | 5.1% |
| Social Sciences | 60,458 | 13.4% |
| Engineering | 42,884 | 9.5% |
| Multidisciplinary Studies | 6,461 | 1.4% |
| Science & Technology | 27,168 | 6.0% |
| Business | 72,860 | 16.2% |
| Education | 12,923 | 2.9% |
| Literature & Languages | 30,348 | 6.7% |
| Liberal Arts & History | 25,641 | 5.7% |
| Visual & Performing Arts | 32,614 | 7.2% |
| Communications | 21,176 | 4.7% |
| Arts & Humanities | 13,375 | 3.0% |
| Total | 451,107 | 100.0% |
Transportation & Commute in San Francisco
Vehicle Availability by Sex in San Francisco
The most prevalent vehicle ownership categories in San Francisco are males with 1 vehicle (103,688, accounting for 39.7%) and females with 1 vehicle (92,443, making up 46.8%).
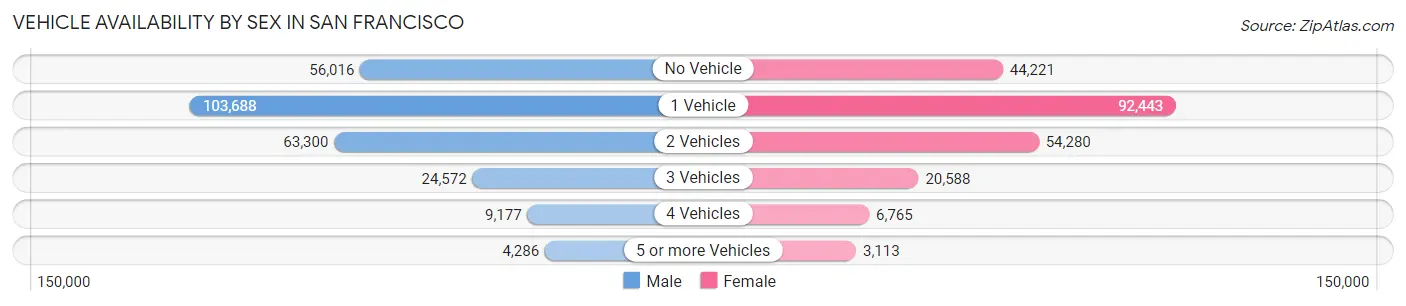
| Vehicles Available | Male | Female |
| No Vehicle | 56,016 (21.5%) | 44,221 (20.0%) |
| 1 Vehicle | 103,688 (39.7%) | 92,443 (41.7%) |
| 2 Vehicles | 63,300 (24.2%) | 54,280 (24.5%) |
| 3 Vehicles | 24,572 (9.4%) | 20,588 (9.3%) |
| 4 Vehicles | 9,177 (3.5%) | 6,765 (3.1%) |
| 5 or more Vehicles | 4,286 (1.6%) | 3,113 (1.4%) |
| Total | 261,039 (100.0%) | 221,410 (100.0%) |
Commute Time in San Francisco
The most frequently occuring commute durations in San Francisco are 30 to 34 minutes (73,901 commuters, 19.8%), 20 to 24 minutes (53,969 commuters, 14.4%), and 15 to 19 minutes (46,163 commuters, 12.4%).
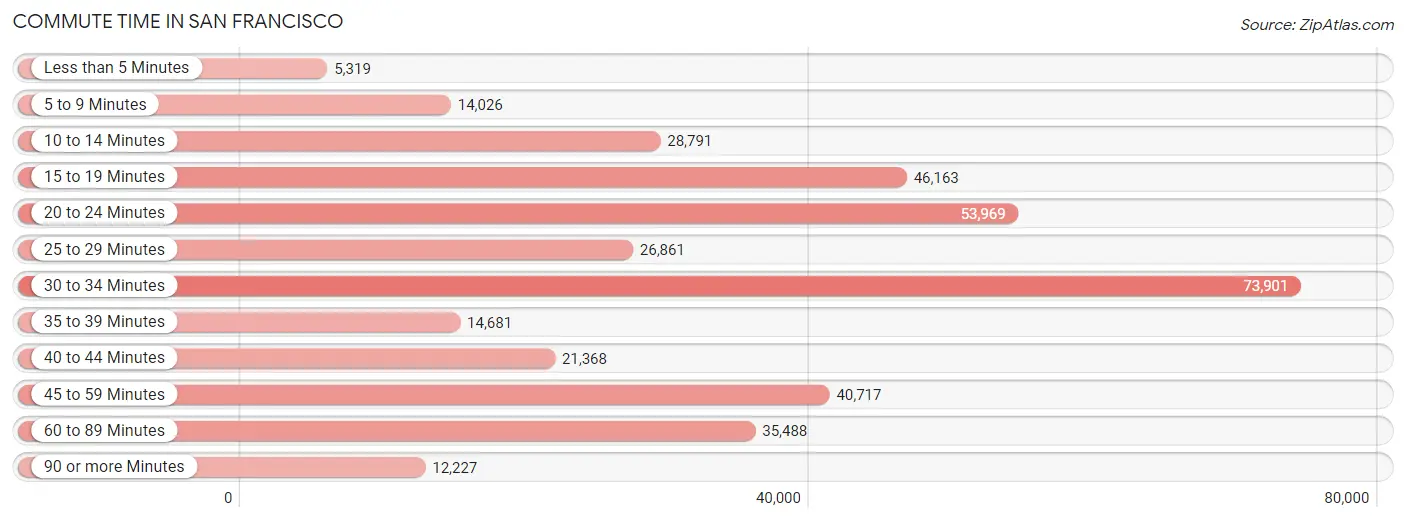
| Commute Time | # Commuters | % Commuters |
| Less than 5 Minutes | 5,319 | 1.4% |
| 5 to 9 Minutes | 14,026 | 3.8% |
| 10 to 14 Minutes | 28,791 | 7.7% |
| 15 to 19 Minutes | 46,163 | 12.4% |
| 20 to 24 Minutes | 53,969 | 14.4% |
| 25 to 29 Minutes | 26,861 | 7.2% |
| 30 to 34 Minutes | 73,901 | 19.8% |
| 35 to 39 Minutes | 14,681 | 3.9% |
| 40 to 44 Minutes | 21,368 | 5.7% |
| 45 to 59 Minutes | 40,717 | 10.9% |
| 60 to 89 Minutes | 35,488 | 9.5% |
| 90 or more Minutes | 12,227 | 3.3% |
Commute Time by Sex in San Francisco
The most common commute times in San Francisco are 30 to 34 minutes (38,467 commuters, 19.1%) for males and 30 to 34 minutes (35,434 commuters, 20.6%) for females.
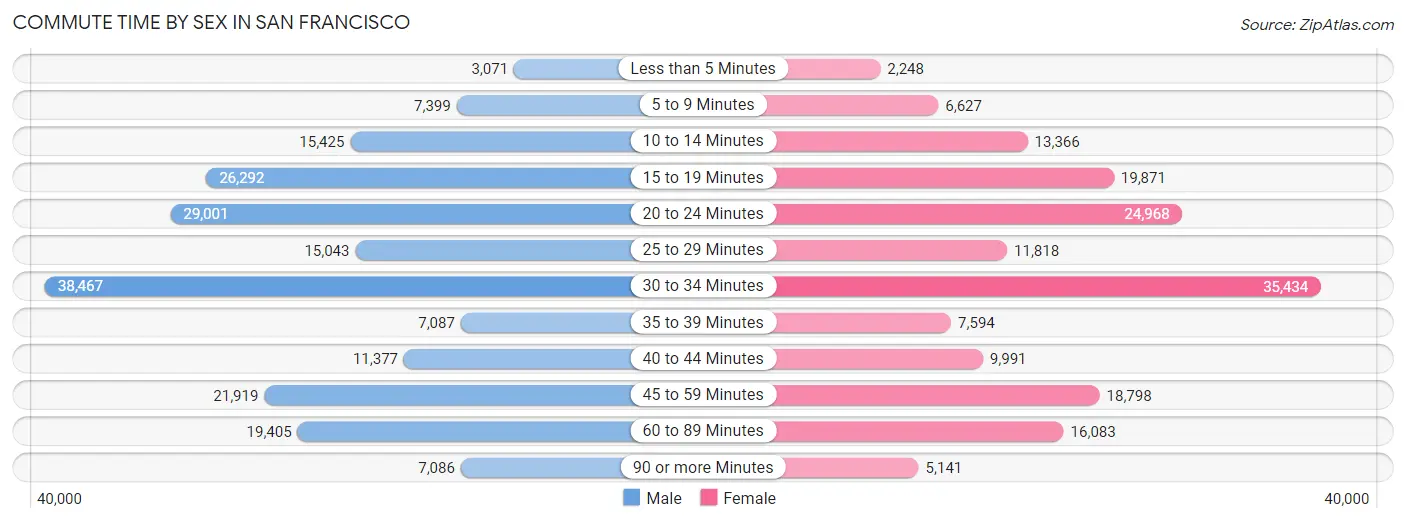
| Commute Time | Male | Female |
| Less than 5 Minutes | 3,071 (1.5%) | 2,248 (1.3%) |
| 5 to 9 Minutes | 7,399 (3.7%) | 6,627 (3.8%) |
| 10 to 14 Minutes | 15,425 (7.6%) | 13,366 (7.8%) |
| 15 to 19 Minutes | 26,292 (13.0%) | 19,871 (11.6%) |
| 20 to 24 Minutes | 29,001 (14.4%) | 24,968 (14.5%) |
| 25 to 29 Minutes | 15,043 (7.5%) | 11,818 (6.9%) |
| 30 to 34 Minutes | 38,467 (19.1%) | 35,434 (20.6%) |
| 35 to 39 Minutes | 7,087 (3.5%) | 7,594 (4.4%) |
| 40 to 44 Minutes | 11,377 (5.6%) | 9,991 (5.8%) |
| 45 to 59 Minutes | 21,919 (10.9%) | 18,798 (10.9%) |
| 60 to 89 Minutes | 19,405 (9.6%) | 16,083 (9.3%) |
| 90 or more Minutes | 7,086 (3.5%) | 5,141 (3.0%) |
Time of Departure to Work by Sex in San Francisco
The most frequent times of departure to work in San Francisco are 8:00 AM to 8:29 AM (33,170, 16.5%) for males and 8:00 AM to 8:29 AM (32,914, 19.1%) for females.
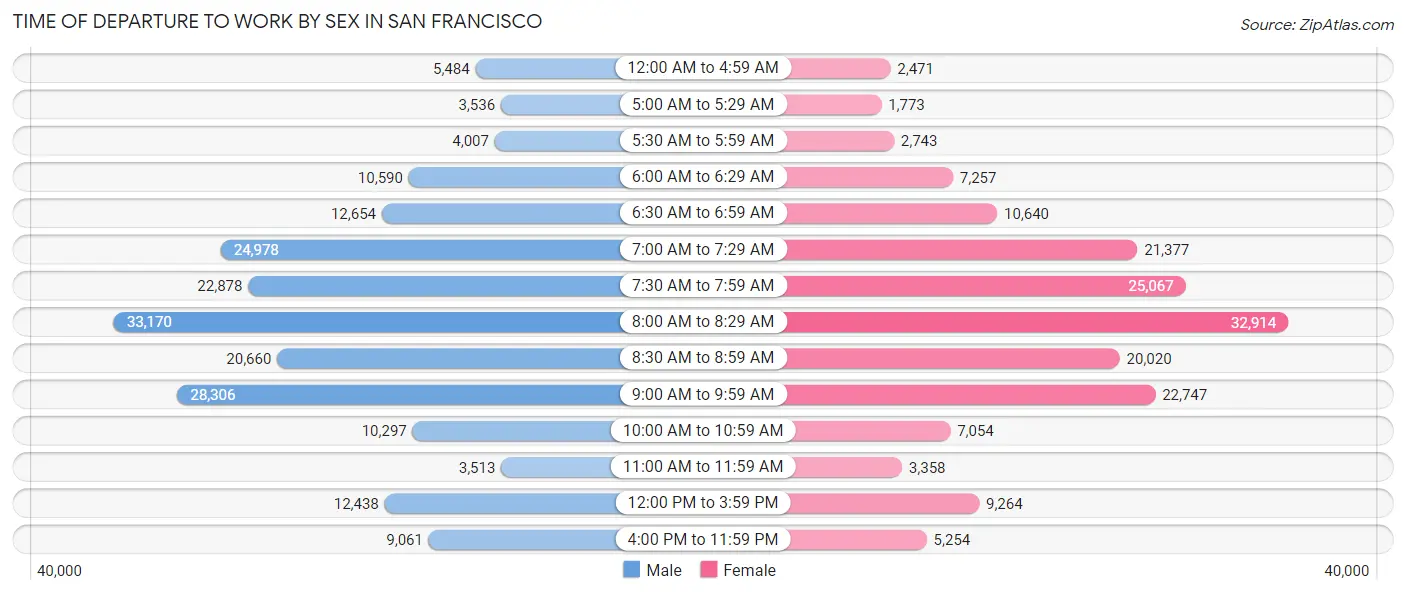
| Time of Departure | Male | Female |
| 12:00 AM to 4:59 AM | 5,484 (2.7%) | 2,471 (1.4%) |
| 5:00 AM to 5:29 AM | 3,536 (1.8%) | 1,773 (1.0%) |
| 5:30 AM to 5:59 AM | 4,007 (2.0%) | 2,743 (1.6%) |
| 6:00 AM to 6:29 AM | 10,590 (5.2%) | 7,257 (4.2%) |
| 6:30 AM to 6:59 AM | 12,654 (6.3%) | 10,640 (6.2%) |
| 7:00 AM to 7:29 AM | 24,978 (12.4%) | 21,377 (12.4%) |
| 7:30 AM to 7:59 AM | 22,878 (11.4%) | 25,067 (14.6%) |
| 8:00 AM to 8:29 AM | 33,170 (16.5%) | 32,914 (19.1%) |
| 8:30 AM to 8:59 AM | 20,660 (10.2%) | 20,020 (11.6%) |
| 9:00 AM to 9:59 AM | 28,306 (14.0%) | 22,747 (13.2%) |
| 10:00 AM to 10:59 AM | 10,297 (5.1%) | 7,054 (4.1%) |
| 11:00 AM to 11:59 AM | 3,513 (1.7%) | 3,358 (1.9%) |
| 12:00 PM to 3:59 PM | 12,438 (6.2%) | 9,264 (5.4%) |
| 4:00 PM to 11:59 PM | 9,061 (4.5%) | 5,254 (3.1%) |
| Total | 201,572 (100.0%) | 171,939 (100.0%) |
Housing Occupancy in San Francisco
Occupancy by Ownership in San Francisco
Of the total 360,842 dwellings in San Francisco, owner-occupied units account for 139,117 (38.6%), while renter-occupied units make up 221,725 (61.5%).
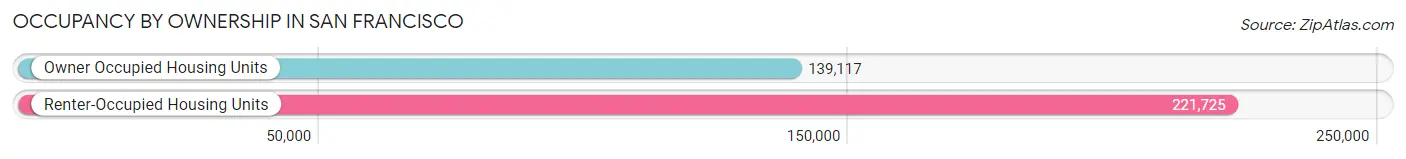
| Occupancy | # Housing Units | % Housing Units |
| Owner Occupied Housing Units | 139,117 | 38.6% |
| Renter-Occupied Housing Units | 221,725 | 61.5% |
| Total Occupied Housing Units | 360,842 | 100.0% |
Occupancy by Household Size in San Francisco
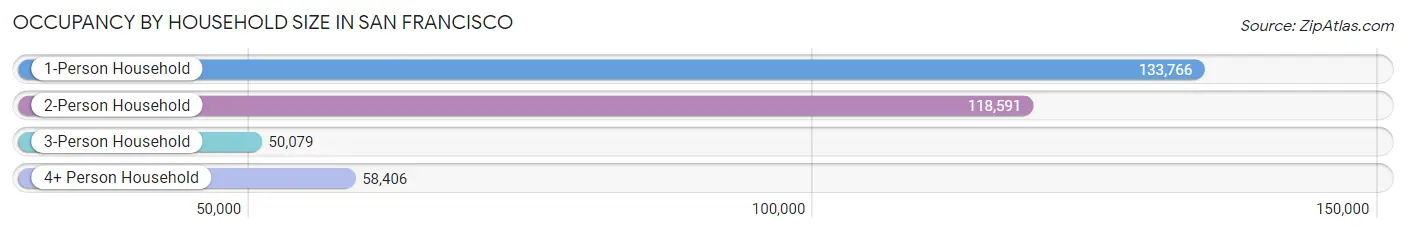
| Household Size | # Housing Units | % Housing Units |
| 1-Person Household | 133,766 | 37.1% |
| 2-Person Household | 118,591 | 32.9% |
| 3-Person Household | 50,079 | 13.9% |
| 4+ Person Household | 58,406 | 16.2% |
| Total Housing Units | 360,842 | 100.0% |
Occupancy by Ownership by Household Size in San Francisco
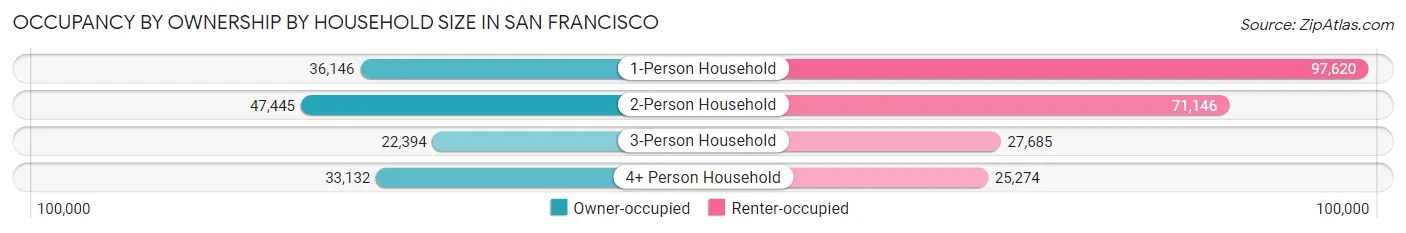
| Household Size | Owner-occupied | Renter-occupied |
| 1-Person Household | 36,146 (27.0%) | 97,620 (73.0%) |
| 2-Person Household | 47,445 (40.0%) | 71,146 (60.0%) |
| 3-Person Household | 22,394 (44.7%) | 27,685 (55.3%) |
| 4+ Person Household | 33,132 (56.7%) | 25,274 (43.3%) |
| Total Housing Units | 139,117 (38.6%) | 221,725 (61.5%) |
Occupancy by Educational Attainment in San Francisco
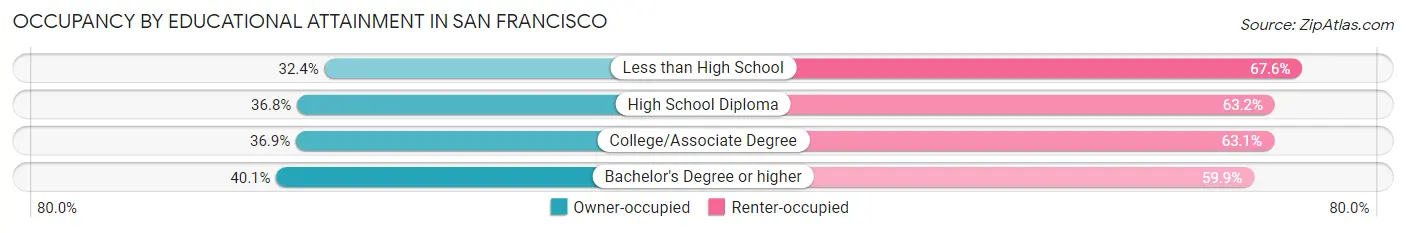
| Household Size | Owner-occupied | Renter-occupied |
| Less than High School | 10,225 (32.4%) | 21,311 (67.6%) |
| High School Diploma | 12,200 (36.8%) | 20,980 (63.2%) |
| College/Associate Degree | 23,249 (36.9%) | 39,683 (63.1%) |
| Bachelor's Degree or higher | 93,443 (40.1%) | 139,751 (59.9%) |
Occupancy by Age of Householder in San Francisco
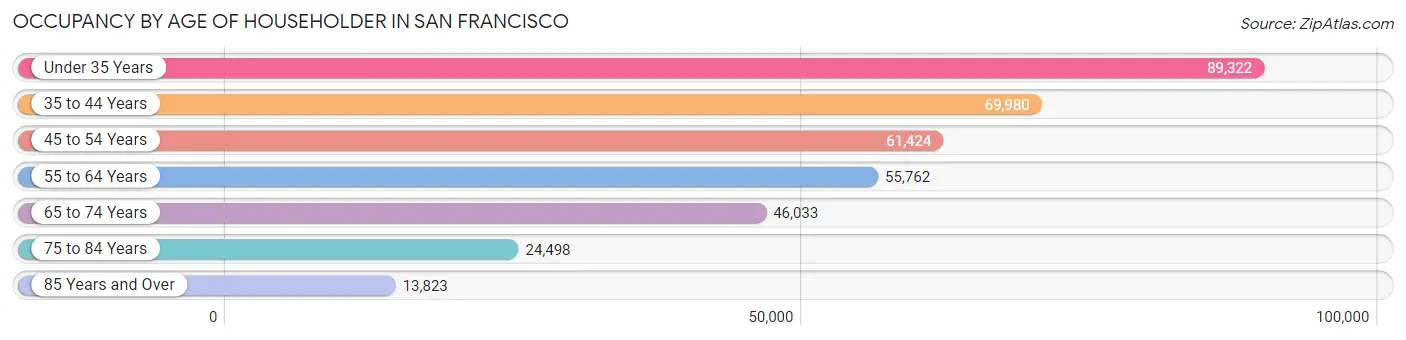
| Age Bracket | # Households | % Households |
| Under 35 Years | 89,322 | 24.7% |
| 35 to 44 Years | 69,980 | 19.4% |
| 45 to 54 Years | 61,424 | 17.0% |
| 55 to 64 Years | 55,762 | 15.4% |
| 65 to 74 Years | 46,033 | 12.8% |
| 75 to 84 Years | 24,498 | 6.8% |
| 85 Years and Over | 13,823 | 3.8% |
| Total | 360,842 | 100.0% |
Housing Finances in San Francisco
Median Income by Occupancy in San Francisco
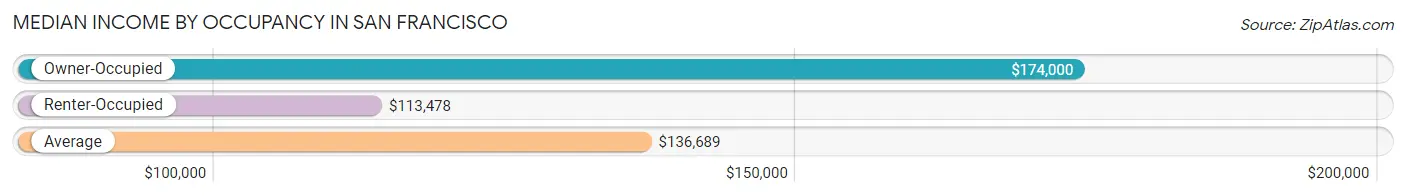
| Occupancy Type | # Households | Median Income |
| Owner-Occupied | 139,117 (38.6%) | $174,000 |
| Renter-Occupied | 221,725 (61.5%) | $113,478 |
| Average | 360,842 (100.0%) | $136,689 |
Occupancy by Householder Income Bracket in San Francisco
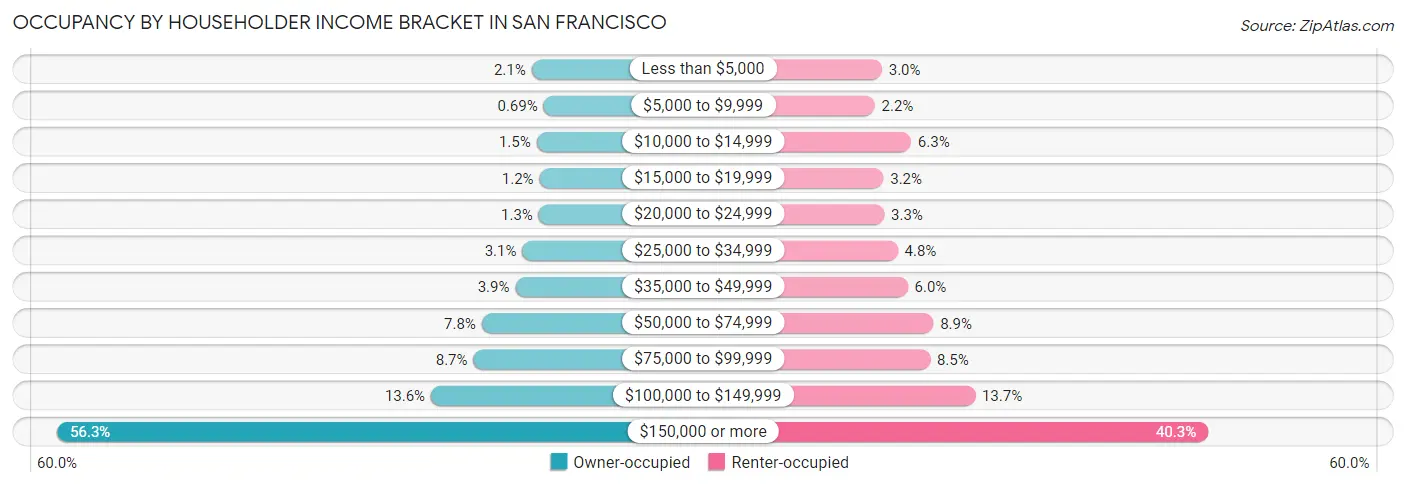
| Income Bracket | Owner-occupied | Renter-occupied |
| Less than $5,000 | 2,866 (2.1%) | 6,644 (3.0%) |
| $5,000 to $9,999 | 953 (0.7%) | 4,826 (2.2%) |
| $10,000 to $14,999 | 2,068 (1.5%) | 14,039 (6.3%) |
| $15,000 to $19,999 | 1,607 (1.2%) | 7,034 (3.2%) |
| $20,000 to $24,999 | 1,742 (1.3%) | 7,220 (3.3%) |
| $25,000 to $34,999 | 4,340 (3.1%) | 10,662 (4.8%) |
| $35,000 to $49,999 | 5,455 (3.9%) | 13,198 (5.9%) |
| $50,000 to $74,999 | 10,790 (7.8%) | 19,685 (8.9%) |
| $75,000 to $99,999 | 12,116 (8.7%) | 18,842 (8.5%) |
| $100,000 to $149,999 | 18,858 (13.6%) | 30,259 (13.7%) |
| $150,000 or more | 78,322 (56.3%) | 89,316 (40.3%) |
| Total | 139,117 (100.0%) | 221,725 (100.0%) |
Monthly Housing Cost Tiers in San Francisco
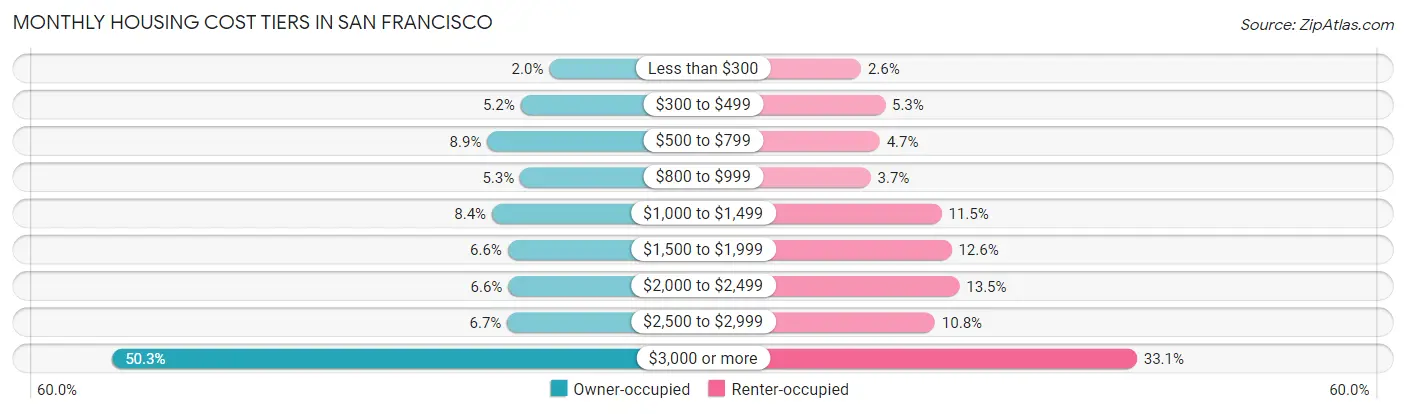
| Monthly Cost | Owner-occupied | Renter-occupied |
| Less than $300 | 2,837 (2.0%) | 5,755 (2.6%) |
| $300 to $499 | 7,254 (5.2%) | 11,656 (5.3%) |
| $500 to $799 | 12,362 (8.9%) | 10,344 (4.7%) |
| $800 to $999 | 7,338 (5.3%) | 8,147 (3.7%) |
| $1,000 to $1,499 | 11,642 (8.4%) | 25,506 (11.5%) |
| $1,500 to $1,999 | 9,226 (6.6%) | 27,931 (12.6%) |
| $2,000 to $2,499 | 9,156 (6.6%) | 29,867 (13.5%) |
| $2,500 to $2,999 | 9,301 (6.7%) | 23,880 (10.8%) |
| $3,000 or more | 70,001 (50.3%) | 73,329 (33.1%) |
| Total | 139,117 (100.0%) | 221,725 (100.0%) |
Physical Housing Characteristics in San Francisco
Housing Structures in San Francisco
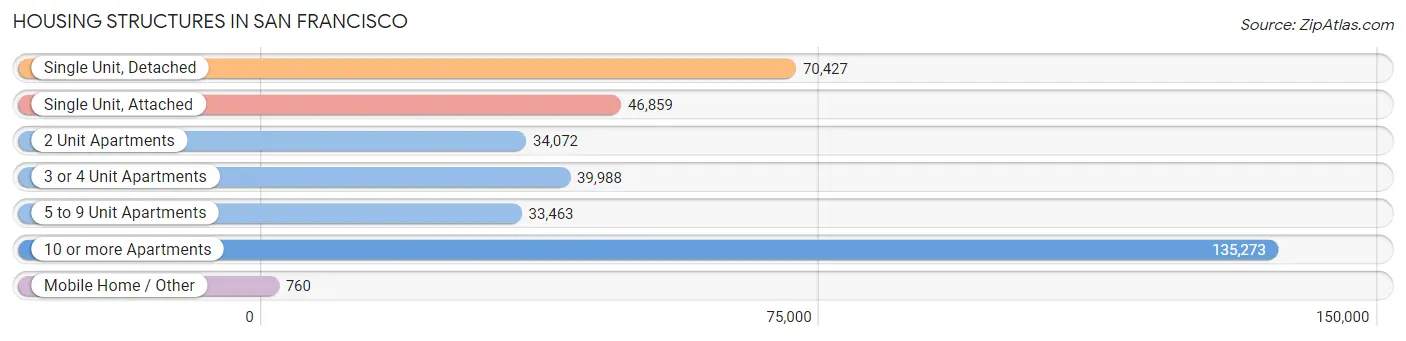
| Structure Type | # Housing Units | % Housing Units |
| Single Unit, Detached | 70,427 | 19.5% |
| Single Unit, Attached | 46,859 | 13.0% |
| 2 Unit Apartments | 34,072 | 9.4% |
| 3 or 4 Unit Apartments | 39,988 | 11.1% |
| 5 to 9 Unit Apartments | 33,463 | 9.3% |
| 10 or more Apartments | 135,273 | 37.5% |
| Mobile Home / Other | 760 | 0.2% |
| Total | 360,842 | 100.0% |
Housing Structures by Occupancy in San Francisco
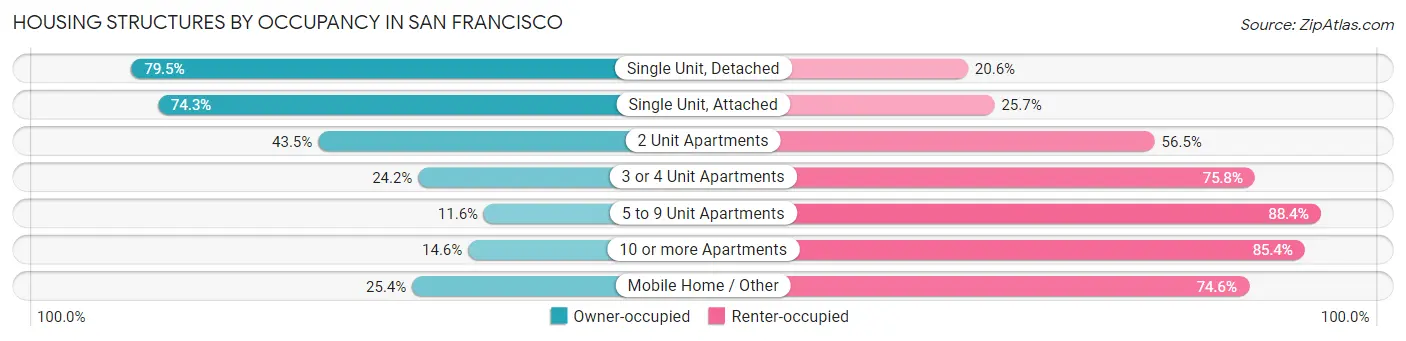
| Structure Type | Owner-occupied | Renter-occupied |
| Single Unit, Detached | 55,951 (79.4%) | 14,476 (20.5%) |
| Single Unit, Attached | 34,830 (74.3%) | 12,029 (25.7%) |
| 2 Unit Apartments | 14,818 (43.5%) | 19,254 (56.5%) |
| 3 or 4 Unit Apartments | 9,687 (24.2%) | 30,301 (75.8%) |
| 5 to 9 Unit Apartments | 3,869 (11.6%) | 29,594 (88.4%) |
| 10 or more Apartments | 19,769 (14.6%) | 115,504 (85.4%) |
| Mobile Home / Other | 193 (25.4%) | 567 (74.6%) |
| Total | 139,117 (38.6%) | 221,725 (61.5%) |
Housing Structures by Number of Rooms in San Francisco
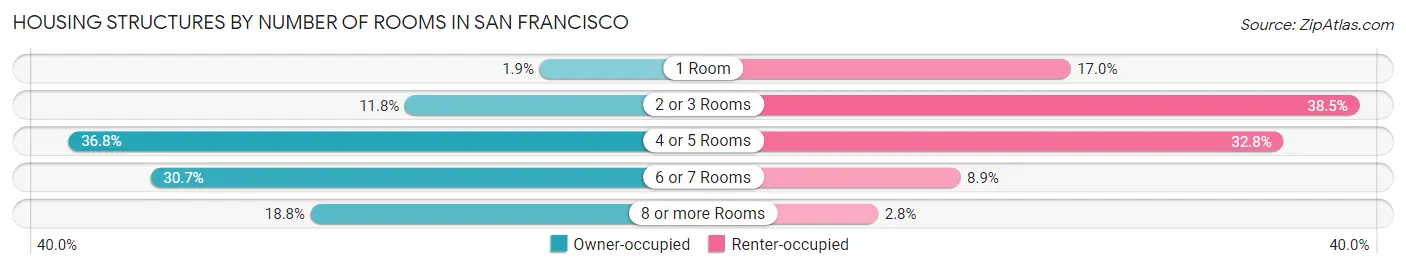
| Number of Rooms | Owner-occupied | Renter-occupied |
| 1 Room | 2,615 (1.9%) | 37,772 (17.0%) |
| 2 or 3 Rooms | 16,467 (11.8%) | 85,263 (38.5%) |
| 4 or 5 Rooms | 51,160 (36.8%) | 72,770 (32.8%) |
| 6 or 7 Rooms | 42,692 (30.7%) | 19,717 (8.9%) |
| 8 or more Rooms | 26,183 (18.8%) | 6,203 (2.8%) |
| Total | 139,117 (100.0%) | 221,725 (100.0%) |
Housing Structure by Heating Type in San Francisco
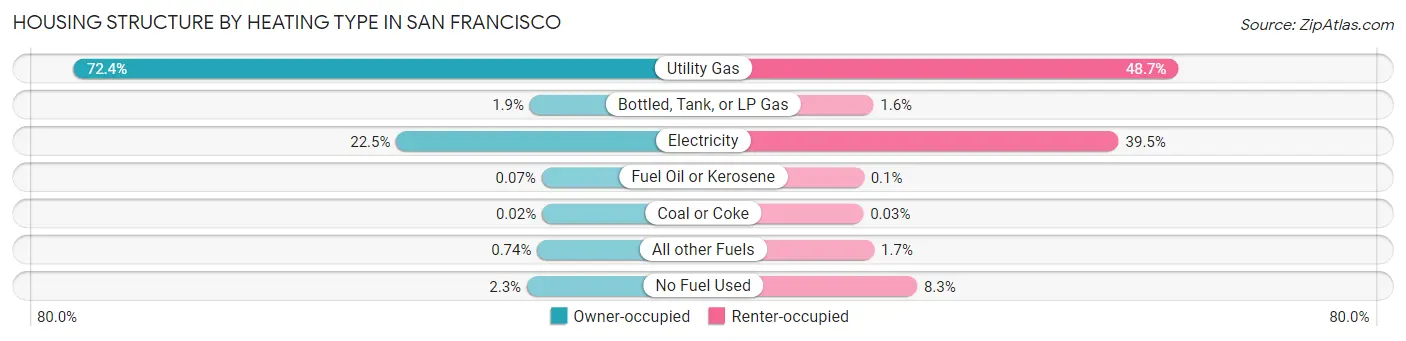
| Heating Type | Owner-occupied | Renter-occupied |
| Utility Gas | 100,703 (72.4%) | 108,013 (48.7%) |
| Bottled, Tank, or LP Gas | 2,637 (1.9%) | 3,516 (1.6%) |
| Electricity | 31,360 (22.5%) | 87,602 (39.5%) |
| Fuel Oil or Kerosene | 97 (0.1%) | 219 (0.1%) |
| Coal or Coke | 29 (0.0%) | 63 (0.0%) |
| All other Fuels | 1,031 (0.7%) | 3,823 (1.7%) |
| No Fuel Used | 3,260 (2.3%) | 18,489 (8.3%) |
| Total | 139,117 (100.0%) | 221,725 (100.0%) |
Household Vehicle Usage in San Francisco
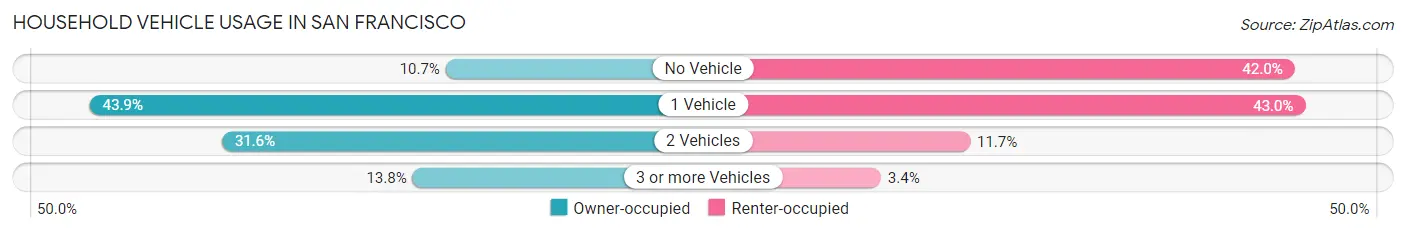
| Vehicles per Household | Owner-occupied | Renter-occupied |
| No Vehicle | 14,878 (10.7%) | 93,076 (42.0%) |
| 1 Vehicle | 61,114 (43.9%) | 95,285 (43.0%) |
| 2 Vehicles | 43,942 (31.6%) | 25,907 (11.7%) |
| 3 or more Vehicles | 19,183 (13.8%) | 7,457 (3.4%) |
| Total | 139,117 (100.0%) | 221,725 (100.0%) |
Real Estate & Mortgages in San Francisco
Real Estate and Mortgage Overview in San Francisco
| Characteristic | Without Mortgage | With Mortgage |
| Housing Units | 50,124 | 88,993 |
| Median Property Value | $1,236,200 | $1,409,500 |
| Median Household Income | $109,127 | $59,659 |
| Monthly Housing Costs | $887 | $67,356 |
| Real Estate Taxes | $5,282 | $1,473 |
Property Value by Mortgage Status in San Francisco
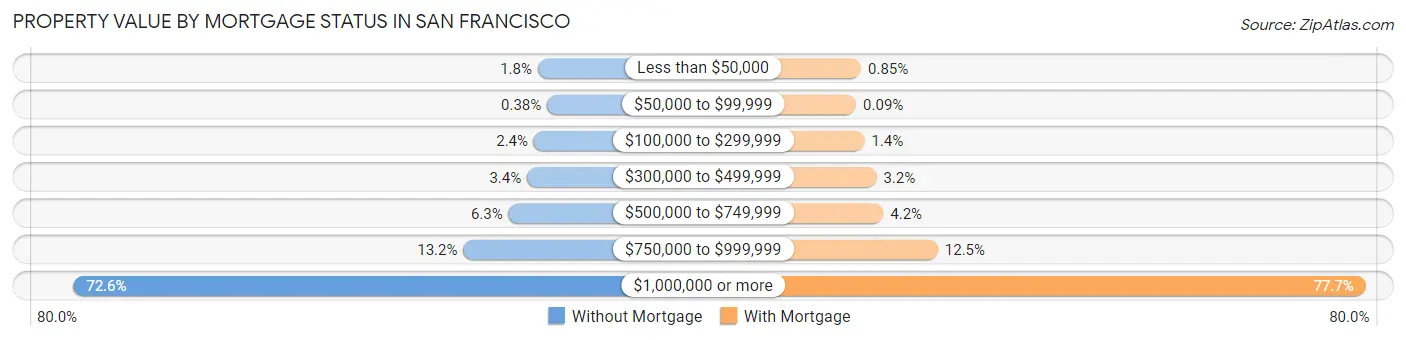
| Property Value | Without Mortgage | With Mortgage |
| Less than $50,000 | 901 (1.8%) | 756 (0.9%) |
| $50,000 to $99,999 | 190 (0.4%) | 84 (0.1%) |
| $100,000 to $299,999 | 1,202 (2.4%) | 1,214 (1.4%) |
| $300,000 to $499,999 | 1,725 (3.4%) | 2,837 (3.2%) |
| $500,000 to $749,999 | 3,135 (6.2%) | 3,771 (4.2%) |
| $750,000 to $999,999 | 6,592 (13.2%) | 11,161 (12.5%) |
| $1,000,000 or more | 36,379 (72.6%) | 69,170 (77.7%) |
| Total | 50,124 (100.0%) | 88,993 (100.0%) |
Household Income by Mortgage Status in San Francisco
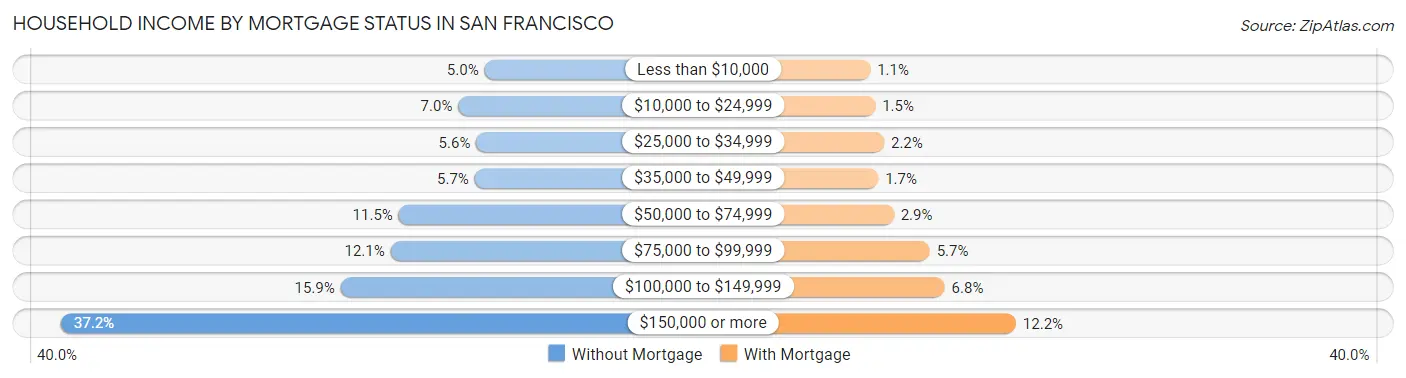
| Household Income | Without Mortgage | With Mortgage |
| Less than $10,000 | 2,485 (5.0%) | 995 (1.1%) |
| $10,000 to $24,999 | 3,487 (7.0%) | 1,334 (1.5%) |
| $25,000 to $34,999 | 2,801 (5.6%) | 1,930 (2.2%) |
| $35,000 to $49,999 | 2,862 (5.7%) | 1,539 (1.7%) |
| $50,000 to $74,999 | 5,765 (11.5%) | 2,593 (2.9%) |
| $75,000 to $99,999 | 6,074 (12.1%) | 5,025 (5.7%) |
| $100,000 to $149,999 | 7,987 (15.9%) | 6,042 (6.8%) |
| $150,000 or more | 18,663 (37.2%) | 10,871 (12.2%) |
| Total | 50,124 (100.0%) | 88,993 (100.0%) |
Property Value to Household Income Ratio in San Francisco
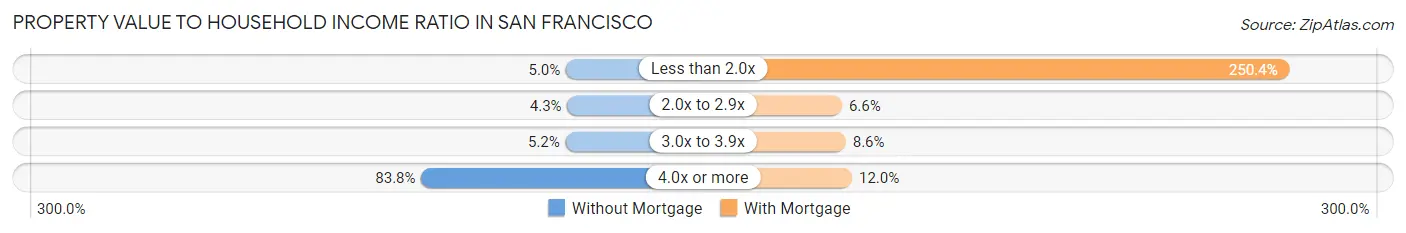
| Value-to-Income Ratio | Without Mortgage | With Mortgage |
| Less than 2.0x | 2,495 (5.0%) | 222,823 (250.4%) |
| 2.0x to 2.9x | 2,129 (4.3%) | 5,855 (6.6%) |
| 3.0x to 3.9x | 2,626 (5.2%) | 7,690 (8.6%) |
| 4.0x or more | 42,017 (83.8%) | 10,719 (12.0%) |
| Total | 50,124 (100.0%) | 88,993 (100.0%) |
Real Estate Taxes by Mortgage Status in San Francisco
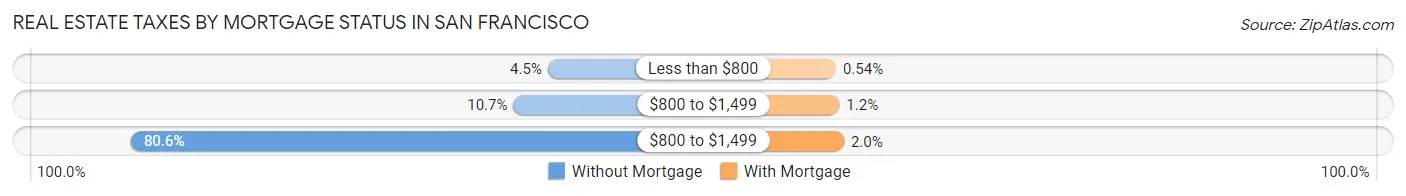
| Property Taxes | Without Mortgage | With Mortgage |
| Less than $800 | 2,230 (4.4%) | 484 (0.5%) |
| $800 to $1,499 | 5,384 (10.7%) | 1,035 (1.2%) |
| $800 to $1,499 | 40,382 (80.6%) | 1,771 (2.0%) |
| Total | 50,124 (100.0%) | 88,993 (100.0%) |
Health & Disability in San Francisco
Health Insurance Coverage by Age in San Francisco
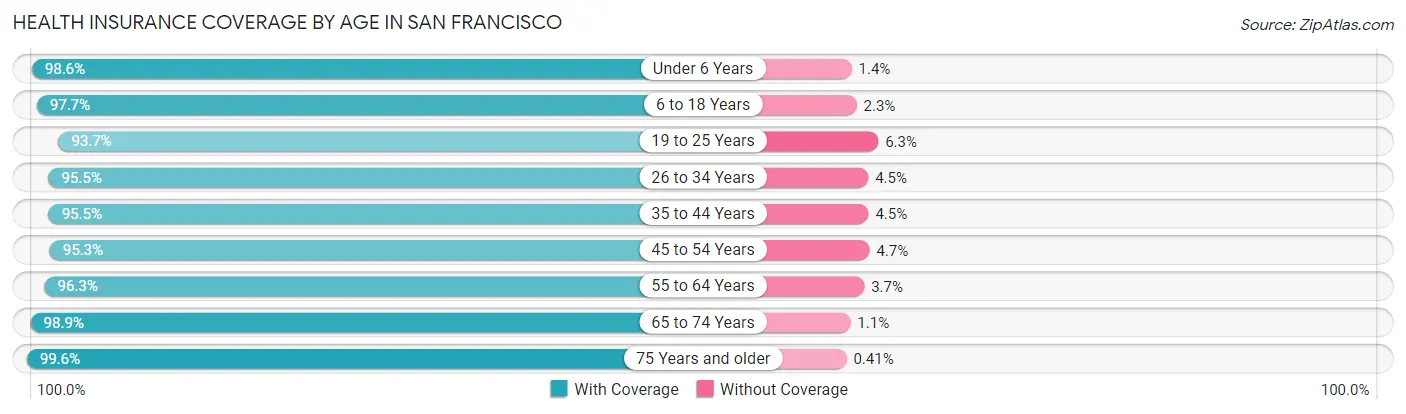
| Age Bracket | With Coverage | Without Coverage |
| Under 6 Years | 41,940 (98.6%) | 578 (1.4%) |
| 6 to 18 Years | 78,475 (97.7%) | 1,838 (2.3%) |
| 19 to 25 Years | 59,578 (93.7%) | 4,022 (6.3%) |
| 26 to 34 Years | 162,521 (95.5%) | 7,590 (4.5%) |
| 35 to 44 Years | 131,486 (95.5%) | 6,208 (4.5%) |
| 45 to 54 Years | 107,111 (95.3%) | 5,286 (4.7%) |
| 55 to 64 Years | 96,740 (96.3%) | 3,739 (3.7%) |
| 65 to 74 Years | 78,219 (98.9%) | 899 (1.1%) |
| 75 Years and older | 60,369 (99.6%) | 246 (0.4%) |
| Total | 816,439 (96.4%) | 30,406 (3.6%) |
Health Insurance Coverage by Citizenship Status in San Francisco
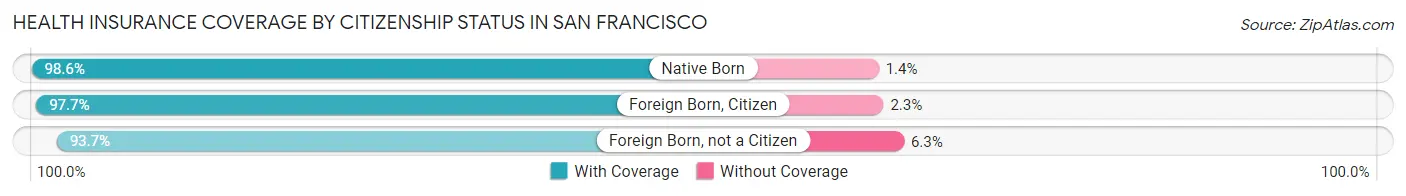
| Citizenship Status | With Coverage | Without Coverage |
| Native Born | 41,940 (98.6%) | 578 (1.4%) |
| Foreign Born, Citizen | 78,475 (97.7%) | 1,838 (2.3%) |
| Foreign Born, not a Citizen | 59,578 (93.7%) | 4,022 (6.3%) |
Health Insurance Coverage by Household Income in San Francisco
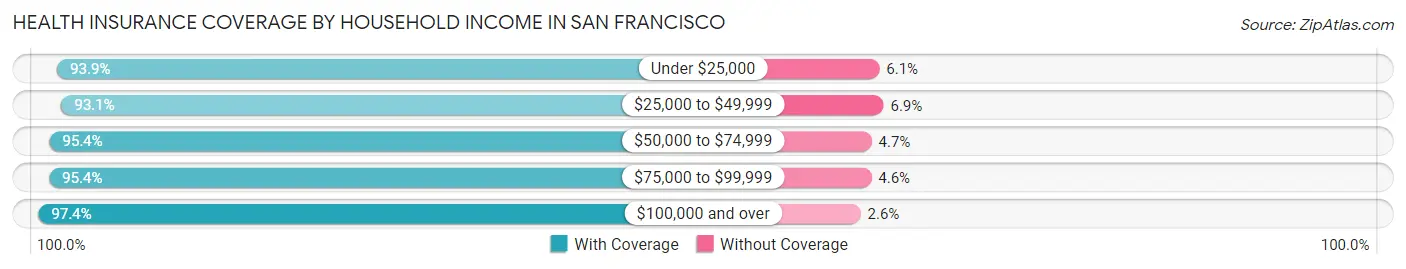
| Household Income | With Coverage | Without Coverage |
| Under $25,000 | 67,928 (93.9%) | 4,414 (6.1%) |
| $25,000 to $49,999 | 60,093 (93.1%) | 4,442 (6.9%) |
| $50,000 to $74,999 | 61,019 (95.4%) | 2,978 (4.6%) |
| $75,000 to $99,999 | 64,890 (95.4%) | 3,126 (4.6%) |
| $100,000 and over | 543,997 (97.4%) | 14,400 (2.6%) |
Public vs Private Health Insurance Coverage by Age in San Francisco
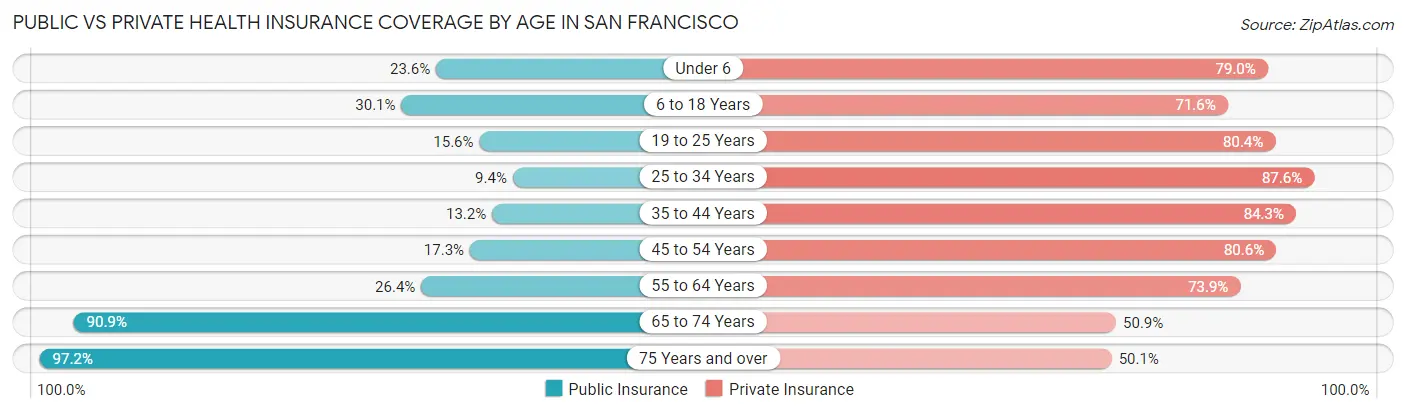
| Age Bracket | Public Insurance | Private Insurance |
| Under 6 | 10,048 (23.6%) | 33,602 (79.0%) |
| 6 to 18 Years | 24,148 (30.1%) | 57,507 (71.6%) |
| 19 to 25 Years | 9,916 (15.6%) | 51,146 (80.4%) |
| 25 to 34 Years | 15,972 (9.4%) | 149,088 (87.6%) |
| 35 to 44 Years | 18,219 (13.2%) | 116,016 (84.3%) |
| 45 to 54 Years | 19,488 (17.3%) | 90,580 (80.6%) |
| 55 to 64 Years | 26,512 (26.4%) | 74,292 (73.9%) |
| 65 to 74 Years | 71,916 (90.9%) | 40,287 (50.9%) |
| 75 Years and over | 58,926 (97.2%) | 30,371 (50.1%) |
| Total | 255,145 (30.1%) | 642,889 (75.9%) |
Disability Status by Sex by Age in San Francisco
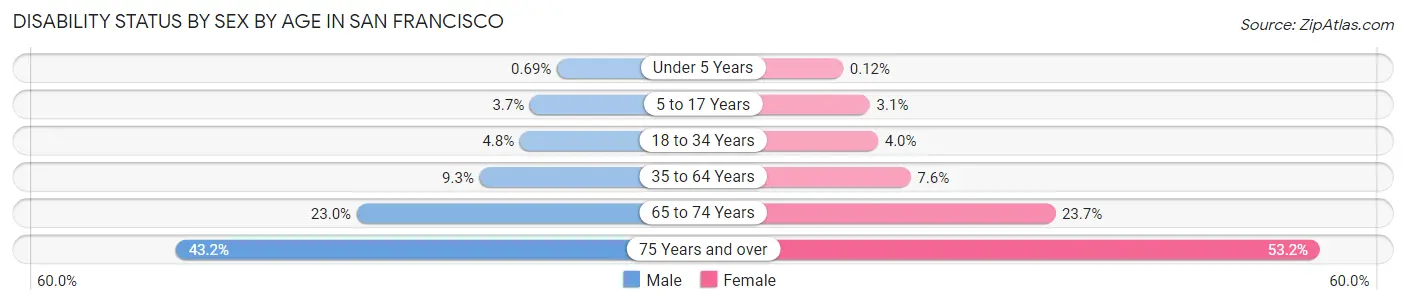
| Age Bracket | Male | Female |
| Under 5 Years | 128 (0.7%) | 22 (0.1%) |
| 5 to 17 Years | 1,489 (3.7%) | 1,197 (3.1%) |
| 18 to 34 Years | 6,006 (4.8%) | 4,677 (4.0%) |
| 35 to 64 Years | 17,577 (9.3%) | 12,370 (7.6%) |
| 65 to 74 Years | 8,845 (23.0%) | 9,650 (23.7%) |
| 75 Years and over | 10,873 (43.2%) | 18,863 (53.2%) |
Disability Class by Sex by Age in San Francisco
Disability Class: Hearing Difficulty
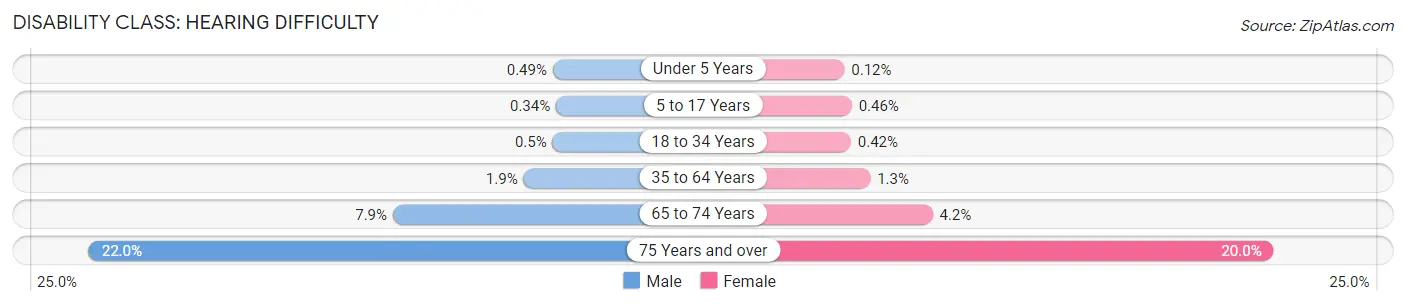
| Age Bracket | Male | Female |
| Under 5 Years | 91 (0.5%) | 22 (0.1%) |
| 5 to 17 Years | 137 (0.3%) | 178 (0.5%) |
| 18 to 34 Years | 629 (0.5%) | 488 (0.4%) |
| 35 to 64 Years | 3,493 (1.8%) | 2,142 (1.3%) |
| 65 to 74 Years | 3,041 (7.9%) | 1,710 (4.2%) |
| 75 Years and over | 5,547 (22.0%) | 7,095 (20.0%) |
Disability Class: Vision Difficulty
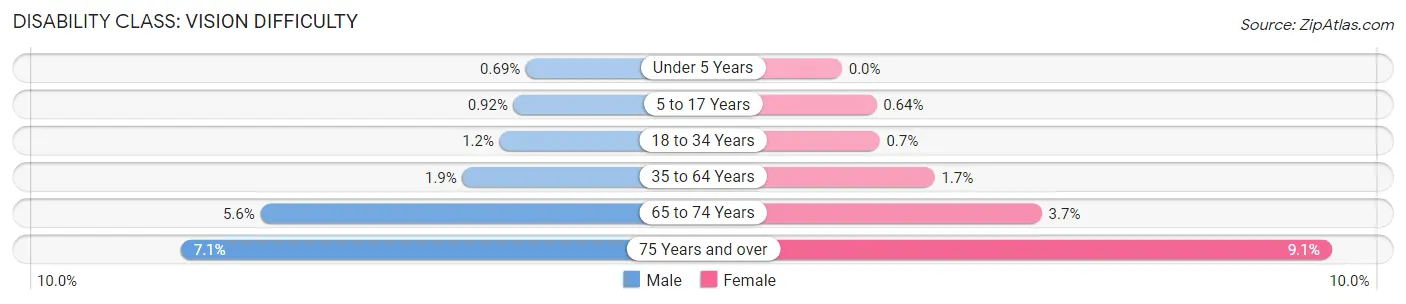
| Age Bracket | Male | Female |
| Under 5 Years | 128 (0.7%) | 0 (0.0%) |
| 5 to 17 Years | 371 (0.9%) | 246 (0.6%) |
| 18 to 34 Years | 1,471 (1.2%) | 819 (0.7%) |
| 35 to 64 Years | 3,535 (1.9%) | 2,787 (1.7%) |
| 65 to 74 Years | 2,162 (5.6%) | 1,508 (3.7%) |
| 75 Years and over | 1,789 (7.1%) | 3,221 (9.1%) |
Disability Class: Cognitive Difficulty
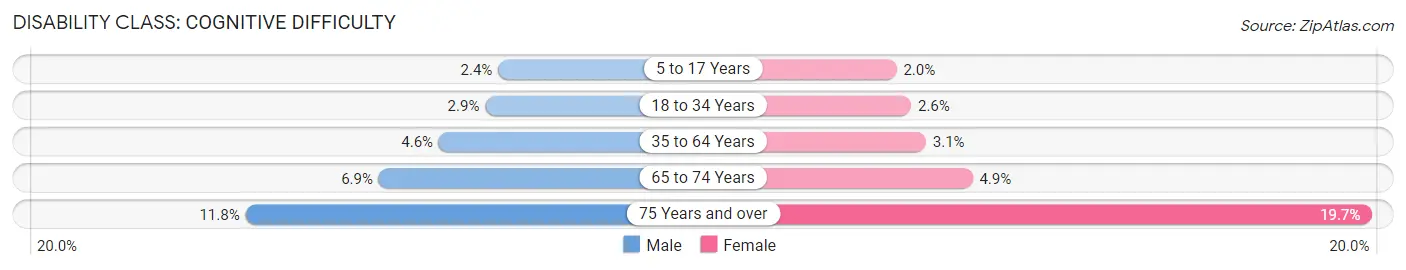
| Age Bracket | Male | Female |
| 5 to 17 Years | 973 (2.4%) | 785 (2.0%) |
| 18 to 34 Years | 3,610 (2.9%) | 2,997 (2.6%) |
| 35 to 64 Years | 8,720 (4.6%) | 5,048 (3.1%) |
| 65 to 74 Years | 2,636 (6.9%) | 1,970 (4.9%) |
| 75 Years and over | 2,973 (11.8%) | 6,975 (19.7%) |
Disability Class: Ambulatory Difficulty
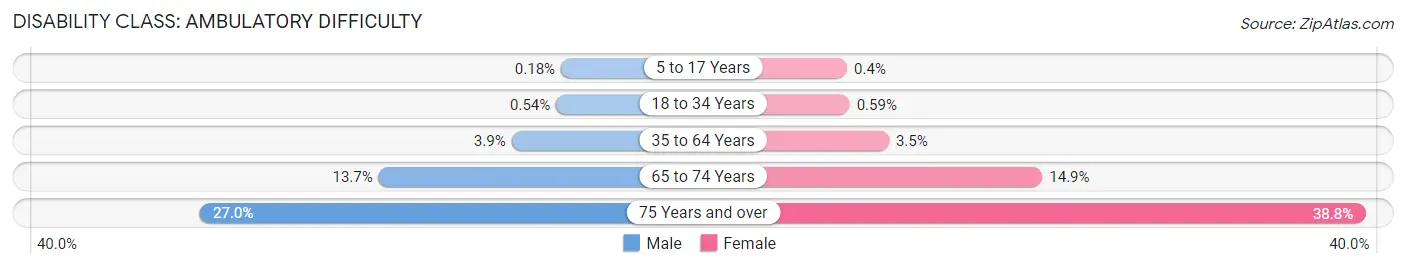
| Age Bracket | Male | Female |
| 5 to 17 Years | 72 (0.2%) | 155 (0.4%) |
| 18 to 34 Years | 669 (0.5%) | 692 (0.6%) |
| 35 to 64 Years | 7,270 (3.8%) | 5,668 (3.5%) |
| 65 to 74 Years | 5,276 (13.7%) | 6,052 (14.9%) |
| 75 Years and over | 6,793 (27.0%) | 13,761 (38.8%) |
Disability Class: Self-Care Difficulty
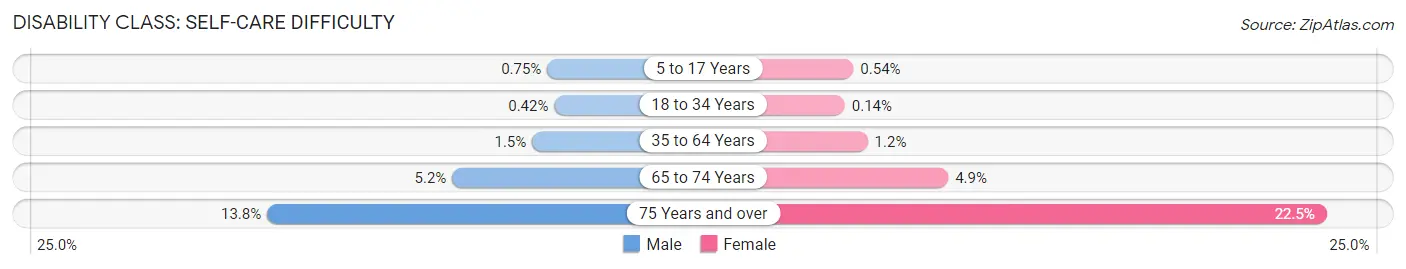
| Age Bracket | Male | Female |
| 5 to 17 Years | 300 (0.7%) | 210 (0.5%) |
| 18 to 34 Years | 527 (0.4%) | 159 (0.1%) |
| 35 to 64 Years | 2,730 (1.5%) | 1,942 (1.2%) |
| 65 to 74 Years | 1,985 (5.2%) | 2,007 (4.9%) |
| 75 Years and over | 3,464 (13.8%) | 7,970 (22.5%) |
Technology Access in San Francisco
Computing Device Access in San Francisco
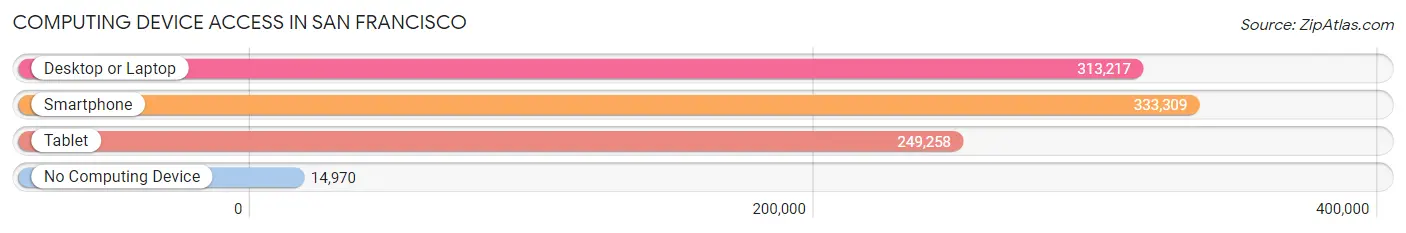
| Device Type | # Households | % Households |
| Desktop or Laptop | 313,217 | 86.8% |
| Smartphone | 333,309 | 92.4% |
| Tablet | 249,258 | 69.1% |
| No Computing Device | 14,970 | 4.2% |
| Total | 360,842 | 100.0% |
Internet Access in San Francisco
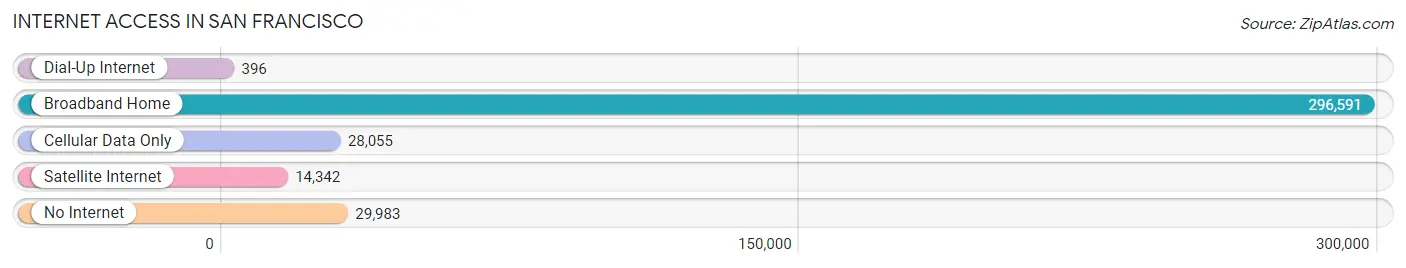
| Internet Type | # Households | % Households |
| Dial-Up Internet | 396 | 0.1% |
| Broadband Home | 296,591 | 82.2% |
| Cellular Data Only | 28,055 | 7.8% |
| Satellite Internet | 14,342 | 4.0% |
| No Internet | 29,983 | 8.3% |
| Total | 360,842 | 100.0% |
San Francisco Summary
San Francisco is a city located in the state of California in the United States of America. It is the fourth most populous city in the state and the 13th most populous city in the country. It is the cultural, commercial, and financial center of Northern California. San Francisco is located on the West Coast of the United States at the north end of the San Francisco Peninsula and includes significant stretches of the Pacific Ocean and San Francisco Bay within its boundaries. The city is renowned for its steep rolling hills, its eclectic mix of Victorian and modern architecture, and its iconic landmarks, including the Golden Gate Bridge, Alcatraz Island, and Chinatown.
History
The history of San Francisco dates back to the 16th century when Spanish explorer Juan Rodríguez Cabrillo first sailed into what is now San Francisco Bay. The area was later claimed by the Spanish Empire and became part of the Mexican province of Alta California. In 1846, during the Mexican-American War, the United States took control of the area and it became part of the state of California.
In 1848, the discovery of gold in the area sparked a massive influx of settlers, and San Francisco quickly grew into a bustling port city. The city was incorporated in 1850 and was the site of the California Gold Rush. In 1906, a massive earthquake and subsequent fire destroyed much of the city, but it was quickly rebuilt.
In the 20th century, San Francisco became a major center of industry and finance, and it was the birthplace of the United Nations. The city also became a major center of the counterculture movement in the 1960s and 1970s.
Geography
San Francisco is located on the San Francisco Peninsula, which is bordered by the Pacific Ocean to the west and San Francisco Bay to the east. The city is situated on a hilly terrain, with the highest point being Twin Peaks at 922 feet (281 meters). The city is surrounded by several bodies of water, including the San Francisco Bay, the Golden Gate Strait, and the Pacific Ocean.
The city is divided into several distinct neighborhoods, including the Financial District, Chinatown, North Beach, and the Mission District. The city is also home to several parks, including Golden Gate Park, which is the largest park in the city.
Economy
San Francisco is a major center of finance, technology, and tourism. The city is home to several major financial institutions, including the Federal Reserve Bank of San Francisco, Wells Fargo, and Bank of America. The city is also home to several major technology companies, including Twitter, Uber, and Airbnb.
Tourism is also a major industry in San Francisco. The city is home to several iconic landmarks, including the Golden Gate Bridge, Alcatraz Island, and Chinatown. The city is also home to several museums, including the San Francisco Museum of Modern Art and the California Academy of Sciences.
Demographics
As of 2019, San Francisco had an estimated population of 883,305. The city has a diverse population, with the largest ethnic groups being White (44.2%), Asian (33.3%), Hispanic or Latino (15.1%), and African American (6.1%). The median household income in the city is $96,265, and the median age is 38.7. The city has a higher-than-average cost of living, with the median home value being $1,323,400.
Common Questions
What is Per Capita Income in San Francisco?
Per Capita income in San Francisco is $86,186.
What is the Median Family Income in San Francisco?
Median Family Income in San Francisco is $159,981.
What is the Median Household income in San Francisco?
Median Household Income in San Francisco is $136,689.
What is Income or Wage Gap in San Francisco?
Income or Wage Gap in San Francisco is 19.8%.
Women in San Francisco earn 80.2 cents for every dollar earned by a man.
What is Family Income Deficit in San Francisco?
Family Income Deficit in San Francisco is $9,949.
Families that are below poverty line in San Francisco earn $9,949 less on average than the poverty threshold level.
What is Inequality or Gini Index in San Francisco?
Inequality or Gini Index in San Francisco is 0.52.
What is the Total Population of San Francisco?
Total Population of San Francisco is 851,036.
What is the Total Male Population of San Francisco?
Total Male Population of San Francisco is 438,093.
What is the Total Female Population of San Francisco?
Total Female Population of San Francisco is 412,943.
What is the Ratio of Males per 100 Females in San Francisco?
There are 106.09 Males per 100 Females in San Francisco.
What is the Ratio of Females per 100 Males in San Francisco?
There are 94.26 Females per 100 Males in San Francisco.
What is the Median Population Age in San Francisco?
Median Population Age in San Francisco is 39.3 Years.
What is the Average Family Size in San Francisco
Average Family Size in San Francisco is 3.1 People.
What is the Average Household Size in San Francisco
Average Household Size in San Francisco is 2.3 People.
How Large is the Labor Force in San Francisco?
There are 526,288 People in the Labor Forcein in San Francisco.
What is the Percentage of People in the Labor Force in San Francisco?
70.4% of People are in the Labor Force in San Francisco.
What is the Unemployment Rate in San Francisco?
Unemployment Rate in San Francisco is 5.4%.