Cities with the Highest Percentage of Population Employed in Computer, Engineering & Science in Washington
RELATED REPORTS & OPTIONS
Computer, Engineering & Science
Washington
Compare Cities
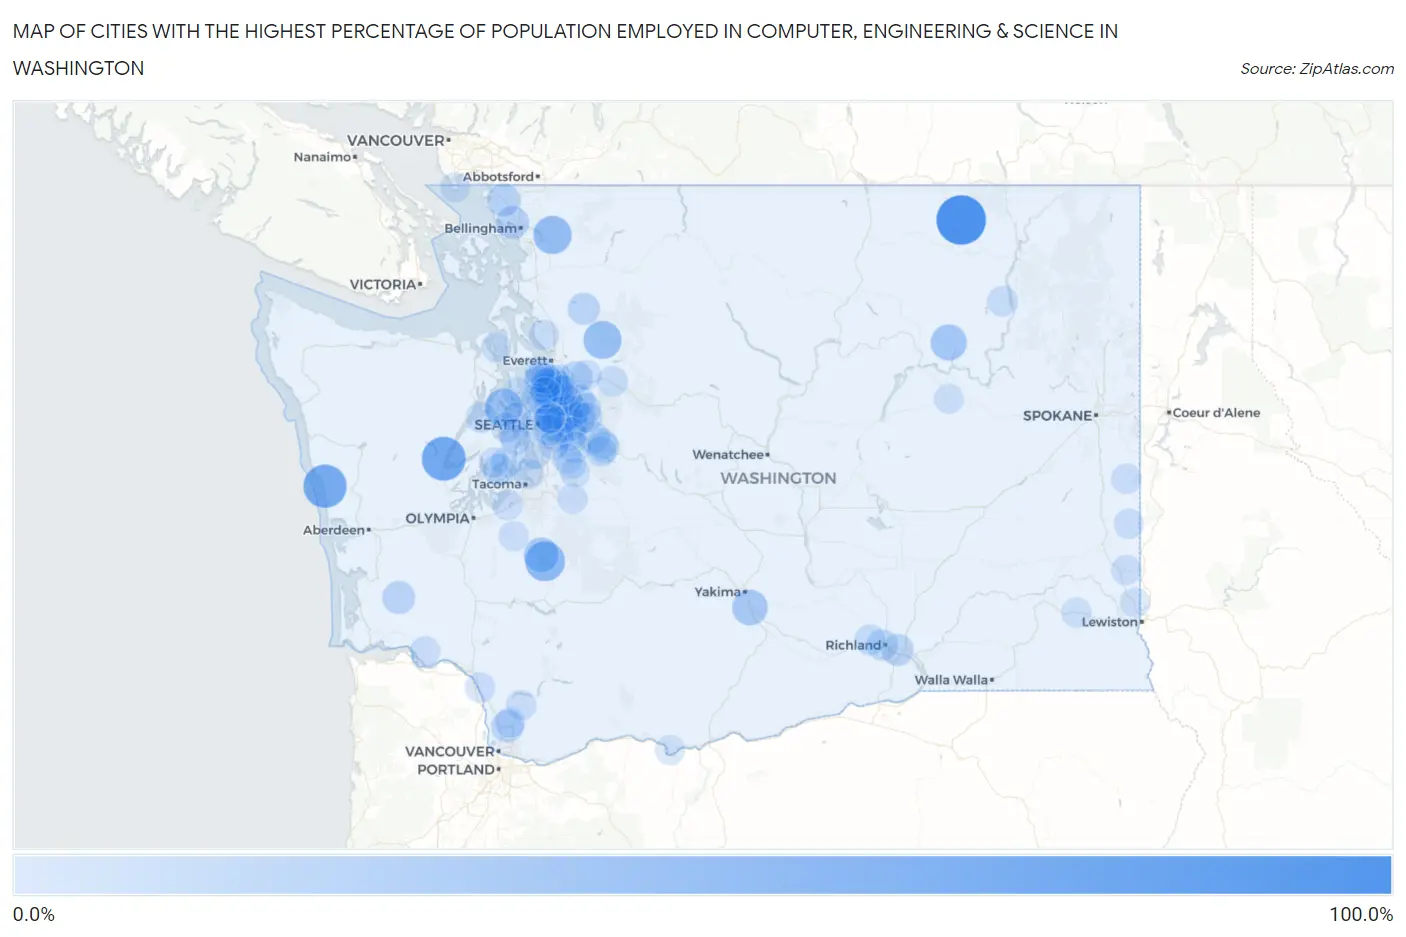
Map of Cities with the Highest Percentage of Population Employed in Computer, Engineering & Science in Washington
0.0%
100.0%
Cities with the Highest Percentage of Population Employed in Computer, Engineering & Science in Washington
| City | % Employed | vs State | vs National | |
| 1. | Wheeler | 100.0% | 10.2%(+89.8)#1 | 6.8%(+93.2)#2 |
| 2. | Malo | 100.0% | 10.2%(+89.8)#2 | 6.8%(+93.2)#16 |
| 3. | Hoodsport | 73.0% | 10.2%(+62.8)#3 | 6.8%(+66.2)#31 |
| 4. | Moclips | 70.5% | 10.2%(+60.4)#4 | 6.8%(+63.7)#32 |
| 5. | Alder | 54.5% | 10.2%(+44.4)#5 | 6.8%(+47.8)#55 |
| 6. | Acme | 47.8% | 10.2%(+37.6)#6 | 6.8%(+41.0)#79 |
| 7. | Keyport | 46.0% | 10.2%(+35.8)#7 | 6.8%(+39.2)#86 |
| 8. | Verlot | 45.7% | 10.2%(+35.6)#8 | 6.8%(+38.9)#88 |
| 9. | Redmond | 39.5% | 10.2%(+29.4)#9 | 6.8%(+32.8)#119 |
| 10. | Keller | 38.0% | 10.2%(+27.8)#10 | 6.8%(+31.2)#129 |
| 11. | Parker | 35.5% | 10.2%(+25.3)#11 | 6.8%(+28.7)#151 |
| 12. | La Grande | 32.6% | 10.2%(+22.4)#12 | 6.8%(+25.8)#177 |
| 13. | Bellevue | 29.7% | 10.2%(+19.6)#13 | 6.8%(+23.0)#227 |
| 14. | Bothell East | 29.5% | 10.2%(+19.4)#14 | 6.8%(+22.8)#230 |
| 15. | Union Hill Novelty Hill | 27.4% | 10.2%(+17.2)#15 | 6.8%(+20.6)#275 |
| 16. | Sammamish | 25.0% | 10.2%(+14.8)#16 | 6.8%(+18.2)#335 |
| 17. | Marietta Alderwood | 24.7% | 10.2%(+14.6)#17 | 6.8%(+17.9)#341 |
| 18. | Ames Lake | 24.3% | 10.2%(+14.2)#18 | 6.8%(+17.6)#351 |
| 19. | Custer | 24.0% | 10.2%(+13.9)#19 | 6.8%(+17.3)#361 |
| 20. | Mill Creek East | 23.6% | 10.2%(+13.4)#20 | 6.8%(+16.8)#374 |
| 21. | Lebam | 23.5% | 10.2%(+13.4)#21 | 6.8%(+16.8)#377 |
| 22. | Issaquah | 23.5% | 10.2%(+13.3)#22 | 6.8%(+16.7)#379 |
| 23. | Duvall | 22.6% | 10.2%(+12.4)#23 | 6.8%(+15.8)#421 |
| 24. | Newcastle | 22.4% | 10.2%(+12.2)#24 | 6.8%(+15.6)#427 |
| 25. | Kirkland | 22.3% | 10.2%(+12.1)#25 | 6.8%(+15.5)#429 |
| 26. | Dollars Corner | 21.9% | 10.2%(+11.7)#26 | 6.8%(+15.1)#453 |
| 27. | Monroe North | 21.8% | 10.2%(+11.6)#27 | 6.8%(+15.0)#462 |
| 28. | Oso | 21.2% | 10.2%(+11.1)#28 | 6.8%(+14.4)#489 |
| 29. | Bothell | 21.0% | 10.2%(+10.8)#29 | 6.8%(+14.2)#511 |
| 30. | Woodinville | 20.7% | 10.2%(+10.6)#30 | 6.8%(+14.0)#523 |
| 31. | West Pasco | 20.6% | 10.2%(+10.5)#31 | 6.8%(+13.9)#528 |
| 32. | Seattle | 19.7% | 10.2%(+9.59)#32 | 6.8%(+13.0)#568 |
| 33. | Cottage Lake | 19.7% | 10.2%(+9.50)#33 | 6.8%(+12.9)#574 |
| 34. | Bothell West | 19.6% | 10.2%(+9.48)#34 | 6.8%(+12.9)#578 |
| 35. | Snoqualmie | 19.5% | 10.2%(+9.32)#35 | 6.8%(+12.7)#591 |
| 36. | Lake Marcel Stillwater | 19.3% | 10.2%(+9.13)#36 | 6.8%(+12.5)#605 |
| 37. | Raft Island | 19.0% | 10.2%(+8.81)#37 | 6.8%(+12.2)#638 |
| 38. | Kenmore | 18.9% | 10.2%(+8.73)#38 | 6.8%(+12.1)#651 |
| 39. | Mill Creek | 18.4% | 10.2%(+8.28)#39 | 6.8%(+11.7)#685 |
| 40. | Richland | 17.5% | 10.2%(+7.32)#40 | 6.8%(+10.7)#778 |
| 41. | Riverbend | 17.2% | 10.2%(+7.07)#41 | 6.8%(+10.5)#804 |
| 42. | Mirrormont | 17.1% | 10.2%(+6.92)#42 | 6.8%(+10.3)#822 |
| 43. | Mercer Island | 16.9% | 10.2%(+6.77)#43 | 6.8%(+10.2)#841 |
| 44. | Lake Forest Park | 16.8% | 10.2%(+6.68)#44 | 6.8%(+10.1)#857 |
| 45. | Silver Firs | 16.1% | 10.2%(+5.93)#45 | 6.8%(+9.32)#948 |
| 46. | Kingston | 16.0% | 10.2%(+5.86)#46 | 6.8%(+9.26)#957 |
| 47. | Clearview | 15.7% | 10.2%(+5.58)#47 | 6.8%(+8.98)#996 |
| 48. | Hunts Point | 15.6% | 10.2%(+5.41)#48 | 6.8%(+8.81)#1,024 |
| 49. | Alderwood Manor | 15.4% | 10.2%(+5.23)#49 | 6.8%(+8.62)#1,057 |
| 50. | Meadowdale | 15.3% | 10.2%(+5.17)#50 | 6.8%(+8.57)#1,076 |
| 51. | Martha Lake | 15.3% | 10.2%(+5.10)#51 | 6.8%(+8.50)#1,089 |
| 52. | North Bend | 15.1% | 10.2%(+4.89)#52 | 6.8%(+8.29)#1,128 |
| 53. | Seabeck | 14.9% | 10.2%(+4.69)#53 | 6.8%(+8.09)#1,165 |
| 54. | West Richland | 14.9% | 10.2%(+4.69)#54 | 6.8%(+8.09)#1,166 |
| 55. | Canterwood | 14.8% | 10.2%(+4.66)#55 | 6.8%(+8.06)#1,170 |
| 56. | Inchelium | 14.1% | 10.2%(+3.94)#56 | 6.8%(+7.34)#1,308 |
| 57. | May Creek | 14.1% | 10.2%(+3.94)#57 | 6.8%(+7.34)#1,309 |
| 58. | Larch Way | 14.0% | 10.2%(+3.86)#58 | 6.8%(+7.26)#1,330 |
| 59. | Lake Stickney | 13.9% | 10.2%(+3.77)#59 | 6.8%(+7.17)#1,348 |
| 60. | Normandy Park | 13.8% | 10.2%(+3.63)#60 | 6.8%(+7.03)#1,395 |
| 61. | Fairwood Cdp King County | 13.8% | 10.2%(+3.60)#61 | 6.8%(+7.00)#1,404 |
| 62. | Picnic Point | 13.6% | 10.2%(+3.47)#62 | 6.8%(+6.87)#1,446 |
| 63. | Wilderness Rim | 13.6% | 10.2%(+3.45)#63 | 6.8%(+6.85)#1,452 |
| 64. | Dash Point | 13.5% | 10.2%(+3.31)#64 | 6.8%(+6.71)#1,488 |
| 65. | Yarrow Point | 13.5% | 10.2%(+3.30)#65 | 6.8%(+6.70)#1,494 |
| 66. | Lake Goodwin | 13.4% | 10.2%(+3.25)#66 | 6.8%(+6.65)#1,518 |
| 67. | Medina | 13.4% | 10.2%(+3.23)#67 | 6.8%(+6.62)#1,520 |
| 68. | Maltby | 13.4% | 10.2%(+3.19)#68 | 6.8%(+6.59)#1,527 |
| 69. | Erlands Point | 13.3% | 10.2%(+3.17)#69 | 6.8%(+6.57)#1,532 |
| 70. | Bainbridge Island | 13.3% | 10.2%(+3.09)#70 | 6.8%(+6.49)#1,564 |
| 71. | North Fort Lewis | 13.1% | 10.2%(+2.96)#71 | 6.8%(+6.35)#1,594 |
| 72. | Southworth | 13.1% | 10.2%(+2.95)#72 | 6.8%(+6.35)#1,597 |
| 73. | Carnation | 13.1% | 10.2%(+2.94)#73 | 6.8%(+6.33)#1,601 |
| 74. | Shoreline | 12.9% | 10.2%(+2.77)#74 | 6.8%(+6.16)#1,650 |
| 75. | Cherry Grove | 12.9% | 10.2%(+2.76)#75 | 6.8%(+6.15)#1,655 |
| 76. | Maple Valley | 12.9% | 10.2%(+2.73)#76 | 6.8%(+6.13)#1,665 |
| 77. | Stansberry Lake | 12.8% | 10.2%(+2.62)#77 | 6.8%(+6.01)#1,703 |
| 78. | Enetai | 12.8% | 10.2%(+2.61)#78 | 6.8%(+6.01)#1,705 |
| 79. | Latah | 12.8% | 10.2%(+2.61)#79 | 6.8%(+6.00)#1,706 |
| 80. | Upper Elochoman | 12.7% | 10.2%(+2.54)#80 | 6.8%(+5.93)#1,727 |
| 81. | Mckenna | 12.7% | 10.2%(+2.53)#81 | 6.8%(+5.93)#1,728 |
| 82. | Kalama | 12.6% | 10.2%(+2.47)#82 | 6.8%(+5.86)#1,744 |
| 83. | Garfield | 12.6% | 10.2%(+2.44)#83 | 6.8%(+5.84)#1,753 |
| 84. | Clyde Hill | 12.6% | 10.2%(+2.43)#84 | 6.8%(+5.83)#1,754 |
| 85. | Buckley | 12.5% | 10.2%(+2.29)#85 | 6.8%(+5.69)#1,792 |
| 86. | Mukilteo | 12.4% | 10.2%(+2.26)#86 | 6.8%(+5.66)#1,802 |
| 87. | Woods Creek | 12.1% | 10.2%(+1.93)#87 | 6.8%(+5.32)#1,917 |
| 88. | Pullman | 12.0% | 10.2%(+1.79)#88 | 6.8%(+5.19)#1,954 |
| 89. | Amboy | 11.8% | 10.2%(+1.67)#89 | 6.8%(+5.06)#1,998 |
| 90. | Brier | 11.8% | 10.2%(+1.64)#90 | 6.8%(+5.04)#2,008 |
| 91. | Marrowstone | 11.7% | 10.2%(+1.54)#91 | 6.8%(+4.93)#2,044 |
| 92. | Point Roberts | 11.7% | 10.2%(+1.53)#92 | 6.8%(+4.93)#2,046 |
| 93. | Wilbur | 11.5% | 10.2%(+1.33)#93 | 6.8%(+4.73)#2,120 |
| 94. | Manchester | 11.4% | 10.2%(+1.24)#94 | 6.8%(+4.64)#2,163 |
| 95. | Renton | 11.4% | 10.2%(+1.23)#95 | 6.8%(+4.62)#2,174 |
| 96. | Shadow Lake | 11.4% | 10.2%(+1.20)#96 | 6.8%(+4.59)#2,196 |
| 97. | Uniontown | 11.3% | 10.2%(+1.15)#97 | 6.8%(+4.54)#2,216 |
| 98. | Black Diamond | 11.2% | 10.2%(+1.08)#98 | 6.8%(+4.47)#2,252 |
| 99. | Dallesport | 11.1% | 10.2%(+0.951)#99 | 6.8%(+4.35)#2,307 |
| 100. | Pomeroy | 11.1% | 10.2%(+0.902)#100 | 6.8%(+4.30)#2,346 |
Common Questions
What are the Top 10 Cities with the Highest Percentage of Population Employed in Computer, Engineering & Science in Washington?
Top 10 Cities with the Highest Percentage of Population Employed in Computer, Engineering & Science in Washington are:
What city has the Highest Percentage of Population Employed in Computer, Engineering & Science in Washington?
Malo has the Highest Percentage of Population Employed in Computer, Engineering & Science in Washington with 100.0%.
What is the Percentage of Population Employed in Computer, Engineering & Science in the State of Washington?
Percentage of Population Employed in Computer, Engineering & Science in Washington is 10.2%.
What is the Percentage of Population Employed in Computer, Engineering & Science in the United States?
Percentage of Population Employed in Computer, Engineering & Science in the United States is 6.8%.