Cities with the Highest Percentage of Population Employed in Computer, Engineering & Science in Michigan
RELATED REPORTS & OPTIONS
Computer, Engineering & Science
Michigan
Compare Cities
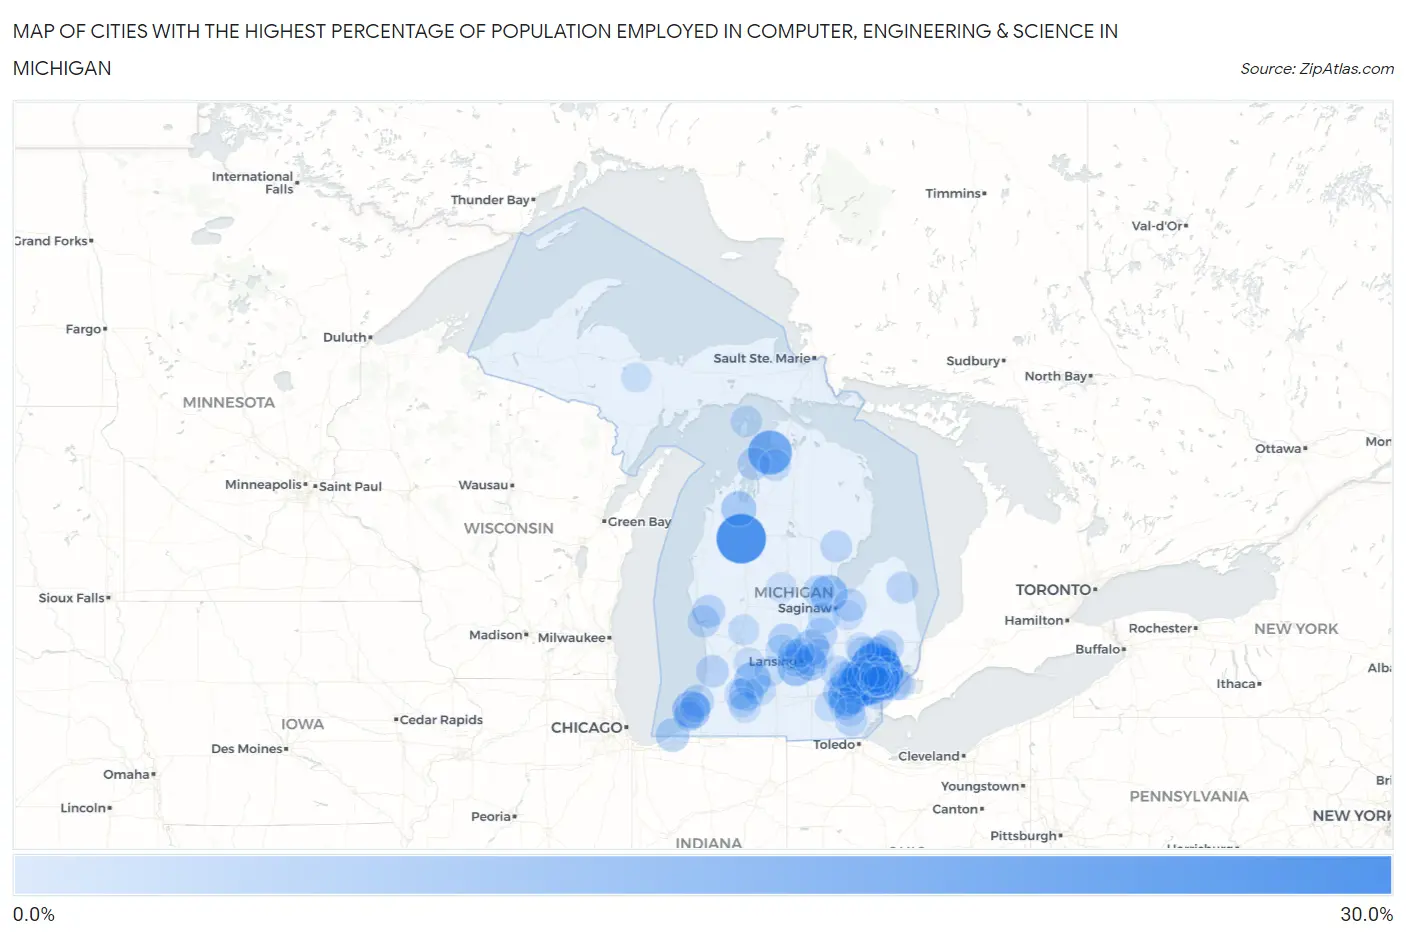
Map of Cities with the Highest Percentage of Population Employed in Computer, Engineering & Science in Michigan
0.0%
30.0%
Cities with the Highest Percentage of Population Employed in Computer, Engineering & Science in Michigan
| City | % Employed | vs State | vs National | |
| 1. | Boon | 26.1% | 7.2%(+18.9)#1 | 6.8%(+19.3)#307 |
| 2. | Bergland | 25.5% | 7.2%(+18.4)#2 | 6.8%(+18.8)#320 |
| 3. | Farmington | 22.9% | 7.2%(+15.7)#3 | 6.8%(+16.1)#405 |
| 4. | Auburn Hills | 22.3% | 7.2%(+15.1)#4 | 6.8%(+15.6)#428 |
| 5. | Troy | 21.2% | 7.2%(+14.0)#5 | 6.8%(+14.4)#495 |
| 6. | Bay Shore | 20.9% | 7.2%(+13.7)#6 | 6.8%(+14.1)#516 |
| 7. | Cambria | 19.3% | 7.2%(+12.1)#7 | 6.8%(+12.5)#609 |
| 8. | Lake Gogebic | 19.0% | 7.2%(+11.9)#8 | 6.8%(+12.3)#629 |
| 9. | Novi | 18.2% | 7.2%(+11.0)#9 | 6.8%(+11.4)#706 |
| 10. | Farmington Hills | 17.2% | 7.2%(+10.0)#10 | 6.8%(+10.5)#805 |
| 11. | Chassell | 17.0% | 7.2%(+9.81)#11 | 6.8%(+10.2)#833 |
| 12. | Rochester Hills | 16.5% | 7.2%(+9.34)#12 | 6.8%(+9.75)#891 |
| 13. | Ann Arbor | 16.3% | 7.2%(+9.10)#13 | 6.8%(+9.51)#922 |
| 14. | St Joseph | 15.7% | 7.2%(+8.53)#14 | 6.8%(+8.94)#1,004 |
| 15. | Royal Oak | 15.5% | 7.2%(+8.30)#15 | 6.8%(+8.72)#1,040 |
| 16. | Clawson | 15.5% | 7.2%(+8.29)#16 | 6.8%(+8.70)#1,046 |
| 17. | Auburn | 15.2% | 7.2%(+7.98)#17 | 6.8%(+8.40)#1,106 |
| 18. | Dimondale | 14.8% | 7.2%(+7.66)#18 | 6.8%(+8.07)#1,168 |
| 19. | Pleasant Ridge | 14.8% | 7.2%(+7.62)#19 | 6.8%(+8.03)#1,177 |
| 20. | Winn | 14.8% | 7.2%(+7.58)#20 | 6.8%(+7.99)#1,186 |
| 21. | Ferndale | 14.2% | 7.2%(+6.98)#21 | 6.8%(+7.39)#1,297 |
| 22. | Delton | 14.1% | 7.2%(+6.89)#22 | 6.8%(+7.30)#1,317 |
| 23. | Lake Victoria | 13.6% | 7.2%(+6.42)#23 | 6.8%(+6.83)#1,454 |
| 24. | Plymouth | 13.5% | 7.2%(+6.31)#24 | 6.8%(+6.72)#1,484 |
| 25. | Rochester | 13.4% | 7.2%(+6.25)#25 | 6.8%(+6.66)#1,515 |
| 26. | Chums Corner | 13.2% | 7.2%(+5.98)#26 | 6.8%(+6.39)#1,586 |
| 27. | Northville | 12.9% | 7.2%(+5.76)#27 | 6.8%(+6.18)#1,646 |
| 28. | Wolverine Lake | 12.5% | 7.2%(+5.31)#28 | 6.8%(+5.73)#1,779 |
| 29. | Comstock Northwest | 12.3% | 7.2%(+5.16)#29 | 6.8%(+5.57)#1,831 |
| 30. | Okemos | 12.3% | 7.2%(+5.11)#30 | 6.8%(+5.52)#1,846 |
| 31. | Whitmore Lake | 12.2% | 7.2%(+5.01)#31 | 6.8%(+5.42)#1,897 |
| 32. | Berkley | 12.2% | 7.2%(+4.99)#32 | 6.8%(+5.41)#1,902 |
| 33. | Dexter | 12.0% | 7.2%(+4.79)#33 | 6.8%(+5.21)#1,946 |
| 34. | Michiana | 11.9% | 7.2%(+4.74)#34 | 6.8%(+5.16)#1,973 |
| 35. | Wixom | 11.8% | 7.2%(+4.64)#35 | 6.8%(+5.06)#2,001 |
| 36. | Waverly | 11.7% | 7.2%(+4.54)#36 | 6.8%(+4.95)#2,041 |
| 37. | Millburg | 11.5% | 7.2%(+4.35)#37 | 6.8%(+4.76)#2,105 |
| 38. | Pewamo | 11.4% | 7.2%(+4.25)#38 | 6.8%(+4.66)#2,152 |
| 39. | Lake Michigan Beach | 11.3% | 7.2%(+4.09)#39 | 6.8%(+4.51)#2,229 |
| 40. | Grosse Pointe Woods | 11.2% | 7.2%(+3.99)#40 | 6.8%(+4.41)#2,281 |
| 41. | Twin Lake | 11.1% | 7.2%(+3.95)#41 | 6.8%(+4.36)#2,301 |
| 42. | Norwood | 11.1% | 7.2%(+3.93)#42 | 6.8%(+4.35)#2,317 |
| 43. | Reese | 11.1% | 7.2%(+3.90)#43 | 6.8%(+4.31)#2,340 |
| 44. | Oxford | 11.0% | 7.2%(+3.85)#44 | 6.8%(+4.26)#2,363 |
| 45. | Fennville | 10.9% | 7.2%(+3.74)#45 | 6.8%(+4.15)#2,409 |
| 46. | Lake Orion | 10.9% | 7.2%(+3.69)#46 | 6.8%(+4.11)#2,433 |
| 47. | Livonia | 10.8% | 7.2%(+3.67)#47 | 6.8%(+4.08)#2,445 |
| 48. | Keego Harbor | 10.8% | 7.2%(+3.63)#48 | 6.8%(+4.04)#2,465 |
| 49. | Dundee | 10.8% | 7.2%(+3.63)#49 | 6.8%(+4.04)#2,467 |
| 50. | Lathrup Village | 10.8% | 7.2%(+3.61)#50 | 6.8%(+4.02)#2,472 |
| 51. | Saline | 10.7% | 7.2%(+3.57)#51 | 6.8%(+3.99)#2,494 |
| 52. | Milford | 10.7% | 7.2%(+3.56)#52 | 6.8%(+3.98)#2,496 |
| 53. | Wacousta | 10.7% | 7.2%(+3.56)#53 | 6.8%(+3.98)#2,497 |
| 54. | North Muskegon | 10.6% | 7.2%(+3.46)#54 | 6.8%(+3.87)#2,562 |
| 55. | Henderson | 10.6% | 7.2%(+3.38)#55 | 6.8%(+3.79)#2,602 |
| 56. | Almont | 10.6% | 7.2%(+3.38)#56 | 6.8%(+3.79)#2,605 |
| 57. | Midland | 10.6% | 7.2%(+3.38)#57 | 6.8%(+3.79)#2,607 |
| 58. | Dearborn | 10.5% | 7.2%(+3.31)#58 | 6.8%(+3.72)#2,643 |
| 59. | Minden City | 10.4% | 7.2%(+3.24)#59 | 6.8%(+3.65)#2,686 |
| 60. | Sylvan Lake | 10.4% | 7.2%(+3.20)#60 | 6.8%(+3.62)#2,705 |
| 61. | Haslett | 10.4% | 7.2%(+3.19)#61 | 6.8%(+3.60)#2,720 |
| 62. | Prescott | 10.3% | 7.2%(+3.17)#62 | 6.8%(+3.58)#2,731 |
| 63. | Ortonville | 10.3% | 7.2%(+3.16)#63 | 6.8%(+3.57)#2,740 |
| 64. | Leonard | 10.3% | 7.2%(+3.12)#64 | 6.8%(+3.53)#2,759 |
| 65. | Huntington Woods | 10.2% | 7.2%(+2.99)#65 | 6.8%(+3.40)#2,842 |
| 66. | Sterling Heights | 10.1% | 7.2%(+2.95)#66 | 6.8%(+3.36)#2,865 |
| 67. | Boyne City | 10.1% | 7.2%(+2.95)#67 | 6.8%(+3.36)#2,866 |
| 68. | Howell | 10.0% | 7.2%(+2.86)#68 | 6.8%(+3.27)#2,920 |
| 69. | Madison Heights | 10.0% | 7.2%(+2.85)#69 | 6.8%(+3.26)#2,930 |
| 70. | St James | 10.0% | 7.2%(+2.82)#70 | 6.8%(+3.24)#2,947 |
| 71. | Portland | 10.0% | 7.2%(+2.78)#71 | 6.8%(+3.19)#2,976 |
| 72. | Beverly Hills | 9.9% | 7.2%(+2.74)#72 | 6.8%(+3.16)#2,991 |
| 73. | Level Park Oak Park | 9.9% | 7.2%(+2.71)#73 | 6.8%(+3.12)#3,016 |
| 74. | St Charles | 9.8% | 7.2%(+2.60)#74 | 6.8%(+3.01)#3,095 |
| 75. | Rockford | 9.7% | 7.2%(+2.49)#75 | 6.8%(+2.90)#3,178 |
| 76. | Ypsilanti | 9.6% | 7.2%(+2.43)#76 | 6.8%(+2.84)#3,228 |
| 77. | South Lyon | 9.6% | 7.2%(+2.43)#77 | 6.8%(+2.84)#3,231 |
| 78. | Nashville | 9.6% | 7.2%(+2.40)#78 | 6.8%(+2.81)#3,252 |
| 79. | Westwood | 9.5% | 7.2%(+2.32)#79 | 6.8%(+2.73)#3,319 |
| 80. | Manchester | 9.5% | 7.2%(+2.29)#80 | 6.8%(+2.70)#3,337 |
| 81. | Vicksburg | 9.4% | 7.2%(+2.24)#81 | 6.8%(+2.65)#3,375 |
| 82. | Milan | 9.4% | 7.2%(+2.19)#82 | 6.8%(+2.60)#3,421 |
| 83. | Brighton | 9.3% | 7.2%(+2.14)#83 | 6.8%(+2.55)#3,456 |
| 84. | Middleville | 9.1% | 7.2%(+1.96)#84 | 6.8%(+2.37)#3,594 |
| 85. | Stevensville | 9.1% | 7.2%(+1.93)#85 | 6.8%(+2.34)#3,613 |
| 86. | Village Of Grosse Pointe Shores | 9.1% | 7.2%(+1.92)#86 | 6.8%(+2.33)#3,618 |
| 87. | Shoreham | 9.1% | 7.2%(+1.91)#87 | 6.8%(+2.33)#3,625 |
| 88. | Franklin | 9.1% | 7.2%(+1.89)#88 | 6.8%(+2.30)#3,658 |
| 89. | Beal City | 9.0% | 7.2%(+1.86)#89 | 6.8%(+2.27)#3,678 |
| 90. | Frankenmuth | 9.0% | 7.2%(+1.82)#90 | 6.8%(+2.23)#3,713 |
| 91. | Oak Park | 9.0% | 7.2%(+1.79)#91 | 6.8%(+2.20)#3,739 |
| 92. | Perry | 8.9% | 7.2%(+1.77)#92 | 6.8%(+2.18)#3,761 |
| 93. | Benton Heights | 8.9% | 7.2%(+1.77)#93 | 6.8%(+2.18)#3,763 |
| 94. | Gwinn | 8.9% | 7.2%(+1.68)#94 | 6.8%(+2.09)#3,852 |
| 95. | Portage | 8.8% | 7.2%(+1.63)#95 | 6.8%(+2.04)#3,900 |
| 96. | Southfield | 8.8% | 7.2%(+1.62)#96 | 6.8%(+2.03)#3,907 |
| 97. | Bloomfield Hills | 8.8% | 7.2%(+1.58)#97 | 6.8%(+1.99)#3,939 |
| 98. | Goodrich | 8.8% | 7.2%(+1.58)#98 | 6.8%(+1.99)#3,940 |
| 99. | Walled Lake | 8.7% | 7.2%(+1.54)#99 | 6.8%(+1.95)#3,962 |
| 100. | Dewitt | 8.7% | 7.2%(+1.49)#100 | 6.8%(+1.90)#4,010 |
Common Questions
What are the Top 10 Cities with the Highest Percentage of Population Employed in Computer, Engineering & Science in Michigan?
Top 10 Cities with the Highest Percentage of Population Employed in Computer, Engineering & Science in Michigan are:
#1
26.1%
#2
22.9%
#3
22.3%
#4
21.2%
#5
20.9%
#6
18.2%
#7
17.2%
#8
16.5%
#9
16.3%
#10
15.7%
What city has the Highest Percentage of Population Employed in Computer, Engineering & Science in Michigan?
Boon has the Highest Percentage of Population Employed in Computer, Engineering & Science in Michigan with 26.1%.
What is the Percentage of Population Employed in Computer, Engineering & Science in the State of Michigan?
Percentage of Population Employed in Computer, Engineering & Science in Michigan is 7.2%.
What is the Percentage of Population Employed in Computer, Engineering & Science in the United States?
Percentage of Population Employed in Computer, Engineering & Science in the United States is 6.8%.