Cities with the Highest Percentage of Population Employed in Computer, Engineering & Science in Colorado
RELATED REPORTS & OPTIONS
Computer, Engineering & Science
Colorado
Compare Cities
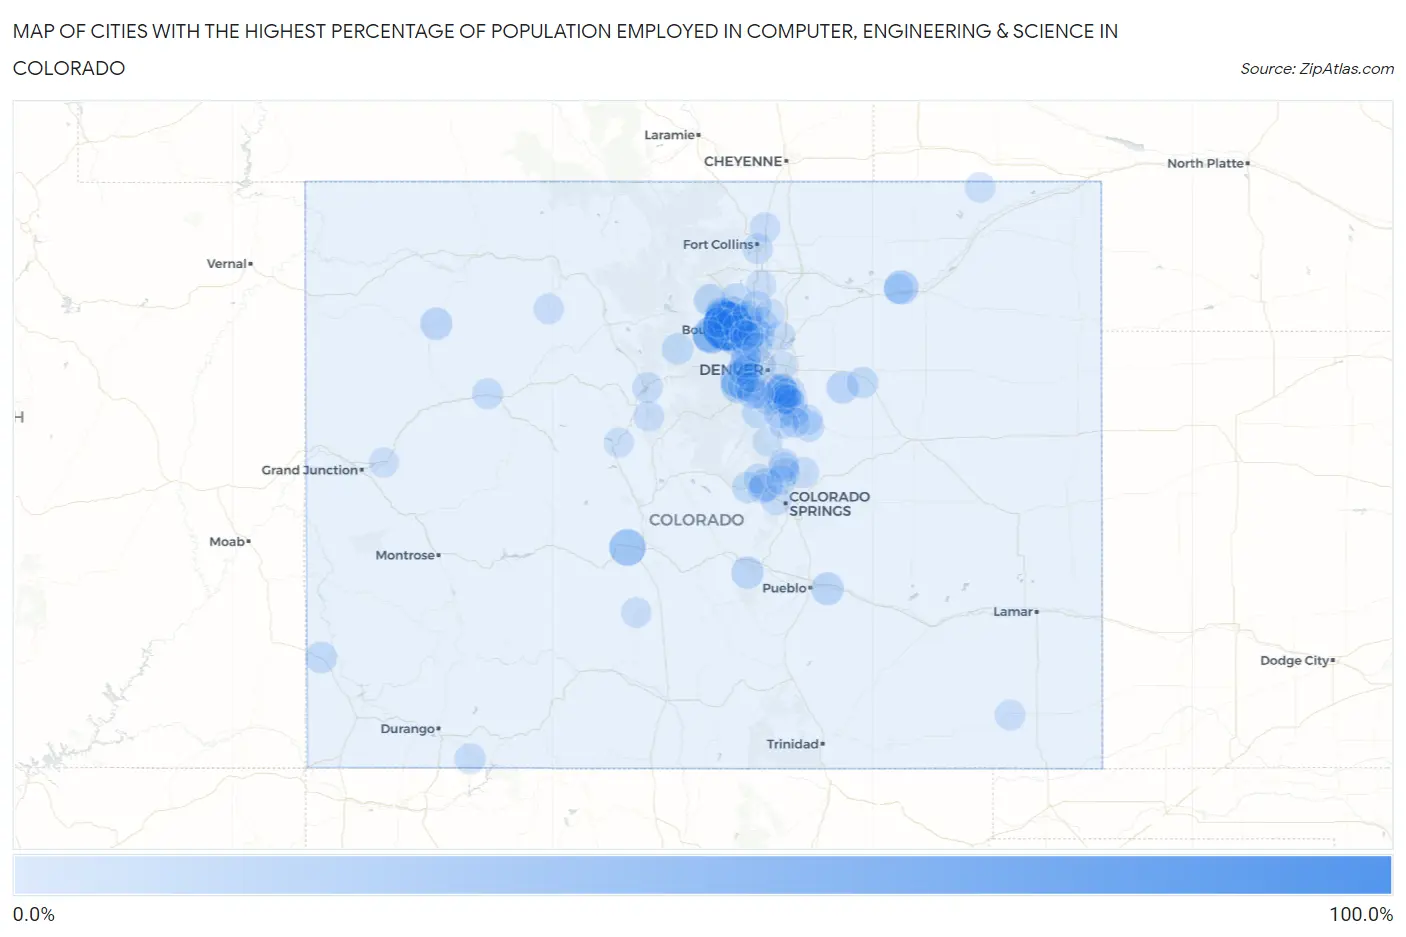
Map of Cities with the Highest Percentage of Population Employed in Computer, Engineering & Science in Colorado
0.0%
100.0%
Cities with the Highest Percentage of Population Employed in Computer, Engineering & Science in Colorado
| City | % Employed | vs State | vs National | |
| 1. | Seven Hills | 100.0% | 9.0%(+91.0)#1 | 6.8%(+93.2)#5 |
| 2. | Tall Timber | 54.8% | 9.0%(+45.8)#2 | 6.8%(+48.0)#54 |
| 3. | Glendale | 42.9% | 9.0%(+33.9)#3 | 6.8%(+36.1)#100 |
| 4. | Bonanza Mountain Estates | 40.6% | 9.0%(+31.6)#4 | 6.8%(+33.8)#114 |
| 5. | Maysville | 38.6% | 9.0%(+29.6)#5 | 6.8%(+31.8)#124 |
| 6. | Idledale | 38.2% | 9.0%(+29.2)#6 | 6.8%(+31.4)#126 |
| 7. | Inverness | 29.0% | 9.0%(+20.0)#7 | 6.8%(+22.3)#238 |
| 8. | Blue Sky | 28.6% | 9.0%(+19.6)#8 | 6.8%(+21.8)#247 |
| 9. | Lazy Acres | 27.6% | 9.0%(+18.6)#9 | 6.8%(+20.8)#271 |
| 10. | Marvel | 25.0% | 9.0%(+16.0)#10 | 6.8%(+18.2)#332 |
| 11. | Pine Brook Hill | 24.9% | 9.0%(+15.9)#11 | 6.8%(+18.1)#337 |
| 12. | Indian Hills | 24.5% | 9.0%(+15.5)#12 | 6.8%(+17.7)#344 |
| 13. | Cascade Chipita Park | 23.8% | 9.0%(+14.8)#13 | 6.8%(+17.1)#366 |
| 14. | Gunbarrel | 23.8% | 9.0%(+14.8)#14 | 6.8%(+17.0)#368 |
| 15. | Eldorado Springs | 22.0% | 9.0%(+13.0)#15 | 6.8%(+15.2)#448 |
| 16. | Sterling Ranch | 21.4% | 9.0%(+12.4)#16 | 6.8%(+14.7)#475 |
| 17. | Vineland | 20.7% | 9.0%(+11.7)#17 | 6.8%(+14.0)#522 |
| 18. | Jamestown | 19.8% | 9.0%(+10.8)#18 | 6.8%(+13.1)#564 |
| 19. | Upper Witter Gulch | 19.7% | 9.0%(+10.7)#19 | 6.8%(+12.9)#576 |
| 20. | Rockvale | 19.6% | 9.0%(+10.6)#20 | 6.8%(+12.8)#582 |
| 21. | Sierra Ridge | 19.5% | 9.0%(+10.5)#21 | 6.8%(+12.7)#590 |
| 22. | Crisman | 19.5% | 9.0%(+10.5)#22 | 6.8%(+12.7)#593 |
| 23. | Morrison | 19.4% | 9.0%(+10.4)#23 | 6.8%(+12.7)#594 |
| 24. | Altona | 18.9% | 9.0%(+9.95)#24 | 6.8%(+12.2)#642 |
| 25. | Comanche Creek | 18.9% | 9.0%(+9.91)#25 | 6.8%(+12.1)#649 |
| 26. | Allenspark | 18.9% | 9.0%(+9.87)#26 | 6.8%(+12.1)#652 |
| 27. | Meeker | 18.8% | 9.0%(+9.80)#27 | 6.8%(+12.0)#655 |
| 28. | Superior | 18.7% | 9.0%(+9.69)#28 | 6.8%(+11.9)#664 |
| 29. | Castle Pines | 17.2% | 9.0%(+8.16)#29 | 6.8%(+10.4)#812 |
| 30. | Boulder | 16.9% | 9.0%(+7.94)#30 | 6.8%(+10.2)#838 |
| 31. | Dove Creek | 16.6% | 9.0%(+7.62)#31 | 6.8%(+9.85)#884 |
| 32. | Broomfield | 16.6% | 9.0%(+7.59)#32 | 6.8%(+9.82)#885 |
| 33. | Nederland | 16.5% | 9.0%(+7.46)#33 | 6.8%(+9.69)#899 |
| 34. | Lyons | 16.1% | 9.0%(+7.07)#34 | 6.8%(+9.30)#951 |
| 35. | Lafayette | 16.0% | 9.0%(+7.02)#35 | 6.8%(+9.25)#959 |
| 36. | Winter Park | 15.9% | 9.0%(+6.94)#36 | 6.8%(+9.17)#966 |
| 37. | Peoria | 15.6% | 9.0%(+6.63)#37 | 6.8%(+8.86)#1,020 |
| 38. | Divide | 15.0% | 9.0%(+6.05)#38 | 6.8%(+8.28)#1,130 |
| 39. | Lone Tree | 14.9% | 9.0%(+5.92)#39 | 6.8%(+8.15)#1,157 |
| 40. | Erie | 14.7% | 9.0%(+5.75)#40 | 6.8%(+7.98)#1,189 |
| 41. | Louisville | 14.5% | 9.0%(+5.51)#41 | 6.8%(+7.74)#1,236 |
| 42. | Golden | 14.3% | 9.0%(+5.28)#42 | 6.8%(+7.51)#1,284 |
| 43. | Roxborough Park | 14.1% | 9.0%(+5.10)#43 | 6.8%(+7.33)#1,313 |
| 44. | Meridian | 14.0% | 9.0%(+5.01)#44 | 6.8%(+7.24)#1,333 |
| 45. | Foxfield | 13.9% | 9.0%(+4.86)#45 | 6.8%(+7.09)#1,375 |
| 46. | Chacra | 13.9% | 9.0%(+4.86)#46 | 6.8%(+7.09)#1,376 |
| 47. | Applewood | 13.9% | 9.0%(+4.86)#47 | 6.8%(+7.09)#1,378 |
| 48. | Elizabeth | 13.7% | 9.0%(+4.71)#48 | 6.8%(+6.94)#1,420 |
| 49. | Highlands Ranch | 13.4% | 9.0%(+4.45)#49 | 6.8%(+6.68)#1,502 |
| 50. | Niwot | 13.3% | 9.0%(+4.33)#50 | 6.8%(+6.56)#1,544 |
| 51. | Southern Ute | 13.0% | 9.0%(+4.05)#51 | 6.8%(+6.28)#1,618 |
| 52. | Mountain View | 12.9% | 9.0%(+3.89)#52 | 6.8%(+6.12)#1,666 |
| 53. | Stepping Stone | 12.9% | 9.0%(+3.87)#53 | 6.8%(+6.10)#1,672 |
| 54. | Longmont | 12.8% | 9.0%(+3.79)#54 | 6.8%(+6.03)#1,700 |
| 55. | Centennial | 12.7% | 9.0%(+3.69)#55 | 6.8%(+5.92)#1,729 |
| 56. | Dillon | 12.6% | 9.0%(+3.58)#56 | 6.8%(+5.81)#1,756 |
| 57. | Cherry Creek | 12.6% | 9.0%(+3.57)#57 | 6.8%(+5.80)#1,760 |
| 58. | West Pleasant View | 12.5% | 9.0%(+3.51)#58 | 6.8%(+5.74)#1,765 |
| 59. | Woodmoor | 12.4% | 9.0%(+3.44)#59 | 6.8%(+5.67)#1,800 |
| 60. | Greenwood Village | 12.4% | 9.0%(+3.38)#60 | 6.8%(+5.61)#1,815 |
| 61. | The Pinery | 12.2% | 9.0%(+3.25)#61 | 6.8%(+5.48)#1,860 |
| 62. | Ken Caryl | 12.2% | 9.0%(+3.24)#62 | 6.8%(+5.47)#1,862 |
| 63. | Dove Valley | 12.2% | 9.0%(+3.23)#63 | 6.8%(+5.46)#1,878 |
| 64. | Fairmount | 12.2% | 9.0%(+3.22)#64 | 6.8%(+5.45)#1,880 |
| 65. | Fort Collins | 12.2% | 9.0%(+3.19)#65 | 6.8%(+5.42)#1,896 |
| 66. | Black Forest | 12.1% | 9.0%(+3.07)#66 | 6.8%(+5.30)#1,922 |
| 67. | Gold Hill | 12.0% | 9.0%(+3.02)#67 | 6.8%(+5.25)#1,931 |
| 68. | Monument | 12.0% | 9.0%(+2.96)#68 | 6.8%(+5.19)#1,951 |
| 69. | Todd Creek | 11.9% | 9.0%(+2.95)#69 | 6.8%(+5.18)#1,959 |
| 70. | Pritchett | 11.9% | 9.0%(+2.95)#70 | 6.8%(+5.18)#1,962 |
| 71. | Arvada | 11.8% | 9.0%(+2.83)#71 | 6.8%(+5.06)#1,997 |
| 72. | Manitou Springs | 11.8% | 9.0%(+2.83)#72 | 6.8%(+5.06)#2,000 |
| 73. | Blue River | 11.8% | 9.0%(+2.79)#73 | 6.8%(+5.02)#2,012 |
| 74. | Parker | 11.6% | 9.0%(+2.61)#74 | 6.8%(+4.84)#2,068 |
| 75. | Saguache | 11.6% | 9.0%(+2.56)#75 | 6.8%(+4.79)#2,090 |
| 76. | Woodland Park | 11.4% | 9.0%(+2.38)#76 | 6.8%(+4.61)#2,181 |
| 77. | Grand View Estates | 11.3% | 9.0%(+2.29)#77 | 6.8%(+4.52)#2,224 |
| 78. | Stonegate | 11.2% | 9.0%(+2.24)#78 | 6.8%(+4.48)#2,249 |
| 79. | Dakota Ridge | 11.1% | 9.0%(+2.14)#79 | 6.8%(+4.37)#2,296 |
| 80. | Ponderosa Park | 11.1% | 9.0%(+2.12)#80 | 6.8%(+4.35)#2,304 |
| 81. | Yampa | 11.1% | 9.0%(+2.12)#81 | 6.8%(+4.35)#2,311 |
| 82. | Peetz | 10.9% | 9.0%(+1.94)#82 | 6.8%(+4.17)#2,401 |
| 83. | Franktown | 10.9% | 9.0%(+1.90)#83 | 6.8%(+4.13)#2,419 |
| 84. | Wellington | 10.9% | 9.0%(+1.89)#84 | 6.8%(+4.12)#2,425 |
| 85. | Paragon Estates | 10.9% | 9.0%(+1.86)#85 | 6.8%(+4.09)#2,440 |
| 86. | Westminster | 10.7% | 9.0%(+1.67)#86 | 6.8%(+3.90)#2,541 |
| 87. | Columbine | 10.5% | 9.0%(+1.51)#87 | 6.8%(+3.74)#2,636 |
| 88. | Perry Park | 10.4% | 9.0%(+1.44)#88 | 6.8%(+3.67)#2,670 |
| 89. | Green Mountain Falls | 10.4% | 9.0%(+1.42)#89 | 6.8%(+3.65)#2,684 |
| 90. | Lakewood | 10.4% | 9.0%(+1.37)#90 | 6.8%(+3.60)#2,718 |
| 91. | Frederick | 10.4% | 9.0%(+1.36)#91 | 6.8%(+3.59)#2,725 |
| 92. | Gleneagle | 10.3% | 9.0%(+1.30)#92 | 6.8%(+3.53)#2,756 |
| 93. | Palisade | 10.3% | 9.0%(+1.28)#93 | 6.8%(+3.51)#2,770 |
| 94. | Placerville | 10.2% | 9.0%(+1.23)#94 | 6.8%(+3.46)#2,802 |
| 95. | Castle Rock | 10.2% | 9.0%(+1.21)#95 | 6.8%(+3.44)#2,807 |
| 96. | Leadville | 10.2% | 9.0%(+1.20)#96 | 6.8%(+3.44)#2,814 |
| 97. | Berthoud | 10.1% | 9.0%(+1.12)#97 | 6.8%(+3.35)#2,871 |
| 98. | Air Force Academy | 10.0% | 9.0%(+1.05)#98 | 6.8%(+3.28)#2,916 |
| 99. | Morgan Heights | 10.0% | 9.0%(+1.00)#99 | 6.8%(+3.24)#2,946 |
| 100. | Denver | 9.9% | 9.0%(+0.910)#100 | 6.8%(+3.14)#3,003 |
Common Questions
What are the Top 10 Cities with the Highest Percentage of Population Employed in Computer, Engineering & Science in Colorado?
Top 10 Cities with the Highest Percentage of Population Employed in Computer, Engineering & Science in Colorado are:
#1
100.0%
#2
54.8%
#3
42.9%
#4
40.6%
#5
38.6%
#6
38.2%
#7
29.0%
#8
28.6%
#9
27.6%
#10
24.9%
What city has the Highest Percentage of Population Employed in Computer, Engineering & Science in Colorado?
Seven Hills has the Highest Percentage of Population Employed in Computer, Engineering & Science in Colorado with 100.0%.
What is the Percentage of Population Employed in Computer, Engineering & Science in the State of Colorado?
Percentage of Population Employed in Computer, Engineering & Science in Colorado is 9.0%.
What is the Percentage of Population Employed in Computer, Engineering & Science in the United States?
Percentage of Population Employed in Computer, Engineering & Science in the United States is 6.8%.