Midpines, CA Map & Demographics
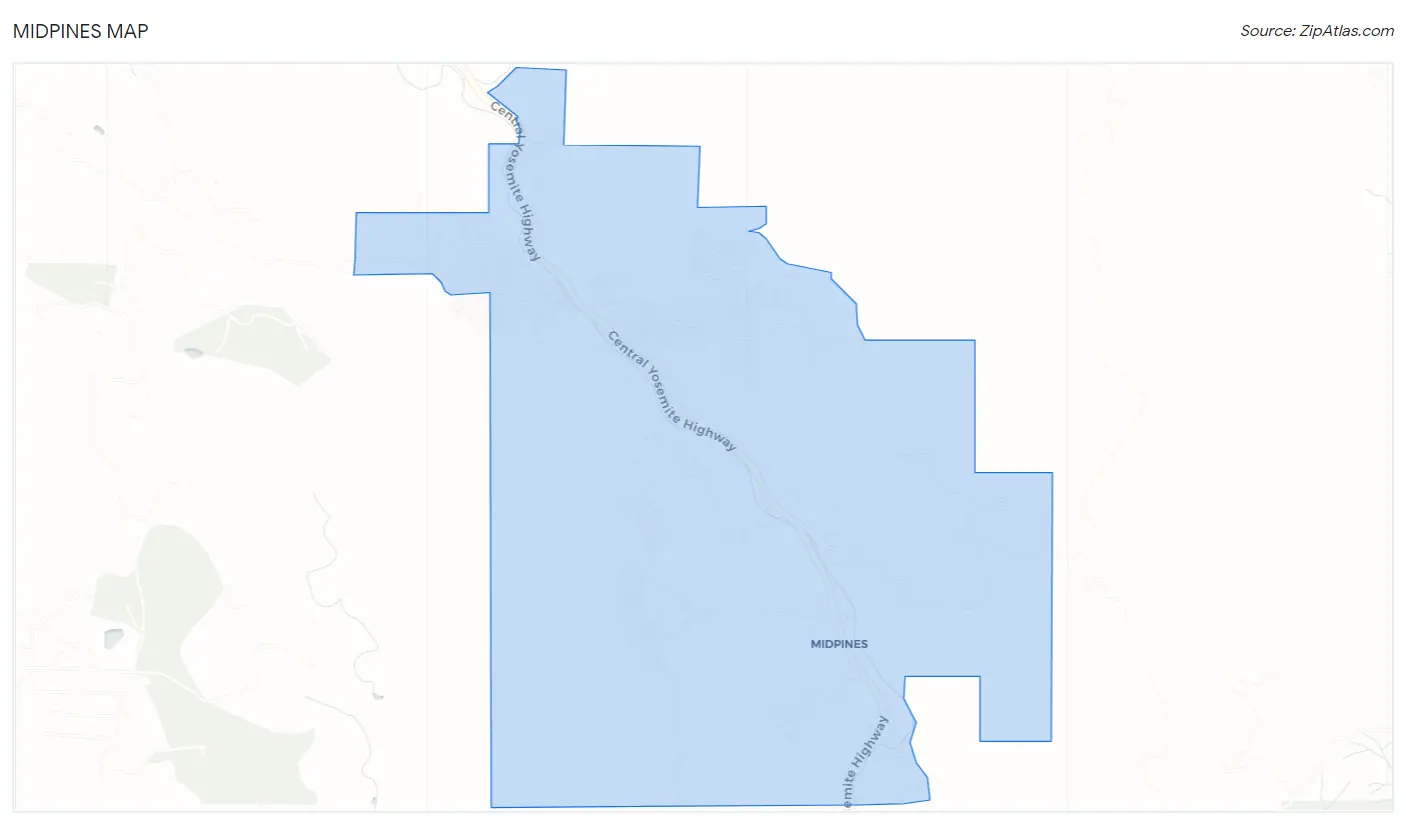
Midpines Map
Midpines Overview
$59,823
PER CAPITA INCOME
$64,242
AVG HOUSEHOLD INCOME
0.28
INEQUALITY / GINI INDEX
183
TOTAL POPULATION
52
MALE POPULATION
131
FEMALE POPULATION
39.69
MALES / 100 FEMALES
251.92
FEMALES / 100 MALES
73.7
MEDIAN AGE
2.0
AVG FAMILY SIZE
1.2
AVG HOUSEHOLD SIZE
122
LABOR FORCE [ PEOPLE ]
66.7%
PERCENT IN LABOR FORCE
Midpines Zip Codes
Midpines Area Codes
Income in Midpines
Income Overview in Midpines
| Characteristic | Number | Measure |
| Per Capita Income | 183 | $59,823 |
| Median Family Income | 29 | $0 |
| Mean Family Income | 29 | $0 |
| Median Household Income | 146 | $64,242 |
| Mean Household Income | 146 | $75,498 |
| Income Deficit | 29 | $0 |
| Wage / Income Gap (%) | 183 | 0.00% |
| Wage / Income Gap ($) | 183 | 100.00¢ per $1 |
| Gini / Inequality Index | 183 | 0.28 |
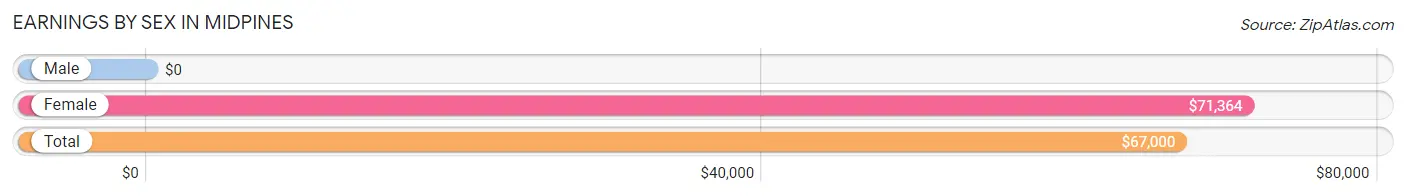
Earnings by Sex in Midpines
| Sex | Number | Average Earnings |
| Male | 38 (28.8%) | $0 |
| Female | 94 (71.2%) | $71,364 |
| Total | 132 (100.0%) | $67,000 |
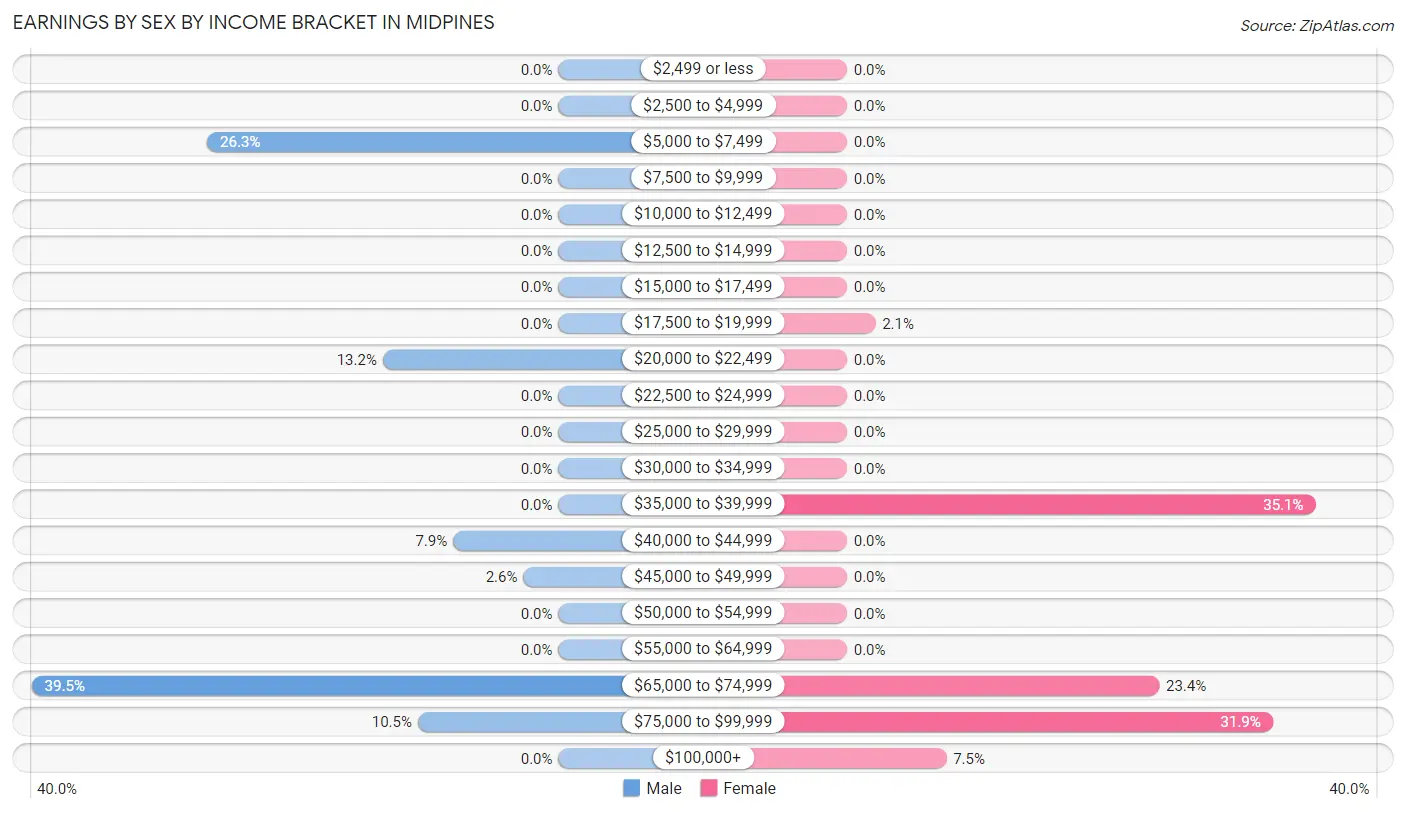
Earnings by Sex by Income Bracket in Midpines
The most common earnings brackets in Midpines are $65,000 to $74,999 for men (15 | 39.5%) and $35,000 to $39,999 for women (33 | 35.1%).
| Income | Male | Female |
| $2,499 or less | 0 (0.0%) | 0 (0.0%) |
| $2,500 to $4,999 | 0 (0.0%) | 0 (0.0%) |
| $5,000 to $7,499 | 10 (26.3%) | 0 (0.0%) |
| $7,500 to $9,999 | 0 (0.0%) | 0 (0.0%) |
| $10,000 to $12,499 | 0 (0.0%) | 0 (0.0%) |
| $12,500 to $14,999 | 0 (0.0%) | 0 (0.0%) |
| $15,000 to $17,499 | 0 (0.0%) | 0 (0.0%) |
| $17,500 to $19,999 | 0 (0.0%) | 2 (2.1%) |
| $20,000 to $22,499 | 5 (13.2%) | 0 (0.0%) |
| $22,500 to $24,999 | 0 (0.0%) | 0 (0.0%) |
| $25,000 to $29,999 | 0 (0.0%) | 0 (0.0%) |
| $30,000 to $34,999 | 0 (0.0%) | 0 (0.0%) |
| $35,000 to $39,999 | 0 (0.0%) | 33 (35.1%) |
| $40,000 to $44,999 | 3 (7.9%) | 0 (0.0%) |
| $45,000 to $49,999 | 1 (2.6%) | 0 (0.0%) |
| $50,000 to $54,999 | 0 (0.0%) | 0 (0.0%) |
| $55,000 to $64,999 | 0 (0.0%) | 0 (0.0%) |
| $65,000 to $74,999 | 15 (39.5%) | 22 (23.4%) |
| $75,000 to $99,999 | 4 (10.5%) | 30 (31.9%) |
| $100,000+ | 0 (0.0%) | 7 (7.4%) |
| Total | 38 (100.0%) | 94 (100.0%) |
Earnings by Sex by Educational Attainment in Midpines
| Educational Attainment | Male Income | Female Income |
| Less than High School | - | - |
| High School Diploma | - | - |
| College or Associate's Degree | - | - |
| Bachelor's Degree | - | - |
| Graduate Degree | - | - |
| Total | - | - |
Family Income in Midpines
Family Income Brackets in Midpines
According to the Midpines family income data, there are 29 families falling into the $100,000 to $149,999 income range, which is the most common income bracket and makes up 100.0% of all families.
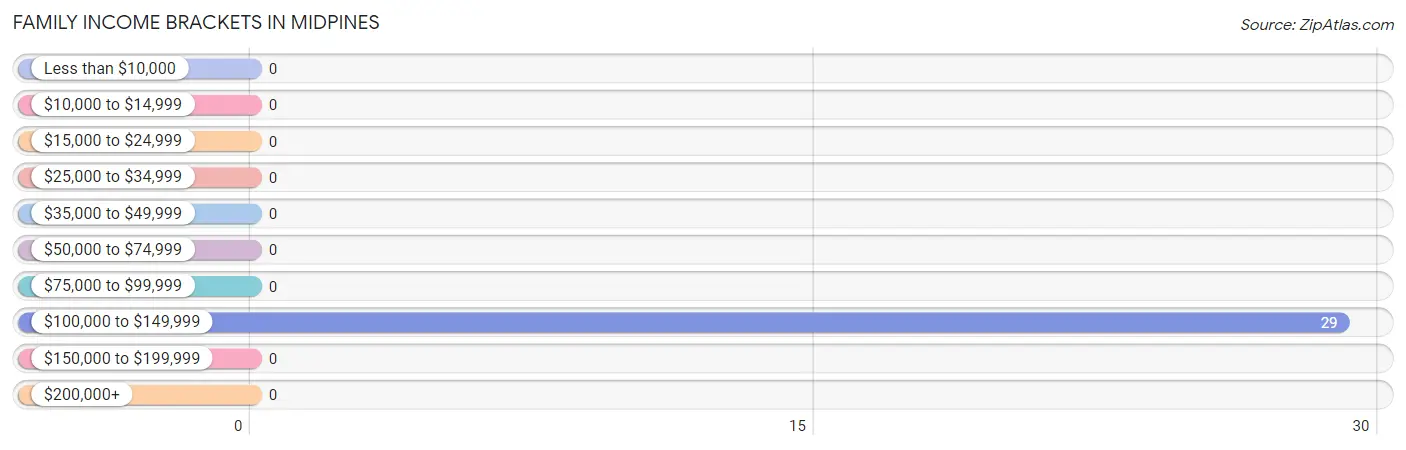
| Income Bracket | # Families | % Families |
| Less than $10,000 | 0 | 0.0% |
| $10,000 to $14,999 | 0 | 0.0% |
| $15,000 to $24,999 | 0 | 0.0% |
| $25,000 to $34,999 | 0 | 0.0% |
| $35,000 to $49,999 | 0 | 0.0% |
| $50,000 to $74,999 | 0 | 0.0% |
| $75,000 to $99,999 | 0 | 0.0% |
| $100,000 to $149,999 | 29 | 100.0% |
| $150,000 to $199,999 | 0 | 0.0% |
| $200,000+ | 0 | 0.0% |
Family Income by Famaliy Size in Midpines
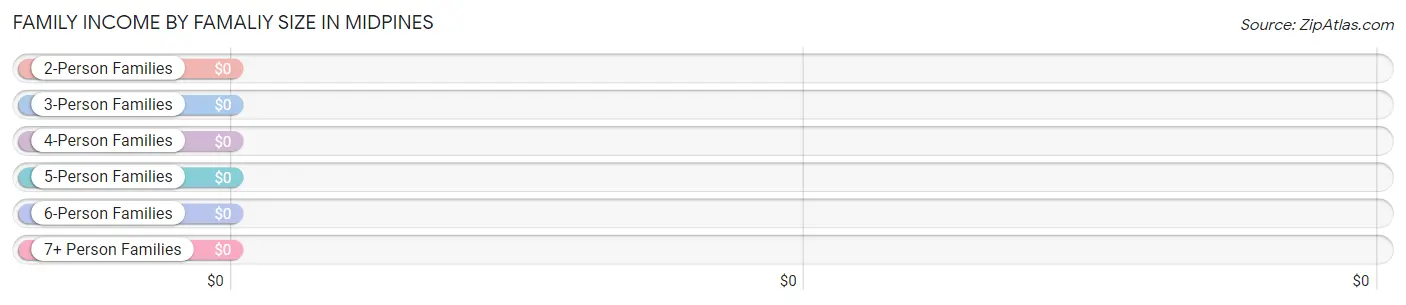
| Income Bracket | # Families | Median Income |
| 2-Person Families | 29 (100.0%) | $0 |
| 3-Person Families | 0 (0.0%) | $0 |
| 4-Person Families | 0 (0.0%) | $0 |
| 5-Person Families | 0 (0.0%) | $0 |
| 6-Person Families | 0 (0.0%) | $0 |
| 7+ Person Families | 0 (0.0%) | $0 |
| Total | 29 (100.0%) | $0 |
Family Income by Number of Earners in Midpines
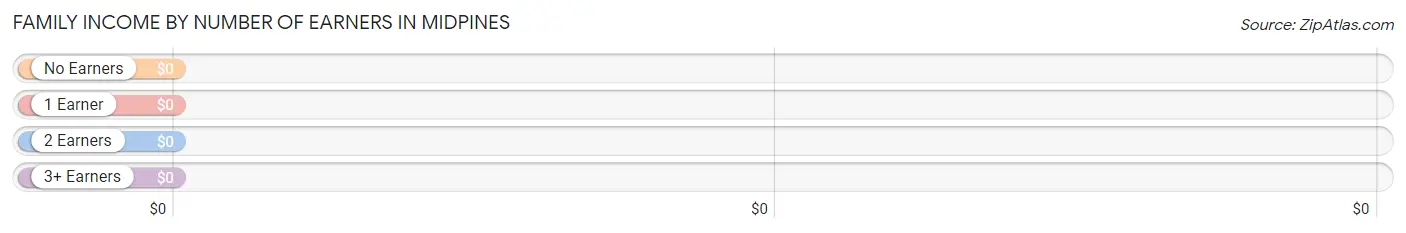
| Number of Earners | # Families | Median Income |
| No Earners | 0 (0.0%) | $0 |
| 1 Earner | 7 (24.1%) | $0 |
| 2 Earners | 22 (75.9%) | $0 |
| 3+ Earners | 0 (0.0%) | $0 |
| Total | 29 (100.0%) | $0 |
Household Income in Midpines
Household Income Brackets in Midpines
With 37 households falling in the category, the $25,000 to $34,999 income range is the most frequent in Midpines, accounting for 25.3% of all households.
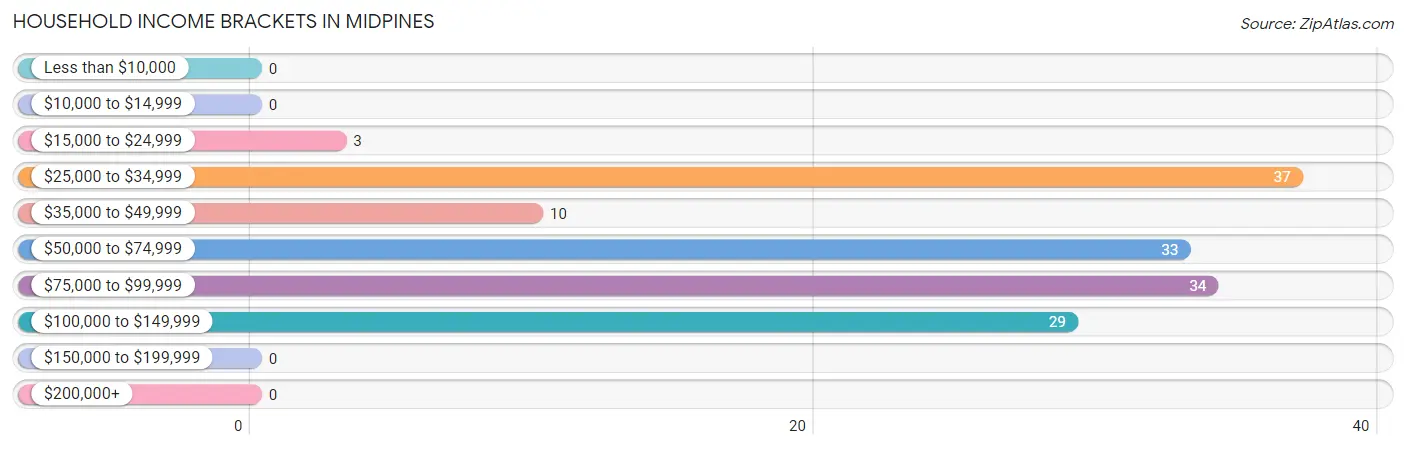
| Income Bracket | # Households | % Households |
| Less than $10,000 | 0 | 0.0% |
| $10,000 to $14,999 | 0 | 0.0% |
| $15,000 to $24,999 | 3 | 2.1% |
| $25,000 to $34,999 | 37 | 25.3% |
| $35,000 to $49,999 | 10 | 6.8% |
| $50,000 to $74,999 | 33 | 22.6% |
| $75,000 to $99,999 | 34 | 23.3% |
| $100,000 to $149,999 | 29 | 19.9% |
| $150,000 to $199,999 | 0 | 0.0% |
| $200,000+ | 0 | 0.0% |
Household Income by Householder Age in Midpines
The median household income in Midpines is $64,242, with the highest median household income of $63,106 found in the 65+ years age bracket for the primary householder. A total of 110 households (75.3%) fall into this category.
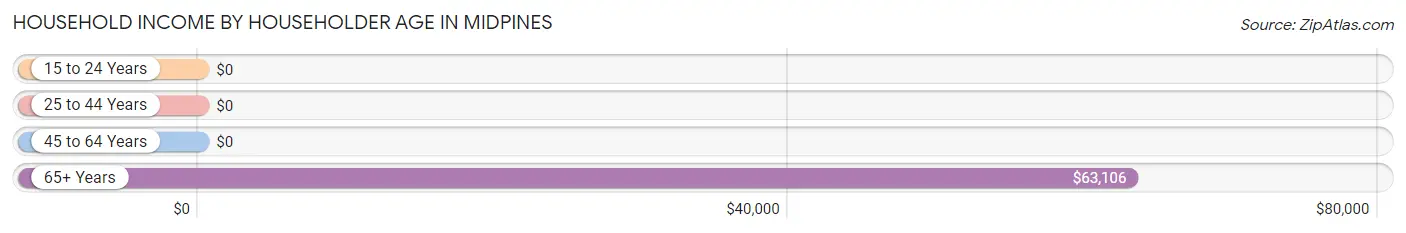
| Income Bracket | # Households | Median Income |
| 15 to 24 Years | 0 (0.0%) | $0 |
| 25 to 44 Years | 26 (17.8%) | $0 |
| 45 to 64 Years | 10 (6.9%) | $0 |
| 65+ Years | 110 (75.3%) | $63,106 |
| Total | 146 (100.0%) | $64,242 |
Poverty in Midpines
Income Below Poverty by Sex and Age in Midpines
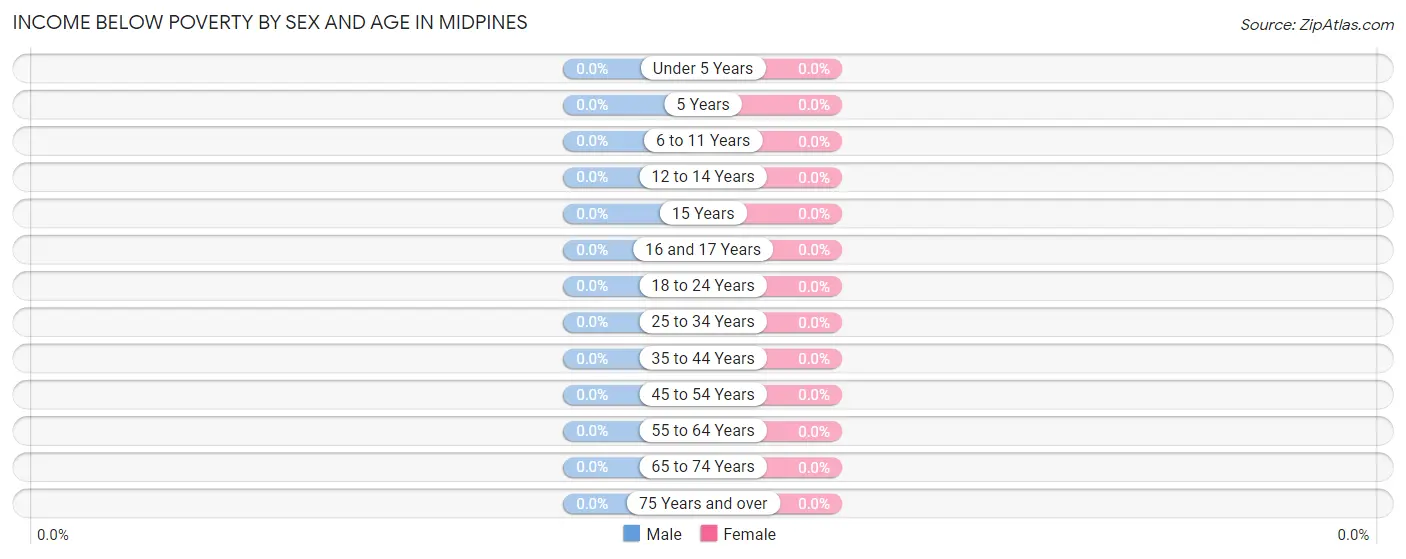
| Age Bracket | Male | Female |
| Under 5 Years | 0 (0.0%) | 0 (0.0%) |
| 5 Years | 0 (0.0%) | 0 (0.0%) |
| 6 to 11 Years | 0 (0.0%) | 0 (0.0%) |
| 12 to 14 Years | 0 (0.0%) | 0 (0.0%) |
| 15 Years | 0 (0.0%) | 0 (0.0%) |
| 16 and 17 Years | 0 (0.0%) | 0 (0.0%) |
| 18 to 24 Years | 0 (0.0%) | 0 (0.0%) |
| 25 to 34 Years | 0 (0.0%) | 0 (0.0%) |
| 35 to 44 Years | 0 (0.0%) | 0 (0.0%) |
| 45 to 54 Years | 0 (0.0%) | 0 (0.0%) |
| 55 to 64 Years | 0 (0.0%) | 0 (0.0%) |
| 65 to 74 Years | 0 (0.0%) | 0 (0.0%) |
| 75 Years and over | 0 (0.0%) | 0 (0.0%) |
| Total | 0 (0.0%) | 0 (0.0%) |
Income Above Poverty by Sex and Age in Midpines
According to the poverty statistics in Midpines, males aged 25 to 34 years and females aged 25 to 34 years are the age groups that are most secure financially, with 100.0% of males and 100.0% of females in these age groups living above the poverty line.
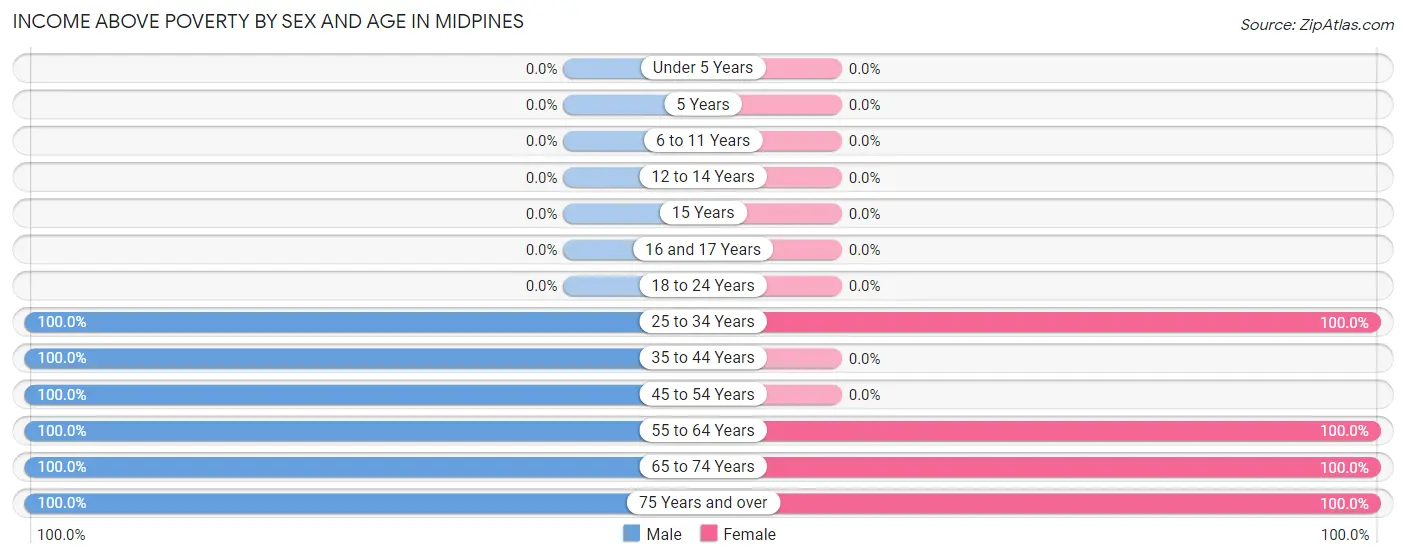
| Age Bracket | Male | Female |
| Under 5 Years | 0 (0.0%) | 0 (0.0%) |
| 5 Years | 0 (0.0%) | 0 (0.0%) |
| 6 to 11 Years | 0 (0.0%) | 0 (0.0%) |
| 12 to 14 Years | 0 (0.0%) | 0 (0.0%) |
| 15 Years | 0 (0.0%) | 0 (0.0%) |
| 16 and 17 Years | 0 (0.0%) | 0 (0.0%) |
| 18 to 24 Years | 0 (0.0%) | 0 (0.0%) |
| 25 to 34 Years | 15 (100.0%) | 22 (100.0%) |
| 35 to 44 Years | 7 (100.0%) | 0 (0.0%) |
| 45 to 54 Years | 3 (100.0%) | 0 (0.0%) |
| 55 to 64 Years | 1 (100.0%) | 7 (100.0%) |
| 65 to 74 Years | 12 (100.0%) | 35 (100.0%) |
| 75 Years and over | 14 (100.0%) | 67 (100.0%) |
| Total | 52 (100.0%) | 131 (100.0%) |
Income Below Poverty Among Married-Couple Families in Midpines
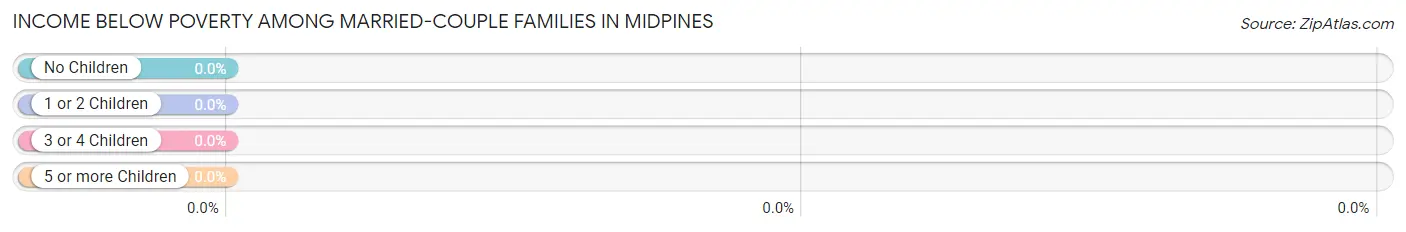
| Children | Above Poverty | Below Poverty |
| No Children | 29 (100.0%) | 0 (0.0%) |
| 1 or 2 Children | 0 (0.0%) | 0 (0.0%) |
| 3 or 4 Children | 0 (0.0%) | 0 (0.0%) |
| 5 or more Children | 0 (0.0%) | 0 (0.0%) |
| Total | 29 (100.0%) | 0 (0.0%) |
Income Below Poverty Among Single-Parent Households in Midpines
| Children | Single Father | Single Mother |
| No Children | 0 (0.0%) | 0 (0.0%) |
| 1 or 2 Children | 0 (0.0%) | 0 (0.0%) |
| 3 or 4 Children | 0 (0.0%) | 0 (0.0%) |
| 5 or more Children | 0 (0.0%) | 0 (0.0%) |
| Total | 0 (0.0%) | 0 (0.0%) |
Income Below Poverty Among Married-Couple vs Single-Parent Households in Midpines
| Children | Married-Couple Families | Single-Parent Households |
| No Children | 0 (0.0%) | 0 (0.0%) |
| 1 or 2 Children | 0 (0.0%) | 0 (0.0%) |
| 3 or 4 Children | 0 (0.0%) | 0 (0.0%) |
| 5 or more Children | 0 (0.0%) | 0 (0.0%) |
| Total | 0 (0.0%) | 0 (0.0%) |
Race in Midpines
The most populous races in Midpines are White / Caucasian (176 | 96.2%), Two or more Races (4 | 2.2%), and Asian (3 | 1.6%).
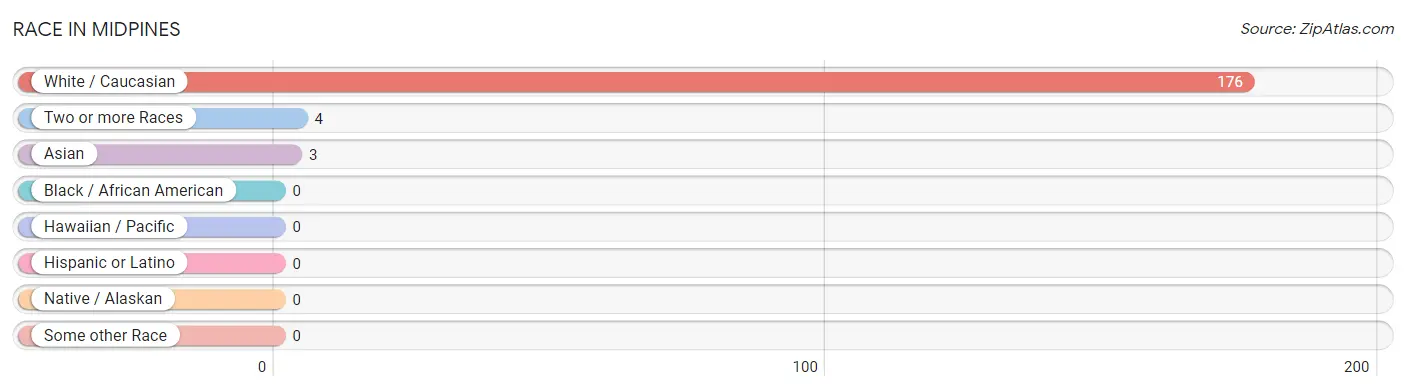
| Race | # Population | % Population |
| Asian | 3 | 1.6% |
| Black / African American | 0 | 0.0% |
| Hawaiian / Pacific | 0 | 0.0% |
| Hispanic or Latino | 0 | 0.0% |
| Native / Alaskan | 0 | 0.0% |
| White / Caucasian | 176 | 96.2% |
| Two or more Races | 4 | 2.2% |
| Some other Race | 0 | 0.0% |
| Total | 183 | 100.0% |
Ancestry in Midpines
The most populous ancestries reported in Midpines are English (89 | 48.6%), Irish (63 | 34.4%), German (47 | 25.7%), Swedish (33 | 18.0%), and European (23 | 12.6%), together accounting for 139.3% of all Midpines residents.
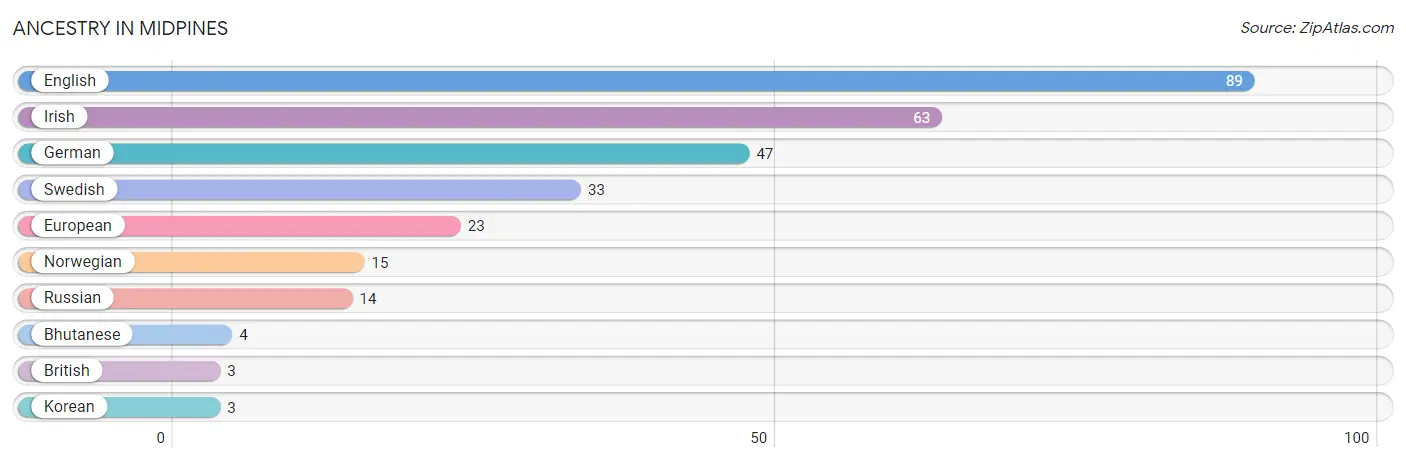
| Ancestry | # Population | % Population |
| Bhutanese | 4 | 2.2% |
| British | 3 | 1.6% |
| English | 89 | 48.6% |
| European | 23 | 12.6% |
| German | 47 | 25.7% |
| Irish | 63 | 34.4% |
| Korean | 3 | 1.6% |
| Norwegian | 15 | 8.2% |
| Russian | 14 | 7.6% |
| Swedish | 33 | 18.0% | View All 10 Rows |
Immigrants in Midpines
The most numerous immigrant groups reported in Midpines came from Asia (3 | 1.6%), Philippines (3 | 1.6%), and South Eastern Asia (3 | 1.6%), together accounting for 4.9% of all Midpines residents.
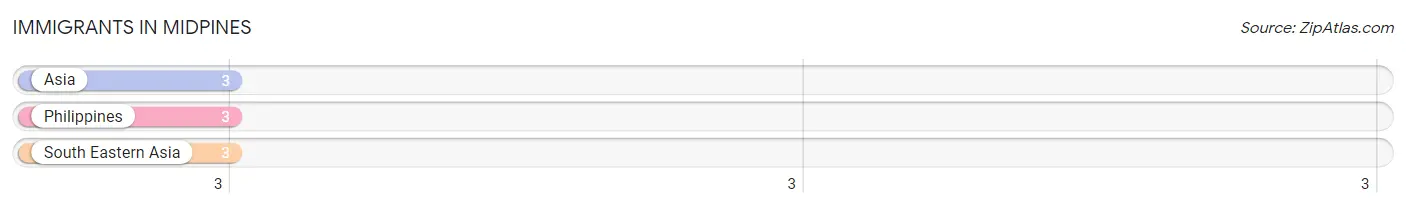
| Immigration Origin | # Population | % Population |
| Asia | 3 | 1.6% |
| Philippines | 3 | 1.6% |
| South Eastern Asia | 3 | 1.6% | View All 3 Rows |
Sex and Age in Midpines
Sex and Age in Midpines
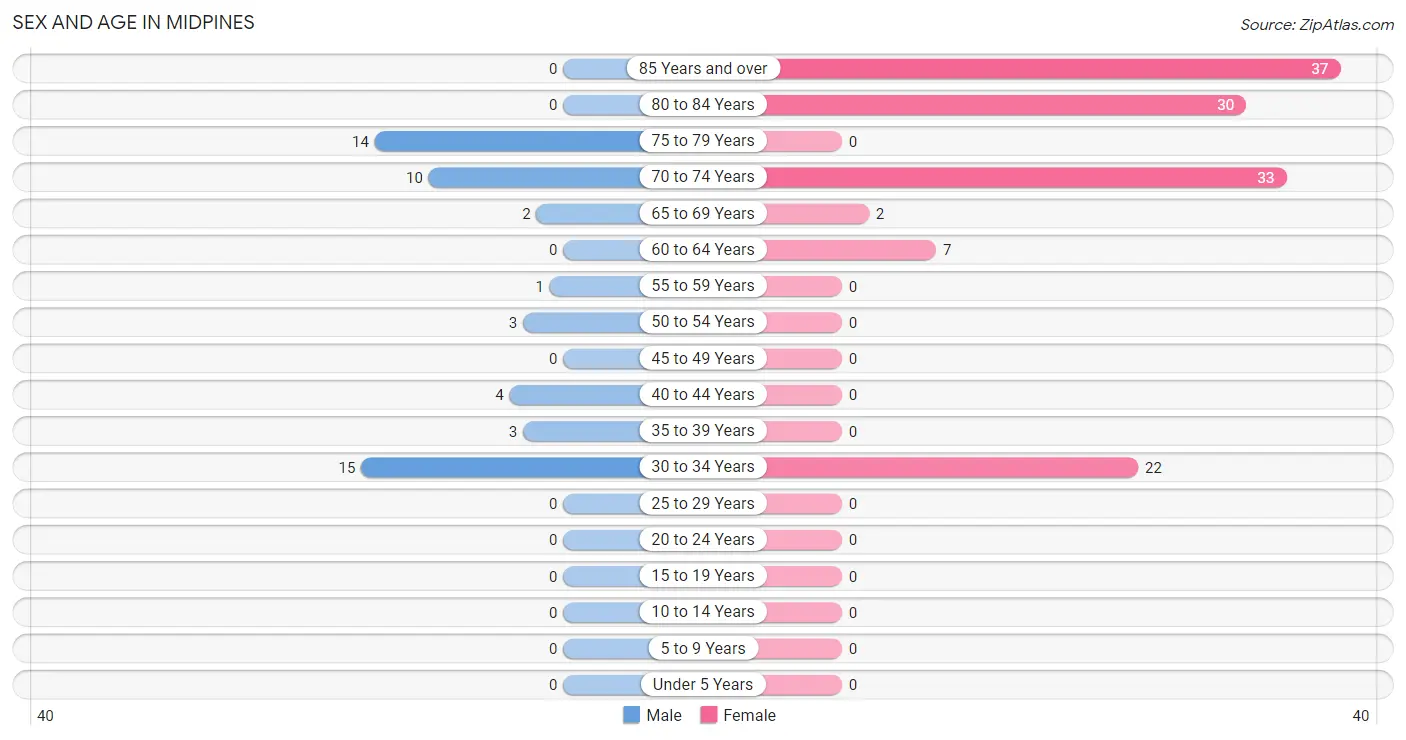
The most populous age groups in Midpines are 30 to 34 Years (15 | 28.8%) for men and 85 Years and over (37 | 28.2%) for women.
| Age Bracket | Male | Female |
| Under 5 Years | 0 (0.0%) | 0 (0.0%) |
| 5 to 9 Years | 0 (0.0%) | 0 (0.0%) |
| 10 to 14 Years | 0 (0.0%) | 0 (0.0%) |
| 15 to 19 Years | 0 (0.0%) | 0 (0.0%) |
| 20 to 24 Years | 0 (0.0%) | 0 (0.0%) |
| 25 to 29 Years | 0 (0.0%) | 0 (0.0%) |
| 30 to 34 Years | 15 (28.8%) | 22 (16.8%) |
| 35 to 39 Years | 3 (5.8%) | 0 (0.0%) |
| 40 to 44 Years | 4 (7.7%) | 0 (0.0%) |
| 45 to 49 Years | 0 (0.0%) | 0 (0.0%) |
| 50 to 54 Years | 3 (5.8%) | 0 (0.0%) |
| 55 to 59 Years | 1 (1.9%) | 0 (0.0%) |
| 60 to 64 Years | 0 (0.0%) | 7 (5.3%) |
| 65 to 69 Years | 2 (3.8%) | 2 (1.5%) |
| 70 to 74 Years | 10 (19.2%) | 33 (25.2%) |
| 75 to 79 Years | 14 (26.9%) | 0 (0.0%) |
| 80 to 84 Years | 0 (0.0%) | 30 (22.9%) |
| 85 Years and over | 0 (0.0%) | 37 (28.2%) |
| Total | 52 (100.0%) | 131 (100.0%) |
Families and Households in Midpines
Median Family Size in Midpines
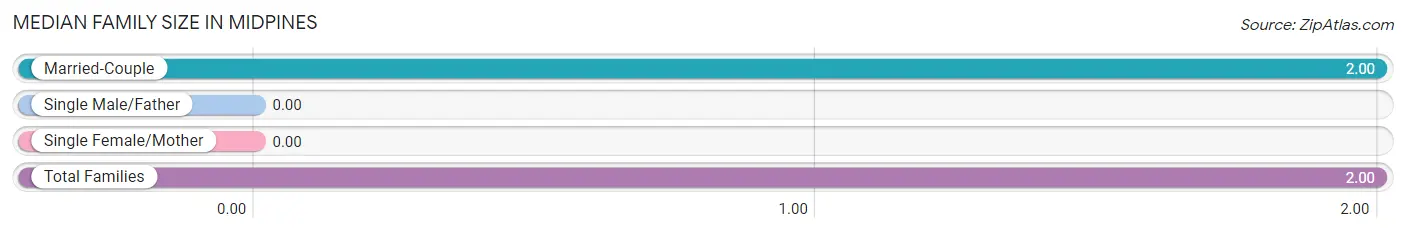
| Family Type | # Families | Family Size |
| Married-Couple | 29 (100.0%) | 2.00 |
| Single Male/Father | 0 (0.0%) | - |
| Single Female/Mother | 0 (0.0%) | - |
| Total Families | 29 (100.0%) | 2.00 |
Median Household Size in Midpines
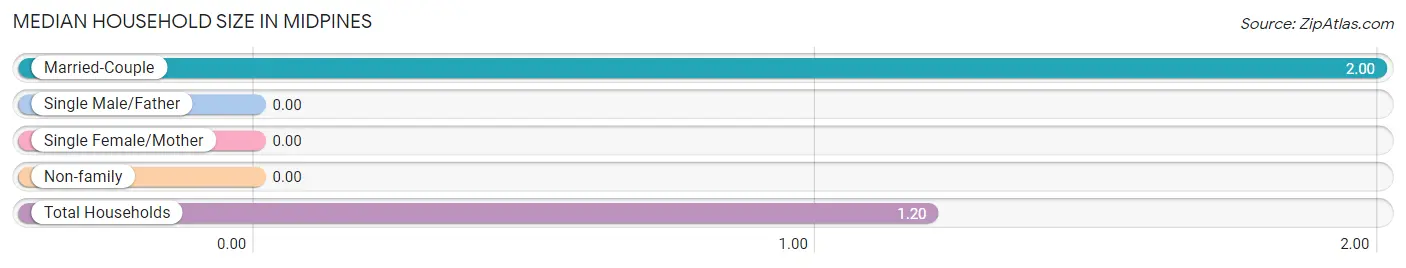
| Household Type | # Households | Household Size |
| Married-Couple | 29 (19.9%) | 2.00 |
| Single Male/Father | 0 (0.0%) | - |
| Single Female/Mother | 0 (0.0%) | - |
| Non-family | 117 (80.1%) | - |
| Total Households | 146 (100.0%) | 1.20 |
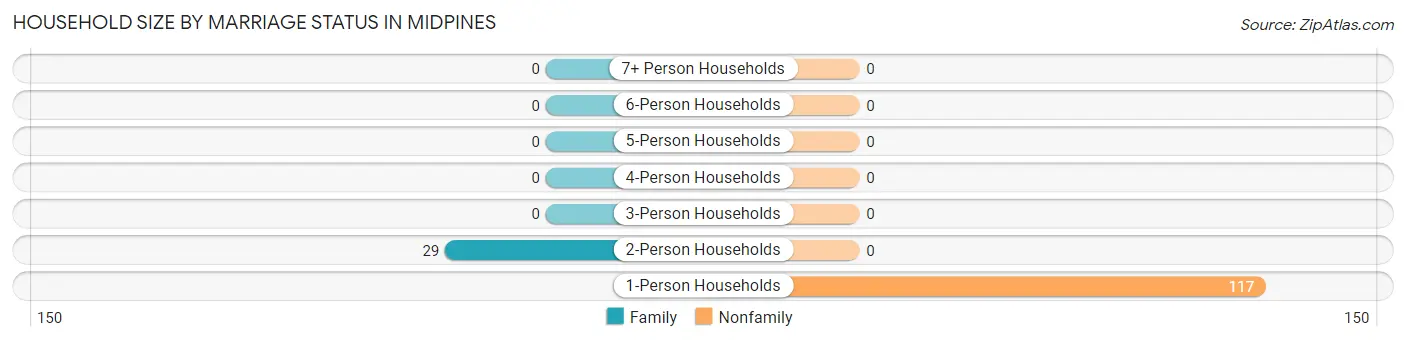
Household Size by Marriage Status in Midpines
Out of a total of 146 households in Midpines, 29 (19.9%) are family households, while 117 (80.1%) are nonfamily households. The most numerous type of family households are 2-person households, comprising 29, and the most common type of nonfamily households are 1-person households, comprising 117.
| Household Size | Family Households | Nonfamily Households |
| 1-Person Households | - | 117 (80.1%) |
| 2-Person Households | 29 (19.9%) | 0 (0.0%) |
| 3-Person Households | 0 (0.0%) | 0 (0.0%) |
| 4-Person Households | 0 (0.0%) | 0 (0.0%) |
| 5-Person Households | 0 (0.0%) | 0 (0.0%) |
| 6-Person Households | 0 (0.0%) | 0 (0.0%) |
| 7+ Person Households | 0 (0.0%) | 0 (0.0%) |
| Total | 29 (19.9%) | 117 (80.1%) |
Female Fertility in Midpines
Fertility by Age in Midpines
| Age Bracket | Women with Births | Births / 1,000 Women |
| 15 to 19 years | 0 (0.0%) | 0.0 |
| 20 to 34 years | 0 (0.0%) | 0.0 |
| 35 to 50 years | 0 (0.0%) | 0.0 |
| Total | 0 (0.0%) | 0.0 |
Fertility by Age by Marriage Status in Midpines
| Age Bracket | Married | Unmarried |
| 15 to 19 years | 0 (0.0%) | 0 (0.0%) |
| 20 to 34 years | 0 (0.0%) | 0 (0.0%) |
| 35 to 50 years | 0 (0.0%) | 0 (0.0%) |
| Total | 0 (0.0%) | 0 (0.0%) |
Fertility by Education in Midpines
| Educational Attainment | Women with Births | Births / 1,000 Women |
| Less than High School | 0 (0.0%) | 0.0 |
| High School Diploma | 0 (0.0%) | 0.0 |
| College or Associate's Degree | 0 (0.0%) | 0.0 |
| Bachelor's Degree | 0 (0.0%) | 0.0 |
| Graduate Degree | 0 (0.0%) | 0.0 |
| Total | 0 (0.0%) | 0.0 |
Fertility by Education by Marriage Status in Midpines
| Educational Attainment | Married | Unmarried |
| Less than High School | 0 (0.0%) | 0 (0.0%) |
| High School Diploma | 0 (0.0%) | 0 (0.0%) |
| College or Associate's Degree | 0 (0.0%) | 0 (0.0%) |
| Bachelor's Degree | 0 (0.0%) | 0 (0.0%) |
| Graduate Degree | 0 (0.0%) | 0 (0.0%) |
| Total | 0 (0.0%) | 0 (0.0%) |
Employment Characteristics in Midpines
Employment by Class of Employer in Midpines
Among the 122 employed individuals in Midpines, private company employees (50 | 41.0%), self-employed (incorporated) (30 | 24.6%), and federal government employees (26 | 21.3%) make up the most common classes of employment.
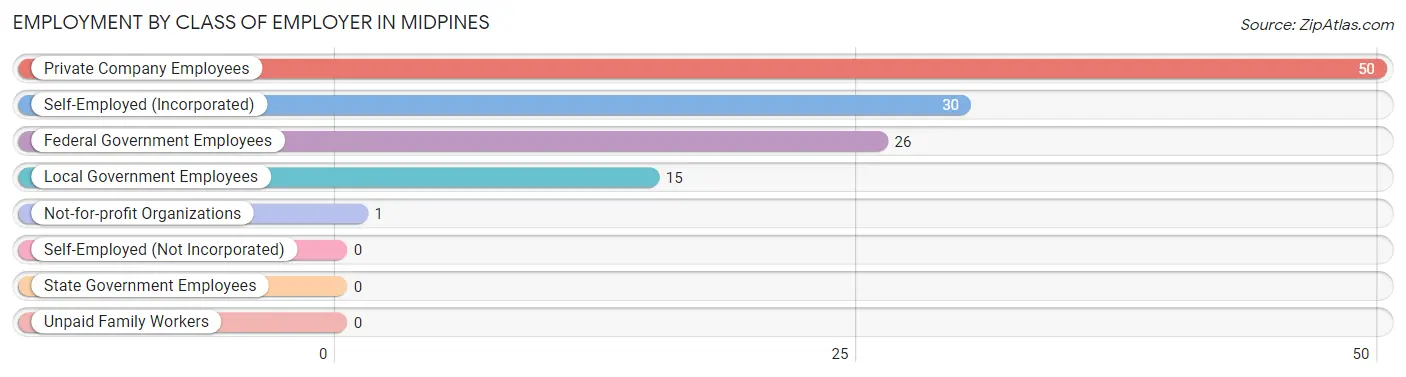
| Employer Class | # Employees | % Employees |
| Private Company Employees | 50 | 41.0% |
| Self-Employed (Incorporated) | 30 | 24.6% |
| Self-Employed (Not Incorporated) | 0 | 0.0% |
| Not-for-profit Organizations | 1 | 0.8% |
| Local Government Employees | 15 | 12.3% |
| State Government Employees | 0 | 0.0% |
| Federal Government Employees | 26 | 21.3% |
| Unpaid Family Workers | 0 | 0.0% |
| Total | 122 | 100.0% |
Employment Status by Age in Midpines
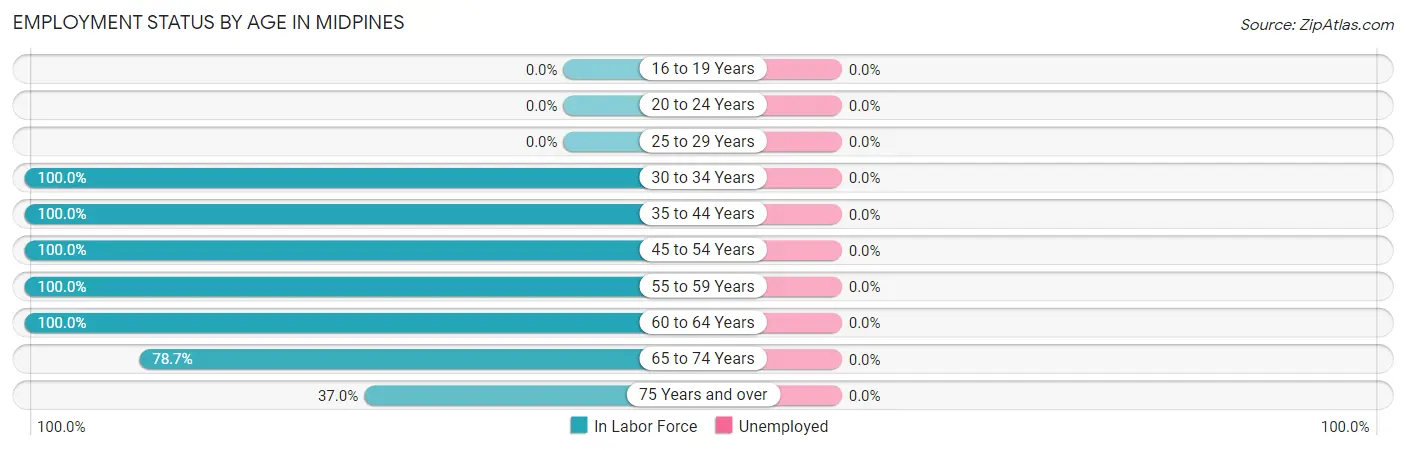
| Age Bracket | In Labor Force | Unemployed |
| 16 to 19 Years | 0 (0.0%) | 0 (0.0%) |
| 20 to 24 Years | 0 (0.0%) | 0 (0.0%) |
| 25 to 29 Years | 0 (0.0%) | 0 (0.0%) |
| 30 to 34 Years | 37 (100.0%) | 0 (0.0%) |
| 35 to 44 Years | 7 (100.0%) | 0 (0.0%) |
| 45 to 54 Years | 3 (100.0%) | 0 (0.0%) |
| 55 to 59 Years | 1 (100.0%) | 0 (0.0%) |
| 60 to 64 Years | 7 (100.0%) | 0 (0.0%) |
| 65 to 74 Years | 37 (78.7%) | 0 (0.0%) |
| 75 Years and over | 30 (37.0%) | 0 (0.0%) |
| Total | 122 (66.7%) | 0 (0.0%) |
Employment Status by Educational Attainment in Midpines
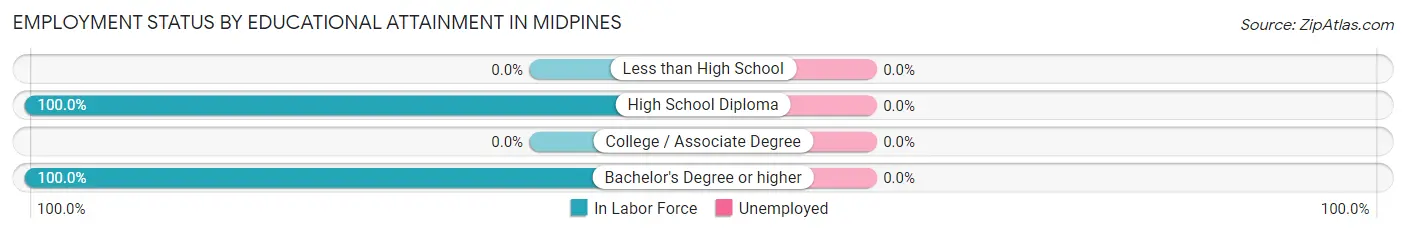
| Educational Attainment | In Labor Force | Unemployed |
| Less than High School | 0 (0.0%) | 0 (0.0%) |
| High School Diploma | 3 (100.0%) | 0 (0.0%) |
| College / Associate Degree | 0 (0.0%) | 0 (0.0%) |
| Bachelor's Degree or higher | 52 (100.0%) | 0 (0.0%) |
| Total | 55 (100.0%) | 0 (0.0%) |
Employment Occupations by Sex in Midpines
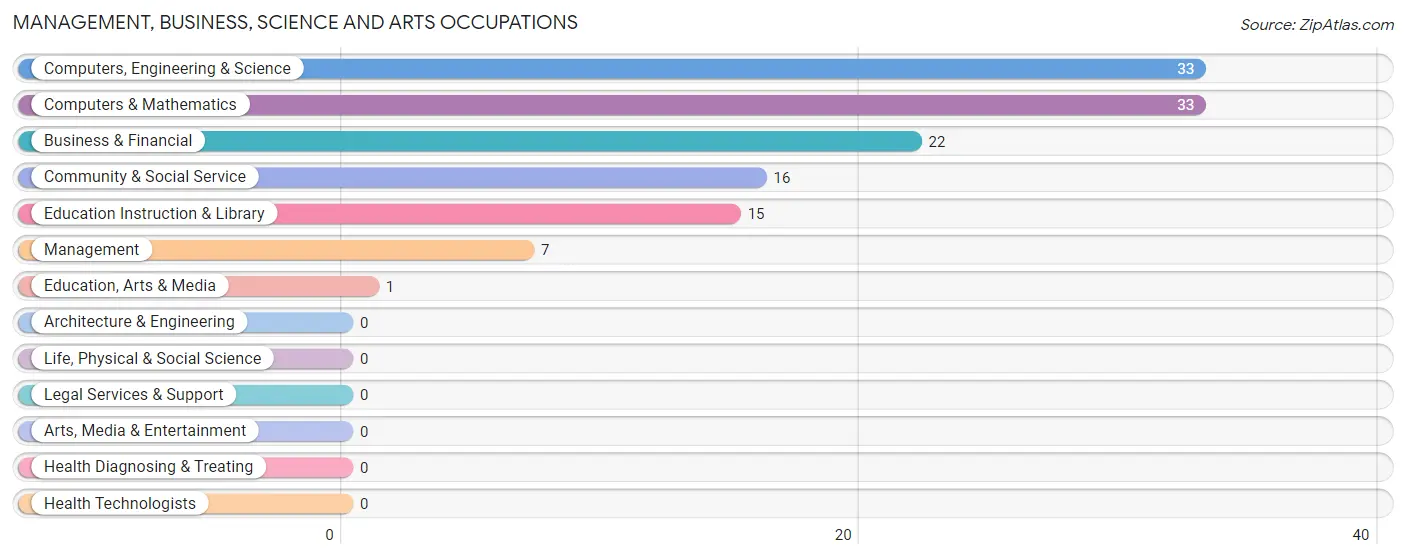
Management, Business, Science and Arts Occupations
The most common Management, Business, Science and Arts occupations in Midpines are Computers, Engineering & Science (33 | 27.1%), Computers & Mathematics (33 | 27.1%), Business & Financial (22 | 18.0%), Community & Social Service (16 | 13.1%), and Education Instruction & Library (15 | 12.3%).
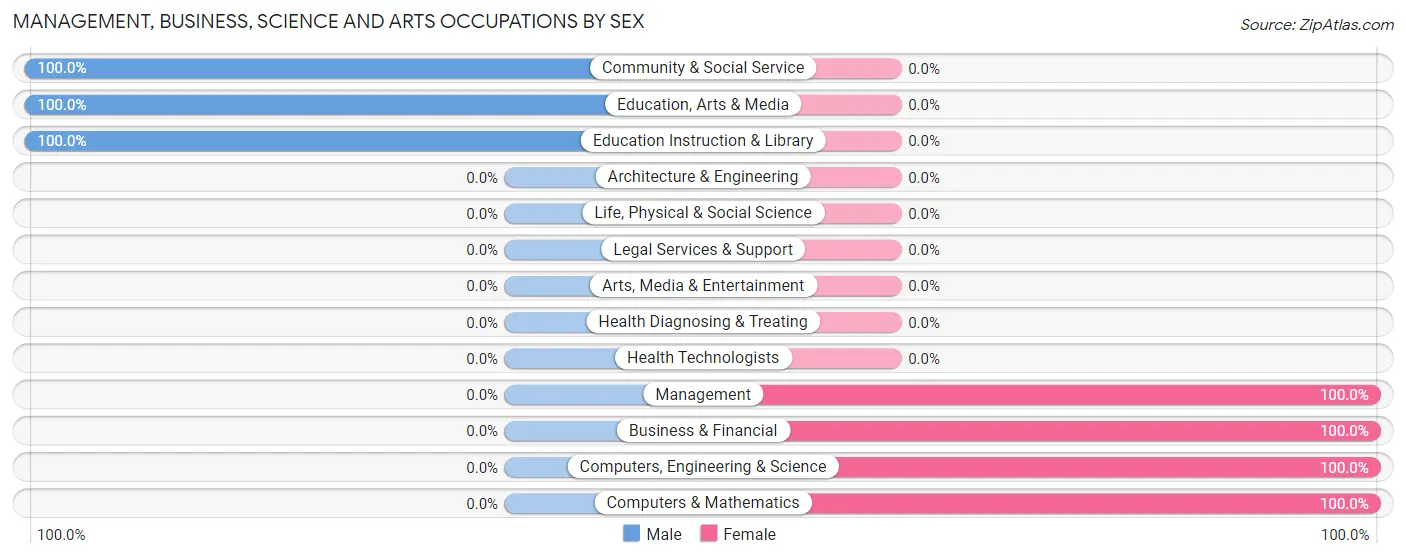
Management, Business, Science and Arts Occupations by Sex
Within the Management, Business, Science and Arts occupations in Midpines, the most male-oriented occupations are Community & Social Service (100.0%), Education, Arts & Media (100.0%), and Education Instruction & Library (100.0%), while the most female-oriented occupations are Management (100.0%), Business & Financial (100.0%), and Computers, Engineering & Science (100.0%).
| Occupation | Male | Female |
| Management | 0 (0.0%) | 7 (100.0%) |
| Business & Financial | 0 (0.0%) | 22 (100.0%) |
| Computers, Engineering & Science | 0 (0.0%) | 33 (100.0%) |
| Computers & Mathematics | 0 (0.0%) | 33 (100.0%) |
| Architecture & Engineering | 0 (0.0%) | 0 (0.0%) |
| Life, Physical & Social Science | 0 (0.0%) | 0 (0.0%) |
| Community & Social Service | 16 (100.0%) | 0 (0.0%) |
| Education, Arts & Media | 1 (100.0%) | 0 (0.0%) |
| Legal Services & Support | 0 (0.0%) | 0 (0.0%) |
| Education Instruction & Library | 15 (100.0%) | 0 (0.0%) |
| Arts, Media & Entertainment | 0 (0.0%) | 0 (0.0%) |
| Health Diagnosing & Treating | 0 (0.0%) | 0 (0.0%) |
| Health Technologists | 0 (0.0%) | 0 (0.0%) |
| Total (Category) | 16 (20.5%) | 62 (79.5%) |
| Total (Overall) | 28 (23.0%) | 94 (77.0%) |
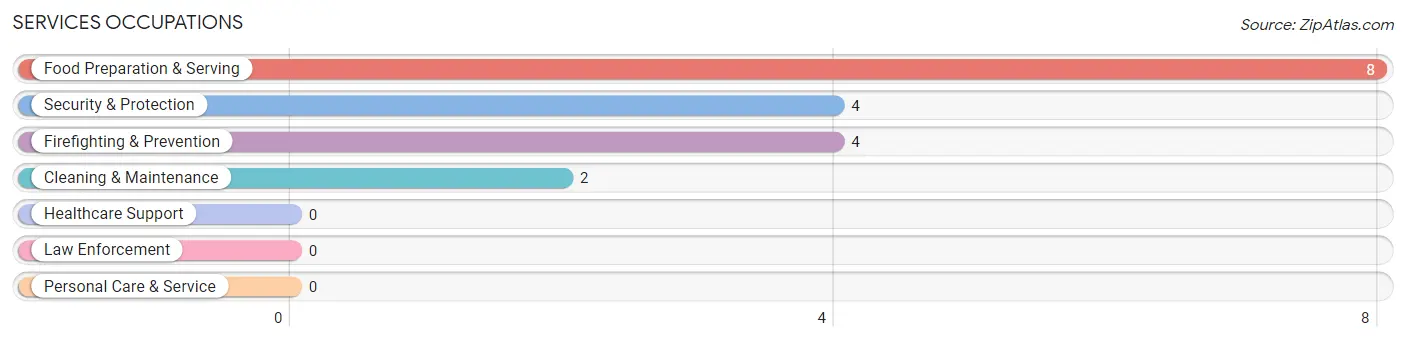
Services Occupations
The most common Services occupations in Midpines are Food Preparation & Serving (8 | 6.6%), Security & Protection (4 | 3.3%), Firefighting & Prevention (4 | 3.3%), and Cleaning & Maintenance (2 | 1.6%).
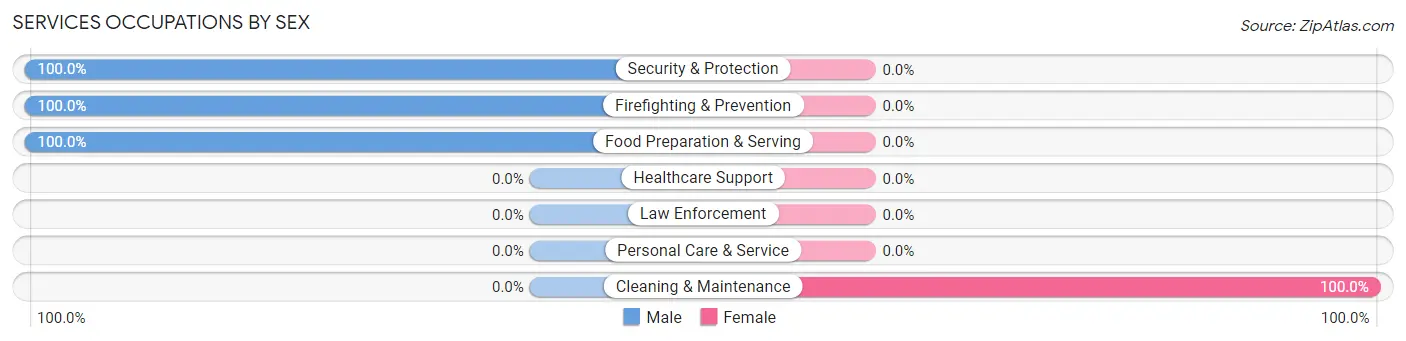
Services Occupations by Sex
| Occupation | Male | Female |
| Healthcare Support | 0 (0.0%) | 0 (0.0%) |
| Security & Protection | 4 (100.0%) | 0 (0.0%) |
| Firefighting & Prevention | 4 (100.0%) | 0 (0.0%) |
| Law Enforcement | 0 (0.0%) | 0 (0.0%) |
| Food Preparation & Serving | 8 (100.0%) | 0 (0.0%) |
| Cleaning & Maintenance | 0 (0.0%) | 2 (100.0%) |
| Personal Care & Service | 0 (0.0%) | 0 (0.0%) |
| Total (Category) | 12 (85.7%) | 2 (14.3%) |
| Total (Overall) | 28 (23.0%) | 94 (77.0%) |
Sales and Office Occupations
The most common Sales and Office occupations in Midpines are , and Office & Administration (30 | 24.6%).
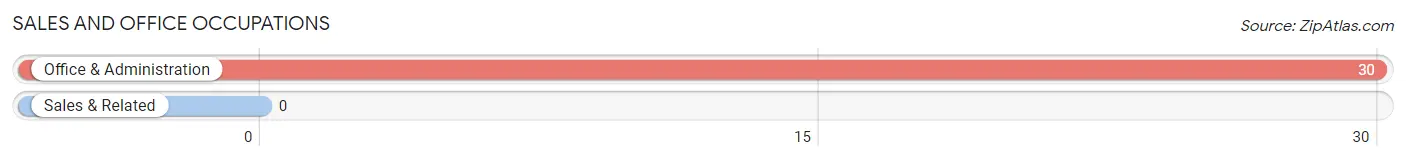
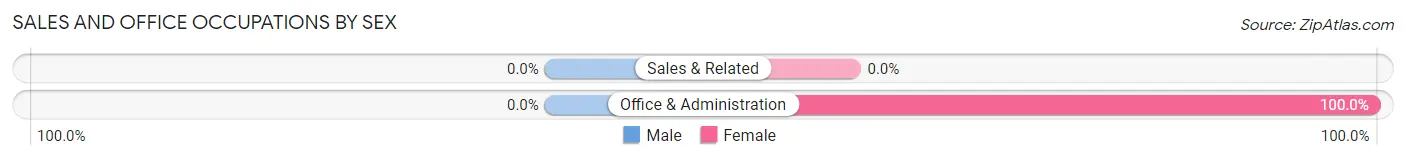
Sales and Office Occupations by Sex
| Occupation | Male | Female |
| Sales & Related | 0 (0.0%) | 0 (0.0%) |
| Office & Administration | 0 (0.0%) | 30 (100.0%) |
| Total (Category) | 0 (0.0%) | 30 (100.0%) |
| Total (Overall) | 28 (23.0%) | 94 (77.0%) |
Natural Resources, Construction and Maintenance Occupations
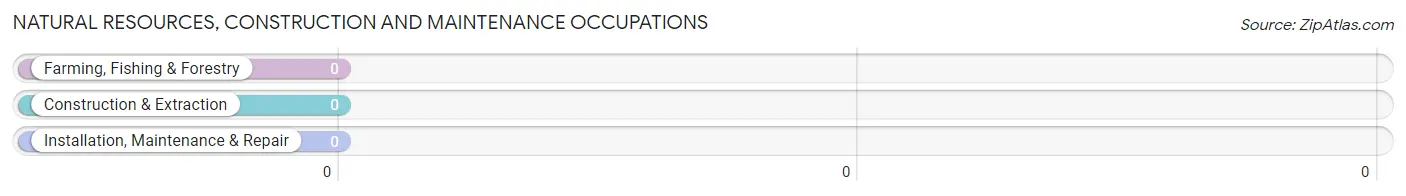
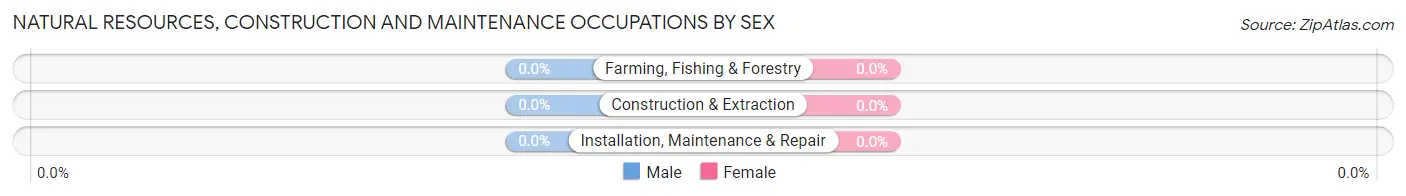
Natural Resources, Construction and Maintenance Occupations by Sex
| Occupation | Male | Female |
| Farming, Fishing & Forestry | 0 (0.0%) | 0 (0.0%) |
| Construction & Extraction | 0 (0.0%) | 0 (0.0%) |
| Installation, Maintenance & Repair | 0 (0.0%) | 0 (0.0%) |
| Total (Category) | 0 (0.0%) | 0 (0.0%) |
| Total (Overall) | 28 (23.0%) | 94 (77.0%) |
Production, Transportation and Moving Occupations
Production, Transportation and Moving Occupations by Sex
| Occupation | Male | Female |
| Production | 0 (0.0%) | 0 (0.0%) |
| Transportation | 0 (0.0%) | 0 (0.0%) |
| Material Moving | 0 (0.0%) | 0 (0.0%) |
| Total (Category) | 0 (0.0%) | 0 (0.0%) |
| Total (Overall) | 28 (23.0%) | 94 (77.0%) |
Employment Industries by Sex in Midpines
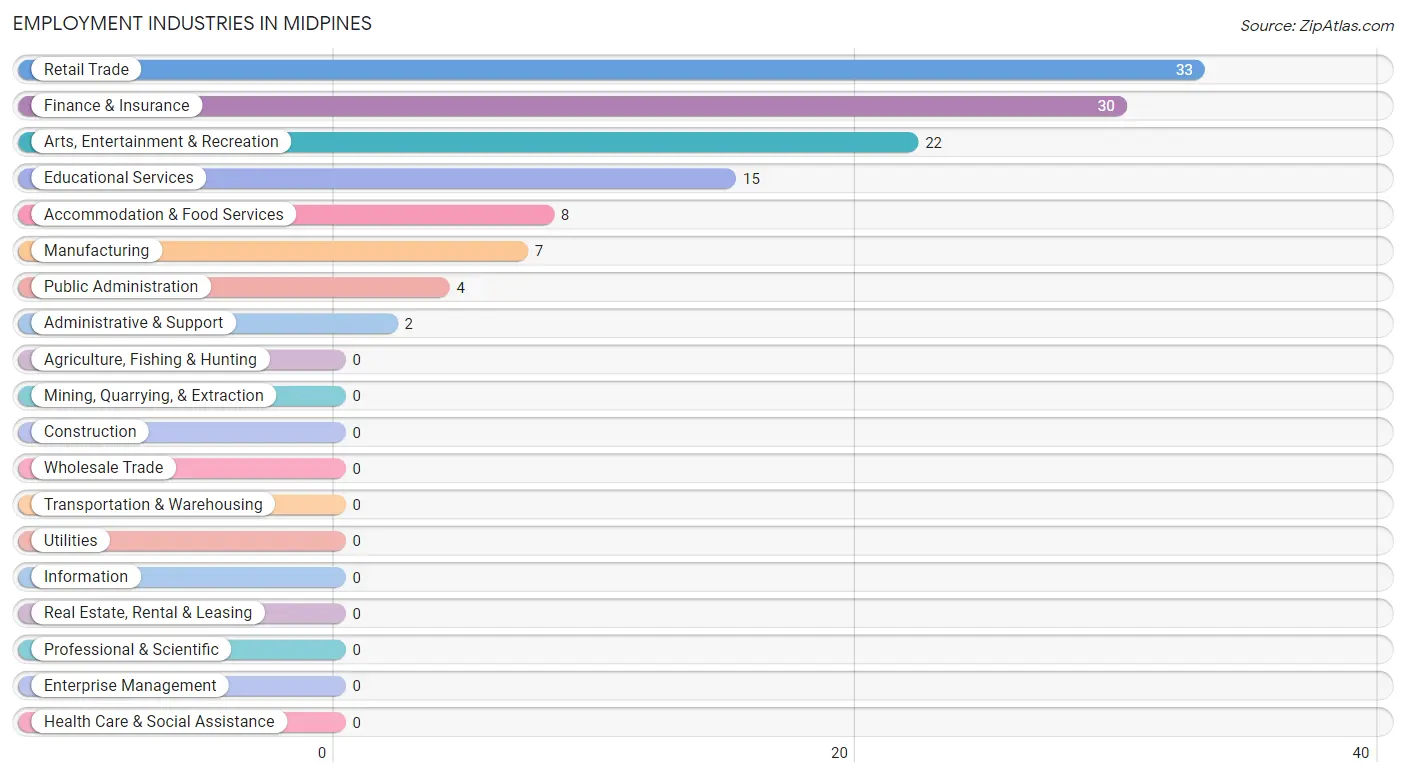
Employment Industries in Midpines
The major employment industries in Midpines include Retail Trade (33 | 27.1%), Finance & Insurance (30 | 24.6%), Arts, Entertainment & Recreation (22 | 18.0%), Educational Services (15 | 12.3%), and Accommodation & Food Services (8 | 6.6%).
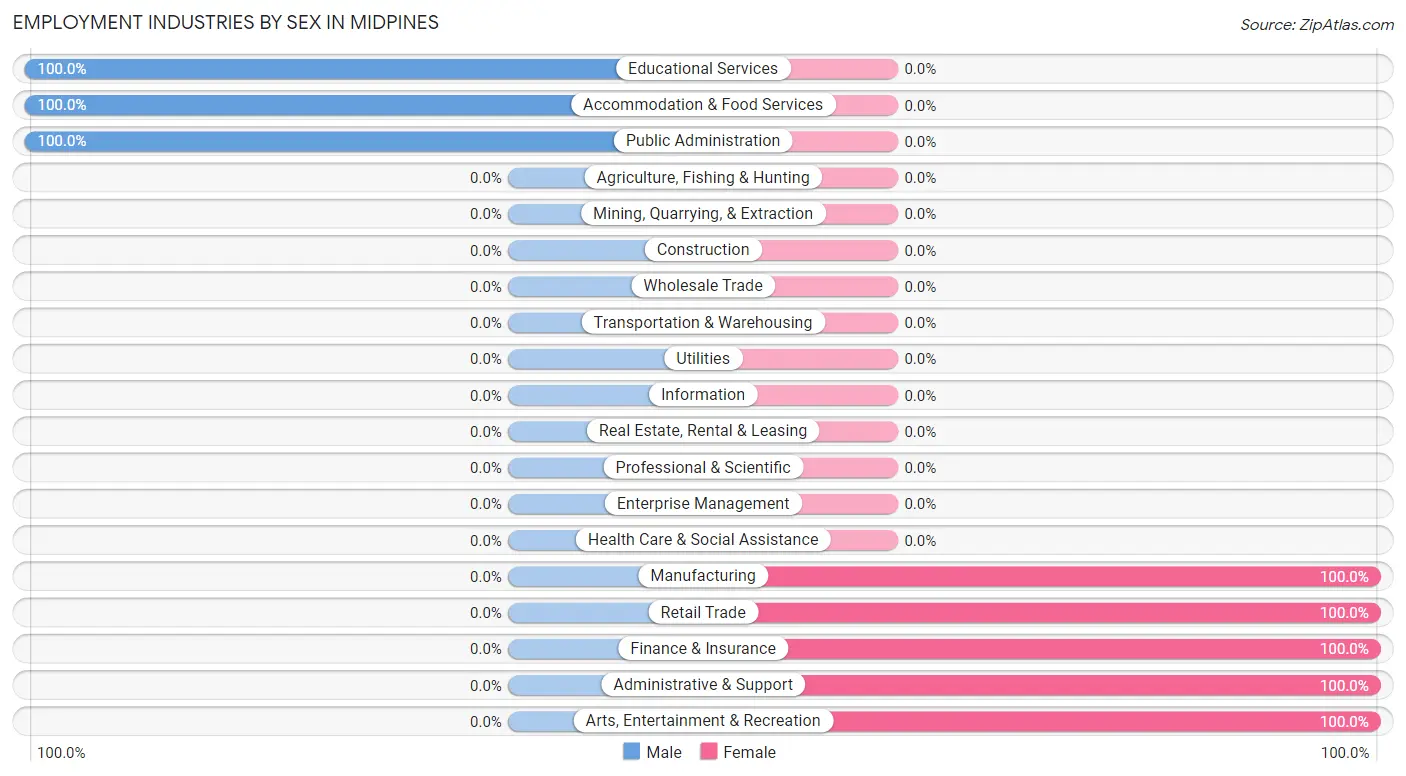
Employment Industries by Sex in Midpines
The Midpines industries that see more men than women are Educational Services (100.0%), Accommodation & Food Services (100.0%), and Public Administration (100.0%), whereas the industries that tend to have a higher number of women are Manufacturing (100.0%), Retail Trade (100.0%), and Finance & Insurance (100.0%).
| Industry | Male | Female |
| Agriculture, Fishing & Hunting | 0 (0.0%) | 0 (0.0%) |
| Mining, Quarrying, & Extraction | 0 (0.0%) | 0 (0.0%) |
| Construction | 0 (0.0%) | 0 (0.0%) |
| Manufacturing | 0 (0.0%) | 7 (100.0%) |
| Wholesale Trade | 0 (0.0%) | 0 (0.0%) |
| Retail Trade | 0 (0.0%) | 33 (100.0%) |
| Transportation & Warehousing | 0 (0.0%) | 0 (0.0%) |
| Utilities | 0 (0.0%) | 0 (0.0%) |
| Information | 0 (0.0%) | 0 (0.0%) |
| Finance & Insurance | 0 (0.0%) | 30 (100.0%) |
| Real Estate, Rental & Leasing | 0 (0.0%) | 0 (0.0%) |
| Professional & Scientific | 0 (0.0%) | 0 (0.0%) |
| Enterprise Management | 0 (0.0%) | 0 (0.0%) |
| Administrative & Support | 0 (0.0%) | 2 (100.0%) |
| Educational Services | 15 (100.0%) | 0 (0.0%) |
| Health Care & Social Assistance | 0 (0.0%) | 0 (0.0%) |
| Arts, Entertainment & Recreation | 0 (0.0%) | 22 (100.0%) |
| Accommodation & Food Services | 8 (100.0%) | 0 (0.0%) |
| Public Administration | 4 (100.0%) | 0 (0.0%) |
| Total | 28 (23.0%) | 94 (77.0%) |
Education in Midpines
School Enrollment in Midpines
| School Level | # Students | % Students |
| Nursery / Preschool | 0 | 0.0% |
| Kindergarten | 0 | 0.0% |
| Elementary School | 0 | 0.0% |
| Middle School | 0 | 0.0% |
| High School | 0 | 0.0% |
| College / Undergraduate | 0 | 0.0% |
| Graduate / Professional | 0 | 0.0% |
| Total | 0 | 0.0% |
School Enrollment by Age by Funding Source in Midpines
| Age Bracket | Public School | Private School |
| 3 to 4 Year Olds | 0 (0.0%) | 0 (0.0%) |
| 5 to 9 Year Old | 0 (0.0%) | 0 (0.0%) |
| 10 to 14 Year Olds | 0 (0.0%) | 0 (0.0%) |
| 15 to 17 Year Olds | 0 (0.0%) | 0 (0.0%) |
| 18 to 19 Year Olds | 0 (0.0%) | 0 (0.0%) |
| 20 to 24 Year Olds | 0 (0.0%) | 0 (0.0%) |
| 25 to 34 Year Olds | 0 (0.0%) | 0 (0.0%) |
| 35 Years and over | 0 (0.0%) | 0 (0.0%) |
| Total | 0 (0.0%) | 0 (0.0%) |
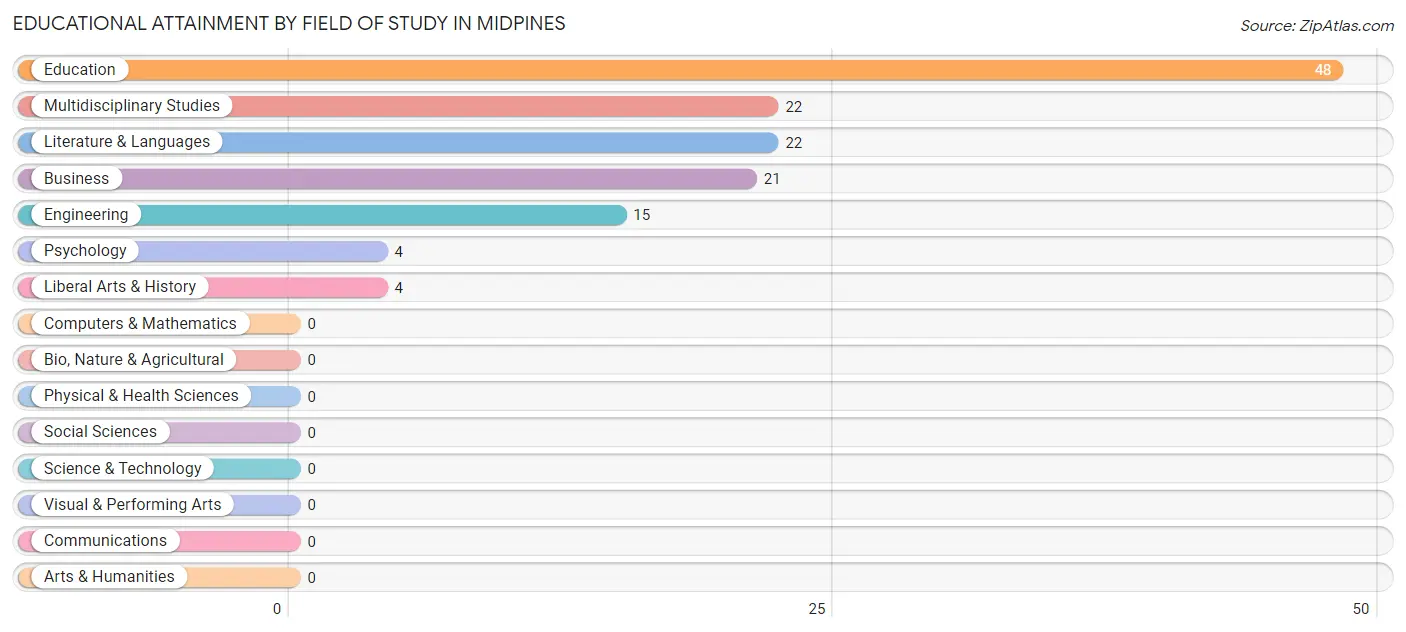
Educational Attainment by Field of Study in Midpines
Education (48 | 35.3%), multidisciplinary studies (22 | 16.2%), literature & languages (22 | 16.2%), business (21 | 15.4%), and engineering (15 | 11.0%) are the most common fields of study among 136 individuals in Midpines who have obtained a bachelor's degree or higher.
| Field of Study | # Graduates | % Graduates |
| Computers & Mathematics | 0 | 0.0% |
| Bio, Nature & Agricultural | 0 | 0.0% |
| Physical & Health Sciences | 0 | 0.0% |
| Psychology | 4 | 2.9% |
| Social Sciences | 0 | 0.0% |
| Engineering | 15 | 11.0% |
| Multidisciplinary Studies | 22 | 16.2% |
| Science & Technology | 0 | 0.0% |
| Business | 21 | 15.4% |
| Education | 48 | 35.3% |
| Literature & Languages | 22 | 16.2% |
| Liberal Arts & History | 4 | 2.9% |
| Visual & Performing Arts | 0 | 0.0% |
| Communications | 0 | 0.0% |
| Arts & Humanities | 0 | 0.0% |
| Total | 136 | 100.0% |
Transportation & Commute in Midpines
Vehicle Availability by Sex in Midpines
The most prevalent vehicle ownership categories in Midpines are males with 1 vehicle (18, accounting for 81.8%) and females with 1 vehicle (85, making up 19.6%).
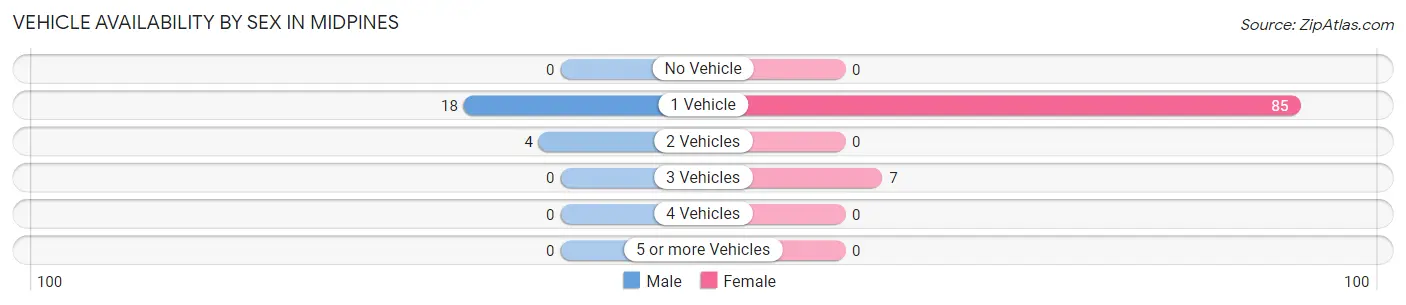
| Vehicles Available | Male | Female |
| No Vehicle | 0 (0.0%) | 0 (0.0%) |
| 1 Vehicle | 18 (81.8%) | 85 (92.4%) |
| 2 Vehicles | 4 (18.2%) | 0 (0.0%) |
| 3 Vehicles | 0 (0.0%) | 7 (7.6%) |
| 4 Vehicles | 0 (0.0%) | 0 (0.0%) |
| 5 or more Vehicles | 0 (0.0%) | 0 (0.0%) |
| Total | 22 (100.0%) | 92 (100.0%) |
Commute Time in Midpines
The most frequently occuring commute durations in Midpines are 10 to 14 minutes (38 commuters, 55.1%), 30 to 34 minutes (15 commuters, 21.7%), and 15 to 19 minutes (10 commuters, 14.5%).
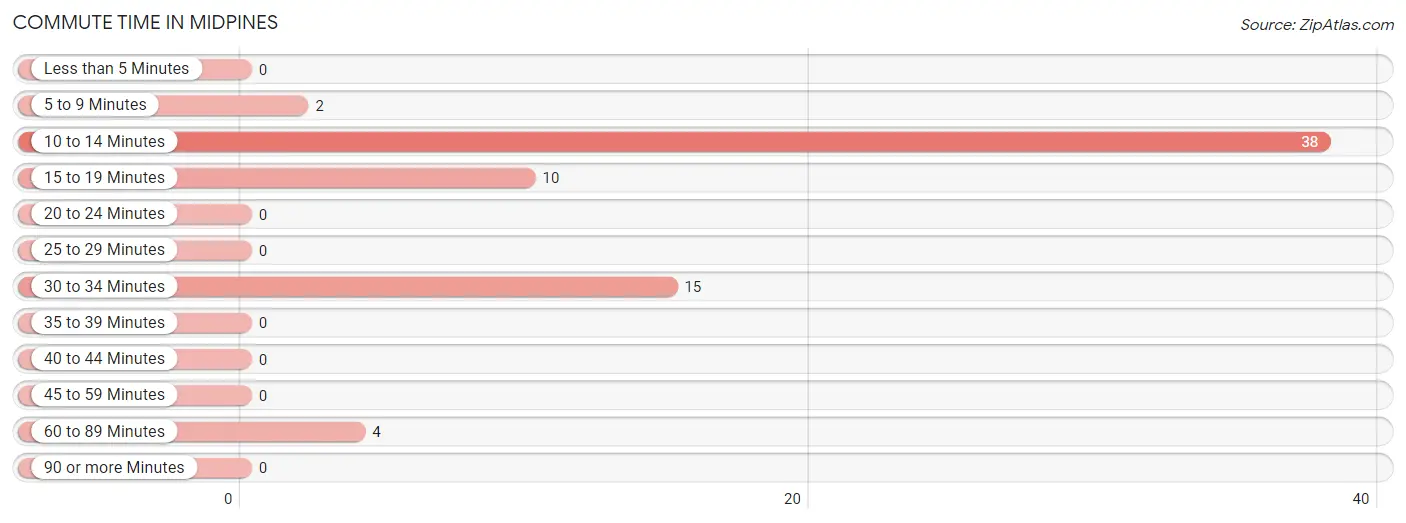
| Commute Time | # Commuters | % Commuters |
| Less than 5 Minutes | 0 | 0.0% |
| 5 to 9 Minutes | 2 | 2.9% |
| 10 to 14 Minutes | 38 | 55.1% |
| 15 to 19 Minutes | 10 | 14.5% |
| 20 to 24 Minutes | 0 | 0.0% |
| 25 to 29 Minutes | 0 | 0.0% |
| 30 to 34 Minutes | 15 | 21.7% |
| 35 to 39 Minutes | 0 | 0.0% |
| 40 to 44 Minutes | 0 | 0.0% |
| 45 to 59 Minutes | 0 | 0.0% |
| 60 to 89 Minutes | 4 | 5.8% |
| 90 or more Minutes | 0 | 0.0% |
Commute Time by Sex in Midpines
The most common commute times in Midpines are 30 to 34 minutes (15 commuters, 55.6%) for males and 10 to 14 minutes (33 commuters, 78.6%) for females.
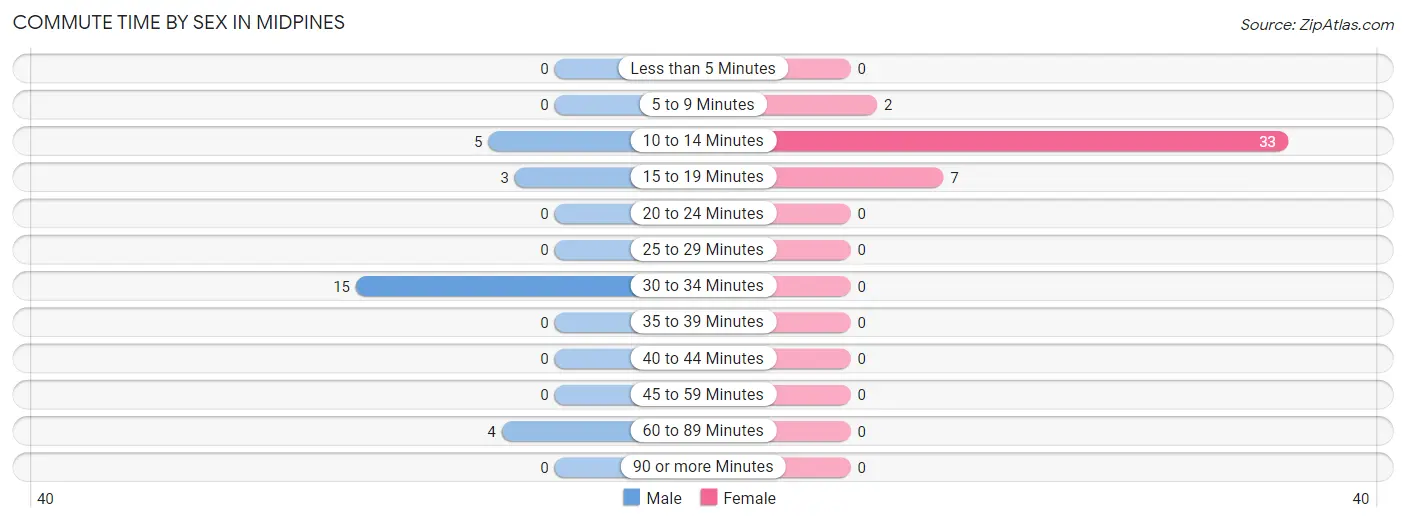
| Commute Time | Male | Female |
| Less than 5 Minutes | 0 (0.0%) | 0 (0.0%) |
| 5 to 9 Minutes | 0 (0.0%) | 2 (4.8%) |
| 10 to 14 Minutes | 5 (18.5%) | 33 (78.6%) |
| 15 to 19 Minutes | 3 (11.1%) | 7 (16.7%) |
| 20 to 24 Minutes | 0 (0.0%) | 0 (0.0%) |
| 25 to 29 Minutes | 0 (0.0%) | 0 (0.0%) |
| 30 to 34 Minutes | 15 (55.6%) | 0 (0.0%) |
| 35 to 39 Minutes | 0 (0.0%) | 0 (0.0%) |
| 40 to 44 Minutes | 0 (0.0%) | 0 (0.0%) |
| 45 to 59 Minutes | 0 (0.0%) | 0 (0.0%) |
| 60 to 89 Minutes | 4 (14.8%) | 0 (0.0%) |
| 90 or more Minutes | 0 (0.0%) | 0 (0.0%) |
Time of Departure to Work by Sex in Midpines
The most frequent times of departure to work in Midpines are 6:30 AM to 6:59 AM (18, 66.7%) for males and 5:00 AM to 5:29 AM (33, 78.6%) for females.
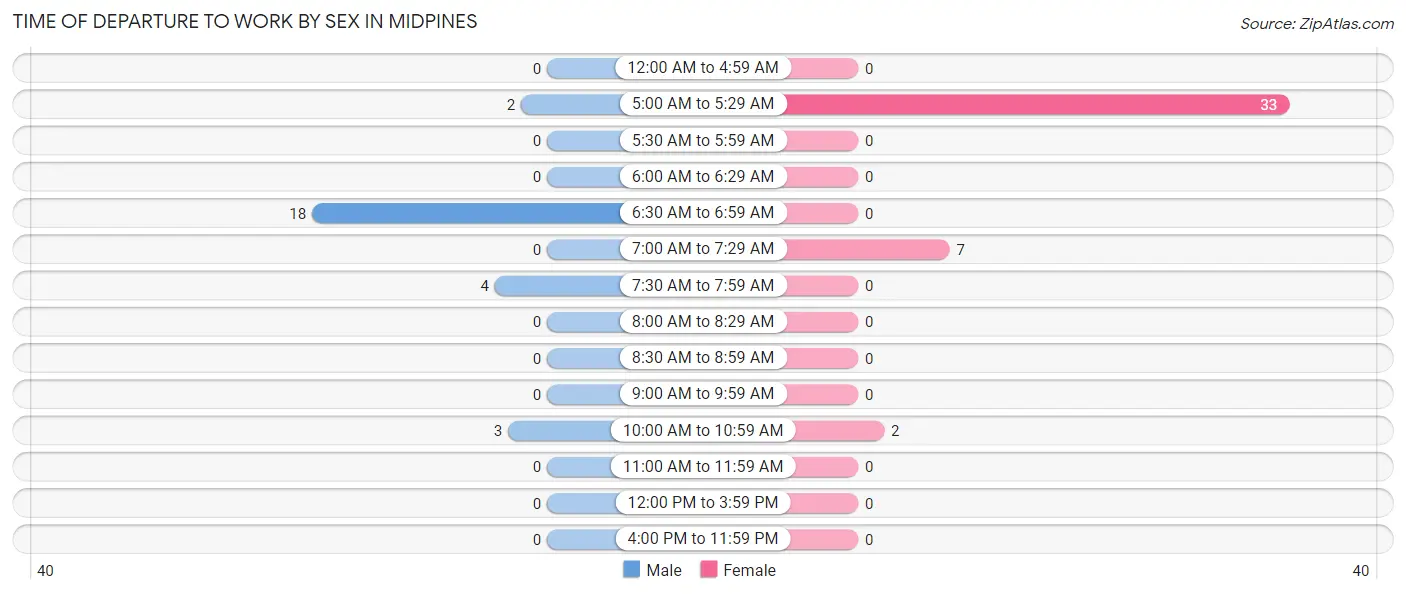
| Time of Departure | Male | Female |
| 12:00 AM to 4:59 AM | 0 (0.0%) | 0 (0.0%) |
| 5:00 AM to 5:29 AM | 2 (7.4%) | 33 (78.6%) |
| 5:30 AM to 5:59 AM | 0 (0.0%) | 0 (0.0%) |
| 6:00 AM to 6:29 AM | 0 (0.0%) | 0 (0.0%) |
| 6:30 AM to 6:59 AM | 18 (66.7%) | 0 (0.0%) |
| 7:00 AM to 7:29 AM | 0 (0.0%) | 7 (16.7%) |
| 7:30 AM to 7:59 AM | 4 (14.8%) | 0 (0.0%) |
| 8:00 AM to 8:29 AM | 0 (0.0%) | 0 (0.0%) |
| 8:30 AM to 8:59 AM | 0 (0.0%) | 0 (0.0%) |
| 9:00 AM to 9:59 AM | 0 (0.0%) | 0 (0.0%) |
| 10:00 AM to 10:59 AM | 3 (11.1%) | 2 (4.8%) |
| 11:00 AM to 11:59 AM | 0 (0.0%) | 0 (0.0%) |
| 12:00 PM to 3:59 PM | 0 (0.0%) | 0 (0.0%) |
| 4:00 PM to 11:59 PM | 0 (0.0%) | 0 (0.0%) |
| Total | 27 (100.0%) | 42 (100.0%) |
Housing Occupancy in Midpines
Occupancy by Ownership in Midpines
Of the total 146 dwellings in Midpines, owner-occupied units account for 110 (75.3%), while renter-occupied units make up 36 (24.7%).
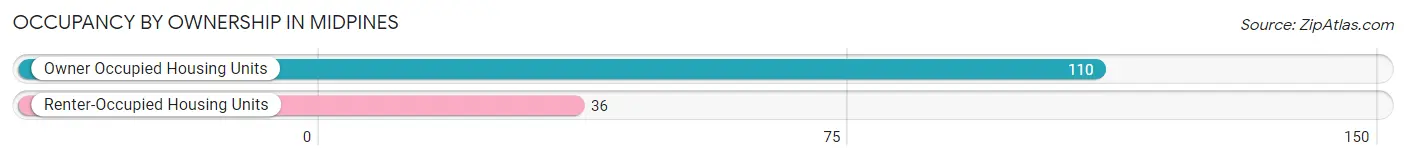
| Occupancy | # Housing Units | % Housing Units |
| Owner Occupied Housing Units | 110 | 75.3% |
| Renter-Occupied Housing Units | 36 | 24.7% |
| Total Occupied Housing Units | 146 | 100.0% |
Occupancy by Household Size in Midpines
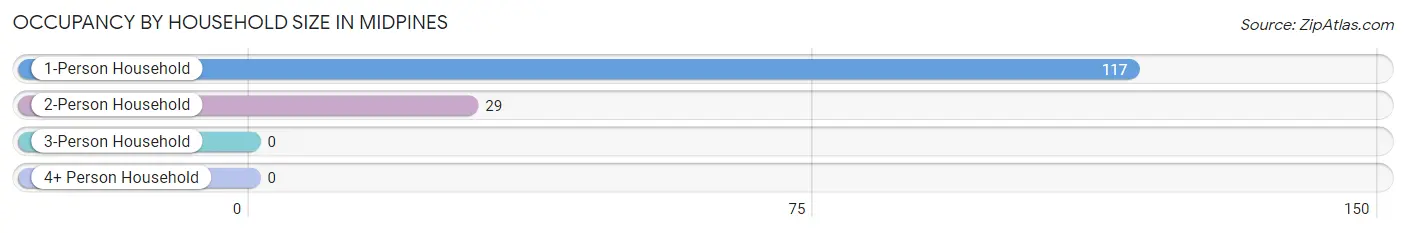
| Household Size | # Housing Units | % Housing Units |
| 1-Person Household | 117 | 80.1% |
| 2-Person Household | 29 | 19.9% |
| 3-Person Household | 0 | 0.0% |
| 4+ Person Household | 0 | 0.0% |
| Total Housing Units | 146 | 100.0% |
Occupancy by Ownership by Household Size in Midpines
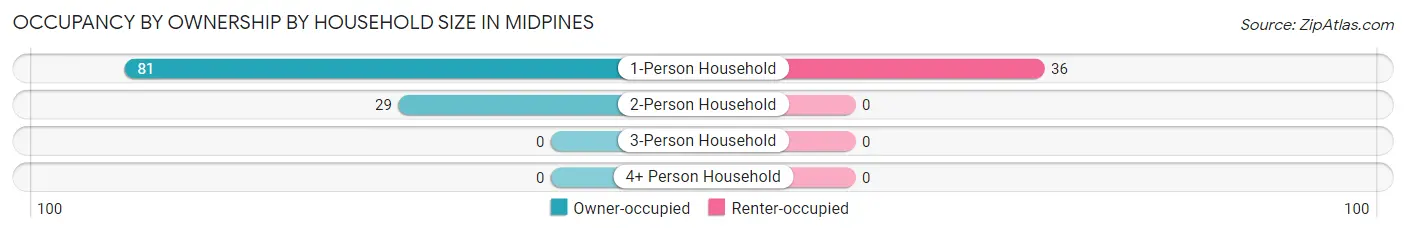
| Household Size | Owner-occupied | Renter-occupied |
| 1-Person Household | 81 (69.2%) | 36 (30.8%) |
| 2-Person Household | 29 (100.0%) | 0 (0.0%) |
| 3-Person Household | 0 (0.0%) | 0 (0.0%) |
| 4+ Person Household | 0 (0.0%) | 0 (0.0%) |
| Total Housing Units | 110 (75.3%) | 36 (24.7%) |
Occupancy by Educational Attainment in Midpines
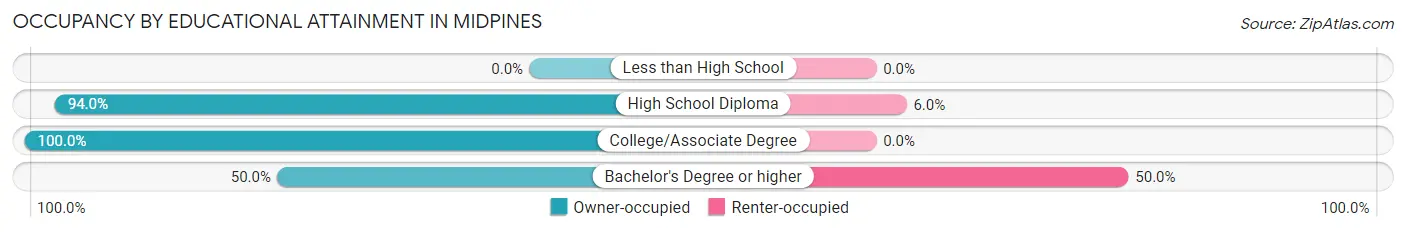
| Household Size | Owner-occupied | Renter-occupied |
| Less than High School | 0 (0.0%) | 0 (0.0%) |
| High School Diploma | 47 (94.0%) | 3 (6.0%) |
| College/Associate Degree | 30 (100.0%) | 0 (0.0%) |
| Bachelor's Degree or higher | 33 (50.0%) | 33 (50.0%) |
Occupancy by Age of Householder in Midpines
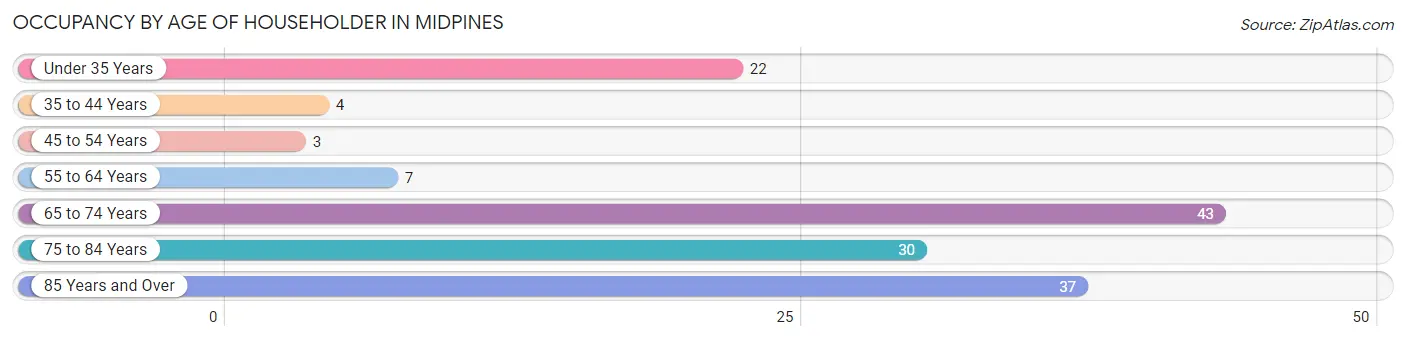
| Age Bracket | # Households | % Households |
| Under 35 Years | 22 | 15.1% |
| 35 to 44 Years | 4 | 2.7% |
| 45 to 54 Years | 3 | 2.1% |
| 55 to 64 Years | 7 | 4.8% |
| 65 to 74 Years | 43 | 29.4% |
| 75 to 84 Years | 30 | 20.5% |
| 85 Years and Over | 37 | 25.3% |
| Total | 146 | 100.0% |
Housing Finances in Midpines
Median Income by Occupancy in Midpines
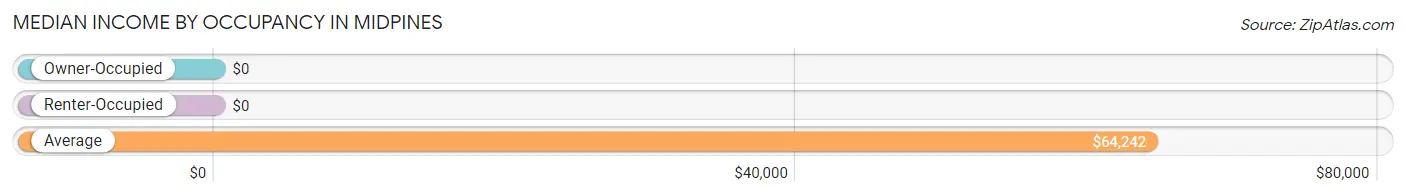
| Occupancy Type | # Households | Median Income |
| Owner-Occupied | 110 (75.3%) | $0 |
| Renter-Occupied | 36 (24.7%) | $0 |
| Average | 146 (100.0%) | $64,242 |
Occupancy by Householder Income Bracket in Midpines
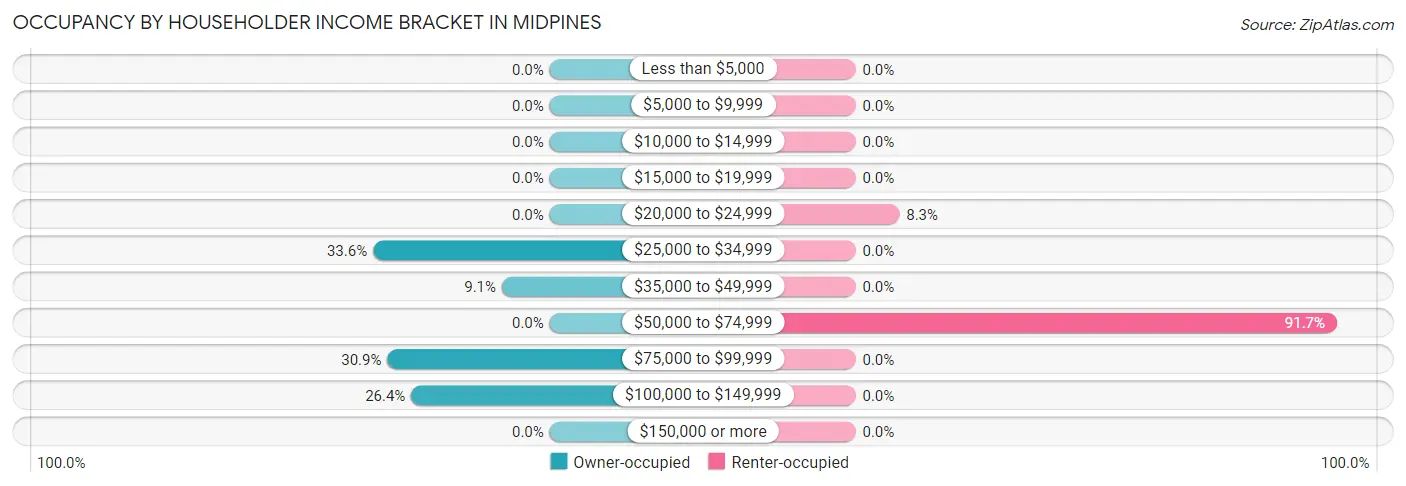
| Income Bracket | Owner-occupied | Renter-occupied |
| Less than $5,000 | 0 (0.0%) | 0 (0.0%) |
| $5,000 to $9,999 | 0 (0.0%) | 0 (0.0%) |
| $10,000 to $14,999 | 0 (0.0%) | 0 (0.0%) |
| $15,000 to $19,999 | 0 (0.0%) | 0 (0.0%) |
| $20,000 to $24,999 | 0 (0.0%) | 3 (8.3%) |
| $25,000 to $34,999 | 37 (33.6%) | 0 (0.0%) |
| $35,000 to $49,999 | 10 (9.1%) | 0 (0.0%) |
| $50,000 to $74,999 | 0 (0.0%) | 33 (91.7%) |
| $75,000 to $99,999 | 34 (30.9%) | 0 (0.0%) |
| $100,000 to $149,999 | 29 (26.4%) | 0 (0.0%) |
| $150,000 or more | 0 (0.0%) | 0 (0.0%) |
| Total | 110 (100.0%) | 36 (100.0%) |
Monthly Housing Cost Tiers in Midpines
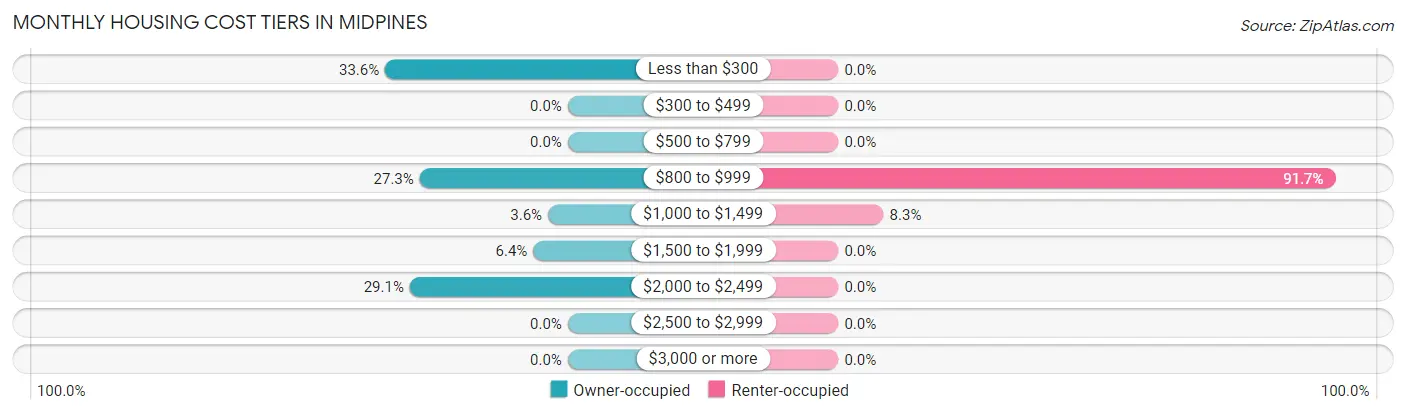
| Monthly Cost | Owner-occupied | Renter-occupied |
| Less than $300 | 37 (33.6%) | 0 (0.0%) |
| $300 to $499 | 0 (0.0%) | 0 (0.0%) |
| $500 to $799 | 0 (0.0%) | 0 (0.0%) |
| $800 to $999 | 30 (27.3%) | 33 (91.7%) |
| $1,000 to $1,499 | 4 (3.6%) | 3 (8.3%) |
| $1,500 to $1,999 | 7 (6.4%) | 0 (0.0%) |
| $2,000 to $2,499 | 32 (29.1%) | 0 (0.0%) |
| $2,500 to $2,999 | 0 (0.0%) | 0 (0.0%) |
| $3,000 or more | 0 (0.0%) | 0 (0.0%) |
| Total | 110 (100.0%) | 36 (100.0%) |
Physical Housing Characteristics in Midpines
Housing Structures in Midpines
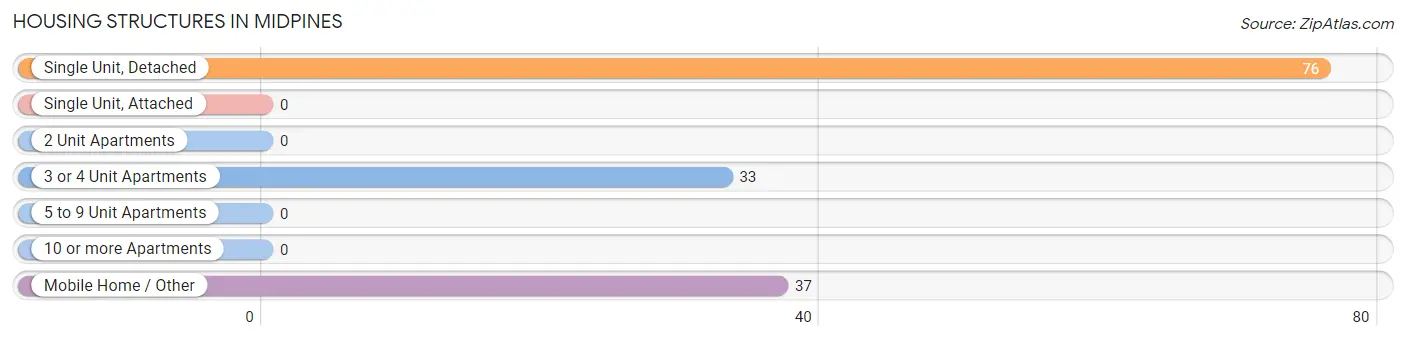
| Structure Type | # Housing Units | % Housing Units |
| Single Unit, Detached | 76 | 52.0% |
| Single Unit, Attached | 0 | 0.0% |
| 2 Unit Apartments | 0 | 0.0% |
| 3 or 4 Unit Apartments | 33 | 22.6% |
| 5 to 9 Unit Apartments | 0 | 0.0% |
| 10 or more Apartments | 0 | 0.0% |
| Mobile Home / Other | 37 | 25.3% |
| Total | 146 | 100.0% |
Housing Structures by Occupancy in Midpines
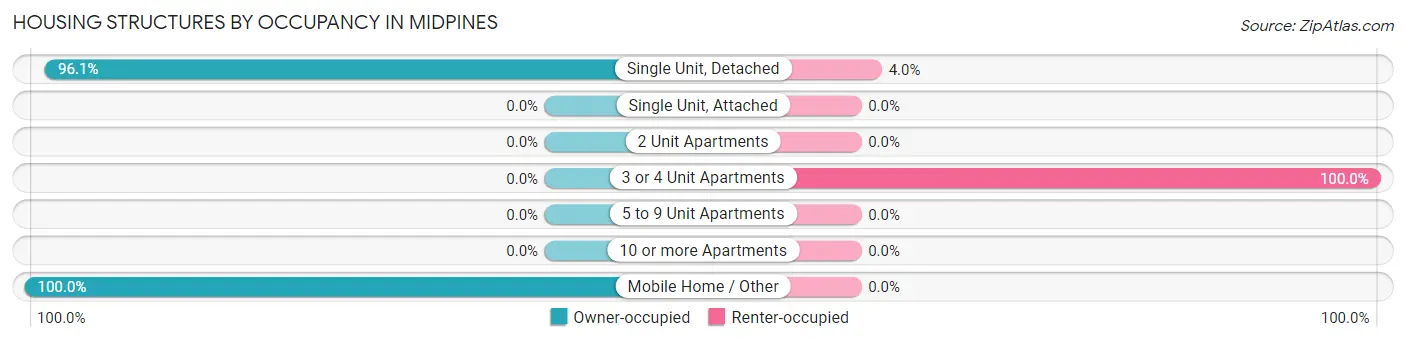
| Structure Type | Owner-occupied | Renter-occupied |
| Single Unit, Detached | 73 (96.1%) | 3 (4.0%) |
| Single Unit, Attached | 0 (0.0%) | 0 (0.0%) |
| 2 Unit Apartments | 0 (0.0%) | 0 (0.0%) |
| 3 or 4 Unit Apartments | 0 (0.0%) | 33 (100.0%) |
| 5 to 9 Unit Apartments | 0 (0.0%) | 0 (0.0%) |
| 10 or more Apartments | 0 (0.0%) | 0 (0.0%) |
| Mobile Home / Other | 37 (100.0%) | 0 (0.0%) |
| Total | 110 (75.3%) | 36 (24.7%) |
Housing Structures by Number of Rooms in Midpines
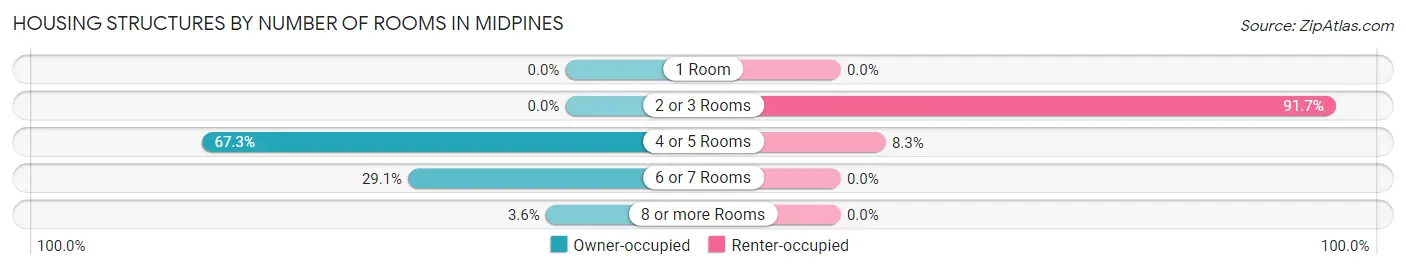
| Number of Rooms | Owner-occupied | Renter-occupied |
| 1 Room | 0 (0.0%) | 0 (0.0%) |
| 2 or 3 Rooms | 0 (0.0%) | 33 (91.7%) |
| 4 or 5 Rooms | 74 (67.3%) | 3 (8.3%) |
| 6 or 7 Rooms | 32 (29.1%) | 0 (0.0%) |
| 8 or more Rooms | 4 (3.6%) | 0 (0.0%) |
| Total | 110 (100.0%) | 36 (100.0%) |
Housing Structure by Heating Type in Midpines
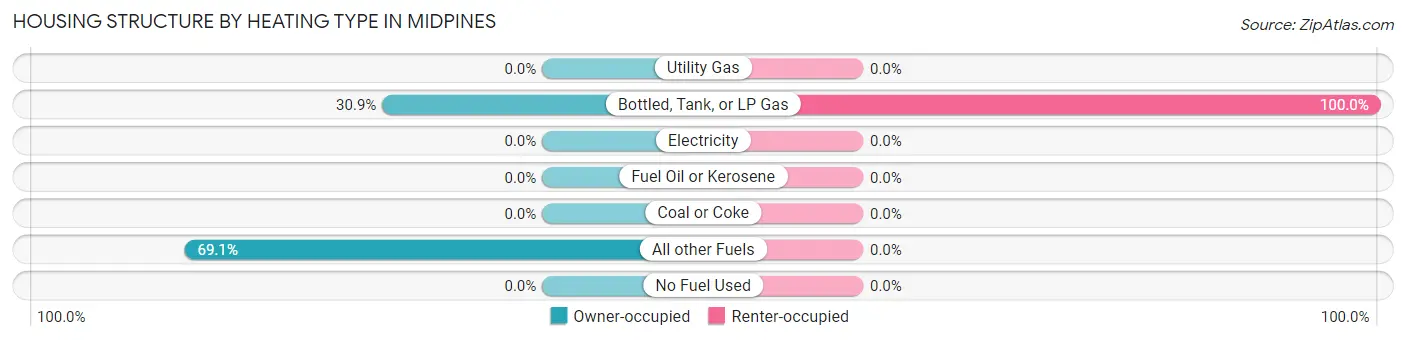
| Heating Type | Owner-occupied | Renter-occupied |
| Utility Gas | 0 (0.0%) | 0 (0.0%) |
| Bottled, Tank, or LP Gas | 34 (30.9%) | 36 (100.0%) |
| Electricity | 0 (0.0%) | 0 (0.0%) |
| Fuel Oil or Kerosene | 0 (0.0%) | 0 (0.0%) |
| Coal or Coke | 0 (0.0%) | 0 (0.0%) |
| All other Fuels | 76 (69.1%) | 0 (0.0%) |
| No Fuel Used | 0 (0.0%) | 0 (0.0%) |
| Total | 110 (100.0%) | 36 (100.0%) |
Household Vehicle Usage in Midpines
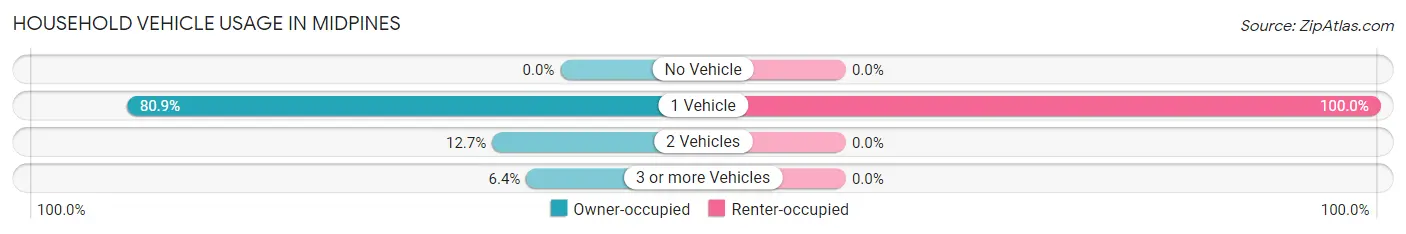
| Vehicles per Household | Owner-occupied | Renter-occupied |
| No Vehicle | 0 (0.0%) | 0 (0.0%) |
| 1 Vehicle | 89 (80.9%) | 36 (100.0%) |
| 2 Vehicles | 14 (12.7%) | 0 (0.0%) |
| 3 or more Vehicles | 7 (6.4%) | 0 (0.0%) |
| Total | 110 (100.0%) | 36 (100.0%) |
Real Estate & Mortgages in Midpines
Real Estate and Mortgage Overview in Midpines
| Characteristic | Without Mortgage | With Mortgage |
| Housing Units | 67 | 43 |
| Median Property Value | - | - |
| Median Household Income | - | - |
| Monthly Housing Costs | - | - |
| Real Estate Taxes | - | - |
Property Value by Mortgage Status in Midpines
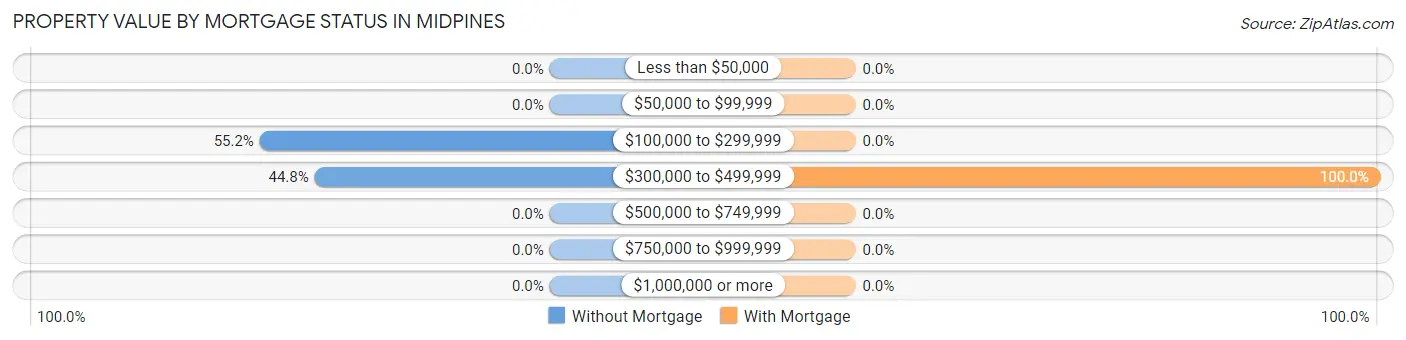
| Property Value | Without Mortgage | With Mortgage |
| Less than $50,000 | 0 (0.0%) | 0 (0.0%) |
| $50,000 to $99,999 | 0 (0.0%) | 0 (0.0%) |
| $100,000 to $299,999 | 37 (55.2%) | 0 (0.0%) |
| $300,000 to $499,999 | 30 (44.8%) | 43 (100.0%) |
| $500,000 to $749,999 | 0 (0.0%) | 0 (0.0%) |
| $750,000 to $999,999 | 0 (0.0%) | 0 (0.0%) |
| $1,000,000 or more | 0 (0.0%) | 0 (0.0%) |
| Total | 67 (100.0%) | 43 (100.0%) |
Household Income by Mortgage Status in Midpines
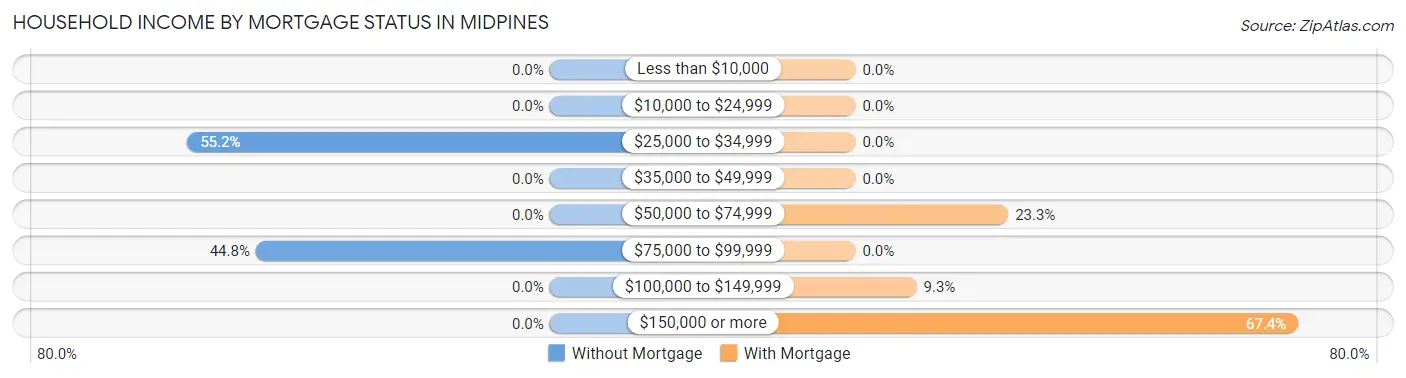
| Household Income | Without Mortgage | With Mortgage |
| Less than $10,000 | 0 (0.0%) | 0 (0.0%) |
| $10,000 to $24,999 | 0 (0.0%) | 0 (0.0%) |
| $25,000 to $34,999 | 37 (55.2%) | 0 (0.0%) |
| $35,000 to $49,999 | 0 (0.0%) | 0 (0.0%) |
| $50,000 to $74,999 | 0 (0.0%) | 10 (23.3%) |
| $75,000 to $99,999 | 30 (44.8%) | 0 (0.0%) |
| $100,000 to $149,999 | 0 (0.0%) | 4 (9.3%) |
| $150,000 or more | 0 (0.0%) | 29 (67.4%) |
| Total | 67 (100.0%) | 43 (100.0%) |
Property Value to Household Income Ratio in Midpines
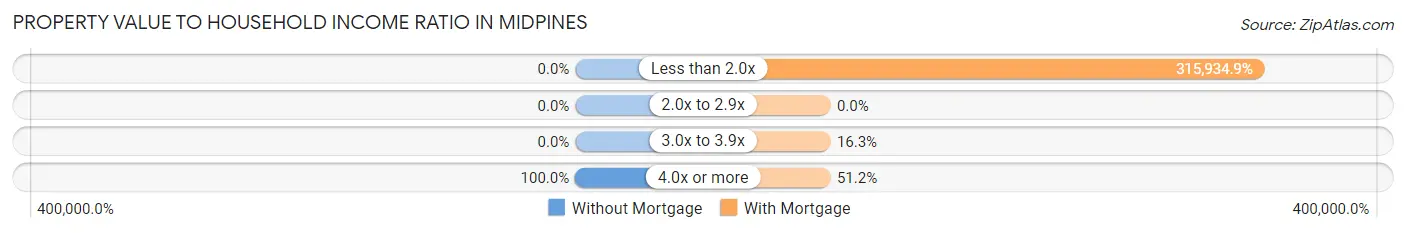
| Value-to-Income Ratio | Without Mortgage | With Mortgage |
| Less than 2.0x | 0 (0.0%) | 135,852 (315,934.9%) |
| 2.0x to 2.9x | 0 (0.0%) | 0 (0.0%) |
| 3.0x to 3.9x | 0 (0.0%) | 7 (16.3%) |
| 4.0x or more | 67 (100.0%) | 22 (51.2%) |
| Total | 67 (100.0%) | 43 (100.0%) |
Real Estate Taxes by Mortgage Status in Midpines
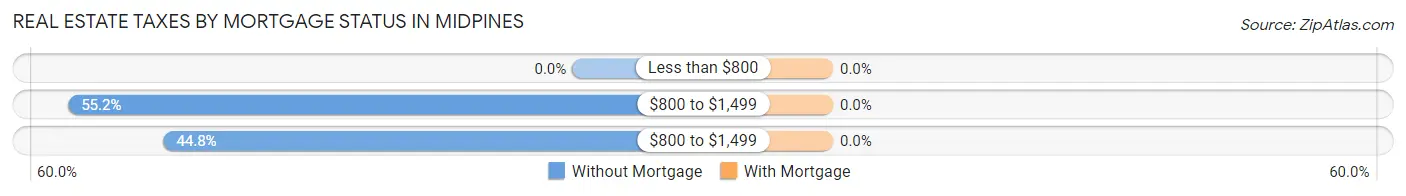
| Property Taxes | Without Mortgage | With Mortgage |
| Less than $800 | 0 (0.0%) | 0 (0.0%) |
| $800 to $1,499 | 37 (55.2%) | 0 (0.0%) |
| $800 to $1,499 | 30 (44.8%) | 0 (0.0%) |
| Total | 67 (100.0%) | 43 (100.0%) |
Health & Disability in Midpines
Health Insurance Coverage by Age in Midpines
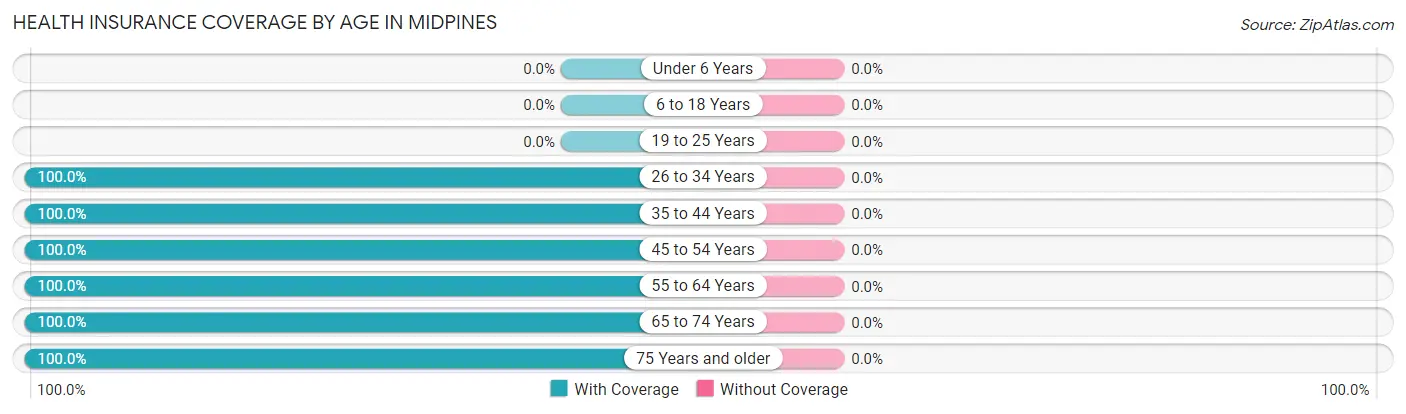
| Age Bracket | With Coverage | Without Coverage |
| Under 6 Years | 0 (0.0%) | 0 (0.0%) |
| 6 to 18 Years | 0 (0.0%) | 0 (0.0%) |
| 19 to 25 Years | 0 (0.0%) | 0 (0.0%) |
| 26 to 34 Years | 37 (100.0%) | 0 (0.0%) |
| 35 to 44 Years | 7 (100.0%) | 0 (0.0%) |
| 45 to 54 Years | 3 (100.0%) | 0 (0.0%) |
| 55 to 64 Years | 8 (100.0%) | 0 (0.0%) |
| 65 to 74 Years | 47 (100.0%) | 0 (0.0%) |
| 75 Years and older | 81 (100.0%) | 0 (0.0%) |
| Total | 183 (100.0%) | 0 (0.0%) |
Health Insurance Coverage by Citizenship Status in Midpines
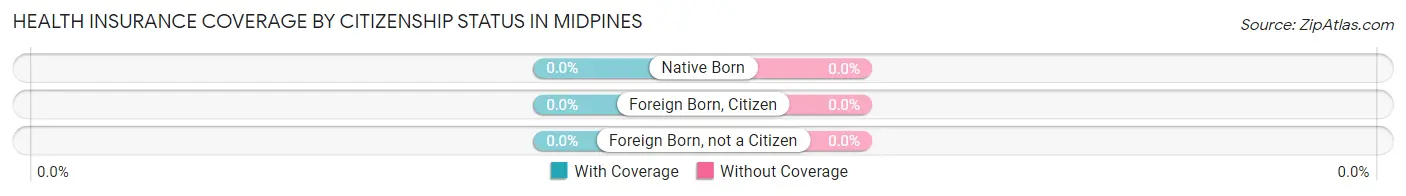
| Citizenship Status | With Coverage | Without Coverage |
| Native Born | 0 (0.0%) | 0 (0.0%) |
| Foreign Born, Citizen | 0 (0.0%) | 0 (0.0%) |
| Foreign Born, not a Citizen | 0 (0.0%) | 0 (0.0%) |
Health Insurance Coverage by Household Income in Midpines
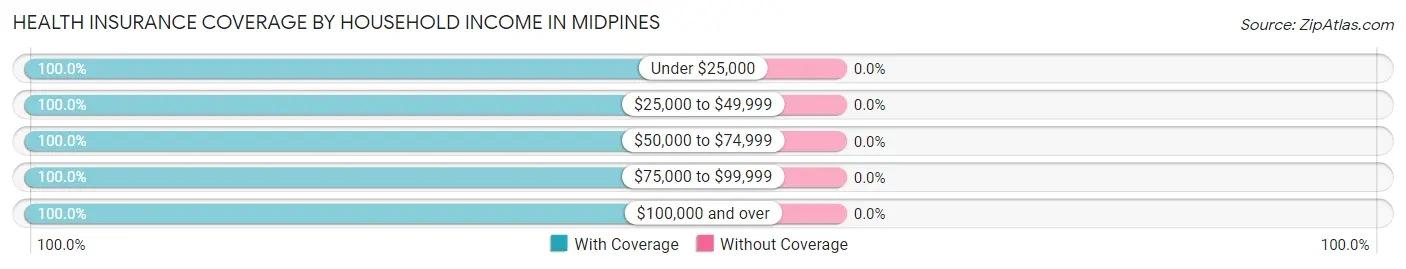
| Household Income | With Coverage | Without Coverage |
| Under $25,000 | 3 (100.0%) | 0 (0.0%) |
| $25,000 to $49,999 | 47 (100.0%) | 0 (0.0%) |
| $50,000 to $74,999 | 33 (100.0%) | 0 (0.0%) |
| $75,000 to $99,999 | 34 (100.0%) | 0 (0.0%) |
| $100,000 and over | 58 (100.0%) | 0 (0.0%) |
Public vs Private Health Insurance Coverage by Age in Midpines
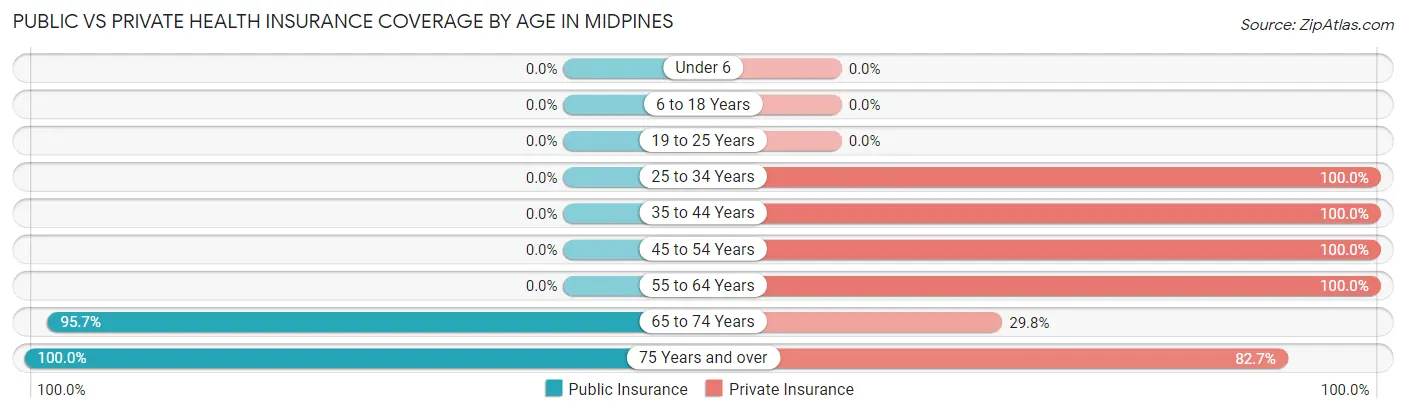
| Age Bracket | Public Insurance | Private Insurance |
| Under 6 | 0 (0.0%) | 0 (0.0%) |
| 6 to 18 Years | 0 (0.0%) | 0 (0.0%) |
| 19 to 25 Years | 0 (0.0%) | 0 (0.0%) |
| 25 to 34 Years | 0 (0.0%) | 37 (100.0%) |
| 35 to 44 Years | 0 (0.0%) | 7 (100.0%) |
| 45 to 54 Years | 0 (0.0%) | 3 (100.0%) |
| 55 to 64 Years | 0 (0.0%) | 8 (100.0%) |
| 65 to 74 Years | 45 (95.7%) | 14 (29.8%) |
| 75 Years and over | 81 (100.0%) | 67 (82.7%) |
| Total | 126 (68.9%) | 136 (74.3%) |
Disability Status by Sex by Age in Midpines
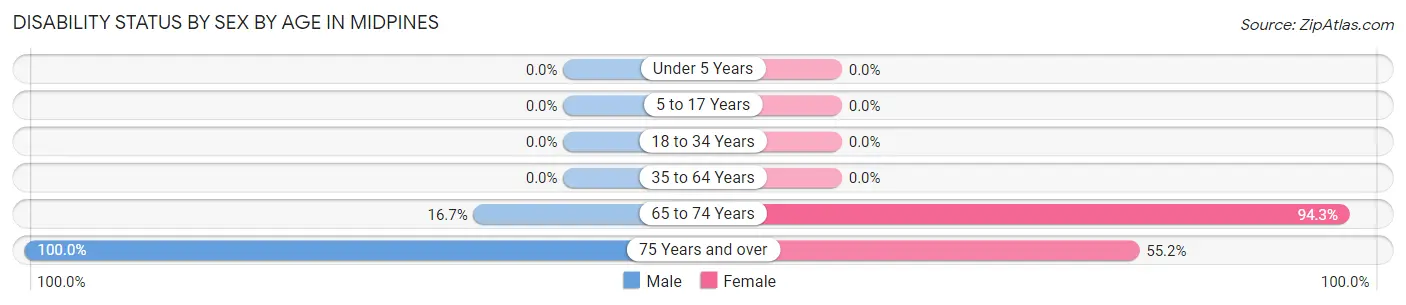
| Age Bracket | Male | Female |
| Under 5 Years | 0 (0.0%) | 0 (0.0%) |
| 5 to 17 Years | 0 (0.0%) | 0 (0.0%) |
| 18 to 34 Years | 0 (0.0%) | 0 (0.0%) |
| 35 to 64 Years | 0 (0.0%) | 0 (0.0%) |
| 65 to 74 Years | 2 (16.7%) | 33 (94.3%) |
| 75 Years and over | 14 (100.0%) | 37 (55.2%) |
Disability Class by Sex by Age in Midpines
Disability Class: Hearing Difficulty
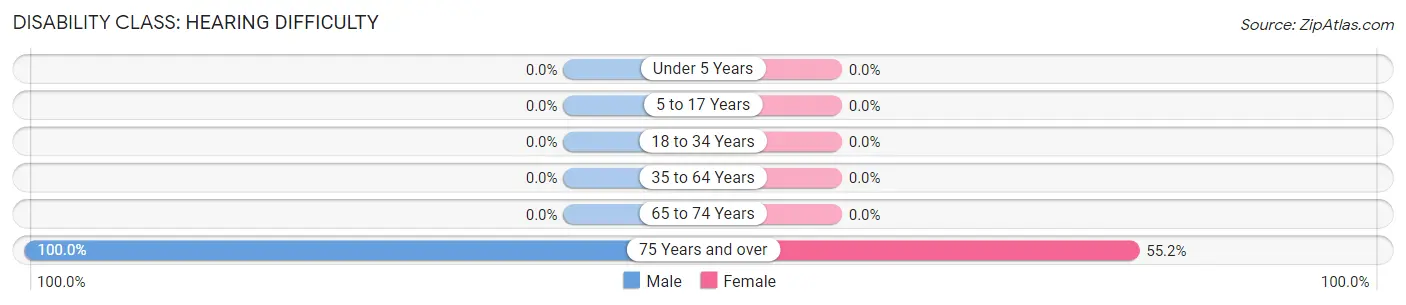
| Age Bracket | Male | Female |
| Under 5 Years | 0 (0.0%) | 0 (0.0%) |
| 5 to 17 Years | 0 (0.0%) | 0 (0.0%) |
| 18 to 34 Years | 0 (0.0%) | 0 (0.0%) |
| 35 to 64 Years | 0 (0.0%) | 0 (0.0%) |
| 65 to 74 Years | 0 (0.0%) | 0 (0.0%) |
| 75 Years and over | 14 (100.0%) | 37 (55.2%) |
Disability Class: Vision Difficulty
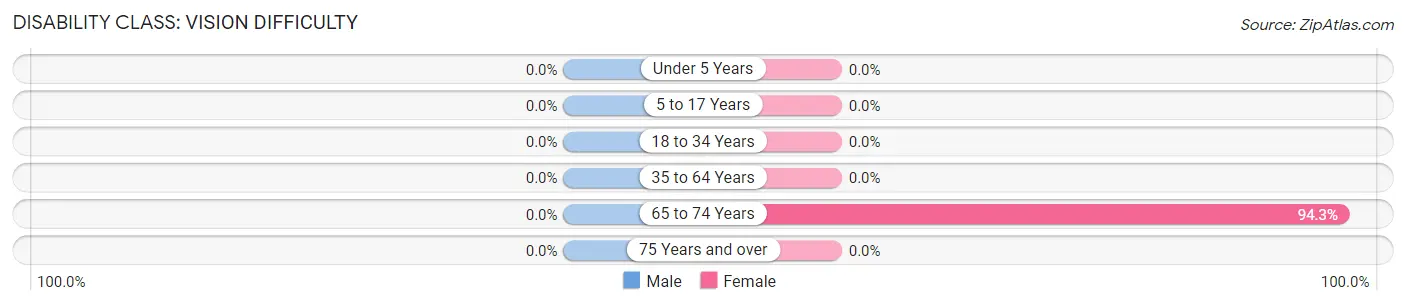
| Age Bracket | Male | Female |
| Under 5 Years | 0 (0.0%) | 0 (0.0%) |
| 5 to 17 Years | 0 (0.0%) | 0 (0.0%) |
| 18 to 34 Years | 0 (0.0%) | 0 (0.0%) |
| 35 to 64 Years | 0 (0.0%) | 0 (0.0%) |
| 65 to 74 Years | 0 (0.0%) | 33 (94.3%) |
| 75 Years and over | 0 (0.0%) | 0 (0.0%) |
Disability Class: Cognitive Difficulty

| Age Bracket | Male | Female |
| 5 to 17 Years | 0 (0.0%) | 0 (0.0%) |
| 18 to 34 Years | 0 (0.0%) | 0 (0.0%) |
| 35 to 64 Years | 0 (0.0%) | 0 (0.0%) |
| 65 to 74 Years | 0 (0.0%) | 0 (0.0%) |
| 75 Years and over | 0 (0.0%) | 0 (0.0%) |
Disability Class: Ambulatory Difficulty
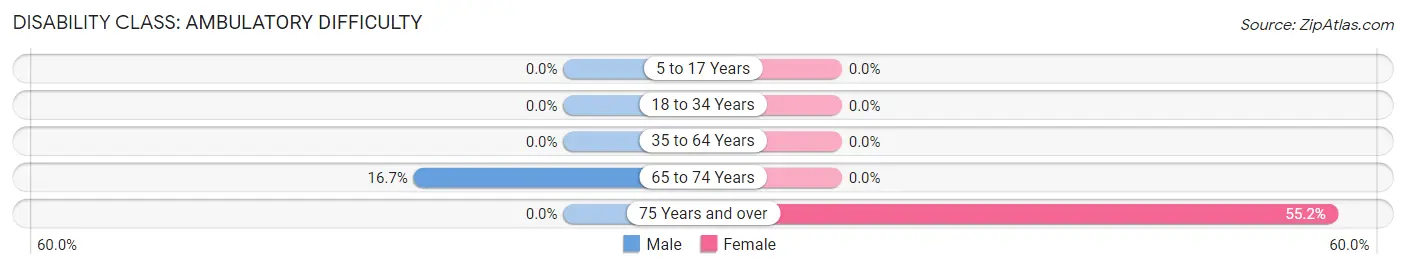
| Age Bracket | Male | Female |
| 5 to 17 Years | 0 (0.0%) | 0 (0.0%) |
| 18 to 34 Years | 0 (0.0%) | 0 (0.0%) |
| 35 to 64 Years | 0 (0.0%) | 0 (0.0%) |
| 65 to 74 Years | 2 (16.7%) | 0 (0.0%) |
| 75 Years and over | 0 (0.0%) | 37 (55.2%) |
Disability Class: Self-Care Difficulty
| Age Bracket | Male | Female |
| 5 to 17 Years | 0 (0.0%) | 0 (0.0%) |
| 18 to 34 Years | 0 (0.0%) | 0 (0.0%) |
| 35 to 64 Years | 0 (0.0%) | 0 (0.0%) |
| 65 to 74 Years | 0 (0.0%) | 0 (0.0%) |
| 75 Years and over | 0 (0.0%) | 0 (0.0%) |
Technology Access in Midpines
Computing Device Access in Midpines
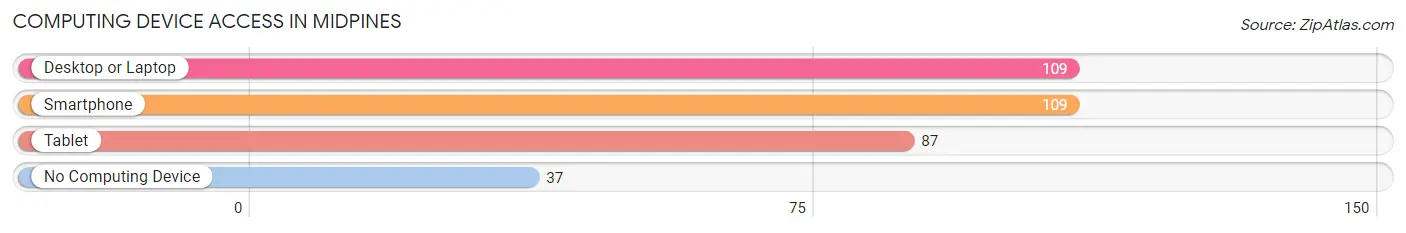
| Device Type | # Households | % Households |
| Desktop or Laptop | 109 | 74.7% |
| Smartphone | 109 | 74.7% |
| Tablet | 87 | 59.6% |
| No Computing Device | 37 | 25.3% |
| Total | 146 | 100.0% |
Internet Access in Midpines
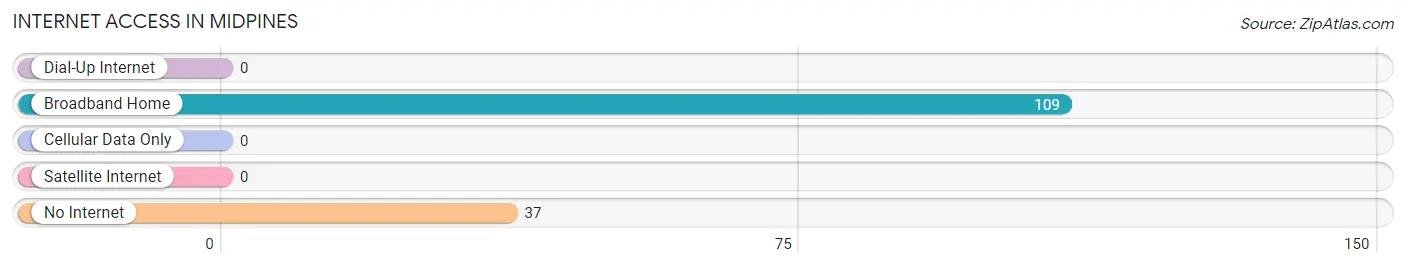
| Internet Type | # Households | % Households |
| Dial-Up Internet | 0 | 0.0% |
| Broadband Home | 109 | 74.7% |
| Cellular Data Only | 0 | 0.0% |
| Satellite Internet | 0 | 0.0% |
| No Internet | 37 | 25.3% |
| Total | 146 | 100.0% |
Midpines Summary
Midpines is a small unincorporated community located in Mariposa County, California. It is situated in the foothills of the Sierra Nevada Mountains, approximately 20 miles east of the city of Mariposa. The population of Midpines was estimated to be around 1,000 people in 2020.
History
Midpines was originally inhabited by the Miwok Native American tribe. The first European settlers arrived in the area in the late 1800s, and the town was officially established in 1891. The town was named after the nearby Midpines Creek, which was named by a surveyor in the area.
The town was initially a small farming community, with many of the residents growing crops such as wheat, barley, and hay. In the early 1900s, the town began to grow as a result of the gold rush in the nearby area. Many of the miners who came to the area settled in Midpines, and the town soon became a hub for the mining industry.
In the mid-1900s, the town began to decline as the gold rush ended and the mining industry moved away. However, the town was able to survive due to its proximity to Yosemite National Park, which brought in tourists and new businesses.
Geography
Midpines is located in the foothills of the Sierra Nevada Mountains, approximately 20 miles east of the city of Mariposa. The town is situated at an elevation of 2,000 feet, and is surrounded by rolling hills and mountains. The nearby Midpines Creek runs through the town, and is a popular spot for fishing and swimming.
The climate in Midpines is mild and temperate, with hot summers and cold winters. The average temperature in the summer is around 80 degrees Fahrenheit, and the average temperature in the winter is around 40 degrees Fahrenheit.
Economy
The economy of Midpines is largely based on tourism, as the town is located near Yosemite National Park. The town also has a few small businesses, such as restaurants, stores, and gas stations.
The town also has a few small farms, which produce crops such as wheat, barley, and hay. The nearby Midpines Creek is also a popular spot for fishing and swimming, and the town has a few small fishing lodges.
Demographics
The population of Midpines was estimated to be around 1,000 people in 2020. The town is predominantly white, with a small Hispanic population. The median household income in Midpines is around $50,000, and the median home value is around $200,000.
The town is served by the Mariposa County Unified School District, which operates two elementary schools and one middle school in the area. The town also has a few churches, and a small library.
Common Questions
What is Per Capita Income in Midpines?
Per Capita income in Midpines is $59,823.
What is the Median Household income in Midpines?
Median Household Income in Midpines is $64,242.
What is Inequality or Gini Index in Midpines?
Inequality or Gini Index in Midpines is 0.28.
What is the Total Population of Midpines?
Total Population of Midpines is 183.
What is the Total Male Population of Midpines?
Total Male Population of Midpines is 52.
What is the Total Female Population of Midpines?
Total Female Population of Midpines is 131.
What is the Ratio of Males per 100 Females in Midpines?
There are 39.69 Males per 100 Females in Midpines.
What is the Ratio of Females per 100 Males in Midpines?
There are 251.92 Females per 100 Males in Midpines.
What is the Median Population Age in Midpines?
Median Population Age in Midpines is 73.7 Years.
What is the Average Family Size in Midpines
Average Family Size in Midpines is 2.0 People.
What is the Average Household Size in Midpines
Average Household Size in Midpines is 1.2 People.
How Large is the Labor Force in Midpines?
There are 122 People in the Labor Forcein in Midpines.
What is the Percentage of People in the Labor Force in Midpines?
66.7% of People are in the Labor Force in Midpines.