Cities with the Highest Percentage of Population Employed in Computer, Engineering & Science in Utah
RELATED REPORTS & OPTIONS
Computer, Engineering & Science
Utah
Compare Cities
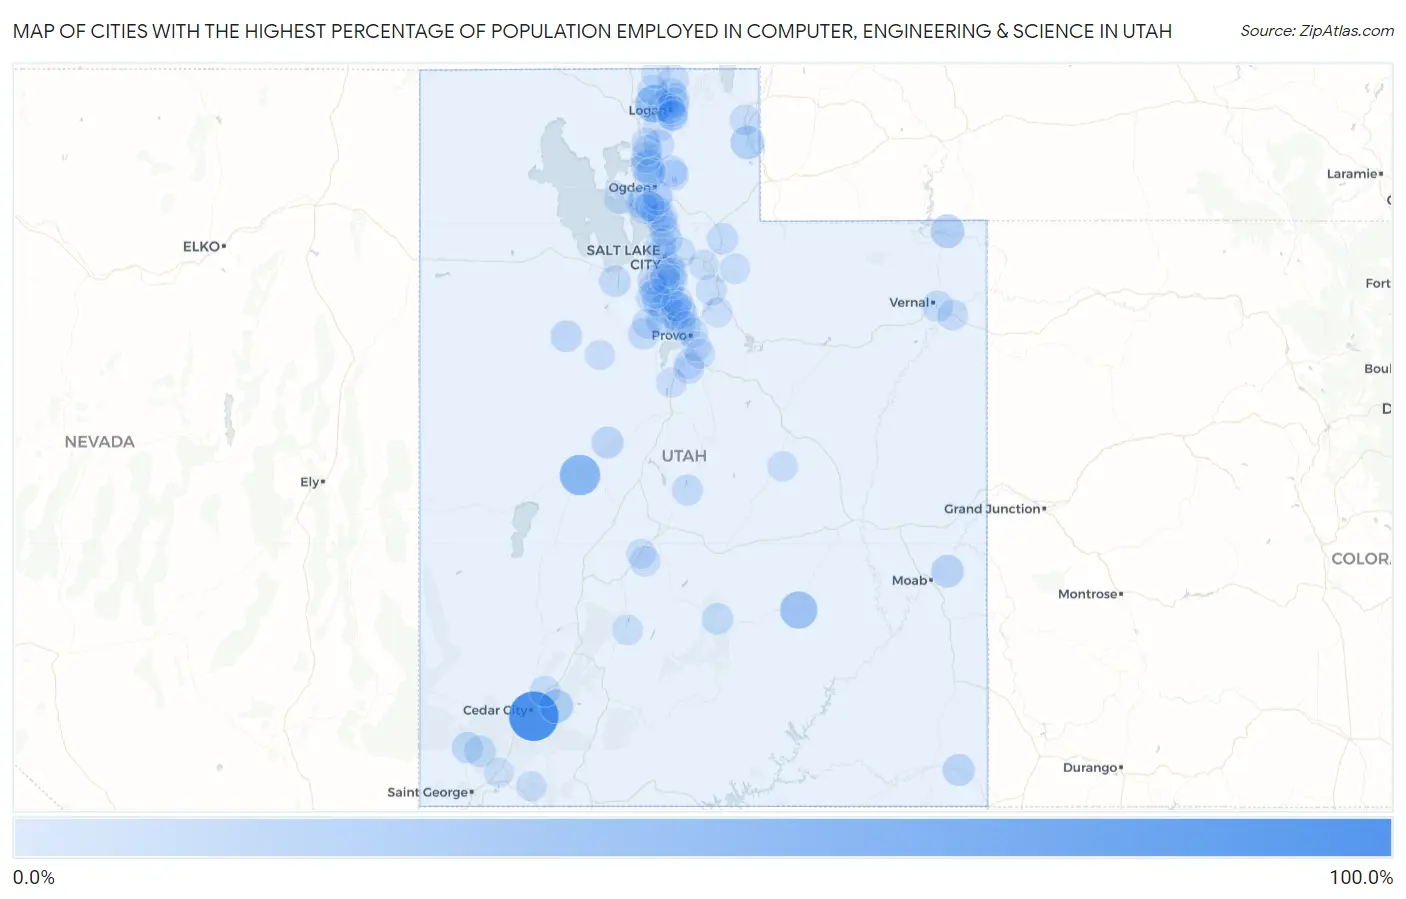
Map of Cities with the Highest Percentage of Population Employed in Computer, Engineering & Science in Utah
0.0%
100.0%
Cities with the Highest Percentage of Population Employed in Computer, Engineering & Science in Utah
| City | % Employed | vs State | vs National | |
| 1. | Cedar Highlands | 100.0% | 7.7%(+92.3)#1 | 6.8%(+93.2)#20 |
| 2. | Oasis | 55.0% | 7.7%(+47.3)#2 | 6.8%(+48.2)#53 |
| 3. | Peter | 40.7% | 7.7%(+33.0)#3 | 6.8%(+33.9)#112 |
| 4. | Hanksville | 40.0% | 7.7%(+32.3)#4 | 6.8%(+33.2)#117 |
| 5. | Brian Head | 24.0% | 7.7%(+16.3)#5 | 6.8%(+17.2)#364 |
| 6. | Woodruff | 23.9% | 7.7%(+16.2)#6 | 6.8%(+17.1)#365 |
| 7. | Brighton | 23.3% | 7.7%(+15.6)#7 | 6.8%(+16.5)#385 |
| 8. | Dutch John | 23.1% | 7.7%(+15.4)#8 | 6.8%(+16.3)#397 |
| 9. | South Willard | 22.9% | 7.7%(+15.2)#9 | 6.8%(+16.1)#406 |
| 10. | Castle Valley | 19.3% | 7.7%(+11.6)#10 | 6.8%(+12.5)#610 |
| 11. | Montezuma Creek | 16.4% | 7.7%(+8.72)#11 | 6.8%(+9.65)#901 |
| 12. | Lynndyl | 16.0% | 7.7%(+8.30)#12 | 6.8%(+9.24)#960 |
| 13. | Dugway | 14.7% | 7.7%(+7.05)#13 | 6.8%(+7.98)#1,188 |
| 14. | Erda | 14.1% | 7.7%(+6.45)#14 | 6.8%(+7.38)#1,300 |
| 15. | Wolf Creek | 14.1% | 7.7%(+6.38)#15 | 6.8%(+7.32)#1,316 |
| 16. | Hyde Park | 14.0% | 7.7%(+6.30)#16 | 6.8%(+7.23)#1,341 |
| 17. | Pine Valley | 13.5% | 7.7%(+5.84)#17 | 6.8%(+6.77)#1,471 |
| 18. | Lehi | 13.5% | 7.7%(+5.83)#18 | 6.8%(+6.77)#1,473 |
| 19. | Fairfield | 13.5% | 7.7%(+5.76)#19 | 6.8%(+6.70)#1,497 |
| 20. | Central | 13.4% | 7.7%(+5.73)#20 | 6.8%(+6.67)#1,510 |
| 21. | Naples | 13.2% | 7.7%(+5.55)#21 | 6.8%(+6.48)#1,566 |
| 22. | Hoytsville | 13.1% | 7.7%(+5.38)#22 | 6.8%(+6.32)#1,607 |
| 23. | Torrey | 12.8% | 7.7%(+5.09)#23 | 6.8%(+6.03)#1,698 |
| 24. | Vineyard | 12.3% | 7.7%(+4.64)#24 | 6.8%(+5.57)#1,829 |
| 25. | Saratoga Springs | 12.2% | 7.7%(+4.53)#25 | 6.8%(+5.46)#1,871 |
| 26. | Sterling | 11.9% | 7.7%(+4.21)#26 | 6.8%(+5.14)#1,977 |
| 27. | Benson | 11.6% | 7.7%(+3.85)#27 | 6.8%(+4.79)#2,092 |
| 28. | Herriman | 11.3% | 7.7%(+3.61)#28 | 6.8%(+4.55)#2,214 |
| 29. | Farr West | 11.3% | 7.7%(+3.61)#29 | 6.8%(+4.55)#2,215 |
| 30. | West Point | 11.3% | 7.7%(+3.58)#30 | 6.8%(+4.52)#2,225 |
| 31. | Summit | 11.1% | 7.7%(+3.41)#31 | 6.8%(+4.35)#2,314 |
| 32. | Cedar Hills | 11.0% | 7.7%(+3.34)#32 | 6.8%(+4.27)#2,360 |
| 33. | Interlaken | 10.9% | 7.7%(+3.21)#33 | 6.8%(+4.14)#2,414 |
| 34. | Jensen | 10.9% | 7.7%(+3.19)#34 | 6.8%(+4.12)#2,428 |
| 35. | Draper | 10.8% | 7.7%(+3.14)#35 | 6.8%(+4.08)#2,449 |
| 36. | Kaysville | 10.8% | 7.7%(+3.11)#36 | 6.8%(+4.04)#2,462 |
| 37. | Millcreek | 10.6% | 7.7%(+2.86)#37 | 6.8%(+3.80)#2,601 |
| 38. | Salt Lake City | 10.5% | 7.7%(+2.79)#38 | 6.8%(+3.73)#2,641 |
| 39. | Willard | 10.4% | 7.7%(+2.72)#39 | 6.8%(+3.65)#2,682 |
| 40. | Randolph | 10.4% | 7.7%(+2.72)#40 | 6.8%(+3.65)#2,683 |
| 41. | Smithfield | 10.4% | 7.7%(+2.68)#41 | 6.8%(+3.61)#2,712 |
| 42. | Sandy | 10.3% | 7.7%(+2.58)#42 | 6.8%(+3.52)#2,769 |
| 43. | Wellsville | 10.2% | 7.7%(+2.51)#43 | 6.8%(+3.44)#2,808 |
| 44. | Murray | 10.2% | 7.7%(+2.51)#44 | 6.8%(+3.44)#2,809 |
| 45. | Mantua | 10.2% | 7.7%(+2.51)#45 | 6.8%(+3.44)#2,810 |
| 46. | South Jordan | 9.9% | 7.7%(+2.22)#46 | 6.8%(+3.15)#2,997 |
| 47. | Bluffdale | 9.9% | 7.7%(+2.18)#47 | 6.8%(+3.12)#3,018 |
| 48. | Annabella | 9.8% | 7.7%(+2.15)#48 | 6.8%(+3.08)#3,044 |
| 49. | Emigration Canyon | 9.8% | 7.7%(+2.08)#49 | 6.8%(+3.01)#3,096 |
| 50. | Eagle Mountain | 9.7% | 7.7%(+2.04)#50 | 6.8%(+2.97)#3,124 |
| 51. | Clinton | 9.7% | 7.7%(+1.97)#51 | 6.8%(+2.91)#3,177 |
| 52. | Cottonwood Heights | 9.6% | 7.7%(+1.89)#52 | 6.8%(+2.82)#3,241 |
| 53. | Bountiful | 9.5% | 7.7%(+1.78)#53 | 6.8%(+2.72)#3,322 |
| 54. | Richmond | 9.4% | 7.7%(+1.71)#54 | 6.8%(+2.65)#3,384 |
| 55. | North Logan | 9.4% | 7.7%(+1.70)#55 | 6.8%(+2.63)#3,397 |
| 56. | Farmington | 9.4% | 7.7%(+1.66)#56 | 6.8%(+2.60)#3,424 |
| 57. | Eden | 9.3% | 7.7%(+1.57)#57 | 6.8%(+2.51)#3,491 |
| 58. | Junction | 9.3% | 7.7%(+1.56)#58 | 6.8%(+2.49)#3,504 |
| 59. | American Fork | 9.0% | 7.7%(+1.30)#59 | 6.8%(+2.24)#3,707 |
| 60. | White | 9.0% | 7.7%(+1.28)#60 | 6.8%(+2.21)#3,730 |
| 61. | Millville | 9.0% | 7.7%(+1.26)#61 | 6.8%(+2.20)#3,746 |
| 62. | Rockville | 8.8% | 7.7%(+1.13)#62 | 6.8%(+2.06)#3,885 |
| 63. | Marion | 8.7% | 7.7%(+1.05)#63 | 6.8%(+1.99)#3,942 |
| 64. | Pleasant Grove | 8.7% | 7.7%(+1.03)#64 | 6.8%(+1.96)#3,956 |
| 65. | River Heights | 8.7% | 7.7%(+1.01)#65 | 6.8%(+1.94)#3,972 |
| 66. | Elk Ridge | 8.6% | 7.7%(+0.913)#66 | 6.8%(+1.85)#4,054 |
| 67. | Alpine | 8.6% | 7.7%(+0.859)#67 | 6.8%(+1.79)#4,119 |
| 68. | Layton | 8.5% | 7.7%(+0.759)#68 | 6.8%(+1.69)#4,214 |
| 69. | Vernon | 8.4% | 7.7%(+0.736)#69 | 6.8%(+1.67)#4,233 |
| 70. | Centerville | 8.4% | 7.7%(+0.659)#70 | 6.8%(+1.59)#4,307 |
| 71. | Salem | 8.3% | 7.7%(+0.647)#71 | 6.8%(+1.58)#4,317 |
| 72. | Providence | 8.3% | 7.7%(+0.633)#72 | 6.8%(+1.57)#4,345 |
| 73. | North Salt Lake | 8.3% | 7.7%(+0.625)#73 | 6.8%(+1.56)#4,352 |
| 74. | Provo | 8.3% | 7.7%(+0.561)#74 | 6.8%(+1.49)#4,406 |
| 75. | Syracuse | 8.2% | 7.7%(+0.550)#75 | 6.8%(+1.48)#4,421 |
| 76. | Newton | 8.2% | 7.7%(+0.534)#76 | 6.8%(+1.47)#4,436 |
| 77. | Cleveland | 8.2% | 7.7%(+0.521)#77 | 6.8%(+1.45)#4,451 |
| 78. | Hooper | 8.2% | 7.7%(+0.519)#78 | 6.8%(+1.45)#4,455 |
| 79. | Fruit Heights | 8.2% | 7.7%(+0.483)#79 | 6.8%(+1.42)#4,496 |
| 80. | Logan | 8.1% | 7.7%(+0.361)#80 | 6.8%(+1.29)#4,617 |
| 81. | Snyderville | 8.0% | 7.7%(+0.308)#81 | 6.8%(+1.24)#4,689 |
| 82. | Rocky Ridge | 8.0% | 7.7%(+0.302)#82 | 6.8%(+1.24)#4,698 |
| 83. | Highland | 8.0% | 7.7%(+0.299)#83 | 6.8%(+1.23)#4,710 |
| 84. | Orem | 8.0% | 7.7%(+0.279)#84 | 6.8%(+1.21)#4,737 |
| 85. | Leeds | 7.9% | 7.7%(+0.238)#85 | 6.8%(+1.17)#4,774 |
| 86. | South Weber | 7.9% | 7.7%(+0.232)#86 | 6.8%(+1.17)#4,782 |
| 87. | West Jordan | 7.9% | 7.7%(+0.171)#87 | 6.8%(+1.10)#4,860 |
| 88. | Wallsburg | 7.9% | 7.7%(+0.159)#88 | 6.8%(+1.09)#4,874 |
| 89. | Perry | 7.9% | 7.7%(+0.156)#89 | 6.8%(+1.09)#4,876 |
| 90. | Cornish | 7.8% | 7.7%(+0.128)#90 | 6.8%(+1.06)#4,904 |
| 91. | Riverton | 7.8% | 7.7%(+0.115)#91 | 6.8%(+1.05)#4,920 |
| 92. | Holladay | 7.8% | 7.7%(+0.083)#92 | 6.8%(+1.02)#4,961 |
| 93. | Springville | 7.8% | 7.7%(+0.072)#93 | 6.8%(+1.01)#4,977 |
| 94. | Midvale | 7.8% | 7.7%(+0.060)#94 | 6.8%(+0.993)#4,997 |
| 95. | Richfield | 7.7% | 7.7%(-0.031)#95 | 6.8%(+0.902)#5,115 |
| 96. | South Ogden | 7.4% | 7.7%(-0.268)#96 | 6.8%(+0.665)#5,370 |
| 97. | Mapleton | 7.4% | 7.7%(-0.279)#97 | 6.8%(+0.654)#5,385 |
| 98. | Pleasant View | 7.3% | 7.7%(-0.371)#98 | 6.8%(+0.562)#5,507 |
| 99. | Brigham City | 7.2% | 7.7%(-0.513)#99 | 6.8%(+0.420)#5,674 |
| 100. | Clearfield | 7.2% | 7.7%(-0.518)#100 | 6.8%(+0.416)#5,681 |
Common Questions
What are the Top 10 Cities with the Highest Percentage of Population Employed in Computer, Engineering & Science in Utah?
Top 10 Cities with the Highest Percentage of Population Employed in Computer, Engineering & Science in Utah are:
#1
100.0%
#2
55.0%
#3
40.7%
#4
40.0%
#5
24.0%
#6
23.9%
#7
23.1%
#8
22.9%
#9
19.3%
#10
16.4%
What city has the Highest Percentage of Population Employed in Computer, Engineering & Science in Utah?
Cedar Highlands has the Highest Percentage of Population Employed in Computer, Engineering & Science in Utah with 100.0%.
What is the Percentage of Population Employed in Computer, Engineering & Science in the State of Utah?
Percentage of Population Employed in Computer, Engineering & Science in Utah is 7.7%.
What is the Percentage of Population Employed in Computer, Engineering & Science in the United States?
Percentage of Population Employed in Computer, Engineering & Science in the United States is 6.8%.