Brisbane, CA Map & Demographics
Brisbane Map
Brisbane Overview
$101,760
PER CAPITA INCOME
$156,765
AVG FAMILY INCOME
$137,583
AVG HOUSEHOLD INCOME
11.9%
WAGE / INCOME GAP [ % ]
88.1¢/ $1
WAGE / INCOME GAP [ $ ]
$16,305
FAMILY INCOME DEFICIT
0.56
INEQUALITY / GINI INDEX
4,756
TOTAL POPULATION
2,369
MALE POPULATION
2,387
FEMALE POPULATION
99.25
MALES / 100 FEMALES
100.76
FEMALES / 100 MALES
42.9
MEDIAN AGE
3.4
AVG FAMILY SIZE
2.5
AVG HOUSEHOLD SIZE
2,665
LABOR FORCE [ PEOPLE ]
68.8%
PERCENT IN LABOR FORCE
9.9%
UNEMPLOYMENT RATE
Brisbane Zip Codes
Income in Brisbane
Income Overview in Brisbane
Per Capita Income in Brisbane is $101,760, while median incomes of families and households are $156,765 and $137,583 respectively.
| Characteristic | Number | Measure |
| Per Capita Income | 4,756 | $101,760 |
| Median Family Income | 1,072 | $156,765 |
| Mean Family Income | 1,072 | $208,797 |
| Median Household Income | 1,902 | $137,583 |
| Mean Household Income | 1,902 | $252,170 |
| Income Deficit | 1,072 | $16,305 |
| Wage / Income Gap (%) | 4,756 | 11.95% |
| Wage / Income Gap ($) | 4,756 | 88.05¢ per $1 |
| Gini / Inequality Index | 4,756 | 0.56 |
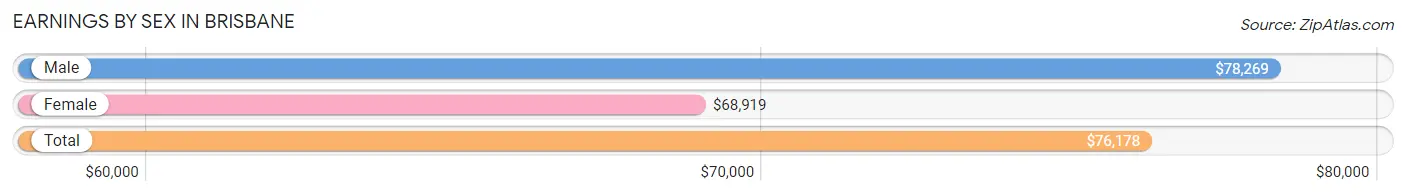
Earnings by Sex in Brisbane
Average Earnings in Brisbane are $76,178, $78,269 for men and $68,919 for women, a difference of 11.9%.
| Sex | Number | Average Earnings |
| Male | 1,506 (53.4%) | $78,269 |
| Female | 1,313 (46.6%) | $68,919 |
| Total | 2,819 (100.0%) | $76,178 |
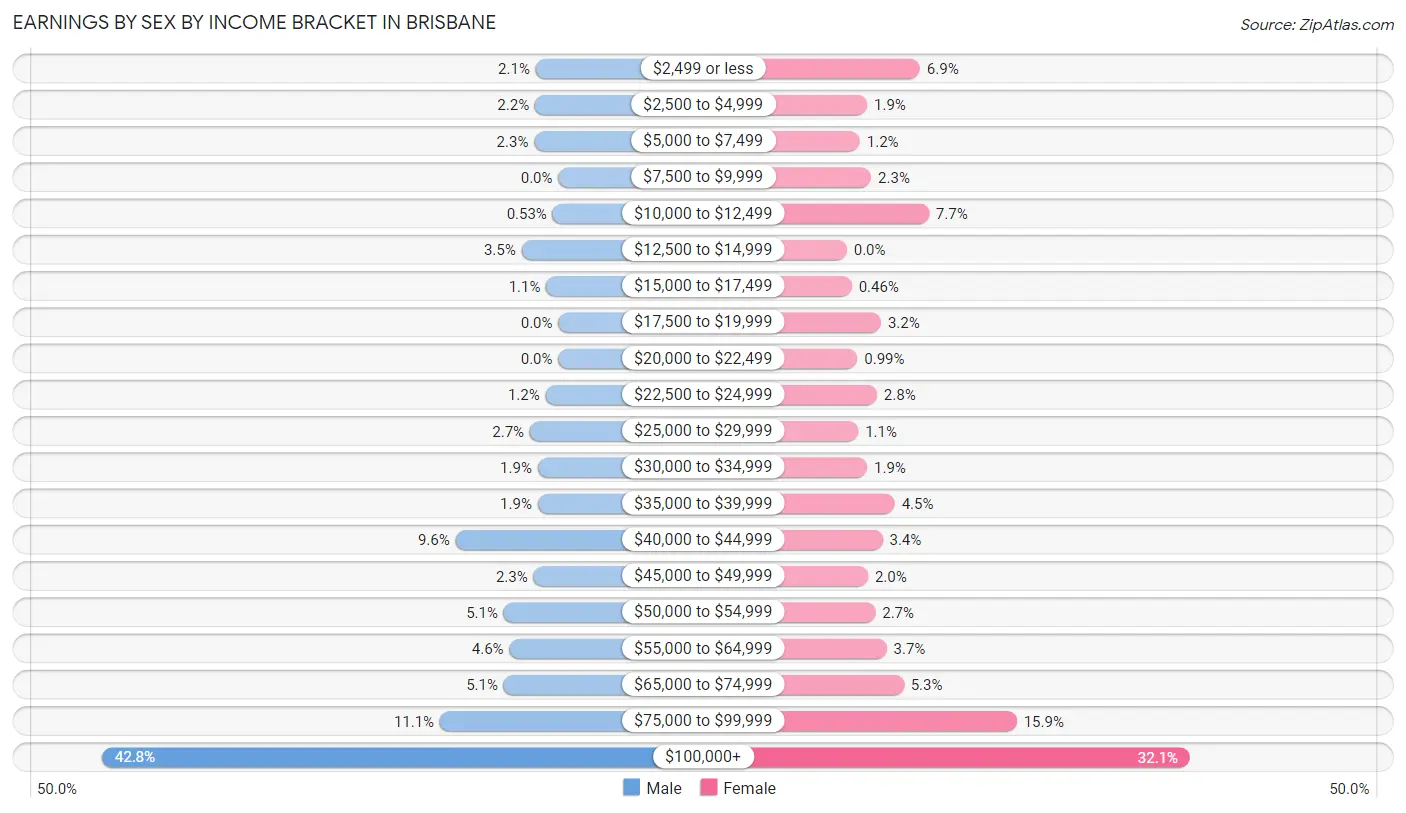
Earnings by Sex by Income Bracket in Brisbane
The most common earnings brackets in Brisbane are $100,000+ for men (644 | 42.8%) and $100,000+ for women (422 | 32.1%).
| Income | Male | Female |
| $2,499 or less | 32 (2.1%) | 90 (6.9%) |
| $2,500 to $4,999 | 33 (2.2%) | 25 (1.9%) |
| $5,000 to $7,499 | 34 (2.3%) | 16 (1.2%) |
| $7,500 to $9,999 | 0 (0.0%) | 30 (2.3%) |
| $10,000 to $12,499 | 8 (0.5%) | 101 (7.7%) |
| $12,500 to $14,999 | 52 (3.5%) | 0 (0.0%) |
| $15,000 to $17,499 | 17 (1.1%) | 6 (0.5%) |
| $17,500 to $19,999 | 0 (0.0%) | 42 (3.2%) |
| $20,000 to $22,499 | 0 (0.0%) | 13 (1.0%) |
| $22,500 to $24,999 | 18 (1.2%) | 37 (2.8%) |
| $25,000 to $29,999 | 40 (2.7%) | 14 (1.1%) |
| $30,000 to $34,999 | 29 (1.9%) | 25 (1.9%) |
| $35,000 to $39,999 | 29 (1.9%) | 59 (4.5%) |
| $40,000 to $44,999 | 145 (9.6%) | 44 (3.4%) |
| $45,000 to $49,999 | 35 (2.3%) | 26 (2.0%) |
| $50,000 to $54,999 | 77 (5.1%) | 35 (2.7%) |
| $55,000 to $64,999 | 69 (4.6%) | 49 (3.7%) |
| $65,000 to $74,999 | 77 (5.1%) | 70 (5.3%) |
| $75,000 to $99,999 | 167 (11.1%) | 209 (15.9%) |
| $100,000+ | 644 (42.8%) | 422 (32.1%) |
| Total | 1,506 (100.0%) | 1,313 (100.0%) |
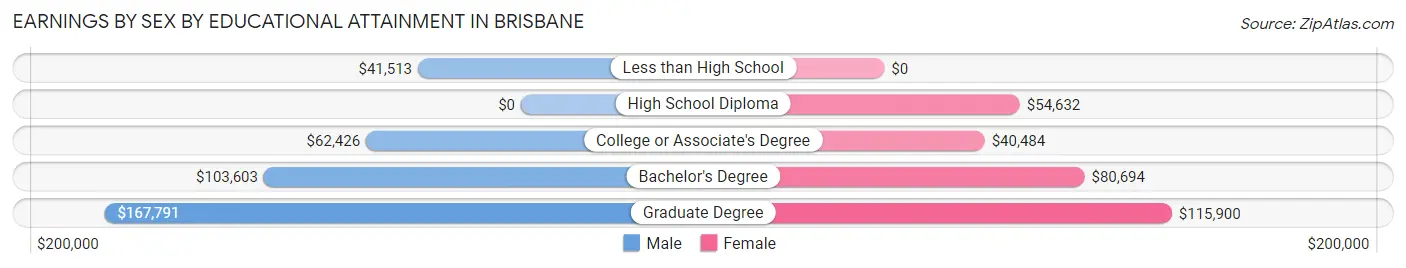
Earnings by Sex by Educational Attainment in Brisbane
Average earnings in Brisbane are $87,454 for men and $81,164 for women, a difference of 7.2%. Men with an educational attainment of graduate degree enjoy the highest average annual earnings of $167,791, while those with less than high school education earn the least with $41,513. Women with an educational attainment of graduate degree earn the most with the average annual earnings of $115,900, while those with college or associate's degree education have the smallest earnings of $40,484.
| Educational Attainment | Male Income | Female Income |
| Less than High School | $41,513 | $0 |
| High School Diploma | - | - |
| College or Associate's Degree | $62,426 | $40,484 |
| Bachelor's Degree | $103,603 | $80,694 |
| Graduate Degree | $167,791 | $115,900 |
| Total | $87,454 | $81,164 |
Family Income in Brisbane
Family Income Brackets in Brisbane
According to the Brisbane family income data, there are 457 families falling into the $200,000+ income range, which is the most common income bracket and makes up 42.6% of all families.
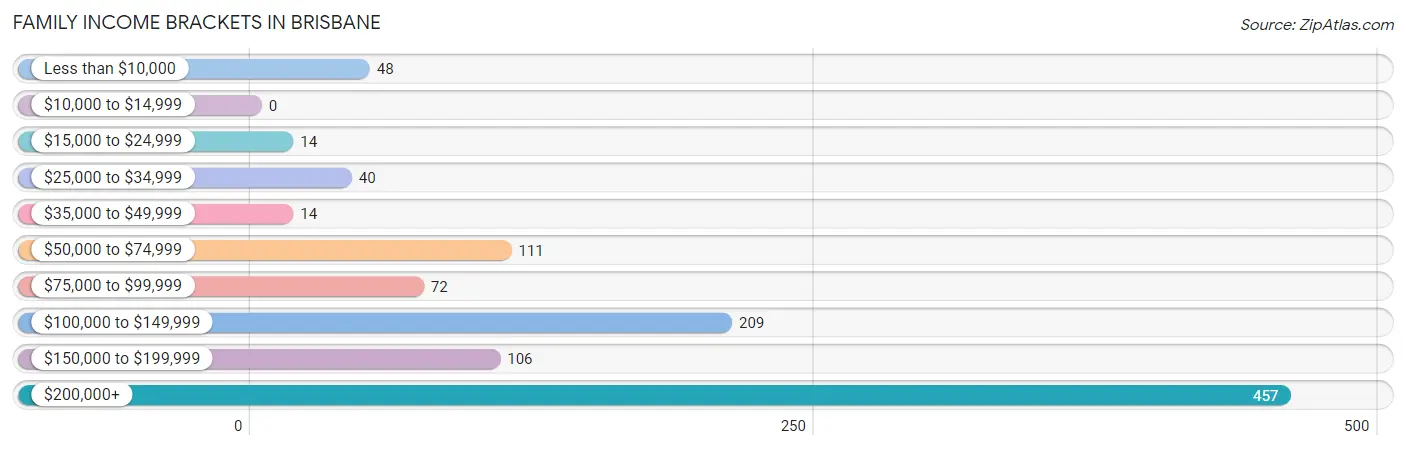
| Income Bracket | # Families | % Families |
| Less than $10,000 | 48 | 4.5% |
| $10,000 to $14,999 | 0 | 0.0% |
| $15,000 to $24,999 | 14 | 1.3% |
| $25,000 to $34,999 | 40 | 3.7% |
| $35,000 to $49,999 | 14 | 1.3% |
| $50,000 to $74,999 | 111 | 10.4% |
| $75,000 to $99,999 | 72 | 6.7% |
| $100,000 to $149,999 | 209 | 19.5% |
| $150,000 to $199,999 | 106 | 9.9% |
| $200,000+ | 457 | 42.6% |
Family Income by Famaliy Size in Brisbane
5-person families (103 | 9.6%) account for the highest median family income in Brisbane with $250,001 per family, while 2-person families (489 | 45.6%) have the highest median income of $68,875 per family member.
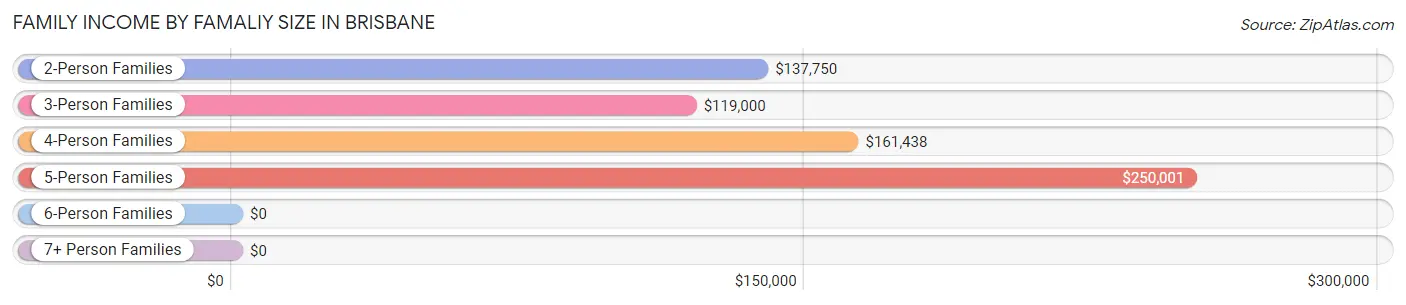
| Income Bracket | # Families | Median Income |
| 2-Person Families | 489 (45.6%) | $137,750 |
| 3-Person Families | 160 (14.9%) | $119,000 |
| 4-Person Families | 269 (25.1%) | $161,438 |
| 5-Person Families | 103 (9.6%) | $250,001 |
| 6-Person Families | 14 (1.3%) | $0 |
| 7+ Person Families | 37 (3.5%) | $0 |
| Total | 1,072 (100.0%) | $156,765 |
Family Income by Number of Earners in Brisbane
The median family income in Brisbane is $156,765, with families comprising 3+ earners (104) having the highest median family income of $250,001, while families with 1 earner (325) have the lowest median family income of $72,639, accounting for 9.7% and 30.3% of families, respectively.
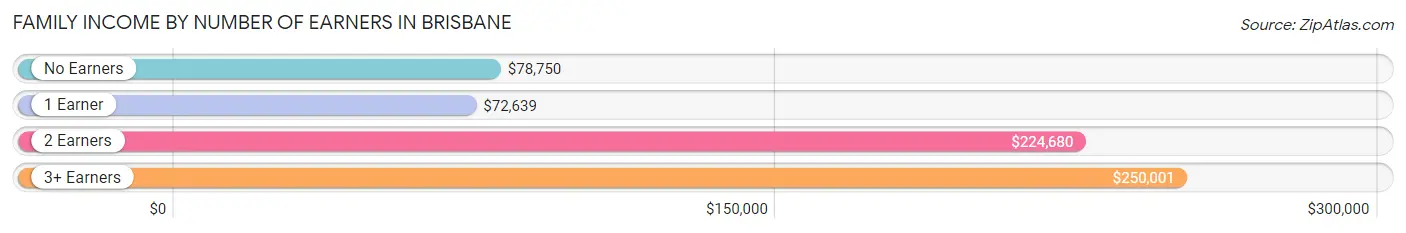
| Number of Earners | # Families | Median Income |
| No Earners | 92 (8.6%) | $78,750 |
| 1 Earner | 325 (30.3%) | $72,639 |
| 2 Earners | 551 (51.4%) | $224,680 |
| 3+ Earners | 104 (9.7%) | $250,001 |
| Total | 1,072 (100.0%) | $156,765 |
Household Income in Brisbane
Household Income Brackets in Brisbane
With 696 households falling in the category, the $200,000+ income range is the most frequent in Brisbane, accounting for 36.6% of all households.
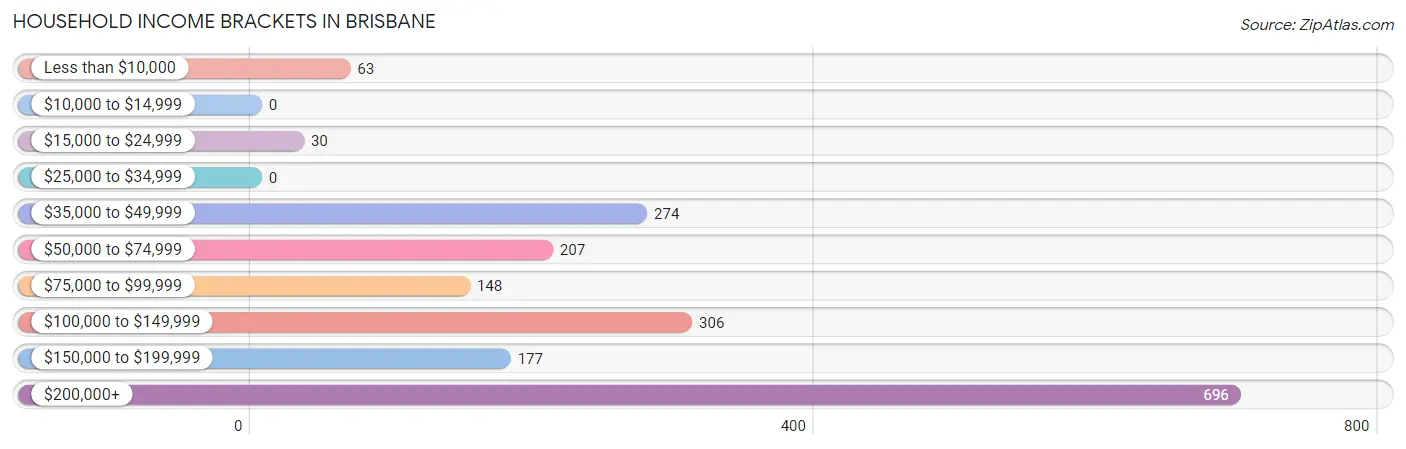
| Income Bracket | # Households | % Households |
| Less than $10,000 | 63 | 3.3% |
| $10,000 to $14,999 | 0 | 0.0% |
| $15,000 to $24,999 | 30 | 1.6% |
| $25,000 to $34,999 | 0 | 0.0% |
| $35,000 to $49,999 | 274 | 14.4% |
| $50,000 to $74,999 | 207 | 10.9% |
| $75,000 to $99,999 | 148 | 7.8% |
| $100,000 to $149,999 | 306 | 16.1% |
| $150,000 to $199,999 | 177 | 9.3% |
| $200,000+ | 696 | 36.6% |
Household Income by Householder Age in Brisbane
The median household income in Brisbane is $137,583, with the highest median household income of $193,482 found in the 25 to 44 years age bracket for the primary householder. A total of 469 households (24.7%) fall into this category.
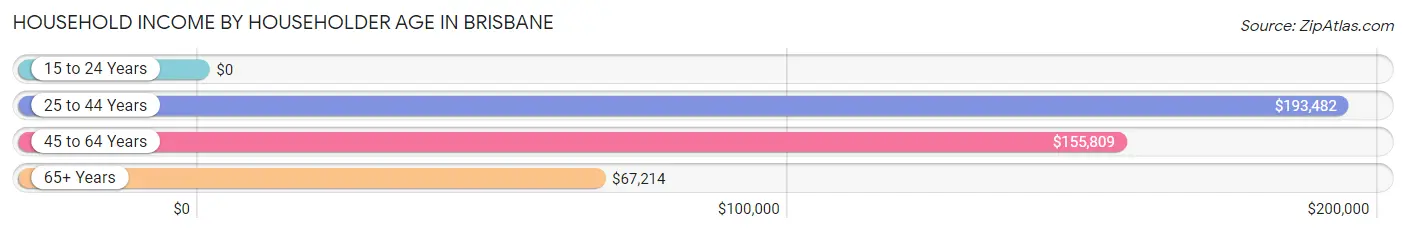
| Income Bracket | # Households | Median Income |
| 15 to 24 Years | 0 (0.0%) | $0 |
| 25 to 44 Years | 469 (24.7%) | $193,482 |
| 45 to 64 Years | 969 (50.9%) | $155,809 |
| 65+ Years | 464 (24.4%) | $67,214 |
| Total | 1,902 (100.0%) | $137,583 |
Poverty in Brisbane
Income Below Poverty by Sex and Age in Brisbane
With 6.5% poverty level for males and 3.4% for females among the residents of Brisbane, 12 to 14 year old males and 75 year old and over females are the most vulnerable to poverty, with 40 males (47.6%) and 18 females (12.0%) in their respective age groups living below the poverty level.
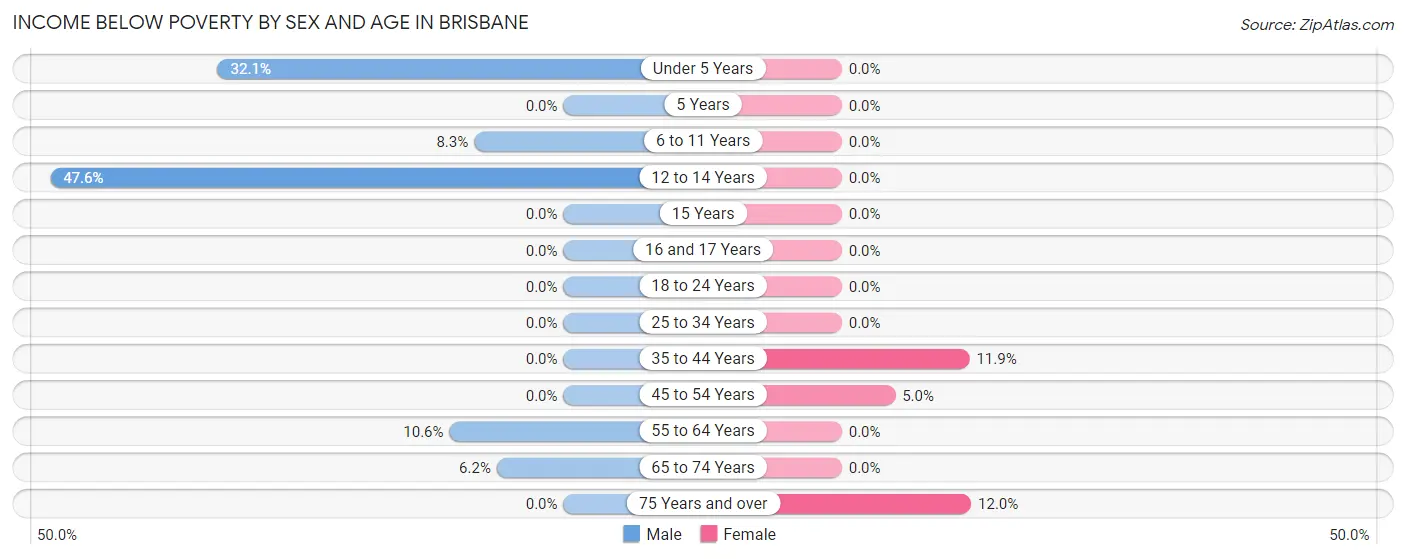
| Age Bracket | Male | Female |
| Under 5 Years | 51 (32.1%) | 0 (0.0%) |
| 5 Years | 0 (0.0%) | 0 (0.0%) |
| 6 to 11 Years | 15 (8.3%) | 0 (0.0%) |
| 12 to 14 Years | 40 (47.6%) | 0 (0.0%) |
| 15 Years | 0 (0.0%) | 0 (0.0%) |
| 16 and 17 Years | 0 (0.0%) | 0 (0.0%) |
| 18 to 24 Years | 0 (0.0%) | 0 (0.0%) |
| 25 to 34 Years | 0 (0.0%) | 0 (0.0%) |
| 35 to 44 Years | 0 (0.0%) | 48 (11.8%) |
| 45 to 54 Years | 0 (0.0%) | 13 (5.0%) |
| 55 to 64 Years | 33 (10.6%) | 0 (0.0%) |
| 65 to 74 Years | 16 (6.2%) | 0 (0.0%) |
| 75 Years and over | 0 (0.0%) | 18 (12.0%) |
| Total | 155 (6.5%) | 79 (3.4%) |
Income Above Poverty by Sex and Age in Brisbane
According to the poverty statistics in Brisbane, males aged 5 years and females aged under 5 years are the age groups that are most secure financially, with 100.0% of males and 100.0% of females in these age groups living above the poverty line.
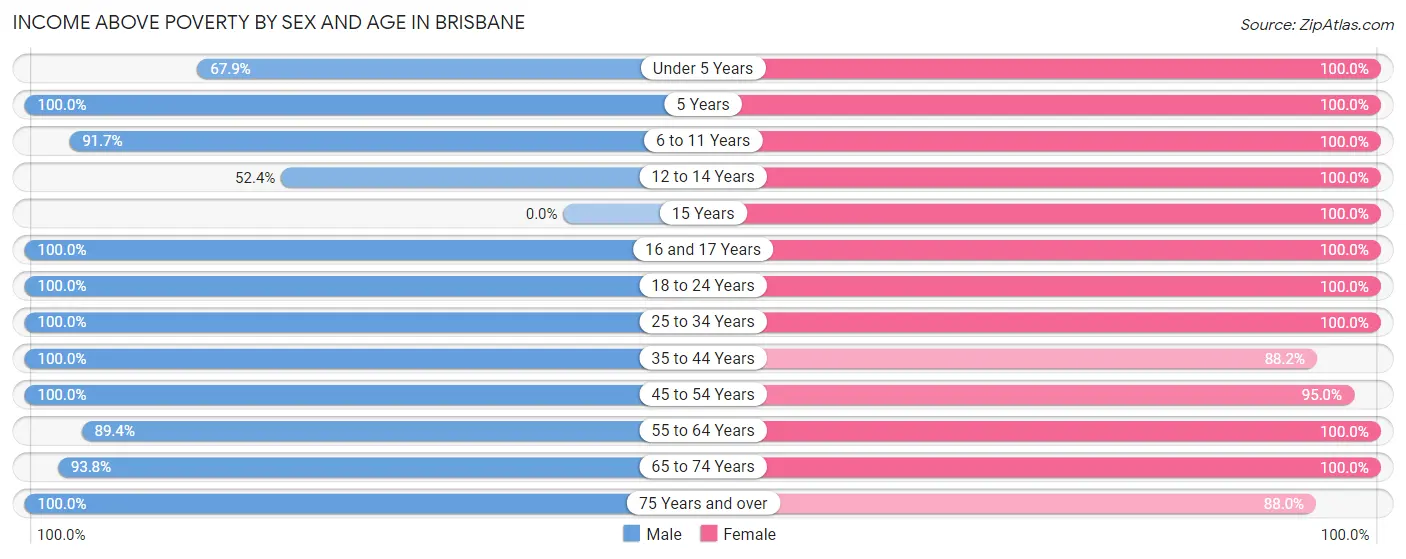
| Age Bracket | Male | Female |
| Under 5 Years | 108 (67.9%) | 116 (100.0%) |
| 5 Years | 22 (100.0%) | 34 (100.0%) |
| 6 to 11 Years | 166 (91.7%) | 158 (100.0%) |
| 12 to 14 Years | 44 (52.4%) | 60 (100.0%) |
| 15 Years | 0 (0.0%) | 23 (100.0%) |
| 16 and 17 Years | 16 (100.0%) | 60 (100.0%) |
| 18 to 24 Years | 175 (100.0%) | 235 (100.0%) |
| 25 to 34 Years | 138 (100.0%) | 176 (100.0%) |
| 35 to 44 Years | 397 (100.0%) | 357 (88.1%) |
| 45 to 54 Years | 523 (100.0%) | 249 (95.0%) |
| 55 to 64 Years | 279 (89.4%) | 426 (100.0%) |
| 65 to 74 Years | 243 (93.8%) | 236 (100.0%) |
| 75 Years and over | 103 (100.0%) | 132 (88.0%) |
| Total | 2,214 (93.5%) | 2,262 (96.6%) |
Income Below Poverty Among Married-Couple Families in Brisbane
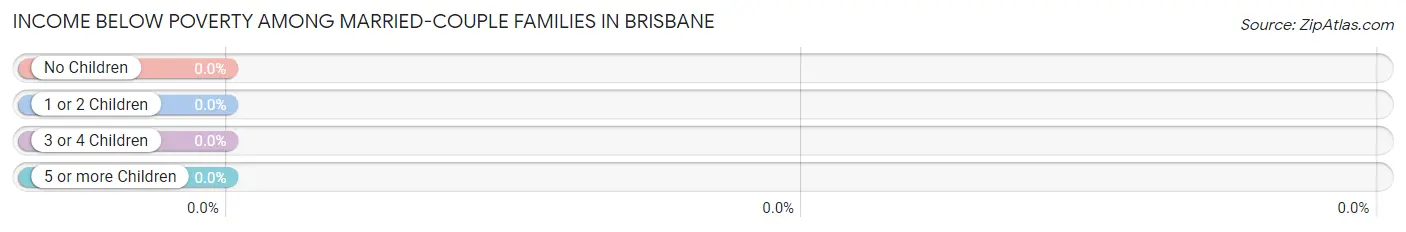
| Children | Above Poverty | Below Poverty |
| No Children | 417 (100.0%) | 0 (0.0%) |
| 1 or 2 Children | 264 (100.0%) | 0 (0.0%) |
| 3 or 4 Children | 56 (100.0%) | 0 (0.0%) |
| 5 or more Children | 0 (0.0%) | 0 (0.0%) |
| Total | 737 (100.0%) | 0 (0.0%) |
Income Below Poverty Among Single-Parent Households in Brisbane
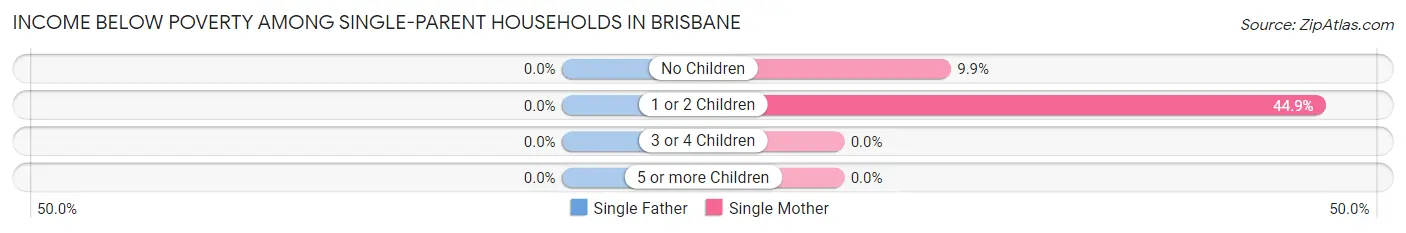
| Children | Single Father | Single Mother |
| No Children | 0 (0.0%) | 14 (9.9%) |
| 1 or 2 Children | 0 (0.0%) | 48 (44.9%) |
| 3 or 4 Children | 0 (0.0%) | 0 (0.0%) |
| 5 or more Children | 0 (0.0%) | 0 (0.0%) |
| Total | 0 (0.0%) | 62 (22.4%) |
Income Below Poverty Among Married-Couple vs Single-Parent Households in Brisbane
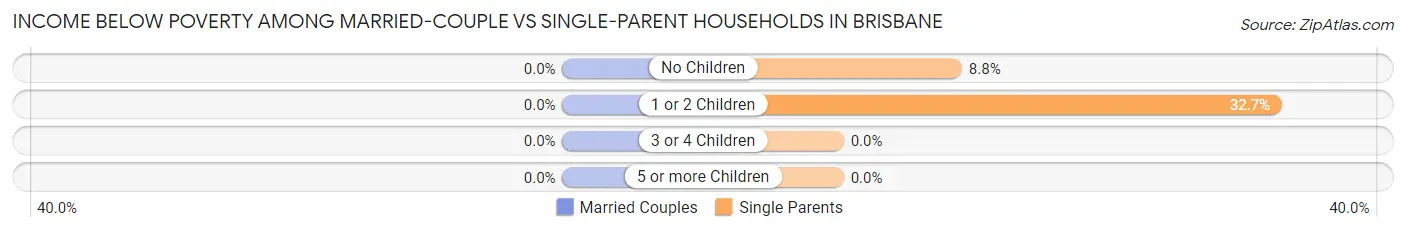
| Children | Married-Couple Families | Single-Parent Households |
| No Children | 0 (0.0%) | 14 (8.8%) |
| 1 or 2 Children | 0 (0.0%) | 48 (32.7%) |
| 3 or 4 Children | 0 (0.0%) | 0 (0.0%) |
| 5 or more Children | 0 (0.0%) | 0 (0.0%) |
| Total | 0 (0.0%) | 62 (18.5%) |
Race in Brisbane
The most populous races in Brisbane are White / Caucasian (2,271 | 47.7%), Asian (1,621 | 34.1%), and Hispanic or Latino (1,091 | 22.9%).
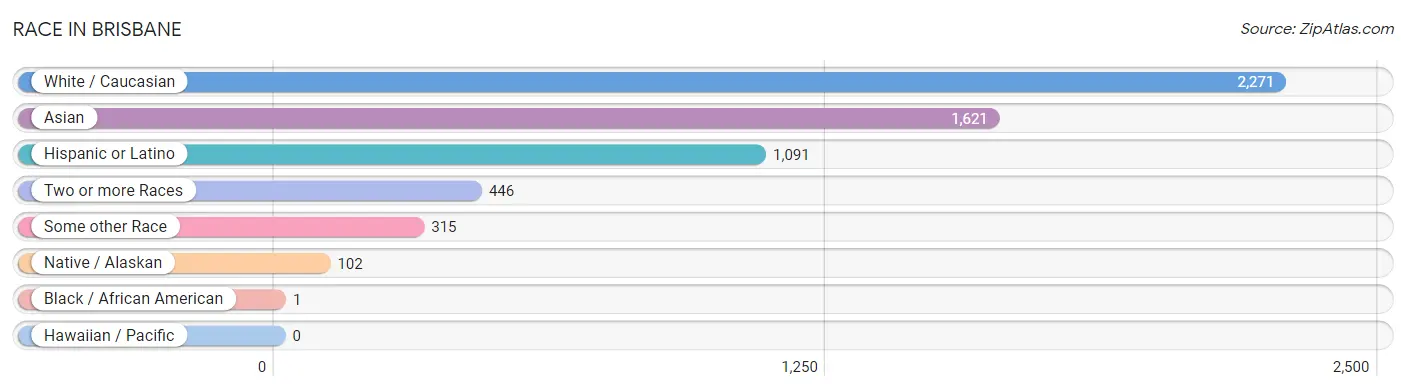
| Race | # Population | % Population |
| Asian | 1,621 | 34.1% |
| Black / African American | 1 | 0.0% |
| Hawaiian / Pacific | 0 | 0.0% |
| Hispanic or Latino | 1,091 | 22.9% |
| Native / Alaskan | 102 | 2.1% |
| White / Caucasian | 2,271 | 47.7% |
| Two or more Races | 446 | 9.4% |
| Some other Race | 315 | 6.6% |
| Total | 4,756 | 100.0% |
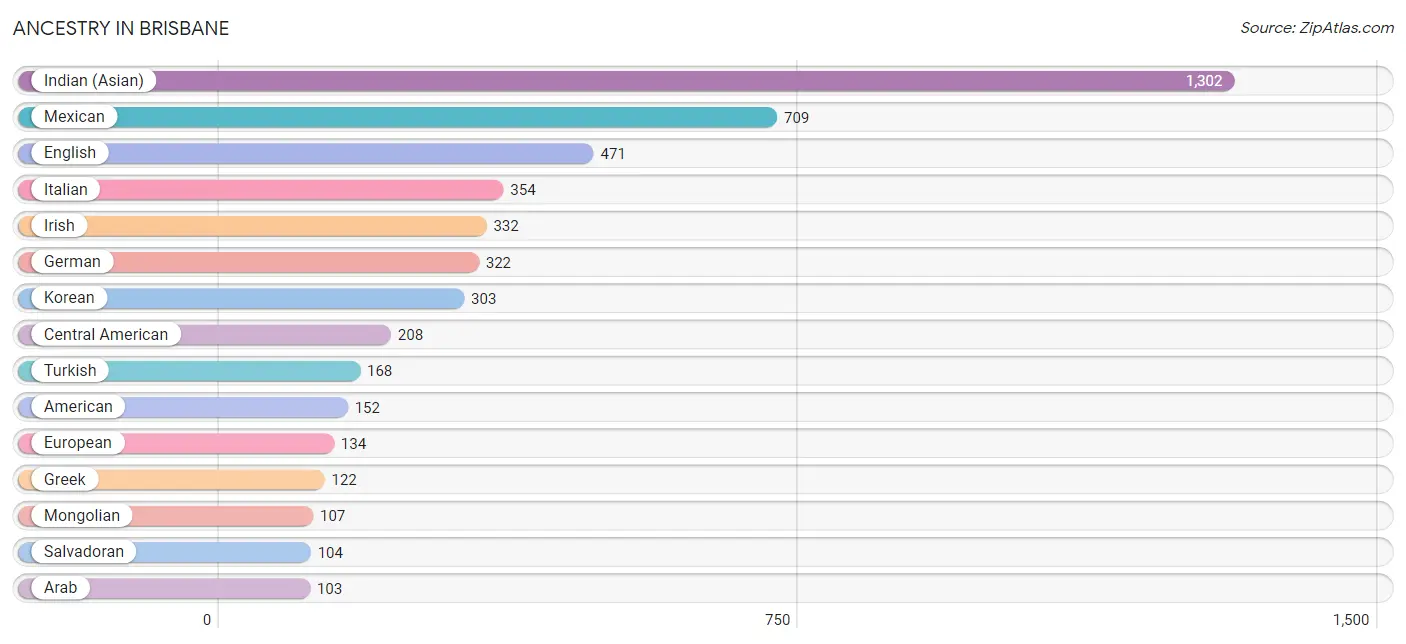
Ancestry in Brisbane
The most populous ancestries reported in Brisbane are Indian (Asian) (1,302 | 27.4%), Mexican (709 | 14.9%), English (471 | 9.9%), Italian (354 | 7.4%), and Irish (332 | 7.0%), together accounting for 66.6% of all Brisbane residents.
| Ancestry | # Population | % Population |
| American | 152 | 3.2% |
| Apache | 62 | 1.3% |
| Arab | 103 | 2.2% |
| Austrian | 29 | 0.6% |
| Bhutanese | 79 | 1.7% |
| Burmese | 14 | 0.3% |
| Canadian | 29 | 0.6% |
| Central American | 208 | 4.4% |
| Central American Indian | 35 | 0.7% |
| Cherokee | 47 | 1.0% |
| Chickasaw | 47 | 1.0% |
| Colombian | 13 | 0.3% |
| Croatian | 25 | 0.5% |
| Danish | 26 | 0.5% |
| Eastern European | 14 | 0.3% |
| English | 471 | 9.9% |
| Estonian | 43 | 0.9% |
| European | 134 | 2.8% |
| French | 59 | 1.2% |
| French Canadian | 15 | 0.3% |
| German | 322 | 6.8% |
| Greek | 122 | 2.6% |
| Guatemalan | 35 | 0.7% |
| Icelander | 42 | 0.9% |
| Indian (Asian) | 1,302 | 27.4% |
| Irish | 332 | 7.0% |
| Italian | 354 | 7.4% |
| Korean | 303 | 6.4% |
| Lebanese | 58 | 1.2% |
| Mexican | 709 | 14.9% |
| Mexican American Indian | 67 | 1.4% |
| Mongolian | 107 | 2.2% |
| Nicaraguan | 69 | 1.5% |
| Norwegian | 69 | 1.5% |
| Peruvian | 64 | 1.3% |
| Polish | 12 | 0.3% |
| Portuguese | 16 | 0.3% |
| Russian | 34 | 0.7% |
| Salvadoran | 104 | 2.2% |
| Scotch-Irish | 29 | 0.6% |
| Scottish | 67 | 1.4% |
| Serbian | 35 | 0.7% |
| South American | 98 | 2.1% |
| Spaniard | 61 | 1.3% |
| Sri Lankan | 15 | 0.3% |
| Swedish | 13 | 0.3% |
| Thai | 49 | 1.0% |
| Turkish | 168 | 3.5% |
| Ukrainian | 15 | 0.3% |
| Venezuelan | 21 | 0.4% |
| West Indian | 49 | 1.0% |
| Yugoslavian | 17 | 0.4% | View All 52 Rows |
Immigrants in Brisbane
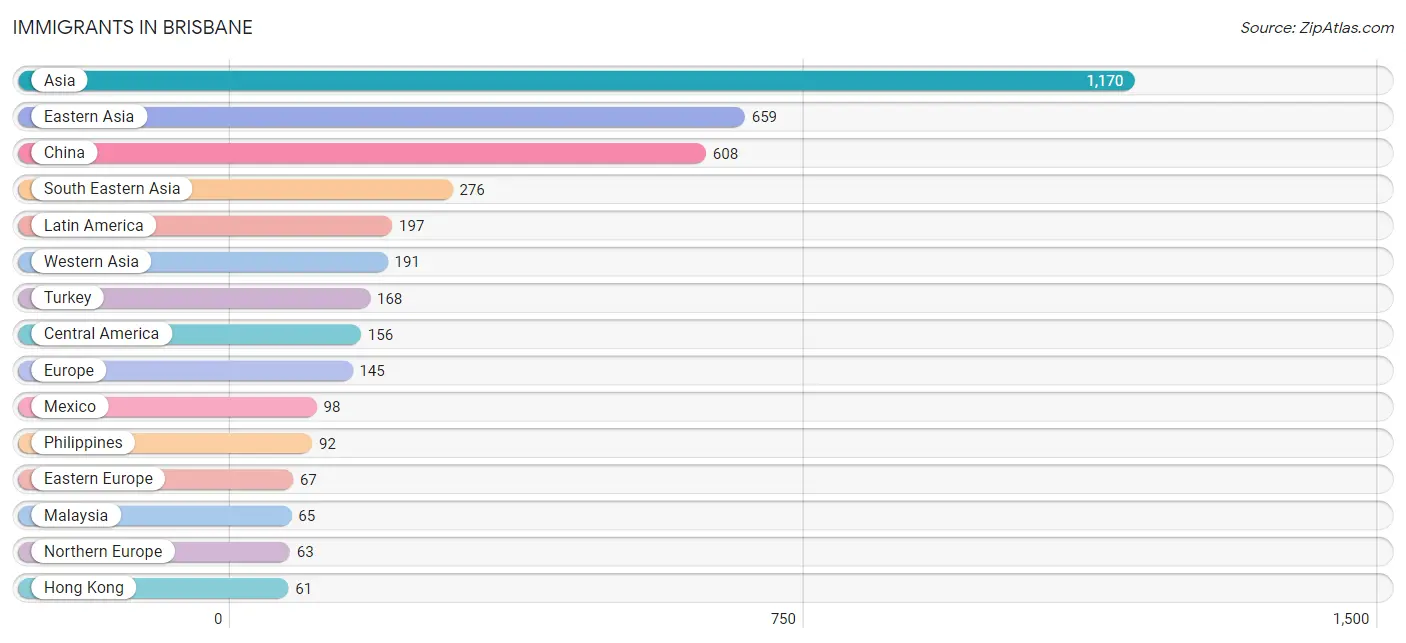
The most numerous immigrant groups reported in Brisbane came from Asia (1,170 | 24.6%), Eastern Asia (659 | 13.9%), China (608 | 12.8%), South Eastern Asia (276 | 5.8%), and Latin America (197 | 4.1%), together accounting for 61.2% of all Brisbane residents.
| Immigration Origin | # Population | % Population |
| Asia | 1,170 | 24.6% |
| Australia | 11 | 0.2% |
| Cambodia | 17 | 0.4% |
| Canada | 55 | 1.2% |
| Central America | 156 | 3.3% |
| China | 608 | 12.8% |
| Colombia | 13 | 0.3% |
| Croatia | 13 | 0.3% |
| Eastern Asia | 659 | 13.9% |
| Eastern Europe | 67 | 1.4% |
| El Salvador | 58 | 1.2% |
| England | 14 | 0.3% |
| Europe | 145 | 3.0% |
| Germany | 15 | 0.3% |
| Hong Kong | 61 | 1.3% |
| Japan | 16 | 0.3% |
| Korea | 35 | 0.7% |
| Latin America | 197 | 4.1% |
| Latvia | 19 | 0.4% |
| Lebanon | 23 | 0.5% |
| Malaysia | 65 | 1.4% |
| Mexico | 98 | 2.1% |
| Northern Europe | 63 | 1.3% |
| Oceania | 11 | 0.2% |
| Pakistan | 16 | 0.3% |
| Peru | 18 | 0.4% |
| Philippines | 92 | 1.9% |
| Serbia | 35 | 0.7% |
| South America | 41 | 0.9% |
| South Central Asia | 16 | 0.3% |
| South Eastern Asia | 276 | 5.8% |
| Taiwan | 13 | 0.3% |
| Turkey | 168 | 3.5% |
| Venezuela | 10 | 0.2% |
| Vietnam | 58 | 1.2% |
| Western Asia | 191 | 4.0% |
| Western Europe | 15 | 0.3% | View All 37 Rows |
Sex and Age in Brisbane
Sex and Age in Brisbane
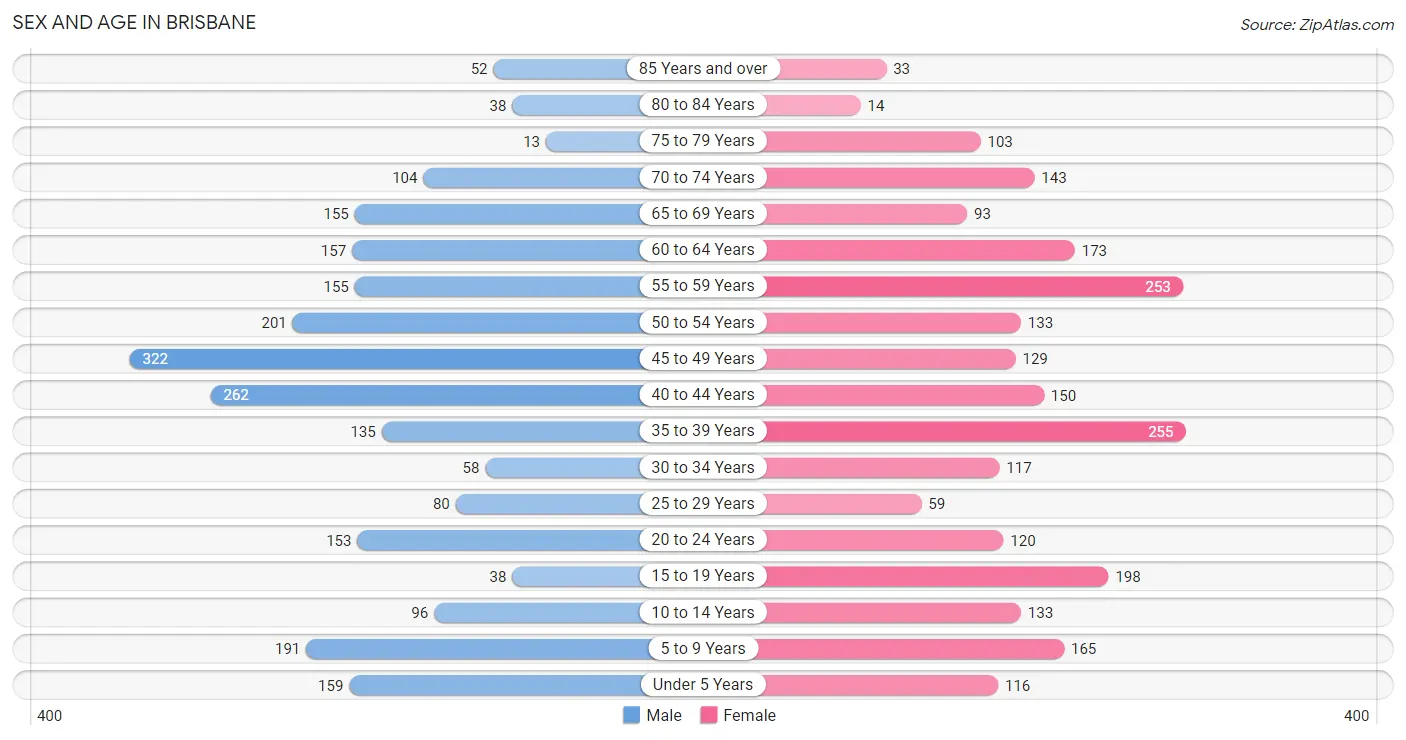
The most populous age groups in Brisbane are 45 to 49 Years (322 | 13.6%) for men and 35 to 39 Years (255 | 10.7%) for women.
| Age Bracket | Male | Female |
| Under 5 Years | 159 (6.7%) | 116 (4.9%) |
| 5 to 9 Years | 191 (8.1%) | 165 (6.9%) |
| 10 to 14 Years | 96 (4.1%) | 133 (5.6%) |
| 15 to 19 Years | 38 (1.6%) | 198 (8.3%) |
| 20 to 24 Years | 153 (6.5%) | 120 (5.0%) |
| 25 to 29 Years | 80 (3.4%) | 59 (2.5%) |
| 30 to 34 Years | 58 (2.5%) | 117 (4.9%) |
| 35 to 39 Years | 135 (5.7%) | 255 (10.7%) |
| 40 to 44 Years | 262 (11.1%) | 150 (6.3%) |
| 45 to 49 Years | 322 (13.6%) | 129 (5.4%) |
| 50 to 54 Years | 201 (8.5%) | 133 (5.6%) |
| 55 to 59 Years | 155 (6.5%) | 253 (10.6%) |
| 60 to 64 Years | 157 (6.6%) | 173 (7.2%) |
| 65 to 69 Years | 155 (6.5%) | 93 (3.9%) |
| 70 to 74 Years | 104 (4.4%) | 143 (6.0%) |
| 75 to 79 Years | 13 (0.5%) | 103 (4.3%) |
| 80 to 84 Years | 38 (1.6%) | 14 (0.6%) |
| 85 Years and over | 52 (2.2%) | 33 (1.4%) |
| Total | 2,369 (100.0%) | 2,387 (100.0%) |
Families and Households in Brisbane
Median Family Size in Brisbane
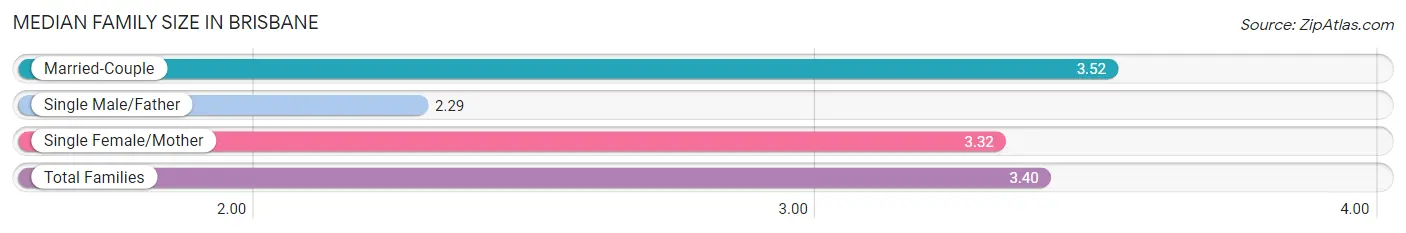
The median family size in Brisbane is 3.40 persons per family, with married-couple families (737 | 68.8%) accounting for the largest median family size of 3.52 persons per family. On the other hand, single male/father families (58 | 5.4%) represent the smallest median family size with 2.29 persons per family.
| Family Type | # Families | Family Size |
| Married-Couple | 737 (68.8%) | 3.52 |
| Single Male/Father | 58 (5.4%) | 2.29 |
| Single Female/Mother | 277 (25.8%) | 3.32 |
| Total Families | 1,072 (100.0%) | 3.40 |
Median Household Size in Brisbane
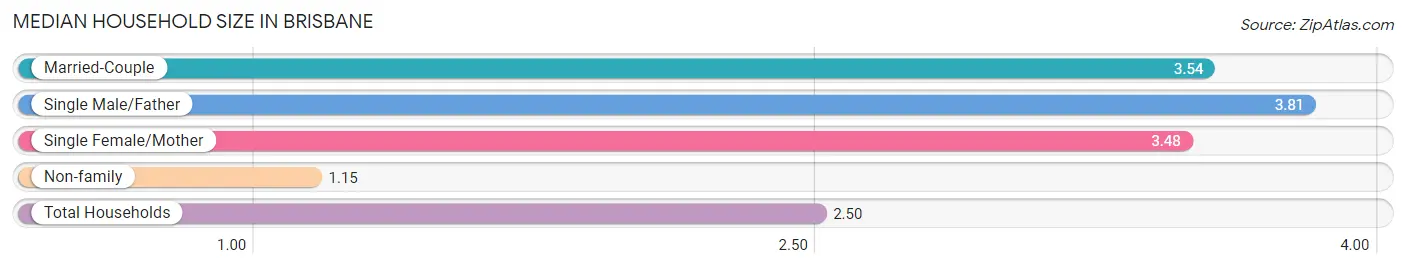
The median household size in Brisbane is 2.50 persons per household, with single male/father households (58 | 3.0%) accounting for the largest median household size of 3.81 persons per household. non-family households (830 | 43.6%) represent the smallest median household size with 1.15 persons per household.
| Household Type | # Households | Household Size |
| Married-Couple | 737 (38.8%) | 3.54 |
| Single Male/Father | 58 (3.0%) | 3.81 |
| Single Female/Mother | 277 (14.6%) | 3.48 |
| Non-family | 830 (43.6%) | 1.15 |
| Total Households | 1,902 (100.0%) | 2.50 |
Household Size by Marriage Status in Brisbane
Out of a total of 1,902 households in Brisbane, 1,072 (56.4%) are family households, while 830 (43.6%) are nonfamily households. The most numerous type of family households are 2-person households, comprising 426, and the most common type of nonfamily households are 1-person households, comprising 732.
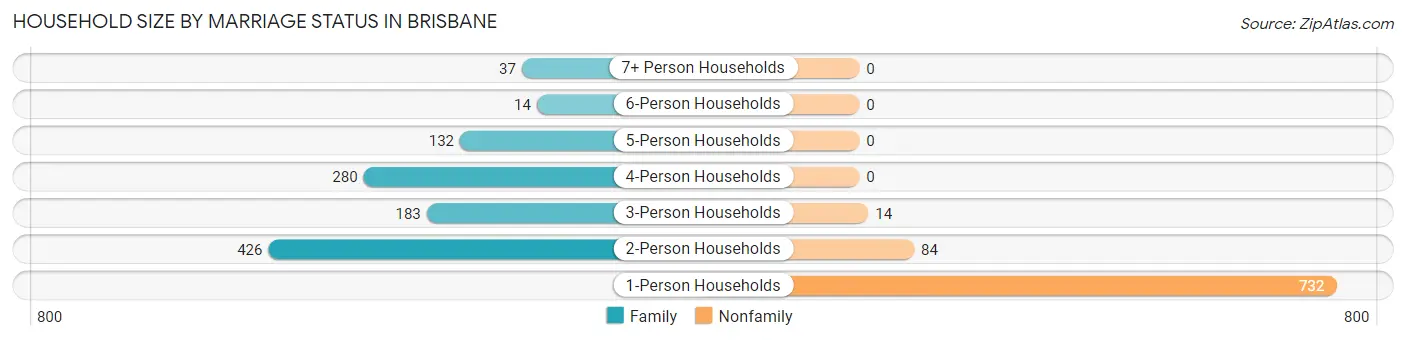
| Household Size | Family Households | Nonfamily Households |
| 1-Person Households | - | 732 (38.5%) |
| 2-Person Households | 426 (22.4%) | 84 (4.4%) |
| 3-Person Households | 183 (9.6%) | 14 (0.7%) |
| 4-Person Households | 280 (14.7%) | 0 (0.0%) |
| 5-Person Households | 132 (6.9%) | 0 (0.0%) |
| 6-Person Households | 14 (0.7%) | 0 (0.0%) |
| 7+ Person Households | 37 (1.9%) | 0 (0.0%) |
| Total | 1,072 (56.4%) | 830 (43.6%) |
Female Fertility in Brisbane
Fertility by Age in Brisbane
Average fertility rate in Brisbane is 64.0 births per 1,000 women. Women in the age bracket of 20 to 34 years have the highest fertility rate with 142.0 births per 1,000 women. Women in the age bracket of 20 to 34 years acount for 62.7% of all women with births.
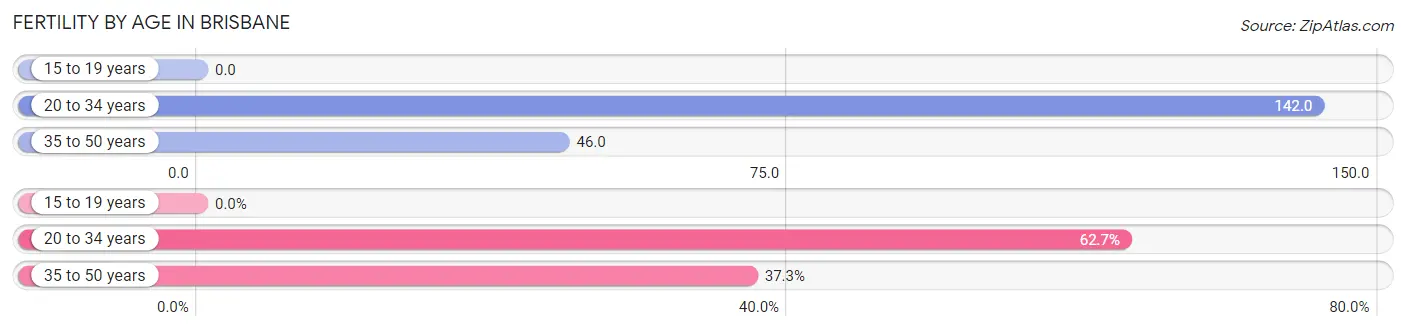
| Age Bracket | Women with Births | Births / 1,000 Women |
| 15 to 19 years | 0 (0.0%) | 0.0 |
| 20 to 34 years | 42 (62.7%) | 142.0 |
| 35 to 50 years | 25 (37.3%) | 46.0 |
| Total | 67 (100.0%) | 64.0 |
Fertility by Age by Marriage Status in Brisbane
53.7% of women with births (67) in Brisbane are married. The highest percentage of unmarried women with births falls into 20 to 34 years age bracket with 73.8% of them unmarried at the time of birth, while the lowest percentage of unmarried women with births belong to 35 to 50 years age bracket with 0.0% of them unmarried.
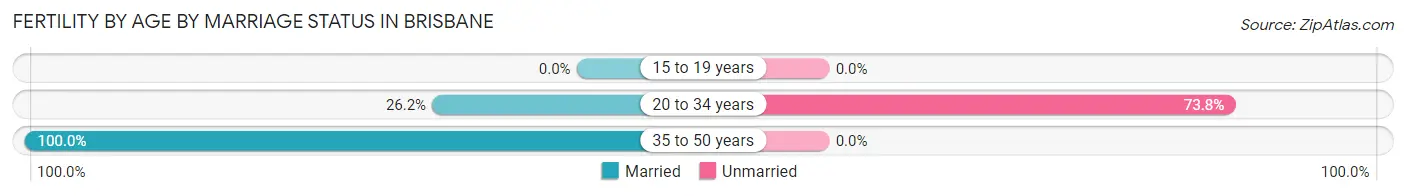
| Age Bracket | Married | Unmarried |
| 15 to 19 years | 0 (0.0%) | 0 (0.0%) |
| 20 to 34 years | 11 (26.2%) | 31 (73.8%) |
| 35 to 50 years | 25 (100.0%) | 0 (0.0%) |
| Total | 36 (53.7%) | 31 (46.3%) |
Fertility by Education in Brisbane
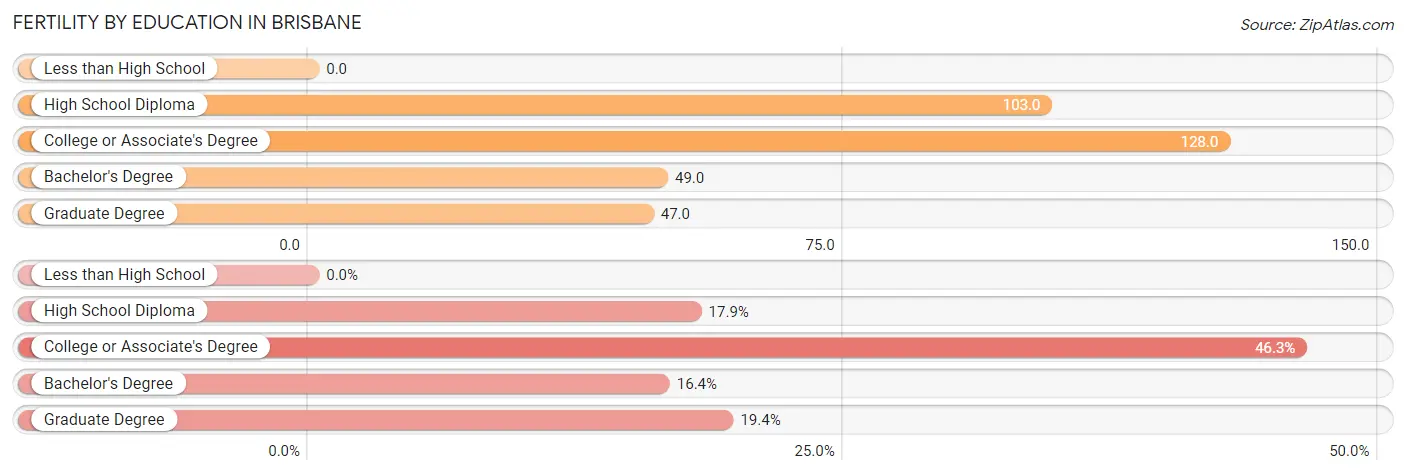
| Educational Attainment | Women with Births | Births / 1,000 Women |
| Less than High School | 0 (0.0%) | 0.0 |
| High School Diploma | 12 (17.9%) | 103.0 |
| College or Associate's Degree | 31 (46.3%) | 128.0 |
| Bachelor's Degree | 11 (16.4%) | 49.0 |
| Graduate Degree | 13 (19.4%) | 47.0 |
| Total | 67 (100.0%) | 64.0 |
Fertility by Education by Marriage Status in Brisbane
46.3% of women with births in Brisbane are unmarried. Women with the educational attainment of high school diploma are most likely to be married with 100.0% of them married at childbirth, while women with the educational attainment of college or associate's degree are least likely to be married with 100.0% of them unmarried at childbirth.
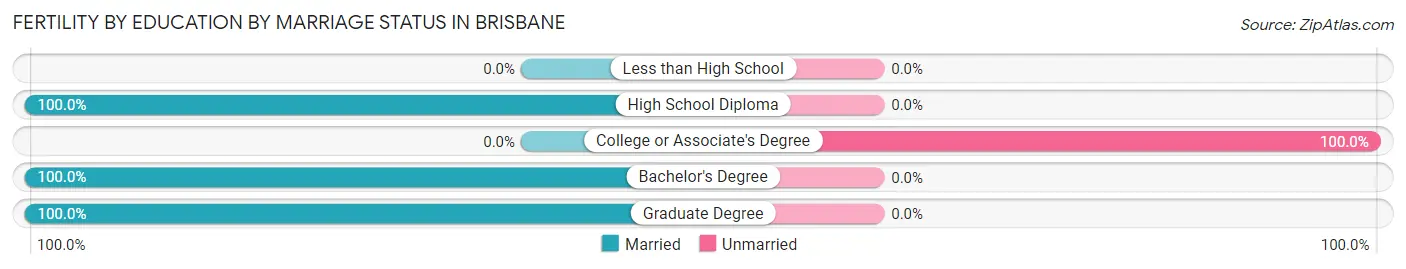
| Educational Attainment | Married | Unmarried |
| Less than High School | 0 (0.0%) | 0 (0.0%) |
| High School Diploma | 12 (100.0%) | 0 (0.0%) |
| College or Associate's Degree | 0 (0.0%) | 31 (100.0%) |
| Bachelor's Degree | 11 (100.0%) | 0 (0.0%) |
| Graduate Degree | 13 (100.0%) | 0 (0.0%) |
| Total | 36 (53.7%) | 31 (46.3%) |
Employment Characteristics in Brisbane
Employment by Class of Employer in Brisbane
Among the 2,325 employed individuals in Brisbane, private company employees (1,554 | 66.8%), not-for-profit organizations (218 | 9.4%), and local government employees (189 | 8.1%) make up the most common classes of employment.
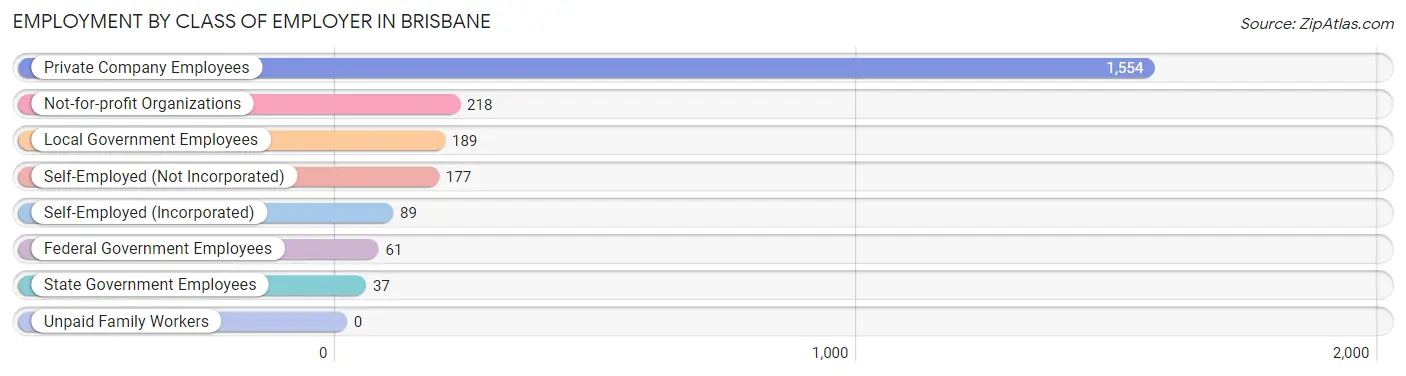
| Employer Class | # Employees | % Employees |
| Private Company Employees | 1,554 | 66.8% |
| Self-Employed (Incorporated) | 89 | 3.8% |
| Self-Employed (Not Incorporated) | 177 | 7.6% |
| Not-for-profit Organizations | 218 | 9.4% |
| Local Government Employees | 189 | 8.1% |
| State Government Employees | 37 | 1.6% |
| Federal Government Employees | 61 | 2.6% |
| Unpaid Family Workers | 0 | 0.0% |
| Total | 2,325 | 100.0% |
Employment Status by Age in Brisbane
According to the labor force statistics for Brisbane, out of the total population over 16 years of age (3,873), 68.8% or 2,665 individuals are in the labor force, with 9.9% or 264 of them unemployed. The age group with the highest labor force participation rate is 45 to 54 years, with 96.7% or 759 individuals in the labor force. Within the labor force, the 45 to 54 years age range has the highest percentage of unemployed individuals, with 23.8% or 181 of them being unemployed.
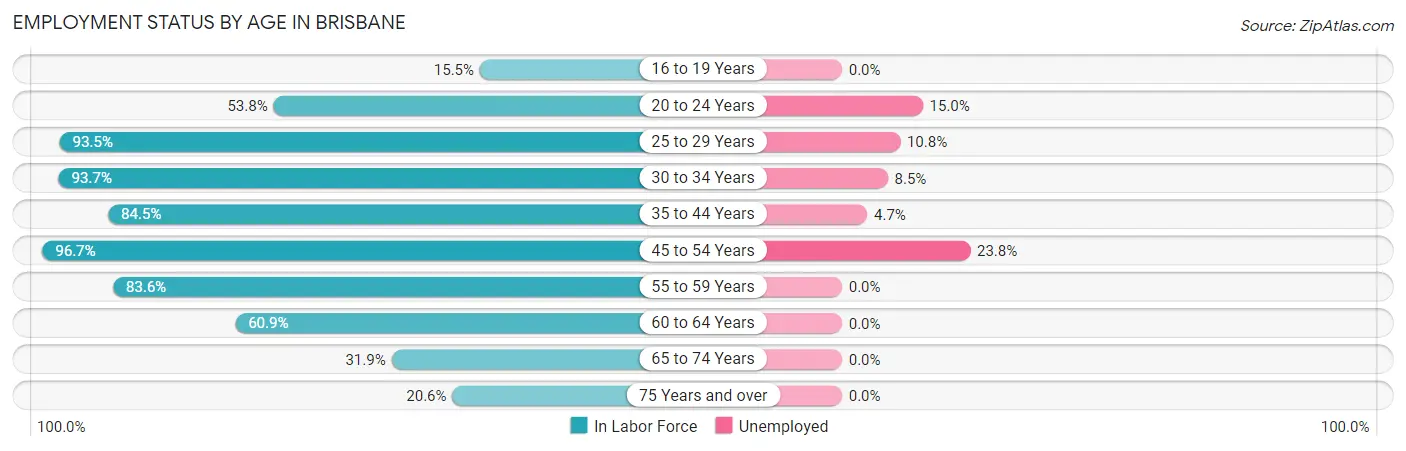
| Age Bracket | In Labor Force | Unemployed |
| 16 to 19 Years | 33 (15.5%) | 0 (0.0%) |
| 20 to 24 Years | 147 (53.8%) | 22 (15.0%) |
| 25 to 29 Years | 130 (93.5%) | 14 (10.8%) |
| 30 to 34 Years | 164 (93.7%) | 14 (8.5%) |
| 35 to 44 Years | 678 (84.5%) | 32 (4.7%) |
| 45 to 54 Years | 759 (96.7%) | 181 (23.8%) |
| 55 to 59 Years | 341 (83.6%) | 0 (0.0%) |
| 60 to 64 Years | 201 (60.9%) | 0 (0.0%) |
| 65 to 74 Years | 158 (31.9%) | 0 (0.0%) |
| 75 Years and over | 52 (20.6%) | 0 (0.0%) |
| Total | 2,665 (68.8%) | 264 (9.9%) |
Employment Status by Educational Attainment in Brisbane
According to labor force statistics for Brisbane, 86.1% of individuals (2,272) out of the total population between 25 and 64 years of age (2,639) are in the labor force, with 10.6% or 241 of them being unemployed. The group with the highest labor force participation rate are those with the educational attainment of high school diploma, with 88.4% or 335 individuals in the labor force. Within the labor force, individuals with high school diploma education have the highest percentage of unemployment, with 50.1% or 168 of them being unemployed.
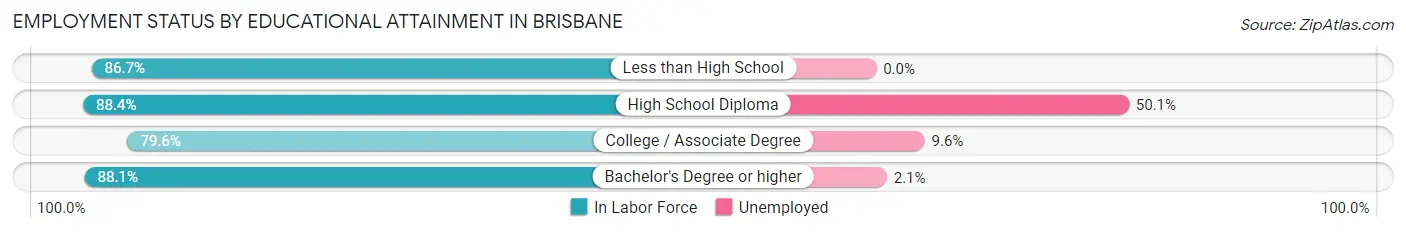
| Educational Attainment | In Labor Force | Unemployed |
| Less than High School | 157 (86.7%) | 0 (0.0%) |
| High School Diploma | 335 (88.4%) | 190 (50.1%) |
| College / Associate Degree | 480 (79.6%) | 58 (9.6%) |
| Bachelor's Degree or higher | 1,300 (88.1%) | 31 (2.1%) |
| Total | 2,272 (86.1%) | 280 (10.6%) |
Employment Occupations by Sex in Brisbane
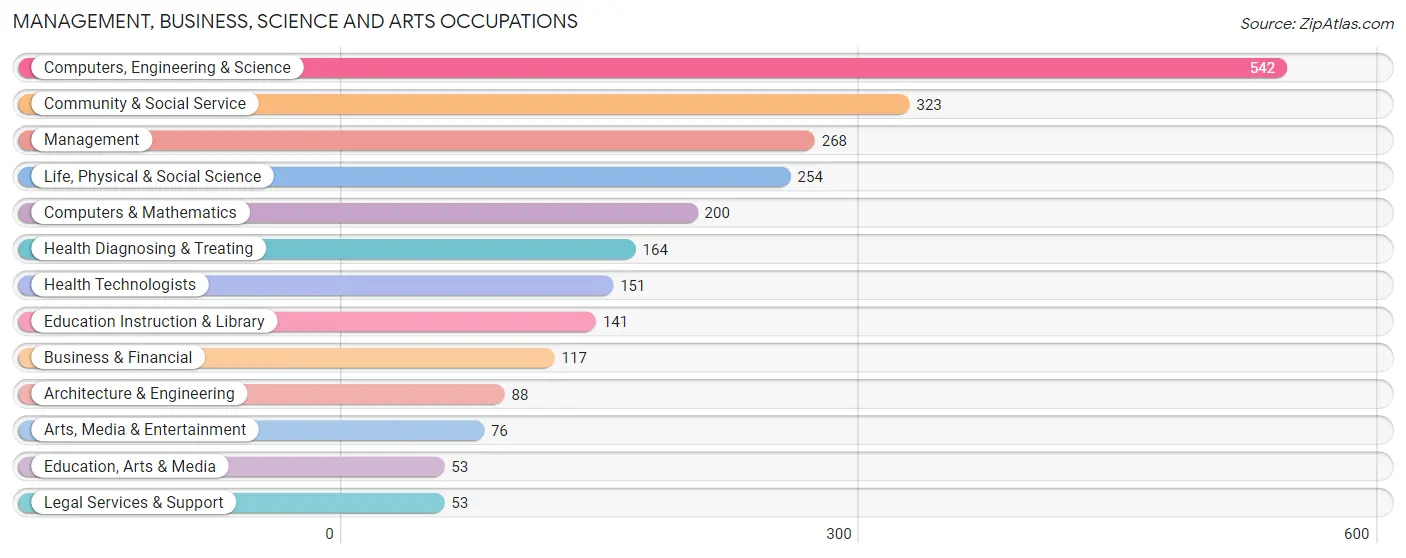
Management, Business, Science and Arts Occupations
The most common Management, Business, Science and Arts occupations in Brisbane are Computers, Engineering & Science (542 | 22.6%), Community & Social Service (323 | 13.5%), Management (268 | 11.2%), Life, Physical & Social Science (254 | 10.6%), and Computers & Mathematics (200 | 8.3%).
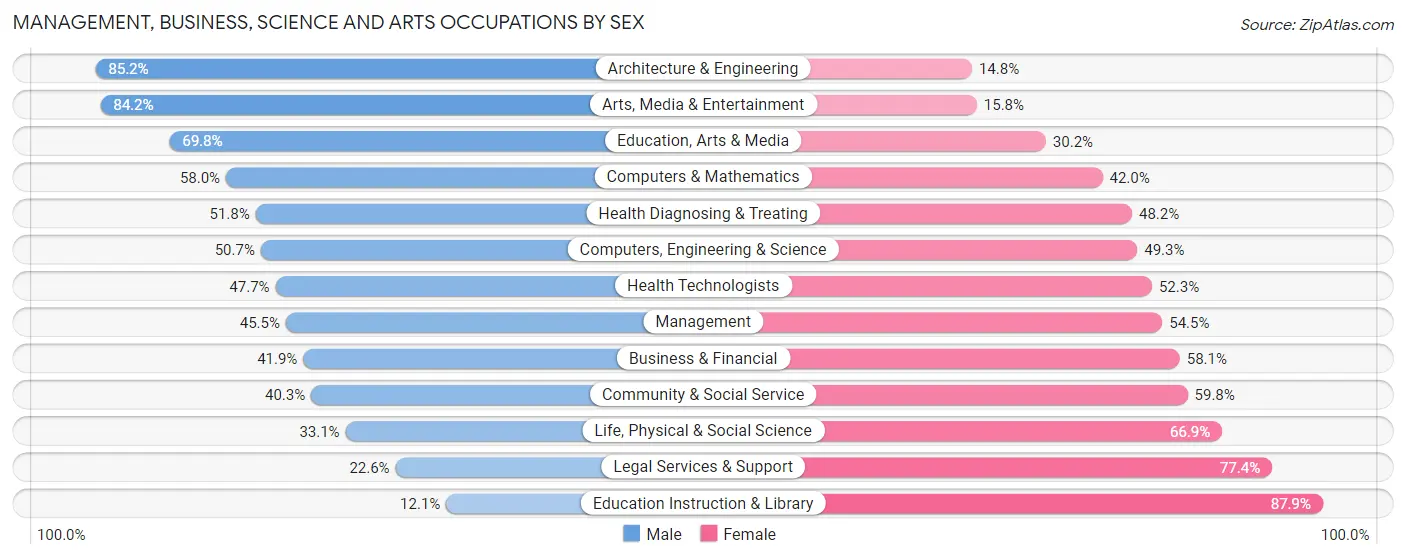
Management, Business, Science and Arts Occupations by Sex
Within the Management, Business, Science and Arts occupations in Brisbane, the most male-oriented occupations are Architecture & Engineering (85.2%), Arts, Media & Entertainment (84.2%), and Education, Arts & Media (69.8%), while the most female-oriented occupations are Education Instruction & Library (87.9%), Legal Services & Support (77.4%), and Life, Physical & Social Science (66.9%).
| Occupation | Male | Female |
| Management | 122 (45.5%) | 146 (54.5%) |
| Business & Financial | 49 (41.9%) | 68 (58.1%) |
| Computers, Engineering & Science | 275 (50.7%) | 267 (49.3%) |
| Computers & Mathematics | 116 (58.0%) | 84 (42.0%) |
| Architecture & Engineering | 75 (85.2%) | 13 (14.8%) |
| Life, Physical & Social Science | 84 (33.1%) | 170 (66.9%) |
| Community & Social Service | 130 (40.3%) | 193 (59.8%) |
| Education, Arts & Media | 37 (69.8%) | 16 (30.2%) |
| Legal Services & Support | 12 (22.6%) | 41 (77.4%) |
| Education Instruction & Library | 17 (12.1%) | 124 (87.9%) |
| Arts, Media & Entertainment | 64 (84.2%) | 12 (15.8%) |
| Health Diagnosing & Treating | 85 (51.8%) | 79 (48.2%) |
| Health Technologists | 72 (47.7%) | 79 (52.3%) |
| Total (Category) | 661 (46.8%) | 753 (53.2%) |
| Total (Overall) | 1,258 (52.4%) | 1,142 (47.6%) |
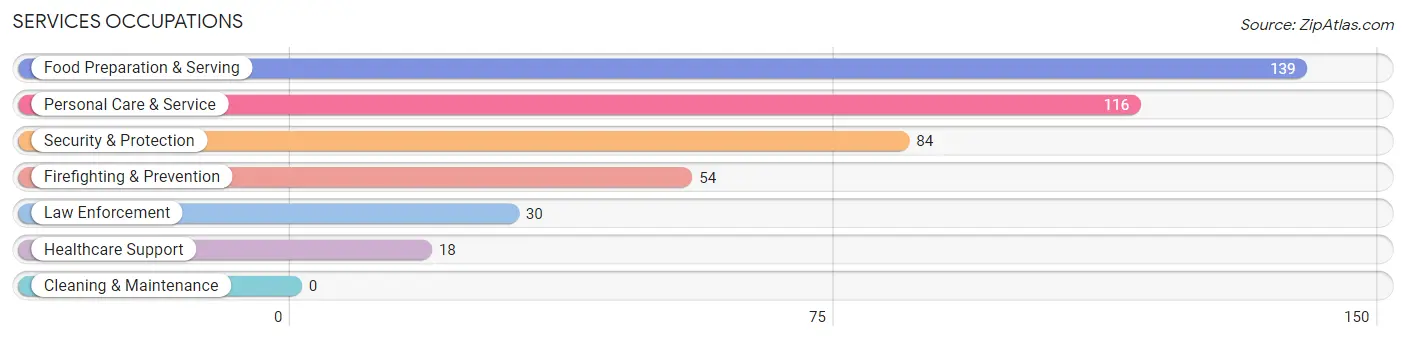
Services Occupations
The most common Services occupations in Brisbane are Food Preparation & Serving (139 | 5.8%), Personal Care & Service (116 | 4.8%), Security & Protection (84 | 3.5%), Firefighting & Prevention (54 | 2.2%), and Law Enforcement (30 | 1.3%).
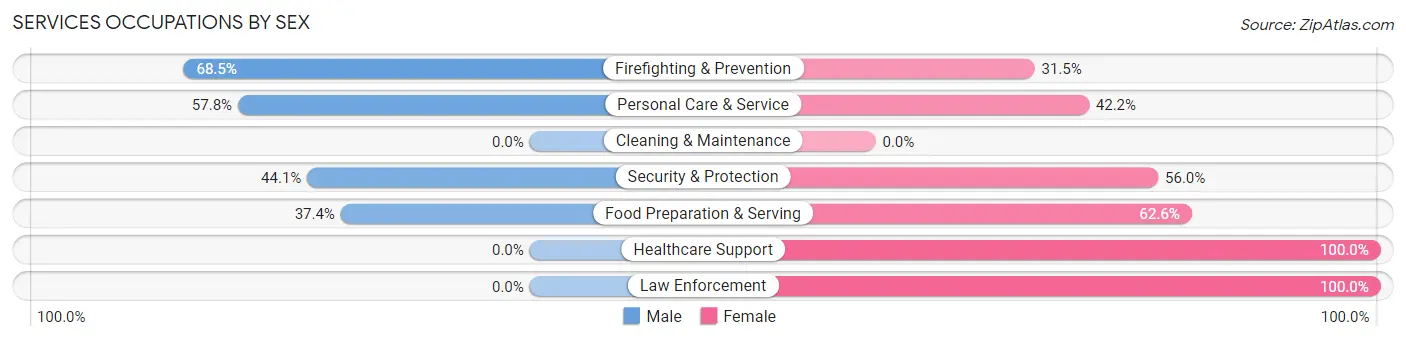
Services Occupations by Sex
Within the Services occupations in Brisbane, the most male-oriented occupations are Firefighting & Prevention (68.5%), Personal Care & Service (57.8%), and Security & Protection (44.1%), while the most female-oriented occupations are Healthcare Support (100.0%), Law Enforcement (100.0%), and Food Preparation & Serving (62.6%).
| Occupation | Male | Female |
| Healthcare Support | 0 (0.0%) | 18 (100.0%) |
| Security & Protection | 37 (44.1%) | 47 (55.9%) |
| Firefighting & Prevention | 37 (68.5%) | 17 (31.5%) |
| Law Enforcement | 0 (0.0%) | 30 (100.0%) |
| Food Preparation & Serving | 52 (37.4%) | 87 (62.6%) |
| Cleaning & Maintenance | 0 (0.0%) | 0 (0.0%) |
| Personal Care & Service | 67 (57.8%) | 49 (42.2%) |
| Total (Category) | 156 (43.7%) | 201 (56.3%) |
| Total (Overall) | 1,258 (52.4%) | 1,142 (47.6%) |
Sales and Office Occupations
The most common Sales and Office occupations in Brisbane are Sales & Related (204 | 8.5%), and Office & Administration (192 | 8.0%).
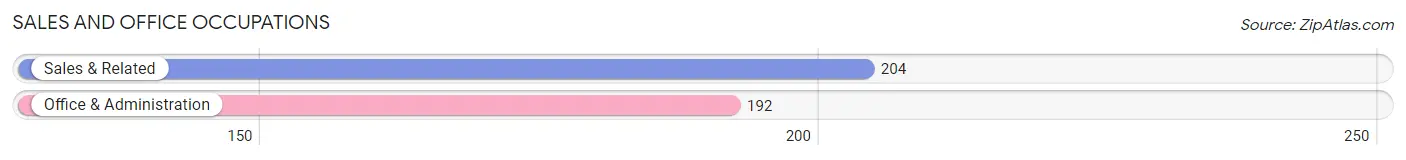
Sales and Office Occupations by Sex
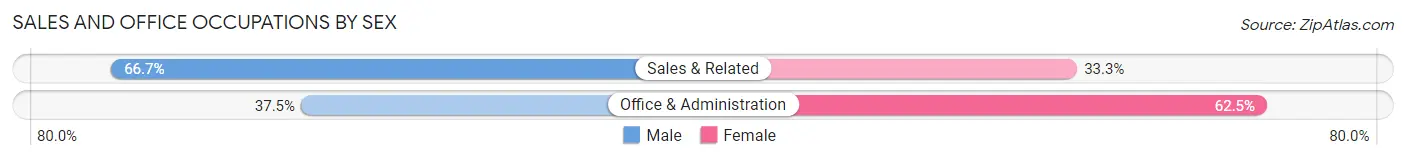
| Occupation | Male | Female |
| Sales & Related | 136 (66.7%) | 68 (33.3%) |
| Office & Administration | 72 (37.5%) | 120 (62.5%) |
| Total (Category) | 208 (52.5%) | 188 (47.5%) |
| Total (Overall) | 1,258 (52.4%) | 1,142 (47.6%) |
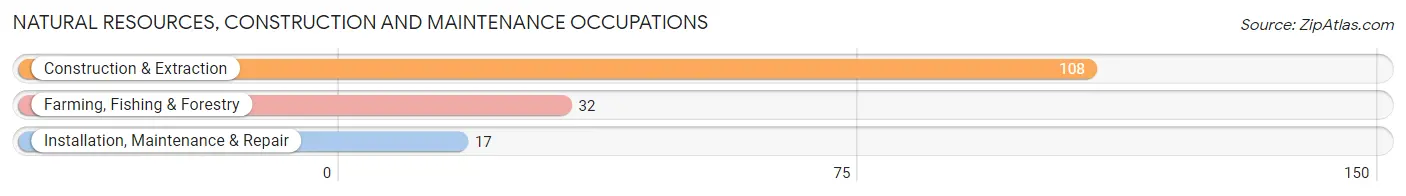
Natural Resources, Construction and Maintenance Occupations
The most common Natural Resources, Construction and Maintenance occupations in Brisbane are Construction & Extraction (108 | 4.5%), Farming, Fishing & Forestry (32 | 1.3%), and Installation, Maintenance & Repair (17 | 0.7%).
Natural Resources, Construction and Maintenance Occupations by Sex
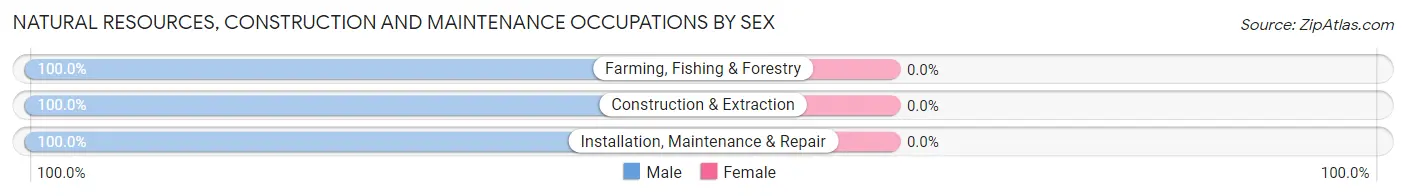
| Occupation | Male | Female |
| Farming, Fishing & Forestry | 32 (100.0%) | 0 (0.0%) |
| Construction & Extraction | 108 (100.0%) | 0 (0.0%) |
| Installation, Maintenance & Repair | 17 (100.0%) | 0 (0.0%) |
| Total (Category) | 157 (100.0%) | 0 (0.0%) |
| Total (Overall) | 1,258 (52.4%) | 1,142 (47.6%) |
Production, Transportation and Moving Occupations
The most common Production, Transportation and Moving occupations in Brisbane are Production (49 | 2.0%), and Transportation (27 | 1.1%).
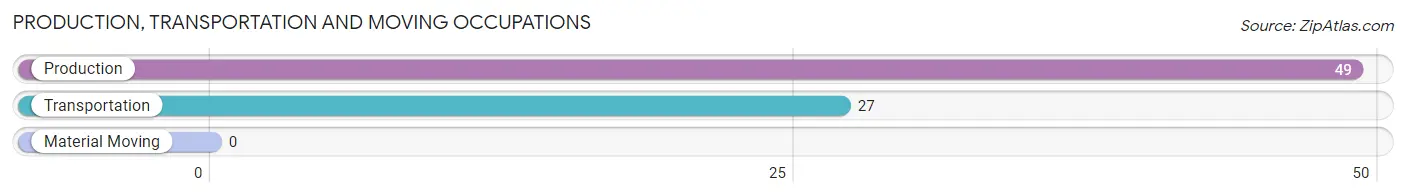
Production, Transportation and Moving Occupations by Sex
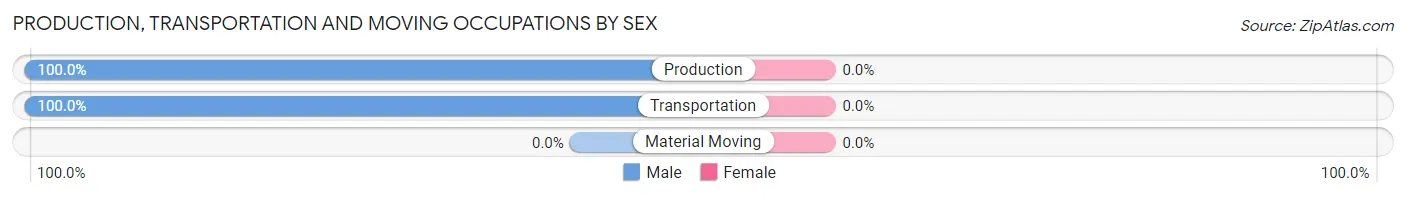
| Occupation | Male | Female |
| Production | 49 (100.0%) | 0 (0.0%) |
| Transportation | 27 (100.0%) | 0 (0.0%) |
| Material Moving | 0 (0.0%) | 0 (0.0%) |
| Total (Category) | 76 (100.0%) | 0 (0.0%) |
| Total (Overall) | 1,258 (52.4%) | 1,142 (47.6%) |
Employment Industries by Sex in Brisbane
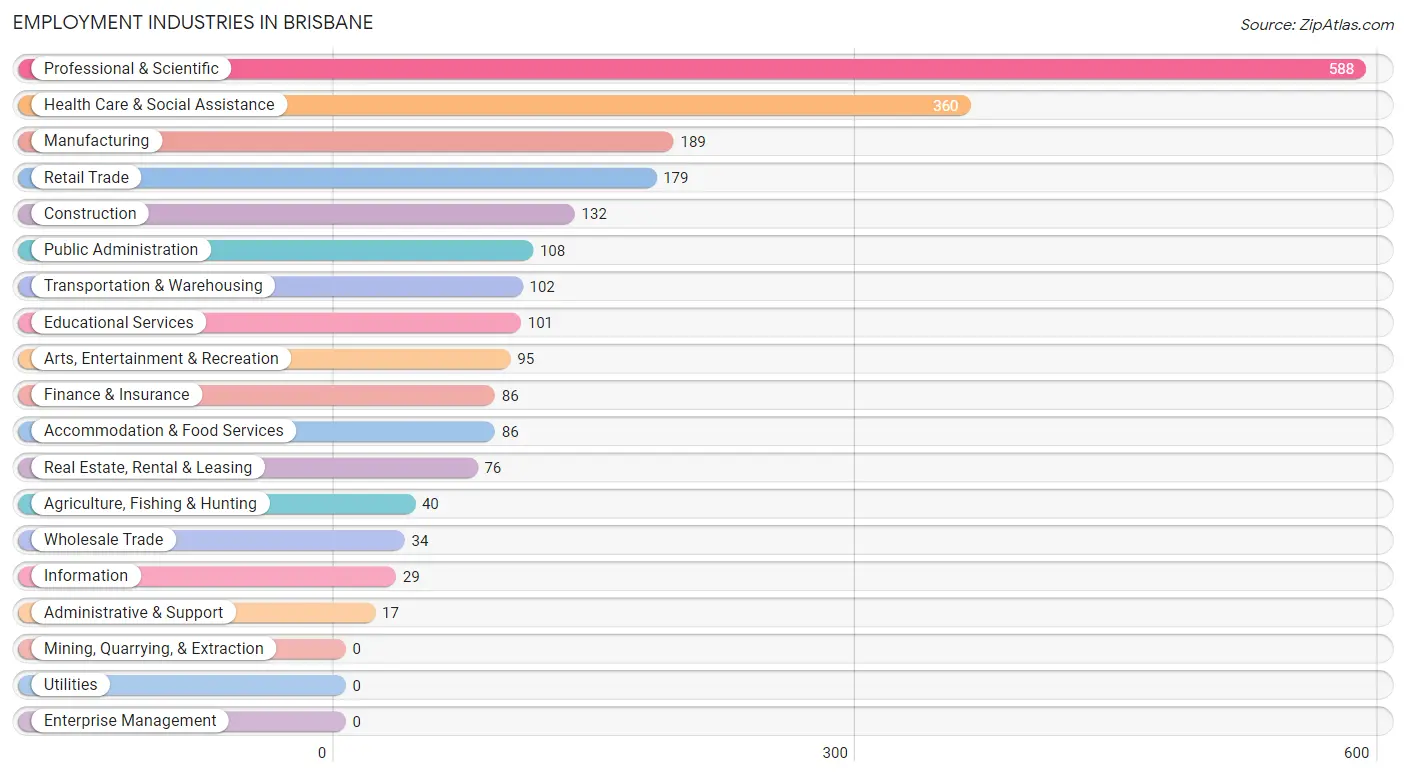
Employment Industries in Brisbane
The major employment industries in Brisbane include Professional & Scientific (588 | 24.5%), Health Care & Social Assistance (360 | 15.0%), Manufacturing (189 | 7.9%), Retail Trade (179 | 7.5%), and Construction (132 | 5.5%).
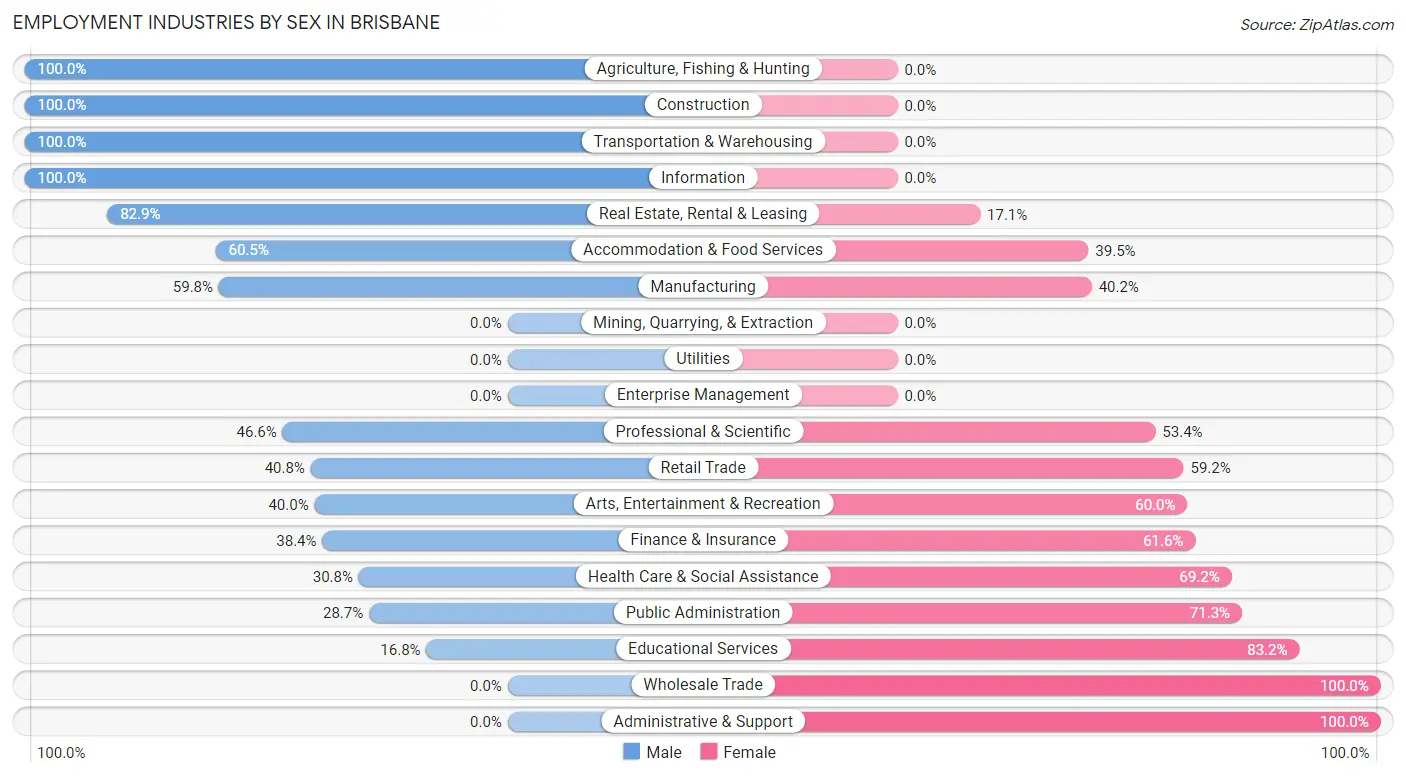
Employment Industries by Sex in Brisbane
The Brisbane industries that see more men than women are Agriculture, Fishing & Hunting (100.0%), Construction (100.0%), and Transportation & Warehousing (100.0%), whereas the industries that tend to have a higher number of women are Wholesale Trade (100.0%), Administrative & Support (100.0%), and Educational Services (83.2%).
| Industry | Male | Female |
| Agriculture, Fishing & Hunting | 40 (100.0%) | 0 (0.0%) |
| Mining, Quarrying, & Extraction | 0 (0.0%) | 0 (0.0%) |
| Construction | 132 (100.0%) | 0 (0.0%) |
| Manufacturing | 113 (59.8%) | 76 (40.2%) |
| Wholesale Trade | 0 (0.0%) | 34 (100.0%) |
| Retail Trade | 73 (40.8%) | 106 (59.2%) |
| Transportation & Warehousing | 102 (100.0%) | 0 (0.0%) |
| Utilities | 0 (0.0%) | 0 (0.0%) |
| Information | 29 (100.0%) | 0 (0.0%) |
| Finance & Insurance | 33 (38.4%) | 53 (61.6%) |
| Real Estate, Rental & Leasing | 63 (82.9%) | 13 (17.1%) |
| Professional & Scientific | 274 (46.6%) | 314 (53.4%) |
| Enterprise Management | 0 (0.0%) | 0 (0.0%) |
| Administrative & Support | 0 (0.0%) | 17 (100.0%) |
| Educational Services | 17 (16.8%) | 84 (83.2%) |
| Health Care & Social Assistance | 111 (30.8%) | 249 (69.2%) |
| Arts, Entertainment & Recreation | 38 (40.0%) | 57 (60.0%) |
| Accommodation & Food Services | 52 (60.5%) | 34 (39.5%) |
| Public Administration | 31 (28.7%) | 77 (71.3%) |
| Total | 1,258 (52.4%) | 1,142 (47.6%) |
Education in Brisbane
School Enrollment in Brisbane
The most common levels of schooling among the 1,192 students in Brisbane are college / undergraduate (316 | 26.5%), elementary school (270 | 22.7%), and high school (237 | 19.9%).
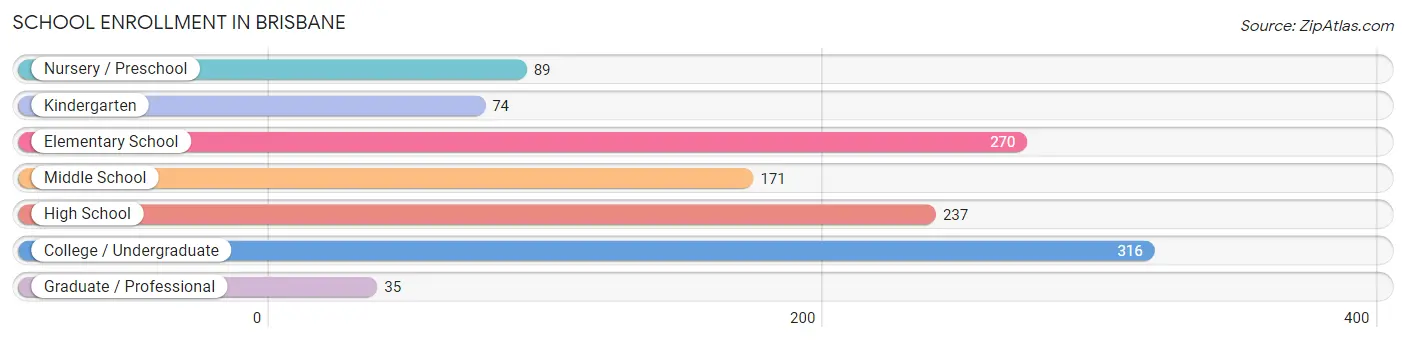
| School Level | # Students | % Students |
| Nursery / Preschool | 89 | 7.5% |
| Kindergarten | 74 | 6.2% |
| Elementary School | 270 | 22.7% |
| Middle School | 171 | 14.3% |
| High School | 237 | 19.9% |
| College / Undergraduate | 316 | 26.5% |
| Graduate / Professional | 35 | 2.9% |
| Total | 1,192 | 100.0% |
School Enrollment by Age by Funding Source in Brisbane
Out of a total of 1,192 students who are enrolled in schools in Brisbane, 237 (19.9%) attend a private institution, while the remaining 955 (80.1%) are enrolled in public schools. The age group of 3 to 4 year olds has the highest likelihood of being enrolled in private schools, with 28 (42.4% in the age bracket) enrolled. Conversely, the age group of 20 to 24 year olds has the lowest likelihood of being enrolled in a private school, with 162 (100.0% in the age bracket) attending a public institution.
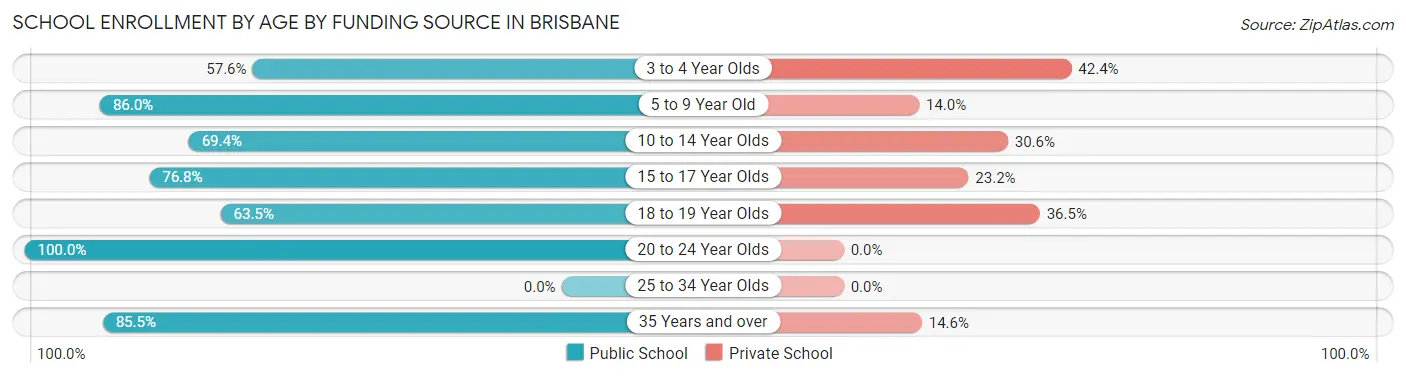
| Age Bracket | Public School | Private School |
| 3 to 4 Year Olds | 38 (57.6%) | 28 (42.4%) |
| 5 to 9 Year Old | 306 (86.0%) | 50 (14.0%) |
| 10 to 14 Year Olds | 159 (69.4%) | 70 (30.6%) |
| 15 to 17 Year Olds | 76 (76.8%) | 23 (23.2%) |
| 18 to 19 Year Olds | 73 (63.5%) | 42 (36.5%) |
| 20 to 24 Year Olds | 162 (100.0%) | 0 (0.0%) |
| 25 to 34 Year Olds | 0 (0.0%) | 0 (0.0%) |
| 35 Years and over | 141 (85.5%) | 24 (14.5%) |
| Total | 955 (80.1%) | 237 (19.9%) |
Educational Attainment by Field of Study in Brisbane
Bio, nature & agricultural (311 | 15.6%), social sciences (261 | 13.1%), business (250 | 12.5%), visual & performing arts (226 | 11.3%), and computers & mathematics (190 | 9.5%) are the most common fields of study among 1,996 individuals in Brisbane who have obtained a bachelor's degree or higher.
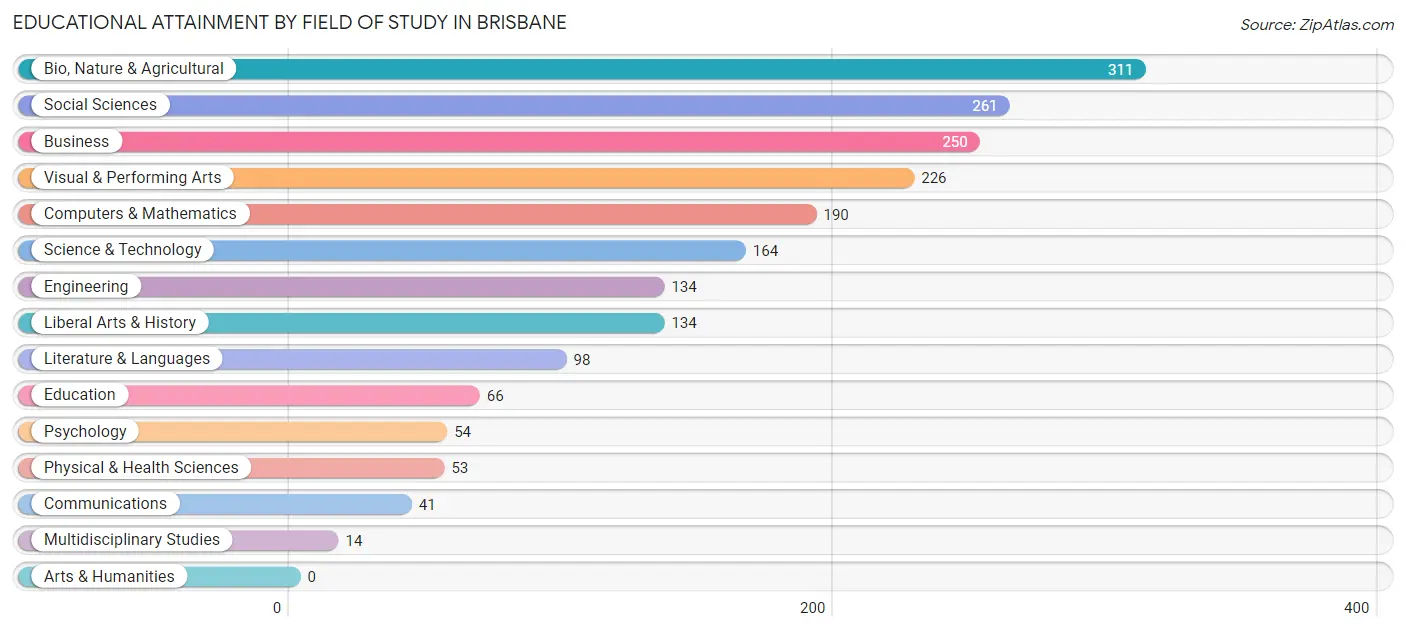
| Field of Study | # Graduates | % Graduates |
| Computers & Mathematics | 190 | 9.5% |
| Bio, Nature & Agricultural | 311 | 15.6% |
| Physical & Health Sciences | 53 | 2.7% |
| Psychology | 54 | 2.7% |
| Social Sciences | 261 | 13.1% |
| Engineering | 134 | 6.7% |
| Multidisciplinary Studies | 14 | 0.7% |
| Science & Technology | 164 | 8.2% |
| Business | 250 | 12.5% |
| Education | 66 | 3.3% |
| Literature & Languages | 98 | 4.9% |
| Liberal Arts & History | 134 | 6.7% |
| Visual & Performing Arts | 226 | 11.3% |
| Communications | 41 | 2.1% |
| Arts & Humanities | 0 | 0.0% |
| Total | 1,996 | 100.0% |
Transportation & Commute in Brisbane
Vehicle Availability by Sex in Brisbane
The most prevalent vehicle ownership categories in Brisbane are males with 2 vehicles (586, accounting for 48.8%) and females with 2 vehicles (456, making up 52.2%).
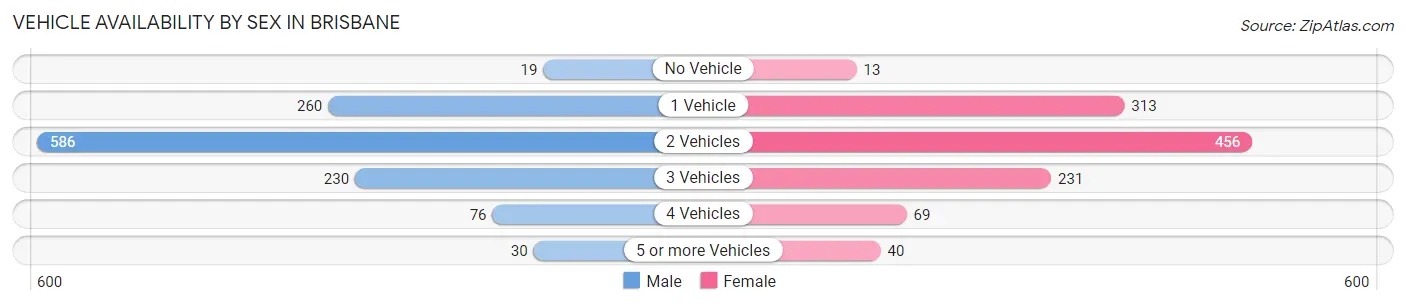
| Vehicles Available | Male | Female |
| No Vehicle | 19 (1.6%) | 13 (1.2%) |
| 1 Vehicle | 260 (21.6%) | 313 (27.9%) |
| 2 Vehicles | 586 (48.8%) | 456 (40.6%) |
| 3 Vehicles | 230 (19.2%) | 231 (20.6%) |
| 4 Vehicles | 76 (6.3%) | 69 (6.1%) |
| 5 or more Vehicles | 30 (2.5%) | 40 (3.6%) |
| Total | 1,201 (100.0%) | 1,122 (100.0%) |
Commute Time in Brisbane
The most frequently occuring commute durations in Brisbane are 20 to 24 minutes (389 commuters, 20.8%), 15 to 19 minutes (377 commuters, 20.2%), and 45 to 59 minutes (340 commuters, 18.2%).
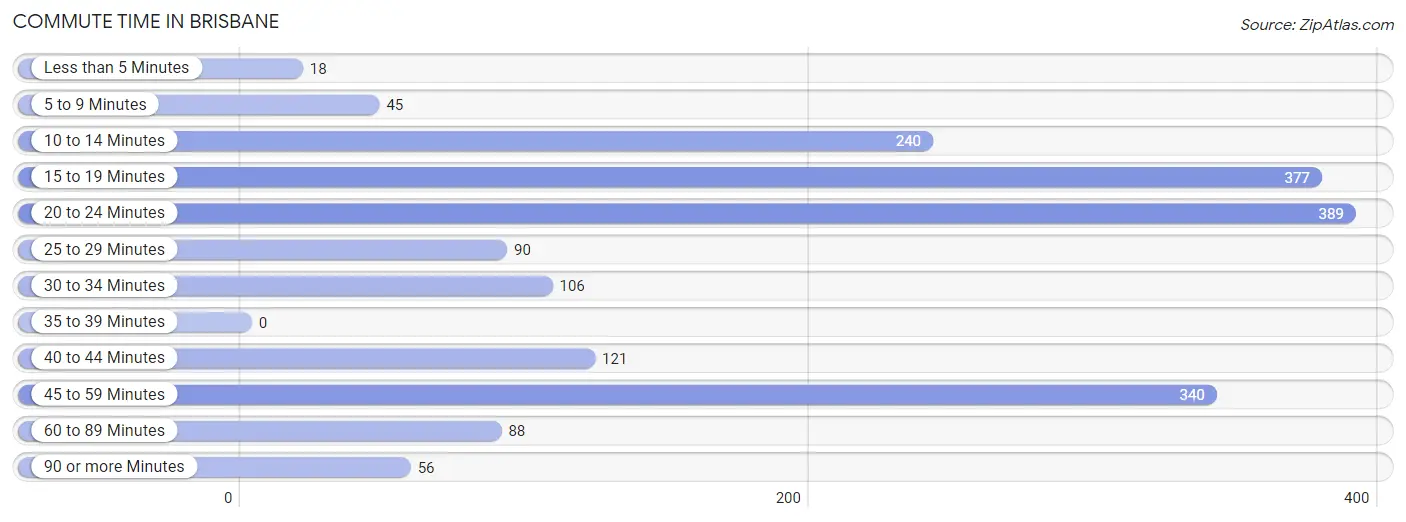
| Commute Time | # Commuters | % Commuters |
| Less than 5 Minutes | 18 | 1.0% |
| 5 to 9 Minutes | 45 | 2.4% |
| 10 to 14 Minutes | 240 | 12.8% |
| 15 to 19 Minutes | 377 | 20.2% |
| 20 to 24 Minutes | 389 | 20.8% |
| 25 to 29 Minutes | 90 | 4.8% |
| 30 to 34 Minutes | 106 | 5.7% |
| 35 to 39 Minutes | 0 | 0.0% |
| 40 to 44 Minutes | 121 | 6.5% |
| 45 to 59 Minutes | 340 | 18.2% |
| 60 to 89 Minutes | 88 | 4.7% |
| 90 or more Minutes | 56 | 3.0% |
Commute Time by Sex in Brisbane
The most common commute times in Brisbane are 20 to 24 minutes (258 commuters, 25.8%) for males and 15 to 19 minutes (307 commuters, 35.4%) for females.
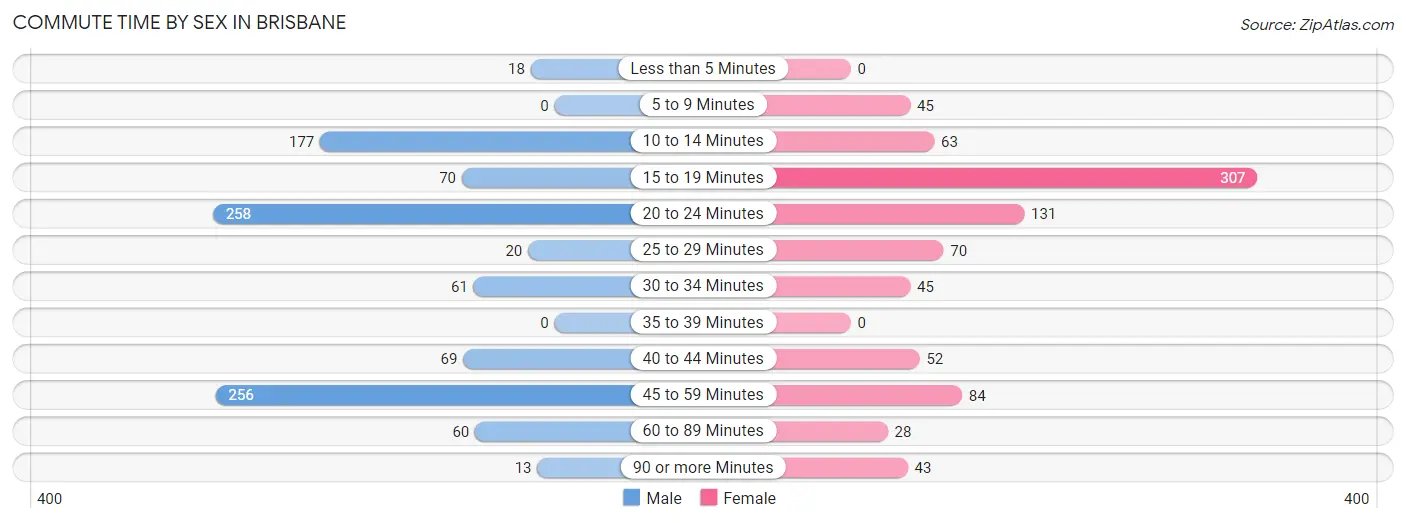
| Commute Time | Male | Female |
| Less than 5 Minutes | 18 (1.8%) | 0 (0.0%) |
| 5 to 9 Minutes | 0 (0.0%) | 45 (5.2%) |
| 10 to 14 Minutes | 177 (17.7%) | 63 (7.3%) |
| 15 to 19 Minutes | 70 (7.0%) | 307 (35.4%) |
| 20 to 24 Minutes | 258 (25.8%) | 131 (15.1%) |
| 25 to 29 Minutes | 20 (2.0%) | 70 (8.1%) |
| 30 to 34 Minutes | 61 (6.1%) | 45 (5.2%) |
| 35 to 39 Minutes | 0 (0.0%) | 0 (0.0%) |
| 40 to 44 Minutes | 69 (6.9%) | 52 (6.0%) |
| 45 to 59 Minutes | 256 (25.6%) | 84 (9.7%) |
| 60 to 89 Minutes | 60 (6.0%) | 28 (3.2%) |
| 90 or more Minutes | 13 (1.3%) | 43 (5.0%) |
Time of Departure to Work by Sex in Brisbane
The most frequent times of departure to work in Brisbane are 7:30 AM to 7:59 AM (309, 30.8%) for males and 7:00 AM to 7:29 AM (191, 22.0%) for females.
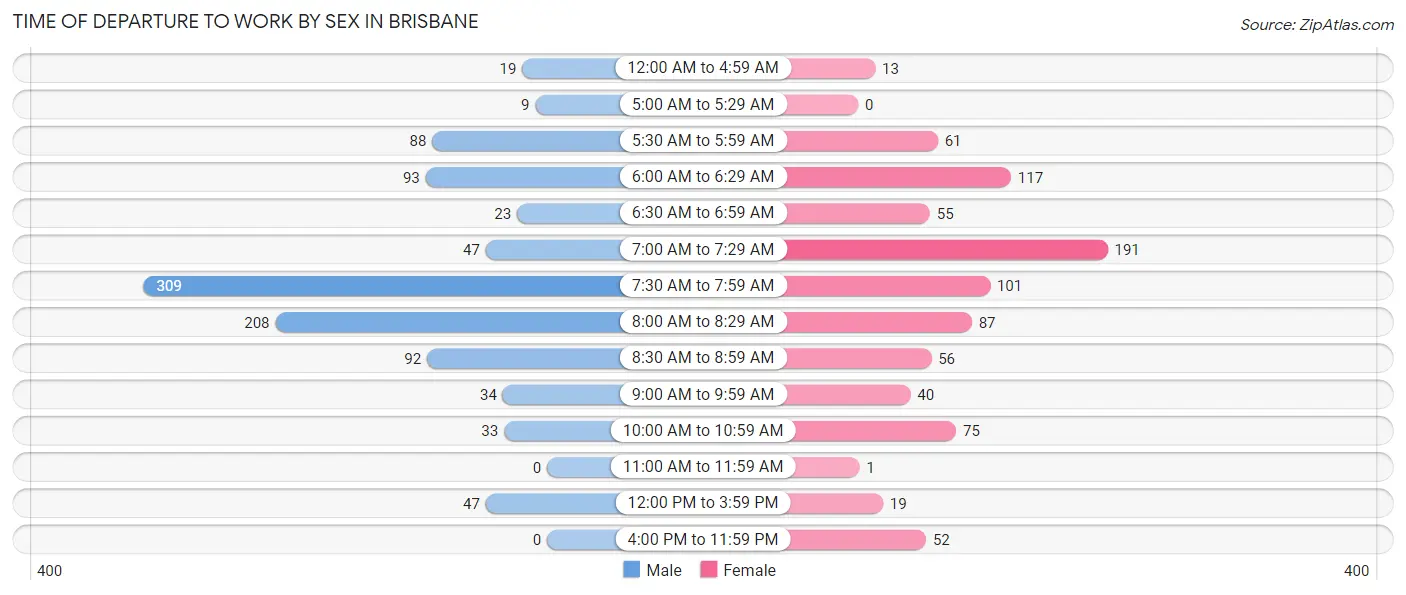
| Time of Departure | Male | Female |
| 12:00 AM to 4:59 AM | 19 (1.9%) | 13 (1.5%) |
| 5:00 AM to 5:29 AM | 9 (0.9%) | 0 (0.0%) |
| 5:30 AM to 5:59 AM | 88 (8.8%) | 61 (7.0%) |
| 6:00 AM to 6:29 AM | 93 (9.3%) | 117 (13.5%) |
| 6:30 AM to 6:59 AM | 23 (2.3%) | 55 (6.3%) |
| 7:00 AM to 7:29 AM | 47 (4.7%) | 191 (22.0%) |
| 7:30 AM to 7:59 AM | 309 (30.8%) | 101 (11.6%) |
| 8:00 AM to 8:29 AM | 208 (20.8%) | 87 (10.0%) |
| 8:30 AM to 8:59 AM | 92 (9.2%) | 56 (6.5%) |
| 9:00 AM to 9:59 AM | 34 (3.4%) | 40 (4.6%) |
| 10:00 AM to 10:59 AM | 33 (3.3%) | 75 (8.6%) |
| 11:00 AM to 11:59 AM | 0 (0.0%) | 1 (0.1%) |
| 12:00 PM to 3:59 PM | 47 (4.7%) | 19 (2.2%) |
| 4:00 PM to 11:59 PM | 0 (0.0%) | 52 (6.0%) |
| Total | 1,002 (100.0%) | 868 (100.0%) |
Housing Occupancy in Brisbane
Occupancy by Ownership in Brisbane
Of the total 1,902 dwellings in Brisbane, owner-occupied units account for 1,269 (66.7%), while renter-occupied units make up 633 (33.3%).
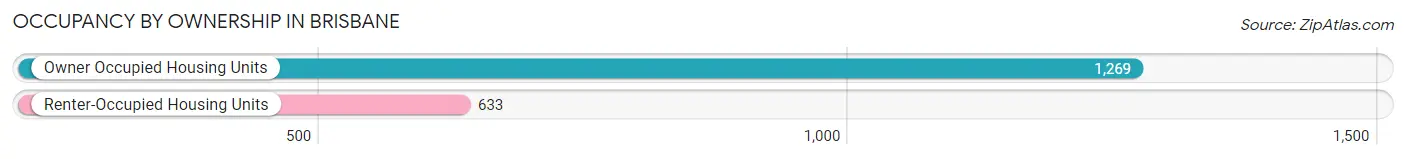
| Occupancy | # Housing Units | % Housing Units |
| Owner Occupied Housing Units | 1,269 | 66.7% |
| Renter-Occupied Housing Units | 633 | 33.3% |
| Total Occupied Housing Units | 1,902 | 100.0% |
Occupancy by Household Size in Brisbane
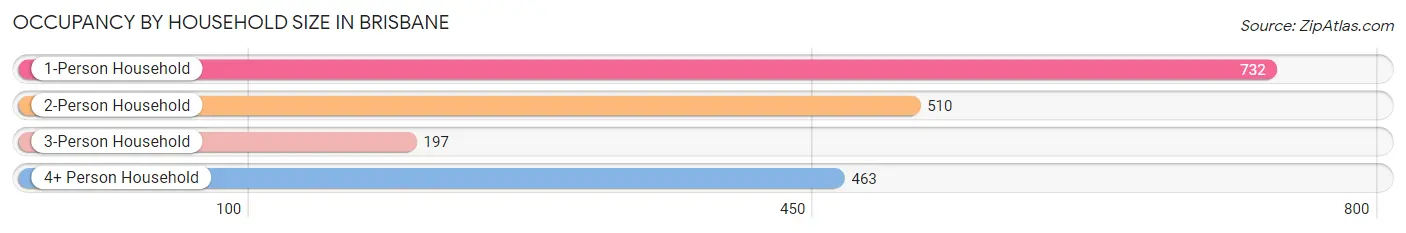
| Household Size | # Housing Units | % Housing Units |
| 1-Person Household | 732 | 38.5% |
| 2-Person Household | 510 | 26.8% |
| 3-Person Household | 197 | 10.4% |
| 4+ Person Household | 463 | 24.3% |
| Total Housing Units | 1,902 | 100.0% |
Occupancy by Ownership by Household Size in Brisbane
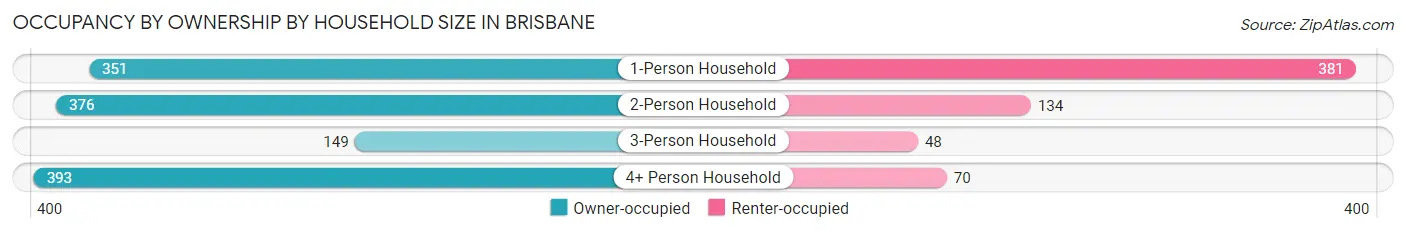
| Household Size | Owner-occupied | Renter-occupied |
| 1-Person Household | 351 (47.9%) | 381 (52.0%) |
| 2-Person Household | 376 (73.7%) | 134 (26.3%) |
| 3-Person Household | 149 (75.6%) | 48 (24.4%) |
| 4+ Person Household | 393 (84.9%) | 70 (15.1%) |
| Total Housing Units | 1,269 (66.7%) | 633 (33.3%) |
Occupancy by Educational Attainment in Brisbane
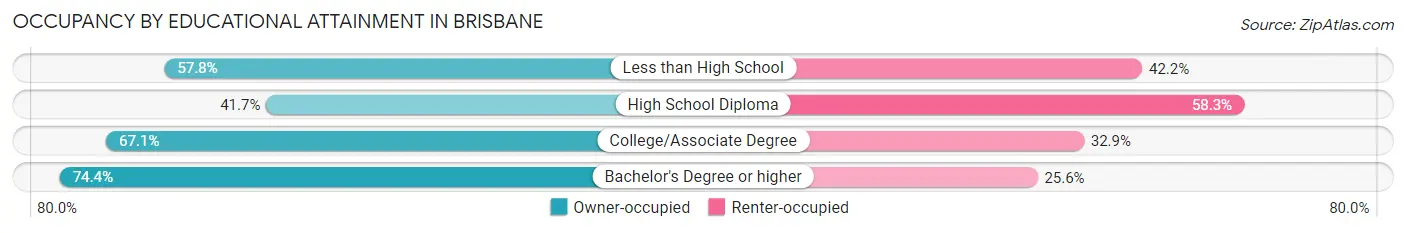
| Household Size | Owner-occupied | Renter-occupied |
| Less than High School | 96 (57.8%) | 70 (42.2%) |
| High School Diploma | 120 (41.7%) | 168 (58.3%) |
| College/Associate Degree | 224 (67.1%) | 110 (32.9%) |
| Bachelor's Degree or higher | 829 (74.4%) | 285 (25.6%) |
Occupancy by Age of Householder in Brisbane
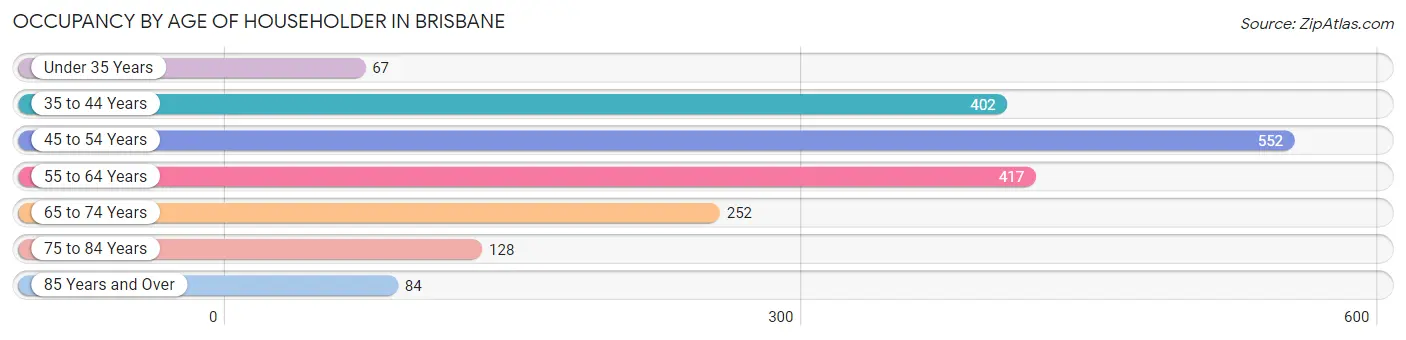
| Age Bracket | # Households | % Households |
| Under 35 Years | 67 | 3.5% |
| 35 to 44 Years | 402 | 21.1% |
| 45 to 54 Years | 552 | 29.0% |
| 55 to 64 Years | 417 | 21.9% |
| 65 to 74 Years | 252 | 13.3% |
| 75 to 84 Years | 128 | 6.7% |
| 85 Years and Over | 84 | 4.4% |
| Total | 1,902 | 100.0% |
Housing Finances in Brisbane
Median Income by Occupancy in Brisbane
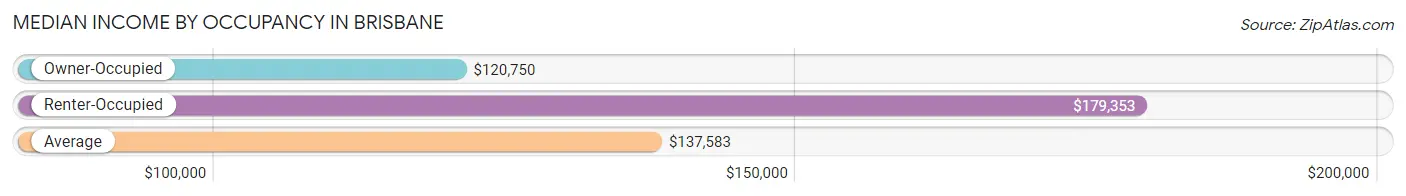
| Occupancy Type | # Households | Median Income |
| Owner-Occupied | 1,269 (66.7%) | $120,750 |
| Renter-Occupied | 633 (33.3%) | $179,353 |
| Average | 1,902 (100.0%) | $137,583 |
Occupancy by Householder Income Bracket in Brisbane
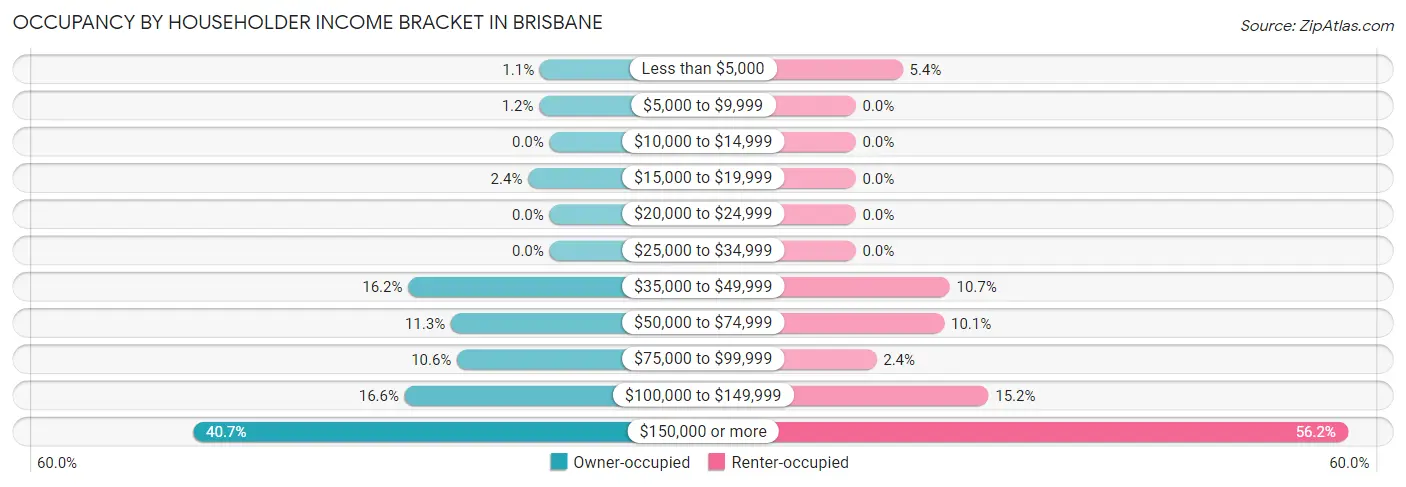
| Income Bracket | Owner-occupied | Renter-occupied |
| Less than $5,000 | 14 (1.1%) | 34 (5.4%) |
| $5,000 to $9,999 | 15 (1.2%) | 0 (0.0%) |
| $10,000 to $14,999 | 0 (0.0%) | 0 (0.0%) |
| $15,000 to $19,999 | 31 (2.4%) | 0 (0.0%) |
| $20,000 to $24,999 | 0 (0.0%) | 0 (0.0%) |
| $25,000 to $34,999 | 0 (0.0%) | 0 (0.0%) |
| $35,000 to $49,999 | 205 (16.2%) | 68 (10.7%) |
| $50,000 to $74,999 | 143 (11.3%) | 64 (10.1%) |
| $75,000 to $99,999 | 134 (10.6%) | 15 (2.4%) |
| $100,000 to $149,999 | 210 (16.6%) | 96 (15.2%) |
| $150,000 or more | 517 (40.7%) | 356 (56.2%) |
| Total | 1,269 (100.0%) | 633 (100.0%) |
Monthly Housing Cost Tiers in Brisbane
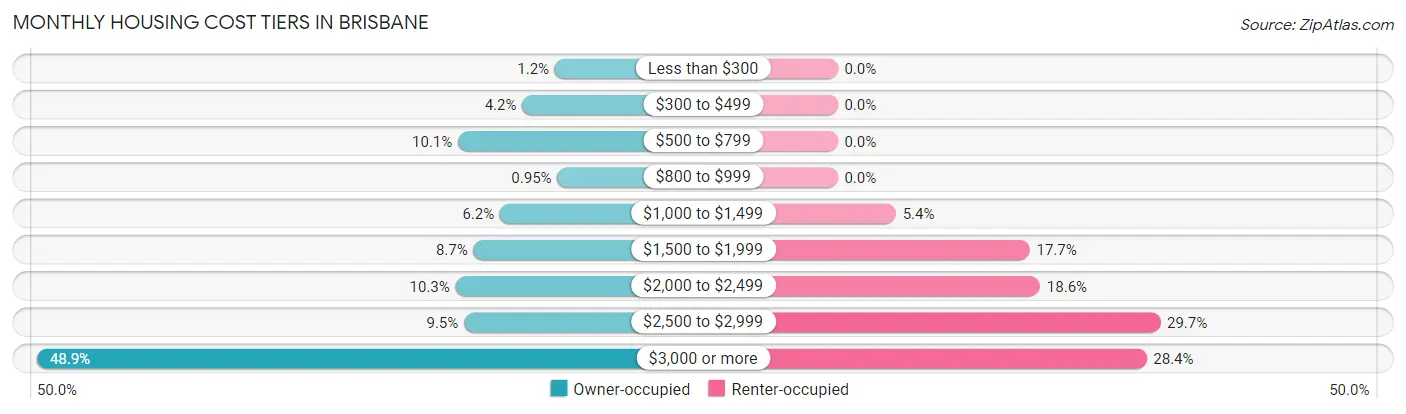
| Monthly Cost | Owner-occupied | Renter-occupied |
| Less than $300 | 15 (1.2%) | 0 (0.0%) |
| $300 to $499 | 53 (4.2%) | 0 (0.0%) |
| $500 to $799 | 128 (10.1%) | 0 (0.0%) |
| $800 to $999 | 12 (0.9%) | 0 (0.0%) |
| $1,000 to $1,499 | 79 (6.2%) | 34 (5.4%) |
| $1,500 to $1,999 | 110 (8.7%) | 112 (17.7%) |
| $2,000 to $2,499 | 131 (10.3%) | 118 (18.6%) |
| $2,500 to $2,999 | 121 (9.5%) | 188 (29.7%) |
| $3,000 or more | 620 (48.9%) | 180 (28.4%) |
| Total | 1,269 (100.0%) | 633 (100.0%) |
Physical Housing Characteristics in Brisbane
Housing Structures in Brisbane
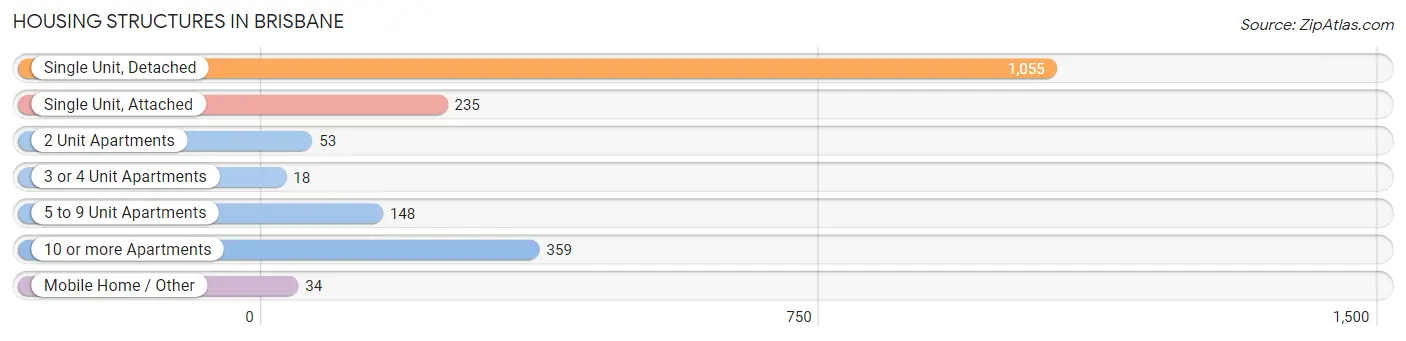
| Structure Type | # Housing Units | % Housing Units |
| Single Unit, Detached | 1,055 | 55.5% |
| Single Unit, Attached | 235 | 12.4% |
| 2 Unit Apartments | 53 | 2.8% |
| 3 or 4 Unit Apartments | 18 | 0.9% |
| 5 to 9 Unit Apartments | 148 | 7.8% |
| 10 or more Apartments | 359 | 18.9% |
| Mobile Home / Other | 34 | 1.8% |
| Total | 1,902 | 100.0% |
Housing Structures by Occupancy in Brisbane
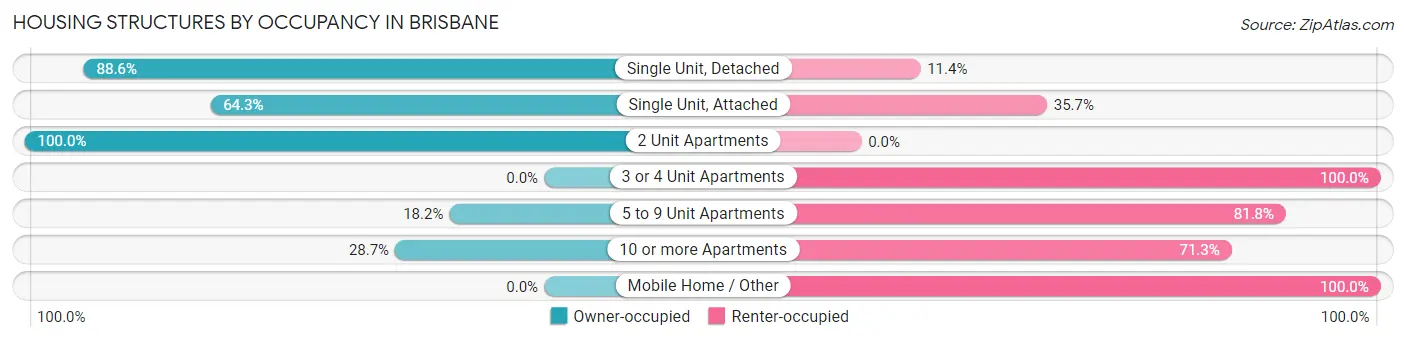
| Structure Type | Owner-occupied | Renter-occupied |
| Single Unit, Detached | 935 (88.6%) | 120 (11.4%) |
| Single Unit, Attached | 151 (64.3%) | 84 (35.7%) |
| 2 Unit Apartments | 53 (100.0%) | 0 (0.0%) |
| 3 or 4 Unit Apartments | 0 (0.0%) | 18 (100.0%) |
| 5 to 9 Unit Apartments | 27 (18.2%) | 121 (81.8%) |
| 10 or more Apartments | 103 (28.7%) | 256 (71.3%) |
| Mobile Home / Other | 0 (0.0%) | 34 (100.0%) |
| Total | 1,269 (66.7%) | 633 (33.3%) |
Housing Structures by Number of Rooms in Brisbane
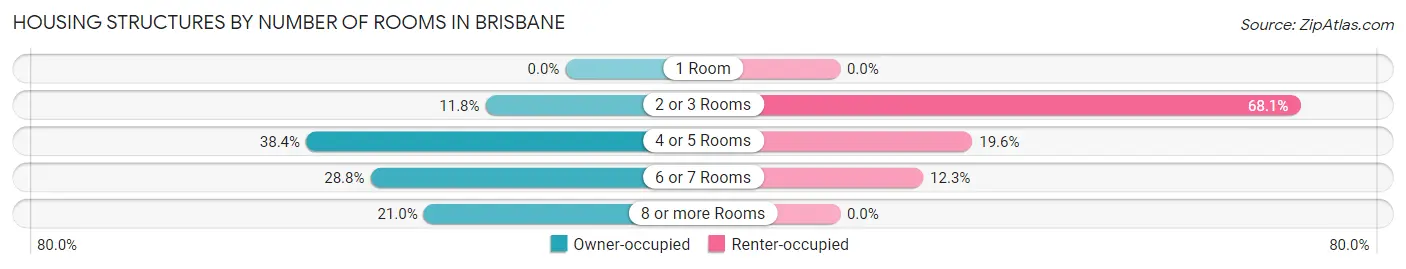
| Number of Rooms | Owner-occupied | Renter-occupied |
| 1 Room | 0 (0.0%) | 0 (0.0%) |
| 2 or 3 Rooms | 150 (11.8%) | 431 (68.1%) |
| 4 or 5 Rooms | 487 (38.4%) | 124 (19.6%) |
| 6 or 7 Rooms | 366 (28.8%) | 78 (12.3%) |
| 8 or more Rooms | 266 (21.0%) | 0 (0.0%) |
| Total | 1,269 (100.0%) | 633 (100.0%) |
Housing Structure by Heating Type in Brisbane
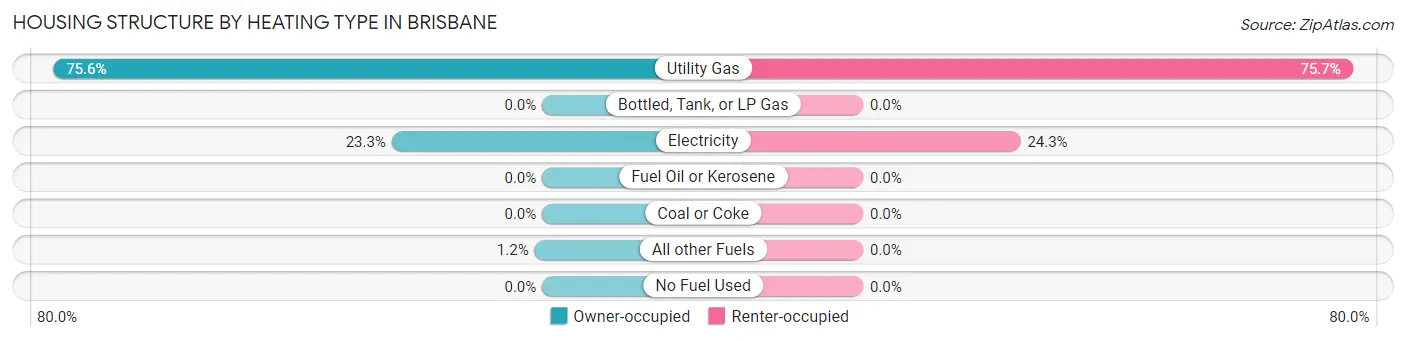
| Heating Type | Owner-occupied | Renter-occupied |
| Utility Gas | 959 (75.6%) | 479 (75.7%) |
| Bottled, Tank, or LP Gas | 0 (0.0%) | 0 (0.0%) |
| Electricity | 295 (23.3%) | 154 (24.3%) |
| Fuel Oil or Kerosene | 0 (0.0%) | 0 (0.0%) |
| Coal or Coke | 0 (0.0%) | 0 (0.0%) |
| All other Fuels | 15 (1.2%) | 0 (0.0%) |
| No Fuel Used | 0 (0.0%) | 0 (0.0%) |
| Total | 1,269 (100.0%) | 633 (100.0%) |
Household Vehicle Usage in Brisbane
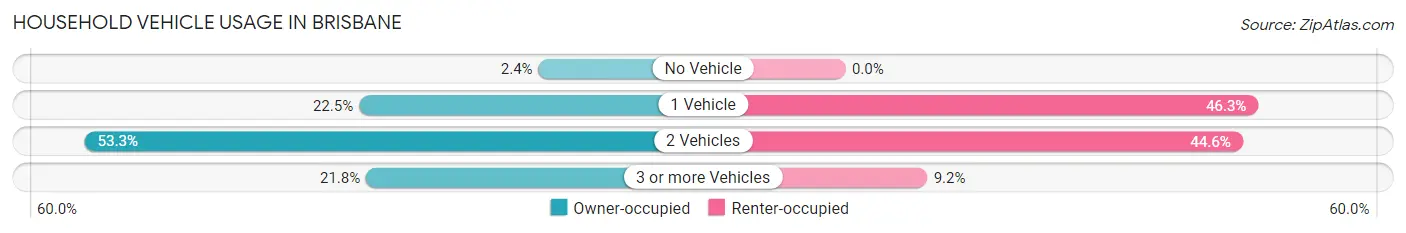
| Vehicles per Household | Owner-occupied | Renter-occupied |
| No Vehicle | 31 (2.4%) | 0 (0.0%) |
| 1 Vehicle | 286 (22.5%) | 293 (46.3%) |
| 2 Vehicles | 676 (53.3%) | 282 (44.6%) |
| 3 or more Vehicles | 276 (21.7%) | 58 (9.2%) |
| Total | 1,269 (100.0%) | 633 (100.0%) |
Real Estate & Mortgages in Brisbane
Real Estate and Mortgage Overview in Brisbane
| Characteristic | Without Mortgage | With Mortgage |
| Housing Units | 361 | 908 |
| Median Property Value | $1,245,900 | $1,024,200 |
| Median Household Income | $77,604 | $439 |
| Monthly Housing Costs | $777 | $620 |
| Real Estate Taxes | $3,647 | $0 |
Property Value by Mortgage Status in Brisbane
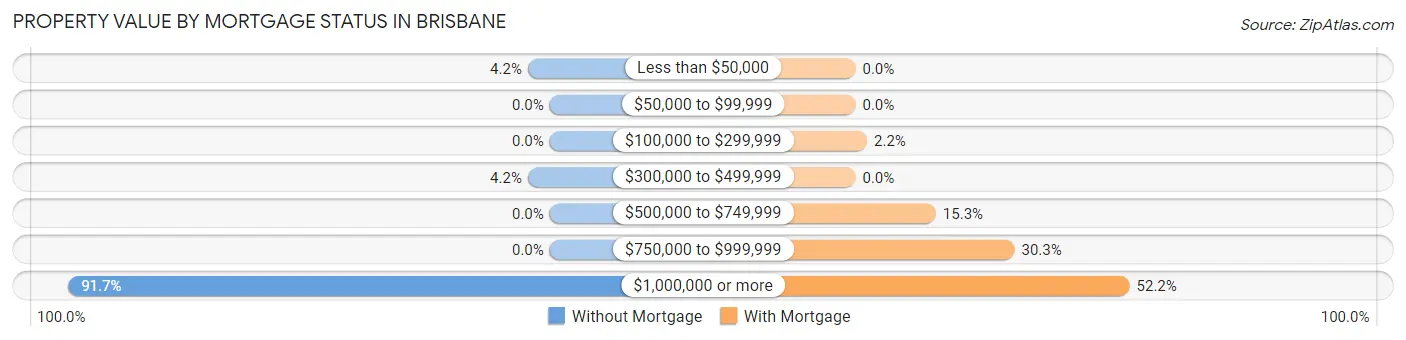
| Property Value | Without Mortgage | With Mortgage |
| Less than $50,000 | 15 (4.2%) | 0 (0.0%) |
| $50,000 to $99,999 | 0 (0.0%) | 0 (0.0%) |
| $100,000 to $299,999 | 0 (0.0%) | 20 (2.2%) |
| $300,000 to $499,999 | 15 (4.2%) | 0 (0.0%) |
| $500,000 to $749,999 | 0 (0.0%) | 139 (15.3%) |
| $750,000 to $999,999 | 0 (0.0%) | 275 (30.3%) |
| $1,000,000 or more | 331 (91.7%) | 474 (52.2%) |
| Total | 361 (100.0%) | 908 (100.0%) |
Household Income by Mortgage Status in Brisbane
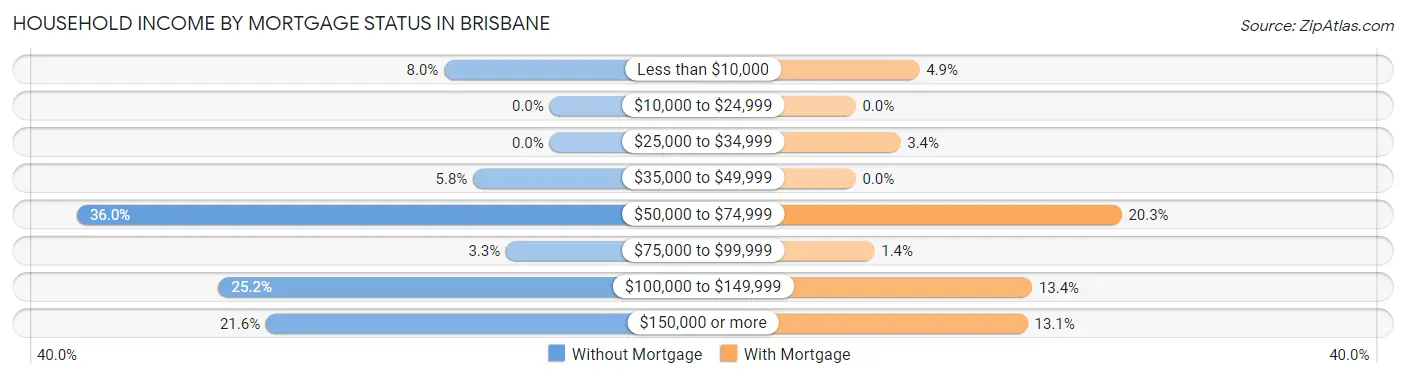
| Household Income | Without Mortgage | With Mortgage |
| Less than $10,000 | 29 (8.0%) | 44 (4.9%) |
| $10,000 to $24,999 | 0 (0.0%) | 0 (0.0%) |
| $25,000 to $34,999 | 0 (0.0%) | 31 (3.4%) |
| $35,000 to $49,999 | 21 (5.8%) | 0 (0.0%) |
| $50,000 to $74,999 | 130 (36.0%) | 184 (20.3%) |
| $75,000 to $99,999 | 12 (3.3%) | 13 (1.4%) |
| $100,000 to $149,999 | 91 (25.2%) | 122 (13.4%) |
| $150,000 or more | 78 (21.6%) | 119 (13.1%) |
| Total | 361 (100.0%) | 908 (100.0%) |
Property Value to Household Income Ratio in Brisbane
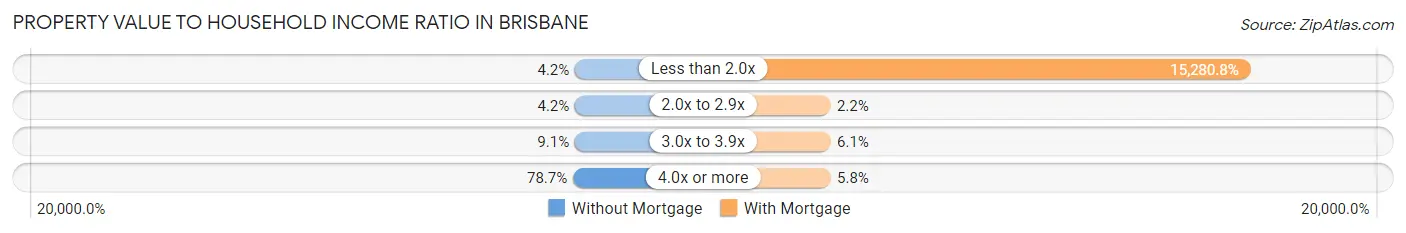
| Value-to-Income Ratio | Without Mortgage | With Mortgage |
| Less than 2.0x | 15 (4.2%) | 138,750 (15,280.8%) |
| 2.0x to 2.9x | 15 (4.2%) | 20 (2.2%) |
| 3.0x to 3.9x | 33 (9.1%) | 55 (6.1%) |
| 4.0x or more | 284 (78.7%) | 53 (5.8%) |
| Total | 361 (100.0%) | 908 (100.0%) |
Real Estate Taxes by Mortgage Status in Brisbane
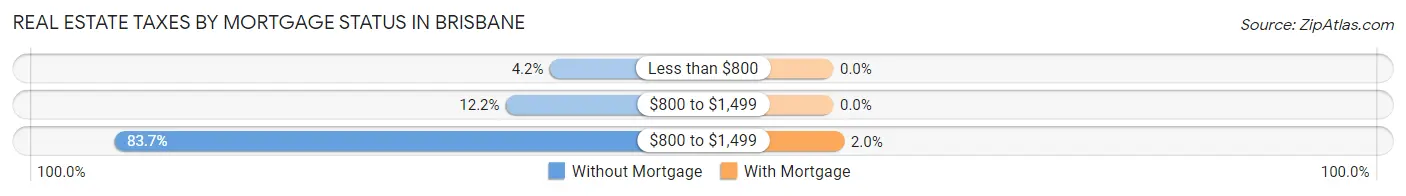
| Property Taxes | Without Mortgage | With Mortgage |
| Less than $800 | 15 (4.2%) | 0 (0.0%) |
| $800 to $1,499 | 44 (12.2%) | 0 (0.0%) |
| $800 to $1,499 | 302 (83.7%) | 18 (2.0%) |
| Total | 361 (100.0%) | 908 (100.0%) |
Health & Disability in Brisbane
Health Insurance Coverage by Age in Brisbane
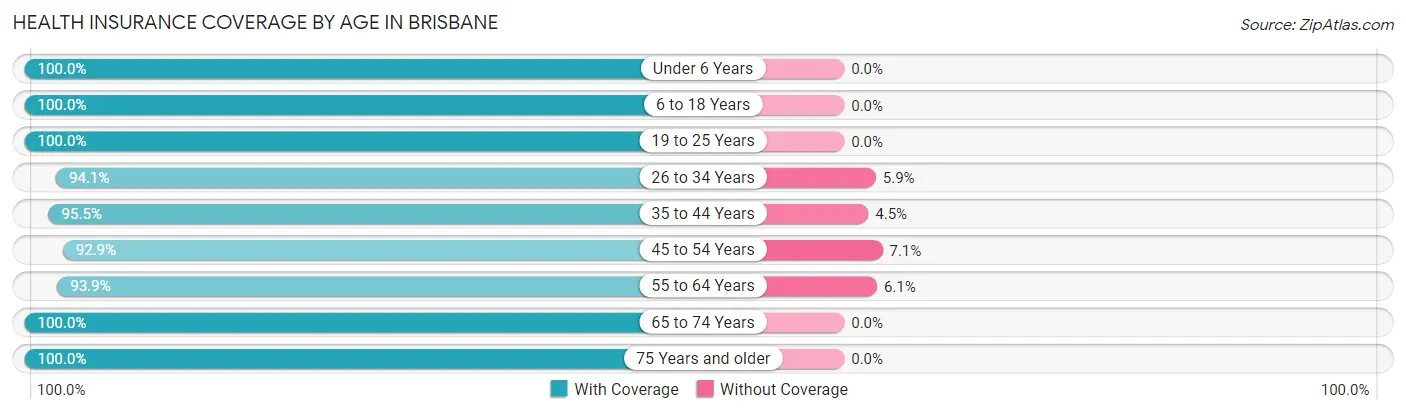
| Age Bracket | With Coverage | Without Coverage |
| Under 6 Years | 331 (100.0%) | 0 (0.0%) |
| 6 to 18 Years | 721 (100.0%) | 0 (0.0%) |
| 19 to 25 Years | 342 (100.0%) | 0 (0.0%) |
| 26 to 34 Years | 272 (94.1%) | 17 (5.9%) |
| 35 to 44 Years | 766 (95.5%) | 36 (4.5%) |
| 45 to 54 Years | 729 (92.9%) | 56 (7.1%) |
| 55 to 64 Years | 693 (93.9%) | 45 (6.1%) |
| 65 to 74 Years | 495 (100.0%) | 0 (0.0%) |
| 75 Years and older | 253 (100.0%) | 0 (0.0%) |
| Total | 4,602 (96.8%) | 154 (3.2%) |
Health Insurance Coverage by Citizenship Status in Brisbane
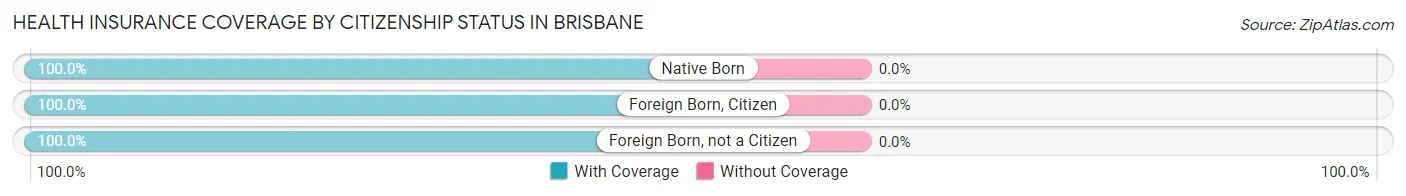
| Citizenship Status | With Coverage | Without Coverage |
| Native Born | 331 (100.0%) | 0 (0.0%) |
| Foreign Born, Citizen | 721 (100.0%) | 0 (0.0%) |
| Foreign Born, not a Citizen | 342 (100.0%) | 0 (0.0%) |
Health Insurance Coverage by Household Income in Brisbane
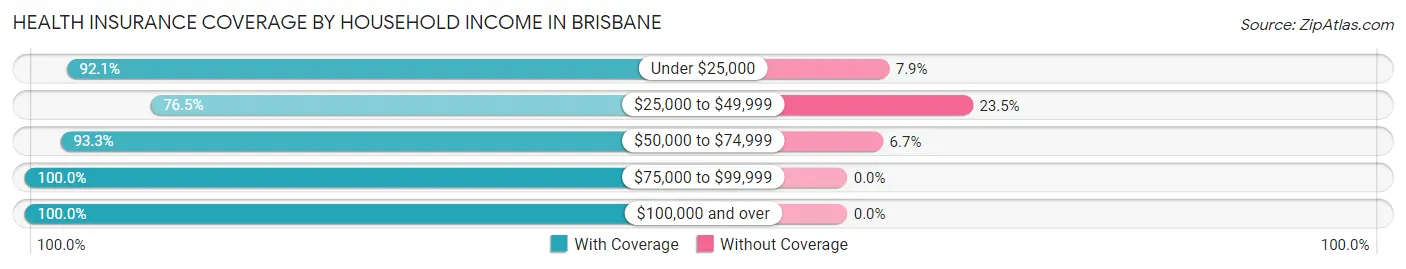
| Household Income | With Coverage | Without Coverage |
| Under $25,000 | 199 (92.1%) | 17 (7.9%) |
| $25,000 to $49,999 | 328 (76.5%) | 101 (23.5%) |
| $50,000 to $74,999 | 486 (93.3%) | 35 (6.7%) |
| $75,000 to $99,999 | 267 (100.0%) | 0 (0.0%) |
| $100,000 and over | 3,314 (100.0%) | 0 (0.0%) |
Public vs Private Health Insurance Coverage by Age in Brisbane
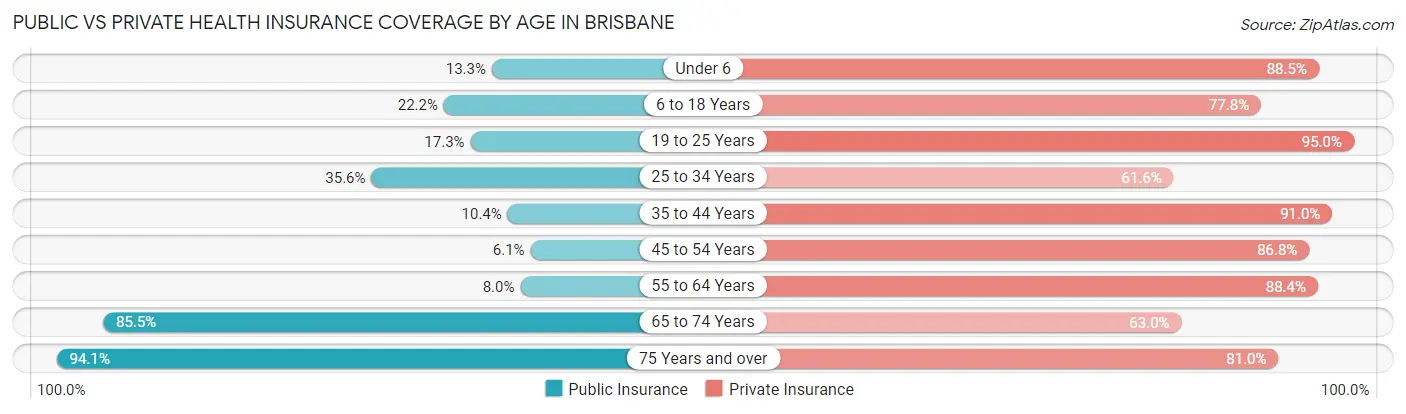
| Age Bracket | Public Insurance | Private Insurance |
| Under 6 | 44 (13.3%) | 293 (88.5%) |
| 6 to 18 Years | 160 (22.2%) | 561 (77.8%) |
| 19 to 25 Years | 59 (17.2%) | 325 (95.0%) |
| 25 to 34 Years | 103 (35.6%) | 178 (61.6%) |
| 35 to 44 Years | 83 (10.3%) | 730 (91.0%) |
| 45 to 54 Years | 48 (6.1%) | 681 (86.8%) |
| 55 to 64 Years | 59 (8.0%) | 652 (88.3%) |
| 65 to 74 Years | 423 (85.5%) | 312 (63.0%) |
| 75 Years and over | 238 (94.1%) | 205 (81.0%) |
| Total | 1,217 (25.6%) | 3,937 (82.8%) |
Disability Status by Sex by Age in Brisbane
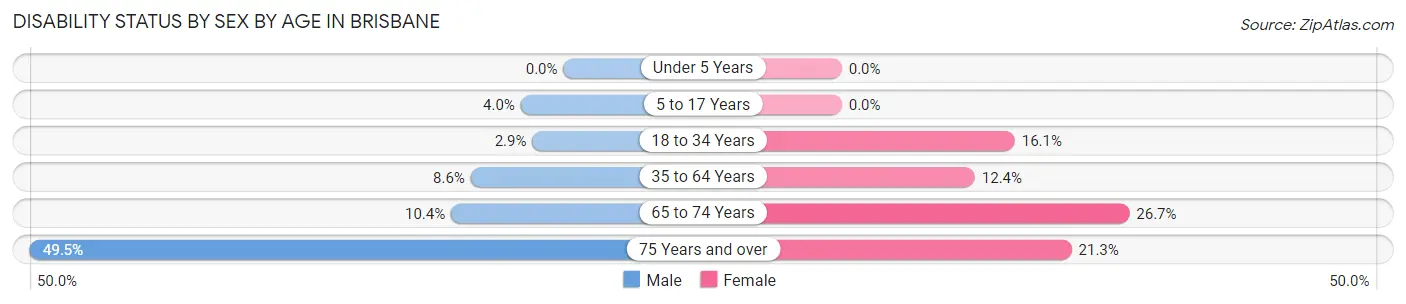
| Age Bracket | Male | Female |
| Under 5 Years | 0 (0.0%) | 0 (0.0%) |
| 5 to 17 Years | 12 (4.0%) | 0 (0.0%) |
| 18 to 34 Years | 9 (2.9%) | 66 (16.1%) |
| 35 to 64 Years | 106 (8.6%) | 135 (12.3%) |
| 65 to 74 Years | 27 (10.4%) | 63 (26.7%) |
| 75 Years and over | 51 (49.5%) | 32 (21.3%) |
Disability Class by Sex by Age in Brisbane
Disability Class: Hearing Difficulty
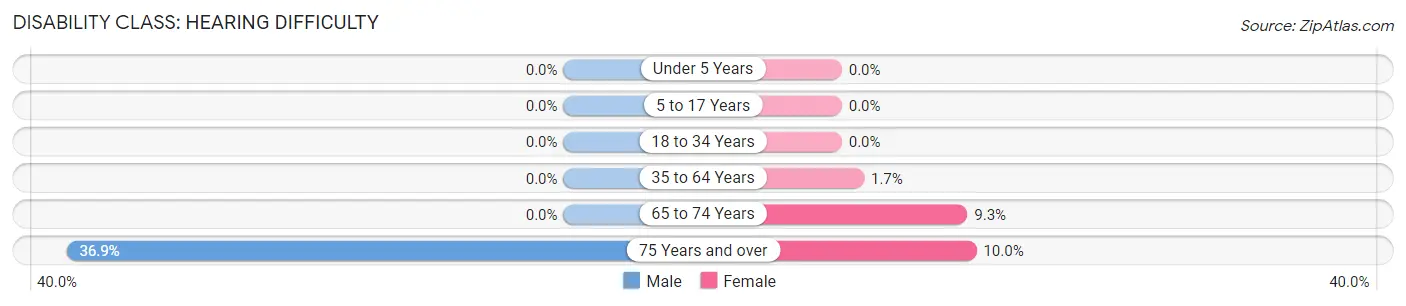
| Age Bracket | Male | Female |
| Under 5 Years | 0 (0.0%) | 0 (0.0%) |
| 5 to 17 Years | 0 (0.0%) | 0 (0.0%) |
| 18 to 34 Years | 0 (0.0%) | 0 (0.0%) |
| 35 to 64 Years | 0 (0.0%) | 18 (1.7%) |
| 65 to 74 Years | 0 (0.0%) | 22 (9.3%) |
| 75 Years and over | 38 (36.9%) | 15 (10.0%) |
Disability Class: Vision Difficulty
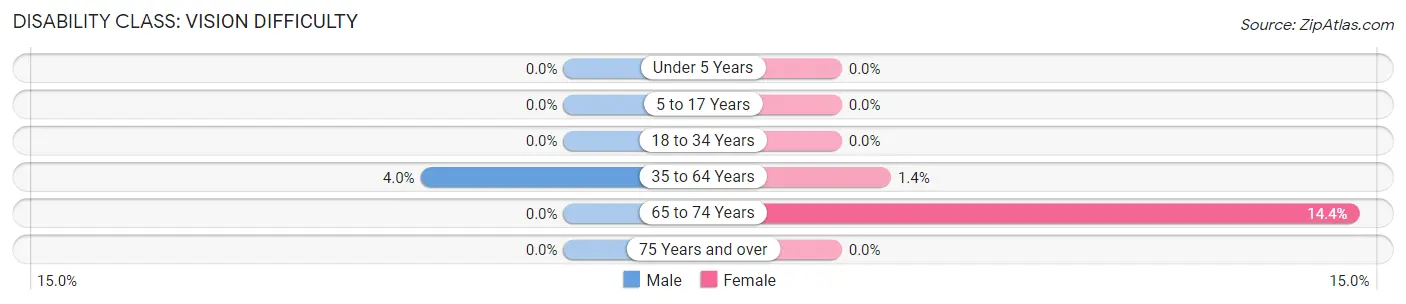
| Age Bracket | Male | Female |
| Under 5 Years | 0 (0.0%) | 0 (0.0%) |
| 5 to 17 Years | 0 (0.0%) | 0 (0.0%) |
| 18 to 34 Years | 0 (0.0%) | 0 (0.0%) |
| 35 to 64 Years | 49 (4.0%) | 15 (1.4%) |
| 65 to 74 Years | 0 (0.0%) | 34 (14.4%) |
| 75 Years and over | 0 (0.0%) | 0 (0.0%) |
Disability Class: Cognitive Difficulty
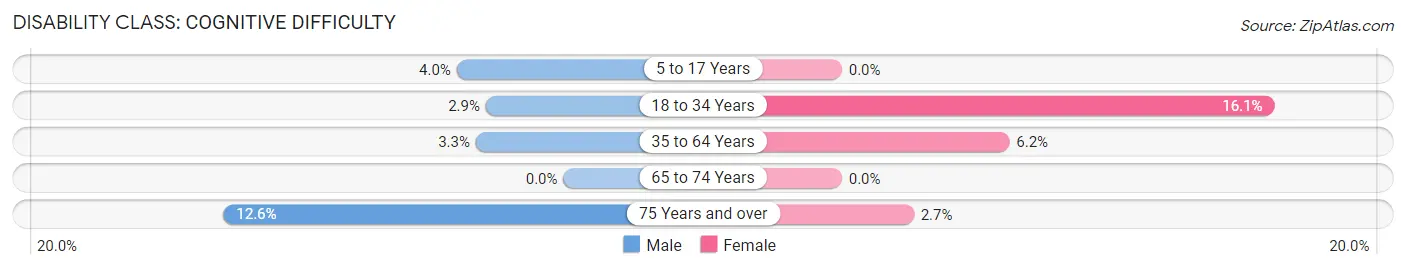
| Age Bracket | Male | Female |
| 5 to 17 Years | 12 (4.0%) | 0 (0.0%) |
| 18 to 34 Years | 9 (2.9%) | 66 (16.1%) |
| 35 to 64 Years | 40 (3.3%) | 68 (6.2%) |
| 65 to 74 Years | 0 (0.0%) | 0 (0.0%) |
| 75 Years and over | 13 (12.6%) | 4 (2.7%) |
Disability Class: Ambulatory Difficulty
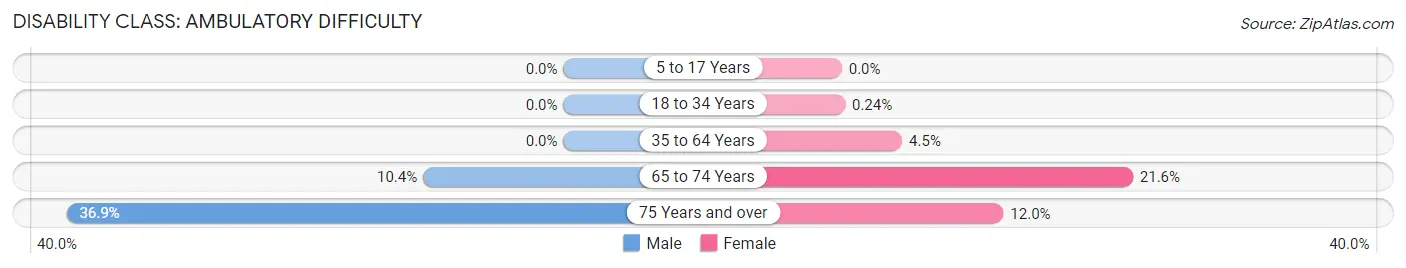
| Age Bracket | Male | Female |
| 5 to 17 Years | 0 (0.0%) | 0 (0.0%) |
| 18 to 34 Years | 0 (0.0%) | 1 (0.2%) |
| 35 to 64 Years | 0 (0.0%) | 49 (4.5%) |
| 65 to 74 Years | 27 (10.4%) | 51 (21.6%) |
| 75 Years and over | 38 (36.9%) | 18 (12.0%) |
Disability Class: Self-Care Difficulty
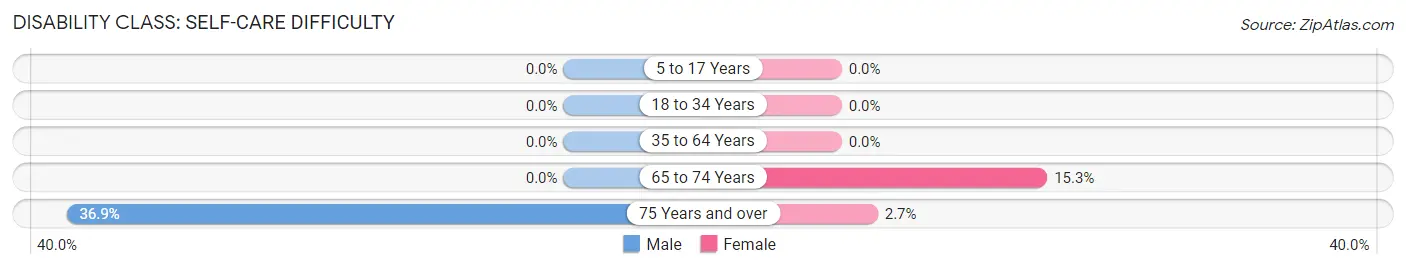
| Age Bracket | Male | Female |
| 5 to 17 Years | 0 (0.0%) | 0 (0.0%) |
| 18 to 34 Years | 0 (0.0%) | 0 (0.0%) |
| 35 to 64 Years | 0 (0.0%) | 0 (0.0%) |
| 65 to 74 Years | 0 (0.0%) | 36 (15.2%) |
| 75 Years and over | 38 (36.9%) | 4 (2.7%) |
Technology Access in Brisbane
Computing Device Access in Brisbane
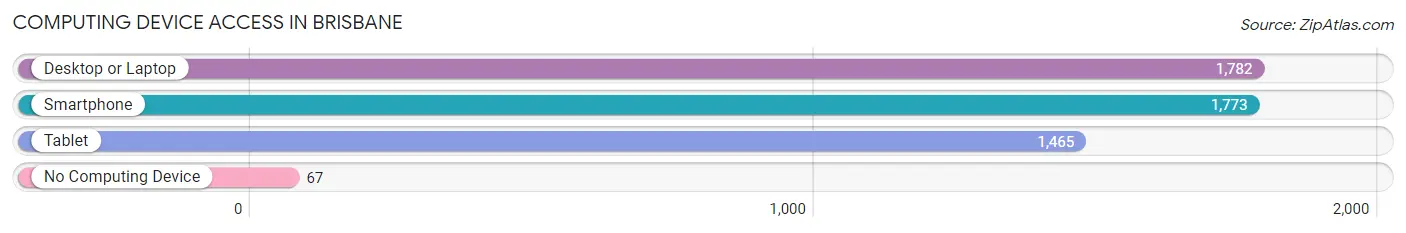
| Device Type | # Households | % Households |
| Desktop or Laptop | 1,782 | 93.7% |
| Smartphone | 1,773 | 93.2% |
| Tablet | 1,465 | 77.0% |
| No Computing Device | 67 | 3.5% |
| Total | 1,902 | 100.0% |
Internet Access in Brisbane
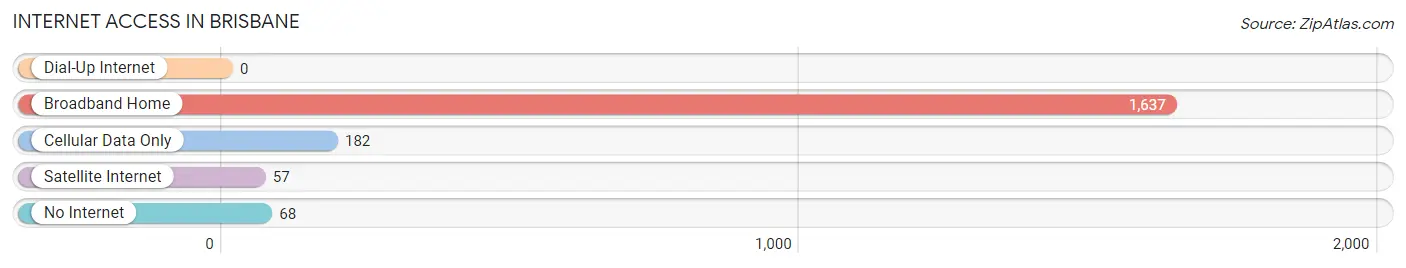
| Internet Type | # Households | % Households |
| Dial-Up Internet | 0 | 0.0% |
| Broadband Home | 1,637 | 86.1% |
| Cellular Data Only | 182 | 9.6% |
| Satellite Internet | 57 | 3.0% |
| No Internet | 68 | 3.6% |
| Total | 1,902 | 100.0% |
Brisbane Summary
Brisbane is a small city located in San Mateo County, California, United States. It is located on the San Francisco Bay, about 12 miles south of San Francisco and 20 miles north of San Jose. The city has a population of approximately 4,282 people as of the 2010 census.
Geography
Brisbane is located in the San Francisco Bay Area, in the northern part of San Mateo County. It is bordered by San Francisco to the north, Daly City to the east, South San Francisco to the south, and the San Bruno Mountains to the west. The city is situated on a plateau, with an elevation of about 500 feet above sea level. The city has a total area of 5.2 square miles, of which 0.2 square miles is water.
The climate in Brisbane is mild and temperate, with warm summers and cool winters. The average annual temperature is around 60°F, with temperatures ranging from the mid-50s in the winter to the mid-70s in the summer. The average annual precipitation is around 20 inches.
Economy
Brisbane is a small city, and its economy is largely based on its proximity to San Francisco and the Bay Area. The city is home to several large companies, including Oracle, Genentech, and the San Francisco 49ers. The city also has a number of small businesses, including restaurants, retail stores, and professional services.
The median household income in Brisbane is $90,845, and the median home value is $845,000. The unemployment rate is 3.2%, which is lower than the national average.
Demographics
As of the 2010 census, the population of Brisbane was 4,282. The racial makeup of the city was 63.3% White, 11.2% Asian, 10.2% Hispanic or Latino, 8.2% African American, and 6.9% from other races.
The median age in Brisbane is 44.3 years, and the median age for males is 43.7 years and for females is 44.9 years. The median household income is $90,845, and the median home value is $845,000.
Conclusion
Brisbane is a small city located in San Mateo County, California, United States. It is located on the San Francisco Bay, about 12 miles south of San Francisco and 20 miles north of San Jose. The city has a population of approximately 4,282 people as of the 2010 census. The city is situated on a plateau, with an elevation of about 500 feet above sea level. The climate in Brisbane is mild and temperate, with warm summers and cool winters. The economy of Brisbane is largely based on its proximity to San Francisco and the Bay Area. The racial makeup of the city is 63.3% White, 11.2% Asian, 10.2% Hispanic or Latino, 8.2% African American, and 6.9% from other races. The median household income in Brisbane is $90,845, and the median home value is $845,000.
Common Questions
What is Per Capita Income in Brisbane?
Per Capita income in Brisbane is $101,760.
What is the Median Family Income in Brisbane?
Median Family Income in Brisbane is $156,765.
What is the Median Household income in Brisbane?
Median Household Income in Brisbane is $137,583.
What is Income or Wage Gap in Brisbane?
Income or Wage Gap in Brisbane is 11.9%.
Women in Brisbane earn 88.1 cents for every dollar earned by a man.
What is Family Income Deficit in Brisbane?
Family Income Deficit in Brisbane is $16,305.
Families that are below poverty line in Brisbane earn $16,305 less on average than the poverty threshold level.
What is Inequality or Gini Index in Brisbane?
Inequality or Gini Index in Brisbane is 0.56.
What is the Total Population of Brisbane?
Total Population of Brisbane is 4,756.
What is the Total Male Population of Brisbane?
Total Male Population of Brisbane is 2,369.
What is the Total Female Population of Brisbane?
Total Female Population of Brisbane is 2,387.
What is the Ratio of Males per 100 Females in Brisbane?
There are 99.25 Males per 100 Females in Brisbane.
What is the Ratio of Females per 100 Males in Brisbane?
There are 100.76 Females per 100 Males in Brisbane.
What is the Median Population Age in Brisbane?
Median Population Age in Brisbane is 42.9 Years.
What is the Average Family Size in Brisbane
Average Family Size in Brisbane is 3.4 People.
What is the Average Household Size in Brisbane
Average Household Size in Brisbane is 2.5 People.
How Large is the Labor Force in Brisbane?
There are 2,665 People in the Labor Forcein in Brisbane.
What is the Percentage of People in the Labor Force in Brisbane?
68.8% of People are in the Labor Force in Brisbane.
What is the Unemployment Rate in Brisbane?
Unemployment Rate in Brisbane is 9.9%.