Cities with the Highest Percentage of Population Employed in Computer, Engineering & Science in Minnesota
RELATED REPORTS & OPTIONS
Computer, Engineering & Science
Minnesota
Compare Cities
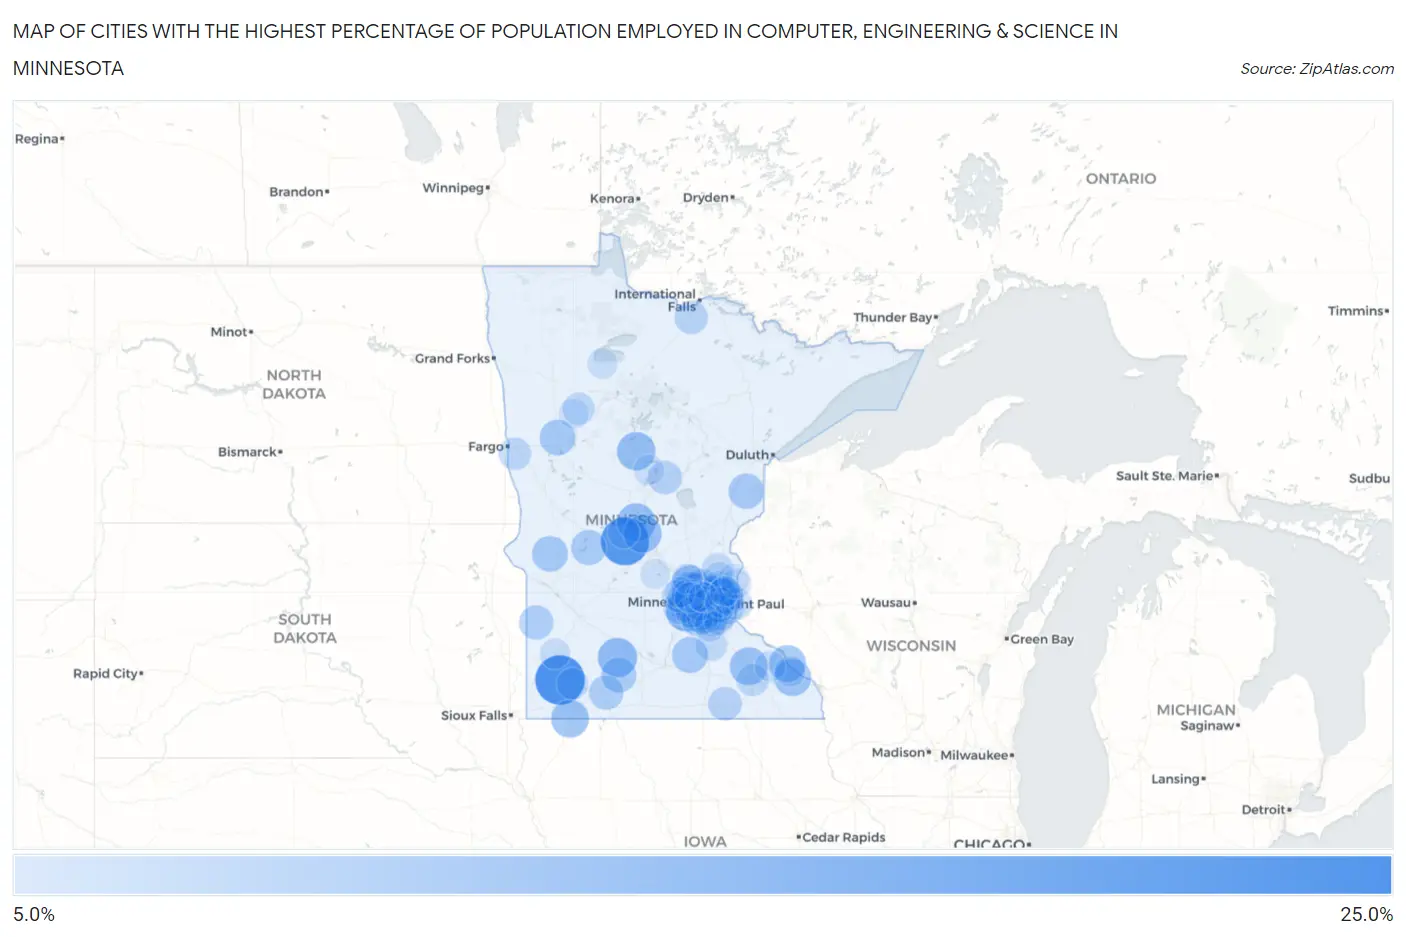
Map of Cities with the Highest Percentage of Population Employed in Computer, Engineering & Science in Minnesota
0.0%
25.0%
Cities with the Highest Percentage of Population Employed in Computer, Engineering & Science in Minnesota
| City | % Employed | vs State | vs National | |
| 1. | Hadley | 23.3% | 7.5%(+15.9)#1 | 6.8%(+16.6)#381 |
| 2. | St Rosa | 22.2% | 7.5%(+14.7)#2 | 6.8%(+15.5)#433 |
| 3. | Victoria | 16.4% | 7.5%(+8.90)#3 | 6.8%(+9.61)#910 |
| 4. | Cobden | 15.4% | 7.5%(+7.91)#4 | 6.8%(+8.62)#1,069 |
| 5. | Lauderdale | 15.0% | 7.5%(+7.57)#5 | 6.8%(+8.28)#1,129 |
| 6. | Flensburg | 14.7% | 7.5%(+7.20)#6 | 6.8%(+7.91)#1,202 |
| 7. | Backus | 14.6% | 7.5%(+7.14)#7 | 6.8%(+7.85)#1,215 |
| 8. | Bowlus | 14.5% | 7.5%(+7.00)#8 | 6.8%(+7.71)#1,242 |
| 9. | Eden Prairie | 14.4% | 7.5%(+6.88)#9 | 6.8%(+7.59)#1,254 |
| 10. | Oronoco | 14.3% | 7.5%(+6.86)#10 | 6.8%(+7.57)#1,261 |
| 11. | Shoreview | 14.3% | 7.5%(+6.83)#11 | 6.8%(+7.54)#1,264 |
| 12. | Bigelow | 14.2% | 7.5%(+6.70)#12 | 6.8%(+7.41)#1,294 |
| 13. | Maple Grove | 14.0% | 7.5%(+6.56)#13 | 6.8%(+7.27)#1,325 |
| 14. | Corcoran | 14.0% | 7.5%(+6.50)#14 | 6.8%(+7.22)#1,343 |
| 15. | Stockton | 13.9% | 7.5%(+6.39)#15 | 6.8%(+7.10)#1,369 |
| 16. | Rogers | 13.7% | 7.5%(+6.24)#16 | 6.8%(+6.95)#1,418 |
| 17. | Minneiska | 13.6% | 7.5%(+6.16)#17 | 6.8%(+6.87)#1,444 |
| 18. | Plymouth | 13.3% | 7.5%(+5.83)#18 | 6.8%(+6.54)#1,549 |
| 19. | Pickwick | 13.1% | 7.5%(+5.64)#19 | 6.8%(+6.35)#1,596 |
| 20. | St Louis Park | 13.0% | 7.5%(+5.50)#20 | 6.8%(+6.21)#1,634 |
| 21. | Kilkenny | 12.9% | 7.5%(+5.43)#21 | 6.8%(+6.14)#1,662 |
| 22. | Alberta | 12.9% | 7.5%(+5.38)#22 | 6.8%(+6.09)#1,676 |
| 23. | Golden Valley | 12.7% | 7.5%(+5.26)#23 | 6.8%(+5.97)#1,716 |
| 24. | Callaway | 12.7% | 7.5%(+5.22)#24 | 6.8%(+5.93)#1,726 |
| 25. | Mendota Heights | 12.7% | 7.5%(+5.21)#25 | 6.8%(+5.92)#1,730 |
| 26. | Roseville | 12.6% | 7.5%(+5.15)#26 | 6.8%(+5.86)#1,745 |
| 27. | Kerrick | 12.5% | 7.5%(+5.02)#27 | 6.8%(+5.74)#1,775 |
| 28. | Minnetonka | 12.5% | 7.5%(+4.99)#28 | 6.8%(+5.70)#1,787 |
| 29. | Mahtomedi | 12.5% | 7.5%(+4.98)#29 | 6.8%(+5.69)#1,791 |
| 30. | Falcon Heights | 12.3% | 7.5%(+4.87)#30 | 6.8%(+5.58)#1,826 |
| 31. | Glenwood | 12.3% | 7.5%(+4.86)#31 | 6.8%(+5.57)#1,828 |
| 32. | Little Canada | 12.3% | 7.5%(+4.84)#32 | 6.8%(+5.55)#1,835 |
| 33. | Darfur | 12.2% | 7.5%(+4.77)#33 | 6.8%(+5.48)#1,857 |
| 34. | Vadnais Heights | 12.2% | 7.5%(+4.76)#34 | 6.8%(+5.47)#1,867 |
| 35. | Greenwood | 12.2% | 7.5%(+4.75)#35 | 6.8%(+5.46)#1,872 |
| 36. | Maple Plain | 12.1% | 7.5%(+4.60)#36 | 6.8%(+5.31)#1,919 |
| 37. | Fish Lake | 11.8% | 7.5%(+4.29)#37 | 6.8%(+5.00)#2,027 |
| 38. | Eagan | 11.7% | 7.5%(+4.22)#38 | 6.8%(+4.93)#2,045 |
| 39. | Canby | 11.7% | 7.5%(+4.18)#39 | 6.8%(+4.89)#2,054 |
| 40. | Inver Grove Heights | 11.5% | 7.5%(+4.01)#40 | 6.8%(+4.72)#2,126 |
| 41. | Arden Hills | 11.2% | 7.5%(+3.73)#41 | 6.8%(+4.44)#2,268 |
| 42. | Pine Springs | 11.2% | 7.5%(+3.69)#42 | 6.8%(+4.40)#2,285 |
| 43. | Mapleview | 11.1% | 7.5%(+3.64)#43 | 6.8%(+4.35)#2,319 |
| 44. | Trommald | 11.1% | 7.5%(+3.64)#44 | 6.8%(+4.35)#2,322 |
| 45. | Mound | 11.0% | 7.5%(+3.49)#45 | 6.8%(+4.20)#2,387 |
| 46. | Birchwood Village | 11.0% | 7.5%(+3.49)#46 | 6.8%(+4.20)#2,393 |
| 47. | Littlefork | 10.9% | 7.5%(+3.43)#47 | 6.8%(+4.14)#2,415 |
| 48. | Credit River | 10.9% | 7.5%(+3.43)#48 | 6.8%(+4.14)#2,417 |
| 49. | Woodbury | 10.9% | 7.5%(+3.40)#49 | 6.8%(+4.11)#2,432 |
| 50. | Minneapolis | 10.8% | 7.5%(+3.37)#50 | 6.8%(+4.08)#2,447 |
| 51. | St Bonifacius | 10.8% | 7.5%(+3.30)#51 | 6.8%(+4.01)#2,479 |
| 52. | Apple Valley | 10.7% | 7.5%(+3.20)#52 | 6.8%(+3.91)#2,536 |
| 53. | Richfield | 10.6% | 7.5%(+3.17)#53 | 6.8%(+3.88)#2,547 |
| 54. | Edina | 10.6% | 7.5%(+3.09)#54 | 6.8%(+3.80)#2,600 |
| 55. | New Brighton | 10.4% | 7.5%(+2.93)#55 | 6.8%(+3.64)#2,696 |
| 56. | St Anthony City Hennepin And Ramsey Counties | 10.3% | 7.5%(+2.79)#56 | 6.8%(+3.51)#2,774 |
| 57. | Sabin | 10.3% | 7.5%(+2.78)#57 | 6.8%(+3.49)#2,782 |
| 58. | Champlin | 10.2% | 7.5%(+2.68)#58 | 6.8%(+3.39)#2,852 |
| 59. | Rochester | 10.1% | 7.5%(+2.64)#59 | 6.8%(+3.35)#2,868 |
| 60. | Lakeland Shores | 10.0% | 7.5%(+2.52)#60 | 6.8%(+3.24)#2,945 |
| 61. | Mendota | 10.0% | 7.5%(+2.52)#61 | 6.8%(+3.24)#2,953 |
| 62. | Roy Lake | 10.0% | 7.5%(+2.52)#62 | 6.8%(+3.24)#2,957 |
| 63. | Bloomington | 9.8% | 7.5%(+2.29)#63 | 6.8%(+3.00)#3,100 |
| 64. | Avoca | 9.8% | 7.5%(+2.28)#64 | 6.8%(+2.99)#3,109 |
| 65. | Dundas | 9.7% | 7.5%(+2.26)#65 | 6.8%(+2.97)#3,128 |
| 66. | Grey Eagle | 9.7% | 7.5%(+2.18)#66 | 6.8%(+2.89)#3,192 |
| 67. | Delano | 9.6% | 7.5%(+2.16)#67 | 6.8%(+2.87)#3,204 |
| 68. | Loretto | 9.6% | 7.5%(+2.10)#68 | 6.8%(+2.81)#3,256 |
| 69. | Shakopee | 9.6% | 7.5%(+2.09)#69 | 6.8%(+2.80)#3,261 |
| 70. | Mounds View | 9.5% | 7.5%(+2.04)#70 | 6.8%(+2.75)#3,300 |
| 71. | Martin Lake | 9.5% | 7.5%(+2.02)#71 | 6.8%(+2.73)#3,318 |
| 72. | Lino Lakes | 9.4% | 7.5%(+1.94)#72 | 6.8%(+2.66)#3,374 |
| 73. | Burnsville | 9.4% | 7.5%(+1.92)#73 | 6.8%(+2.63)#3,398 |
| 74. | Medicine Lake | 9.4% | 7.5%(+1.90)#74 | 6.8%(+2.61)#3,413 |
| 75. | Columbus | 9.3% | 7.5%(+1.85)#75 | 6.8%(+2.56)#3,448 |
| 76. | West St Paul | 9.3% | 7.5%(+1.83)#76 | 6.8%(+2.55)#3,458 |
| 77. | Prior Lake | 9.3% | 7.5%(+1.82)#77 | 6.8%(+2.53)#3,473 |
| 78. | Savage | 9.3% | 7.5%(+1.78)#78 | 6.8%(+2.49)#3,507 |
| 79. | Hopkins | 9.2% | 7.5%(+1.68)#79 | 6.8%(+2.39)#3,576 |
| 80. | Plainview | 9.1% | 7.5%(+1.67)#80 | 6.8%(+2.38)#3,585 |
| 81. | Lakeville | 9.1% | 7.5%(+1.64)#81 | 6.8%(+2.35)#3,605 |
| 82. | Chanhassen | 9.1% | 7.5%(+1.59)#82 | 6.8%(+2.31)#3,653 |
| 83. | Rollingstone | 9.0% | 7.5%(+1.55)#83 | 6.8%(+2.27)#3,685 |
| 84. | Russell | 9.0% | 7.5%(+1.49)#84 | 6.8%(+2.20)#3,742 |
| 85. | New Hope | 8.9% | 7.5%(+1.44)#85 | 6.8%(+2.15)#3,787 |
| 86. | Pequot Lakes | 8.9% | 7.5%(+1.39)#86 | 6.8%(+2.10)#3,841 |
| 87. | Rockford | 8.9% | 7.5%(+1.38)#87 | 6.8%(+2.09)#3,851 |
| 88. | Otsego | 8.8% | 7.5%(+1.37)#88 | 6.8%(+2.08)#3,862 |
| 89. | Medina | 8.8% | 7.5%(+1.35)#89 | 6.8%(+2.06)#3,882 |
| 90. | Lake Elmo | 8.8% | 7.5%(+1.32)#90 | 6.8%(+2.03)#3,908 |
| 91. | White Bear Lake | 8.7% | 7.5%(+1.24)#91 | 6.8%(+1.95)#3,963 |
| 92. | Little Rock | 8.7% | 7.5%(+1.23)#92 | 6.8%(+1.94)#3,969 |
| 93. | Scandia | 8.7% | 7.5%(+1.21)#93 | 6.8%(+1.92)#3,995 |
| 94. | Maplewood | 8.6% | 7.5%(+1.17)#94 | 6.8%(+1.88)#4,026 |
| 95. | Rosemount | 8.6% | 7.5%(+1.16)#95 | 6.8%(+1.87)#4,035 |
| 96. | Fairhaven | 8.6% | 7.5%(+1.16)#96 | 6.8%(+1.87)#4,036 |
| 97. | Robbinsdale | 8.6% | 7.5%(+1.16)#97 | 6.8%(+1.87)#4,040 |
| 98. | Marine On St Croix | 8.6% | 7.5%(+1.14)#98 | 6.8%(+1.85)#4,053 |
| 99. | Dellwood | 8.6% | 7.5%(+1.12)#99 | 6.8%(+1.83)#4,076 |
| 100. | Naytahwaush | 8.6% | 7.5%(+1.10)#100 | 6.8%(+1.81)#4,097 |
Common Questions
What are the Top 10 Cities with the Highest Percentage of Population Employed in Computer, Engineering & Science in Minnesota?
Top 10 Cities with the Highest Percentage of Population Employed in Computer, Engineering & Science in Minnesota are:
#1
23.3%
#2
22.2%
#3
16.4%
#4
15.4%
#5
15.0%
#6
14.7%
#7
14.6%
#8
14.5%
#9
14.4%
#10
14.3%
What city has the Highest Percentage of Population Employed in Computer, Engineering & Science in Minnesota?
Hadley has the Highest Percentage of Population Employed in Computer, Engineering & Science in Minnesota with 23.3%.
What is the Percentage of Population Employed in Computer, Engineering & Science in the State of Minnesota?
Percentage of Population Employed in Computer, Engineering & Science in Minnesota is 7.5%.
What is the Percentage of Population Employed in Computer, Engineering & Science in the United States?
Percentage of Population Employed in Computer, Engineering & Science in the United States is 6.8%.