Alhambra Valley, CA Map & Demographics
Alhambra Valley Map
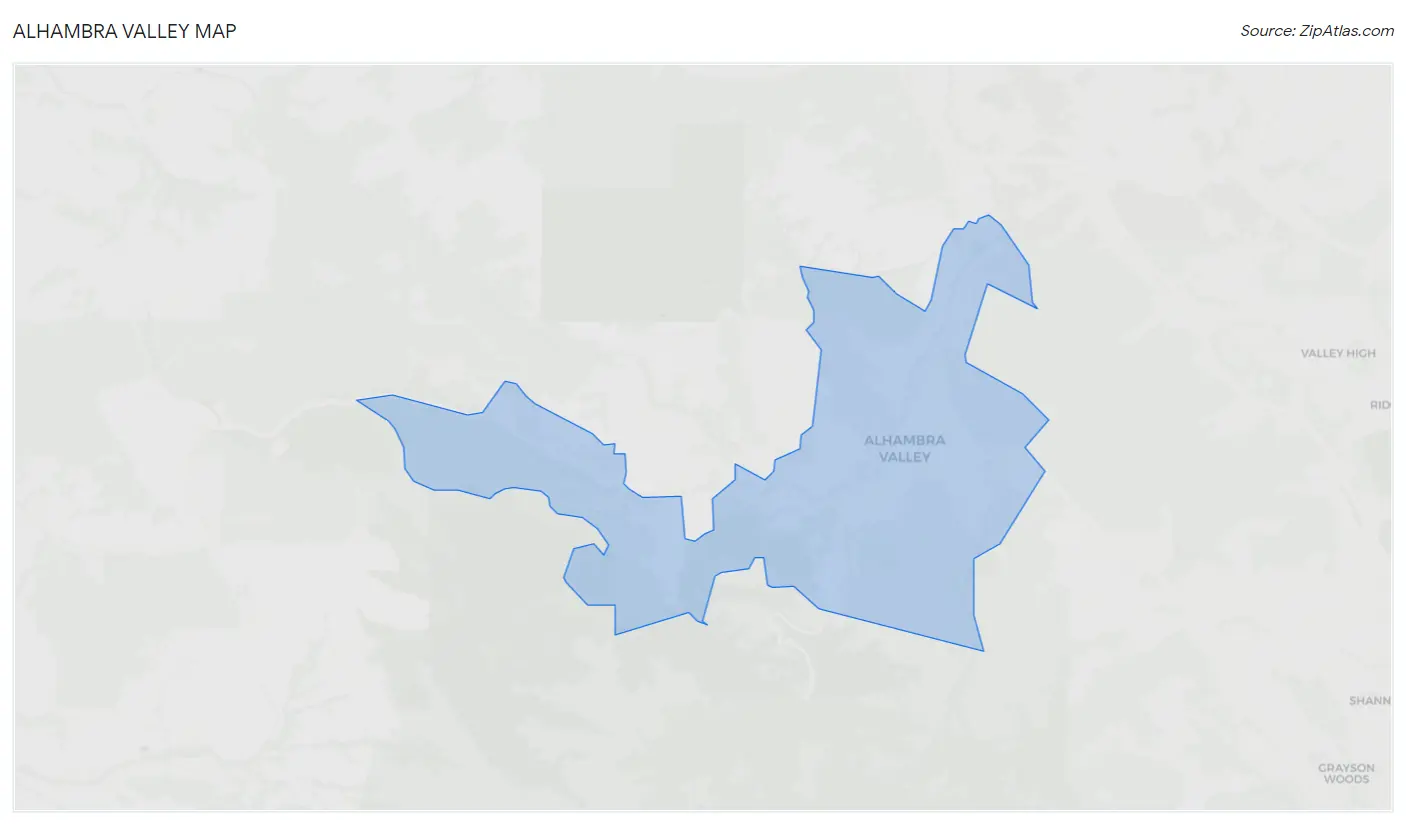
Alhambra Valley Overview
$70,264
PER CAPITA INCOME
$236,250
AVG FAMILY INCOME
$194,000
AVG HOUSEHOLD INCOME
22.6%
WAGE / INCOME GAP [ % ]
77.4¢/ $1
WAGE / INCOME GAP [ $ ]
0.43
INEQUALITY / GINI INDEX
917
TOTAL POPULATION
408
MALE POPULATION
509
FEMALE POPULATION
80.16
MALES / 100 FEMALES
124.75
FEMALES / 100 MALES
44.7
MEDIAN AGE
3.5
AVG FAMILY SIZE
3.0
AVG HOUSEHOLD SIZE
429
LABOR FORCE [ PEOPLE ]
60.3%
PERCENT IN LABOR FORCE
12.1%
UNEMPLOYMENT RATE
Income in Alhambra Valley
Income Overview in Alhambra Valley
Per Capita Income in Alhambra Valley is $70,264, while median incomes of families and households are $236,250 and $194,000 respectively.
| Characteristic | Number | Measure |
| Per Capita Income | 917 | $70,264 |
| Median Family Income | 229 | $236,250 |
| Mean Family Income | 229 | $220,502 |
| Median Household Income | 308 | $194,000 |
| Mean Household Income | 308 | $208,346 |
| Income Deficit | 229 | $0 |
| Wage / Income Gap (%) | 917 | 22.63% |
| Wage / Income Gap ($) | 917 | 77.37¢ per $1 |
| Gini / Inequality Index | 917 | 0.43 |
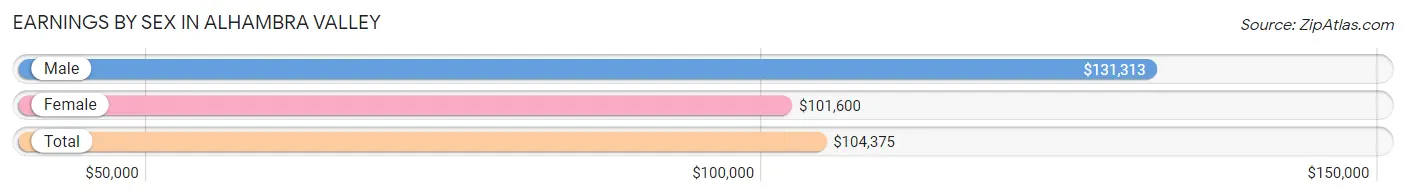
Earnings by Sex in Alhambra Valley
Average Earnings in Alhambra Valley are $104,375, $131,313 for men and $101,600 for women, a difference of 22.6%.
| Sex | Number | Average Earnings |
| Male | 187 (43.6%) | $131,313 |
| Female | 242 (56.4%) | $101,600 |
| Total | 429 (100.0%) | $104,375 |
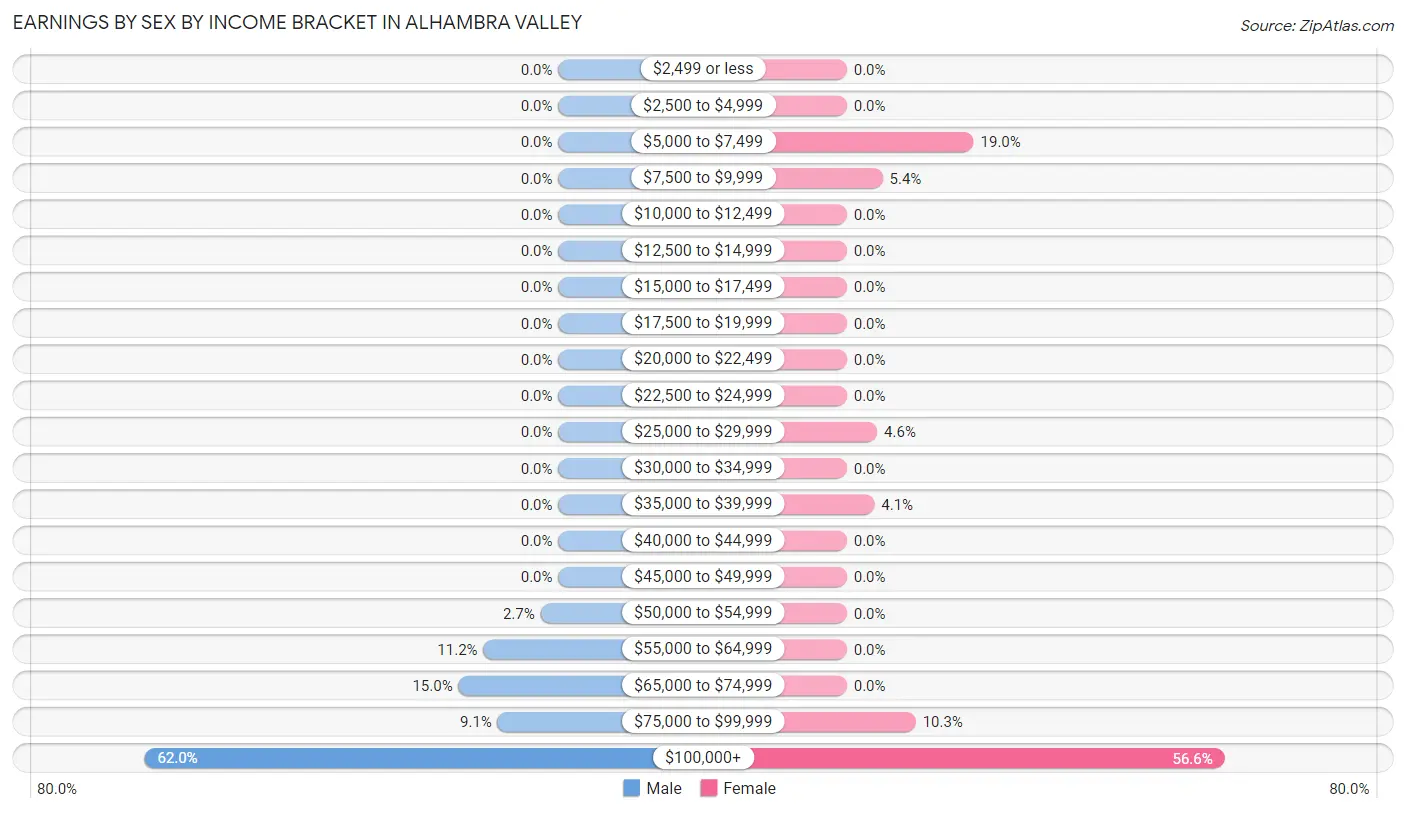
Earnings by Sex by Income Bracket in Alhambra Valley
The most common earnings brackets in Alhambra Valley are $100,000+ for men (116 | 62.0%) and $100,000+ for women (137 | 56.6%).
| Income | Male | Female |
| $2,499 or less | 0 (0.0%) | 0 (0.0%) |
| $2,500 to $4,999 | 0 (0.0%) | 0 (0.0%) |
| $5,000 to $7,499 | 0 (0.0%) | 46 (19.0%) |
| $7,500 to $9,999 | 0 (0.0%) | 13 (5.4%) |
| $10,000 to $12,499 | 0 (0.0%) | 0 (0.0%) |
| $12,500 to $14,999 | 0 (0.0%) | 0 (0.0%) |
| $15,000 to $17,499 | 0 (0.0%) | 0 (0.0%) |
| $17,500 to $19,999 | 0 (0.0%) | 0 (0.0%) |
| $20,000 to $22,499 | 0 (0.0%) | 0 (0.0%) |
| $22,500 to $24,999 | 0 (0.0%) | 0 (0.0%) |
| $25,000 to $29,999 | 0 (0.0%) | 11 (4.5%) |
| $30,000 to $34,999 | 0 (0.0%) | 0 (0.0%) |
| $35,000 to $39,999 | 0 (0.0%) | 10 (4.1%) |
| $40,000 to $44,999 | 0 (0.0%) | 0 (0.0%) |
| $45,000 to $49,999 | 0 (0.0%) | 0 (0.0%) |
| $50,000 to $54,999 | 5 (2.7%) | 0 (0.0%) |
| $55,000 to $64,999 | 21 (11.2%) | 0 (0.0%) |
| $65,000 to $74,999 | 28 (15.0%) | 0 (0.0%) |
| $75,000 to $99,999 | 17 (9.1%) | 25 (10.3%) |
| $100,000+ | 116 (62.0%) | 137 (56.6%) |
| Total | 187 (100.0%) | 242 (100.0%) |
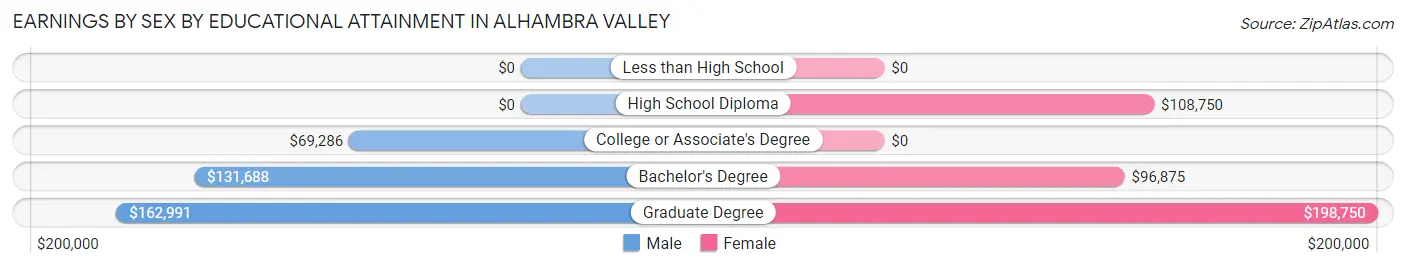
Earnings by Sex by Educational Attainment in Alhambra Valley
Average earnings in Alhambra Valley are $131,875 for men and $101,600 for women, a difference of 23.0%. Men with an educational attainment of graduate degree enjoy the highest average annual earnings of $162,991, while those with college or associate's degree education earn the least with $69,286. Women with an educational attainment of graduate degree earn the most with the average annual earnings of $198,750, while those with bachelor's degree education have the smallest earnings of $96,875.
| Educational Attainment | Male Income | Female Income |
| Less than High School | - | - |
| High School Diploma | - | - |
| College or Associate's Degree | $69,286 | $0 |
| Bachelor's Degree | $131,688 | $96,875 |
| Graduate Degree | $162,991 | $198,750 |
| Total | $131,875 | $101,600 |
Family Income in Alhambra Valley
Family Income Brackets in Alhambra Valley
According to the Alhambra Valley family income data, there are 124 families falling into the $200,000+ income range, which is the most common income bracket and makes up 54.1% of all families.
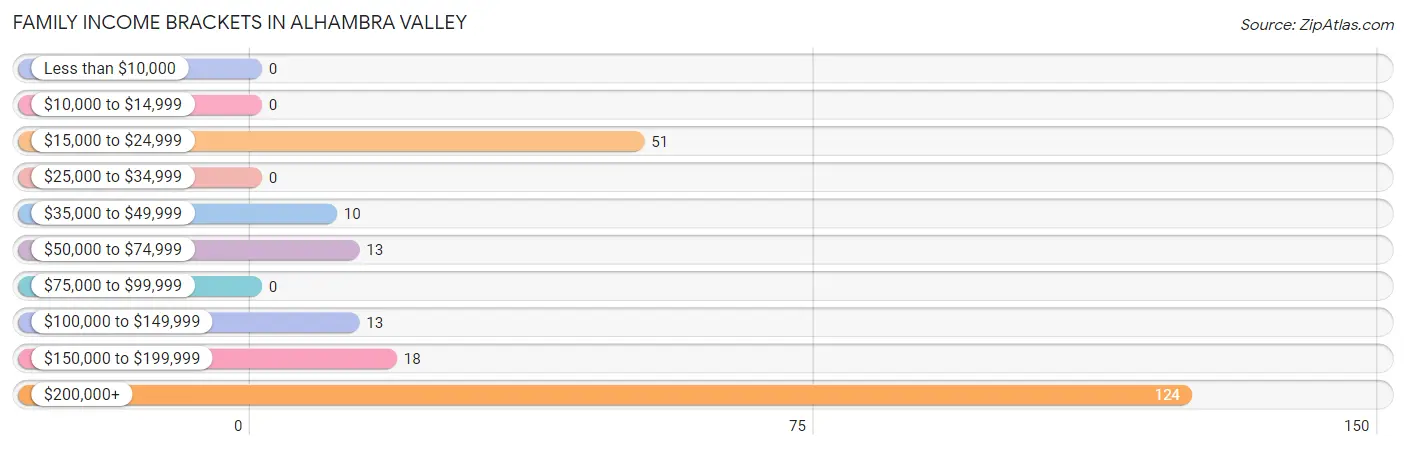
| Income Bracket | # Families | % Families |
| Less than $10,000 | 0 | 0.0% |
| $10,000 to $14,999 | 0 | 0.0% |
| $15,000 to $24,999 | 51 | 22.3% |
| $25,000 to $34,999 | 0 | 0.0% |
| $35,000 to $49,999 | 10 | 4.4% |
| $50,000 to $74,999 | 13 | 5.7% |
| $75,000 to $99,999 | 0 | 0.0% |
| $100,000 to $149,999 | 13 | 5.7% |
| $150,000 to $199,999 | 18 | 7.9% |
| $200,000+ | 124 | 54.1% |
Family Income by Famaliy Size in Alhambra Valley
4-person families (80 | 34.9%) account for the highest median family income in Alhambra Valley with $250,001 per family, while 4-person families (80 | 34.9%) have the highest median income of $62,500 per family member.
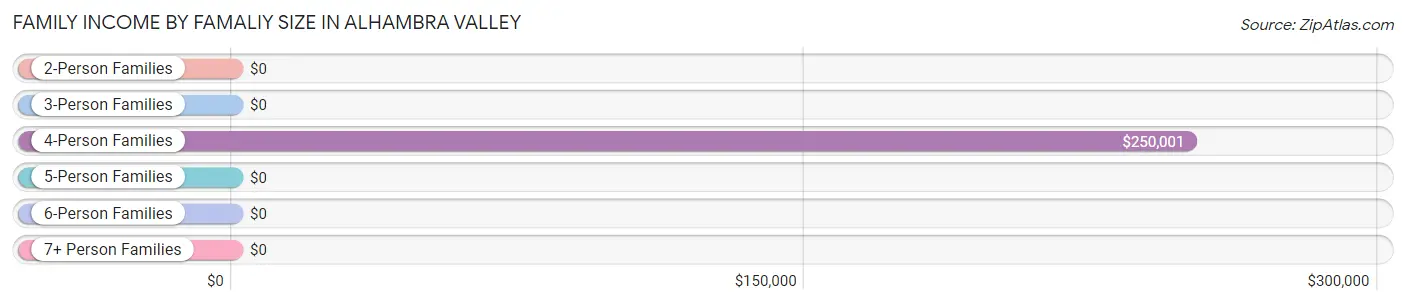
| Income Bracket | # Families | Median Income |
| 2-Person Families | 34 (14.8%) | $0 |
| 3-Person Families | 42 (18.3%) | $0 |
| 4-Person Families | 80 (34.9%) | $250,001 |
| 5-Person Families | 73 (31.9%) | $0 |
| 6-Person Families | 0 (0.0%) | $0 |
| 7+ Person Families | 0 (0.0%) | $0 |
| Total | 229 (100.0%) | $236,250 |
Family Income by Number of Earners in Alhambra Valley
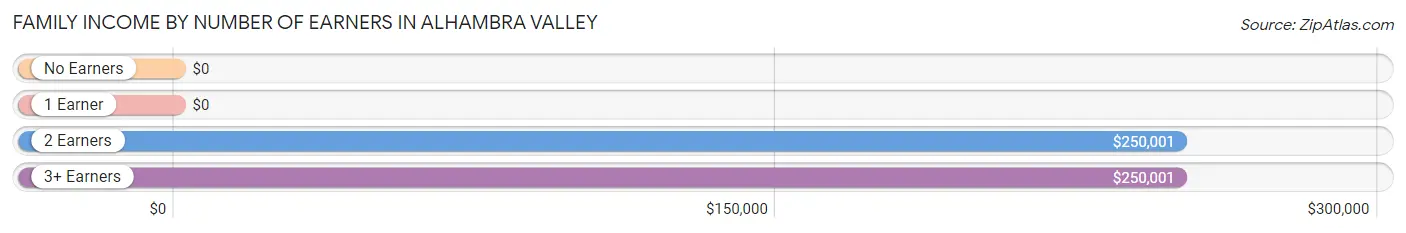
| Number of Earners | # Families | Median Income |
| No Earners | 31 (13.5%) | $0 |
| 1 Earner | 81 (35.4%) | $0 |
| 2 Earners | 81 (35.4%) | $250,001 |
| 3+ Earners | 36 (15.7%) | $250,001 |
| Total | 229 (100.0%) | $236,250 |
Household Income in Alhambra Valley
Household Income Brackets in Alhambra Valley
With 150 households falling in the category, the $200,000+ income range is the most frequent in Alhambra Valley, accounting for 48.7% of all households.
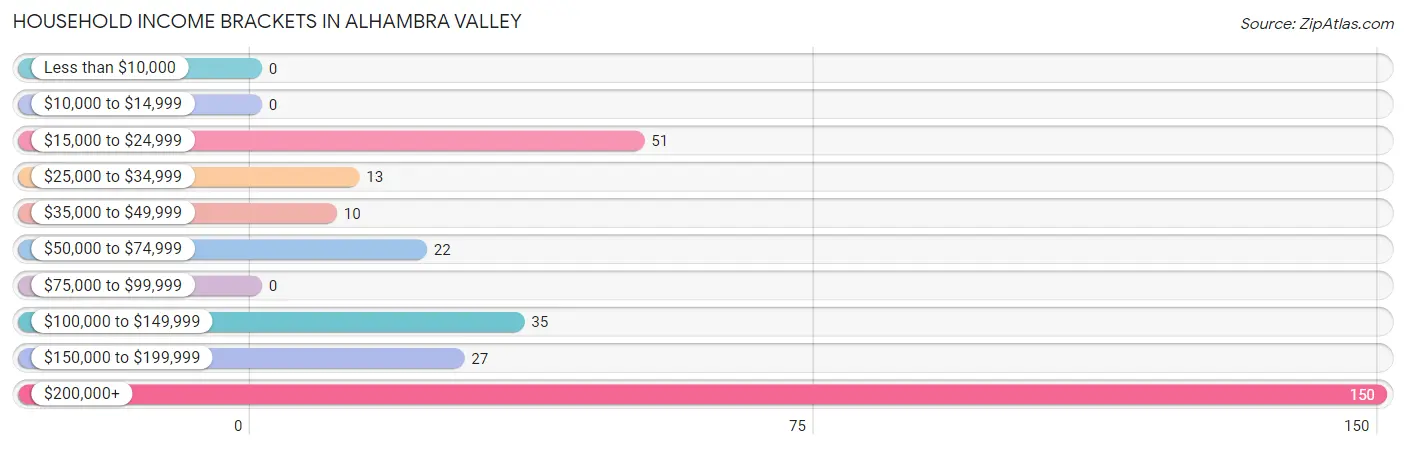
| Income Bracket | # Households | % Households |
| Less than $10,000 | 0 | 0.0% |
| $10,000 to $14,999 | 0 | 0.0% |
| $15,000 to $24,999 | 51 | 16.6% |
| $25,000 to $34,999 | 13 | 4.2% |
| $35,000 to $49,999 | 10 | 3.2% |
| $50,000 to $74,999 | 22 | 7.1% |
| $75,000 to $99,999 | 0 | 0.0% |
| $100,000 to $149,999 | 35 | 11.4% |
| $150,000 to $199,999 | 27 | 8.8% |
| $200,000+ | 150 | 48.7% |
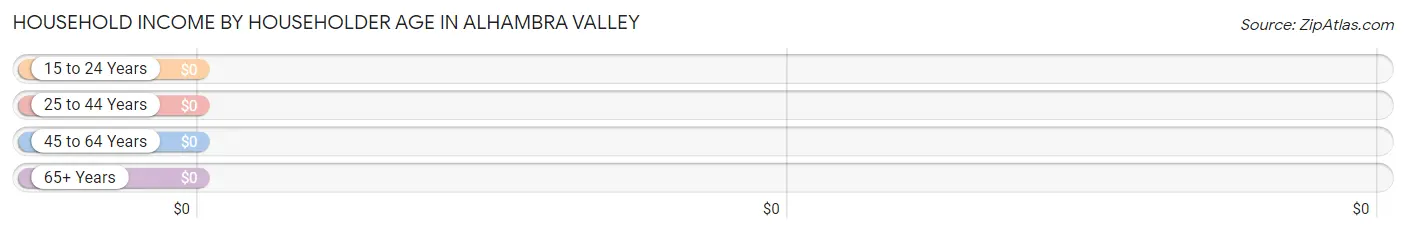
Household Income by Householder Age in Alhambra Valley
| Income Bracket | # Households | Median Income |
| 15 to 24 Years | 0 (0.0%) | $0 |
| 25 to 44 Years | 53 (17.2%) | $0 |
| 45 to 64 Years | 87 (28.2%) | $0 |
| 65+ Years | 168 (54.5%) | $0 |
| Total | 308 (100.0%) | $194,000 |
Poverty in Alhambra Valley
Income Below Poverty by Sex and Age in Alhambra Valley
With 15.2% poverty level for males and 25.5% for females among the residents of Alhambra Valley, 6 to 11 year old males and under 5 year old females are the most vulnerable to poverty, with 53 males (44.9%) and 41 females (100.0%) in their respective age groups living below the poverty level.
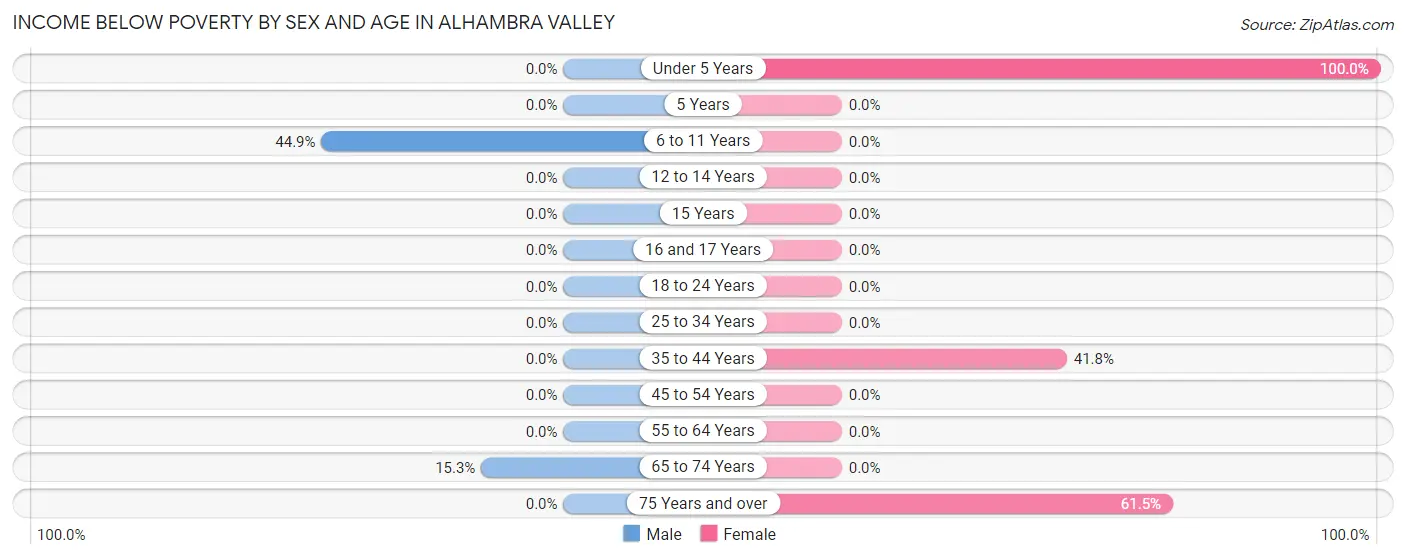
| Age Bracket | Male | Female |
| Under 5 Years | 0 (0.0%) | 41 (100.0%) |
| 5 Years | 0 (0.0%) | 0 (0.0%) |
| 6 to 11 Years | 53 (44.9%) | 0 (0.0%) |
| 12 to 14 Years | 0 (0.0%) | 0 (0.0%) |
| 15 Years | 0 (0.0%) | 0 (0.0%) |
| 16 and 17 Years | 0 (0.0%) | 0 (0.0%) |
| 18 to 24 Years | 0 (0.0%) | 0 (0.0%) |
| 25 to 34 Years | 0 (0.0%) | 0 (0.0%) |
| 35 to 44 Years | 0 (0.0%) | 38 (41.8%) |
| 45 to 54 Years | 0 (0.0%) | 0 (0.0%) |
| 55 to 64 Years | 0 (0.0%) | 0 (0.0%) |
| 65 to 74 Years | 9 (15.2%) | 0 (0.0%) |
| 75 Years and over | 0 (0.0%) | 51 (61.5%) |
| Total | 62 (15.2%) | 130 (25.5%) |
Income Above Poverty by Sex and Age in Alhambra Valley
According to the poverty statistics in Alhambra Valley, males aged 16 and 17 years and females aged 6 to 11 years are the age groups that are most secure financially, with 100.0% of males and 100.0% of females in these age groups living above the poverty line.
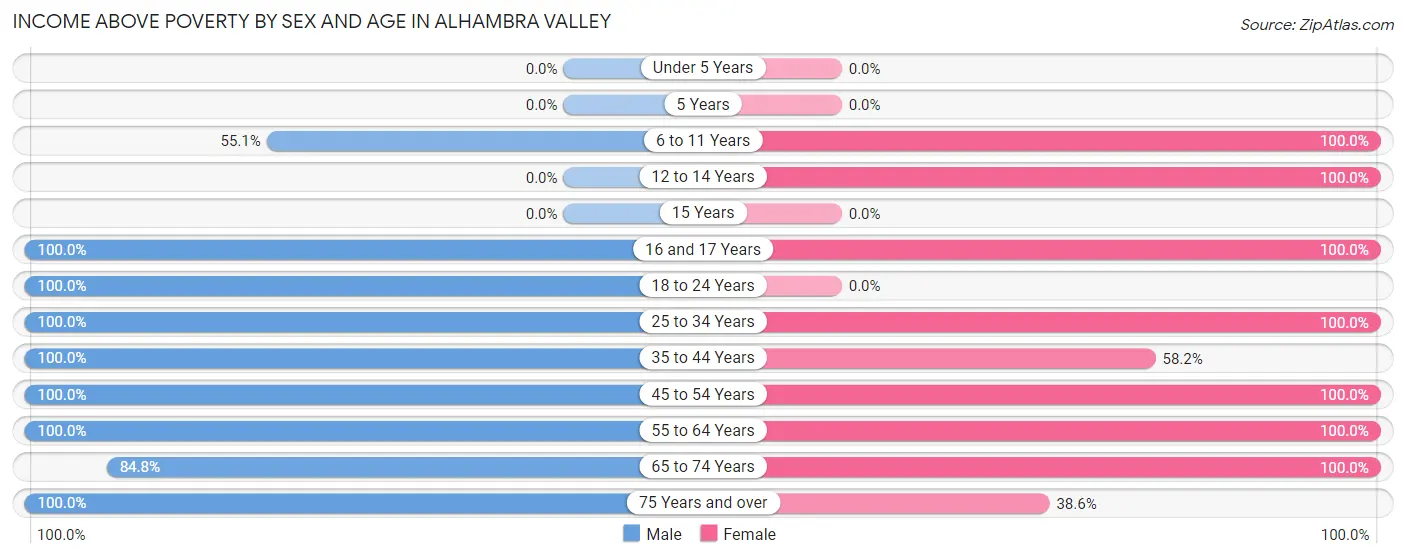
| Age Bracket | Male | Female |
| Under 5 Years | 0 (0.0%) | 0 (0.0%) |
| 5 Years | 0 (0.0%) | 0 (0.0%) |
| 6 to 11 Years | 65 (55.1%) | 32 (100.0%) |
| 12 to 14 Years | 0 (0.0%) | 15 (100.0%) |
| 15 Years | 0 (0.0%) | 0 (0.0%) |
| 16 and 17 Years | 14 (100.0%) | 6 (100.0%) |
| 18 to 24 Years | 9 (100.0%) | 0 (0.0%) |
| 25 to 34 Years | 51 (100.0%) | 50 (100.0%) |
| 35 to 44 Years | 48 (100.0%) | 53 (58.2%) |
| 45 to 54 Years | 8 (100.0%) | 40 (100.0%) |
| 55 to 64 Years | 59 (100.0%) | 91 (100.0%) |
| 65 to 74 Years | 50 (84.8%) | 60 (100.0%) |
| 75 Years and over | 42 (100.0%) | 32 (38.6%) |
| Total | 346 (84.8%) | 379 (74.5%) |
Income Below Poverty Among Married-Couple Families in Alhambra Valley
| Children | Above Poverty | Below Poverty |
| No Children | 88 (100.0%) | 0 (0.0%) |
| 1 or 2 Children | 77 (100.0%) | 0 (0.0%) |
| 3 or 4 Children | 0 (0.0%) | 0 (0.0%) |
| 5 or more Children | 0 (0.0%) | 0 (0.0%) |
| Total | 165 (100.0%) | 0 (0.0%) |
Income Below Poverty Among Single-Parent Households in Alhambra Valley
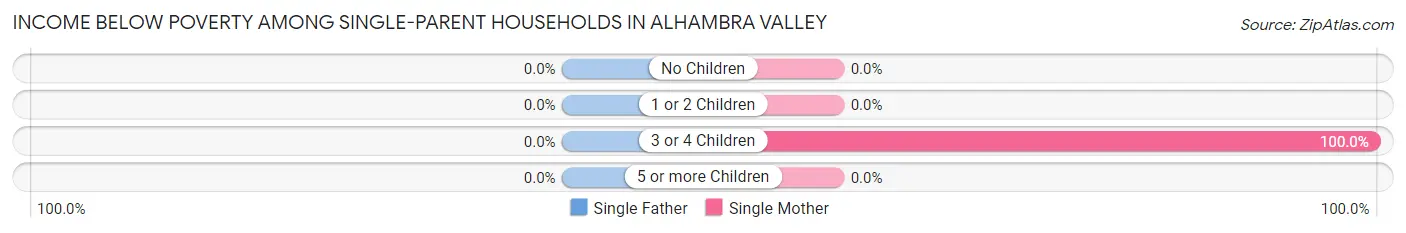
| Children | Single Father | Single Mother |
| No Children | 0 (0.0%) | 0 (0.0%) |
| 1 or 2 Children | 0 (0.0%) | 0 (0.0%) |
| 3 or 4 Children | 0 (0.0%) | 51 (100.0%) |
| 5 or more Children | 0 (0.0%) | 0 (0.0%) |
| Total | 0 (0.0%) | 51 (79.7%) |
Income Below Poverty Among Married-Couple vs Single-Parent Households in Alhambra Valley
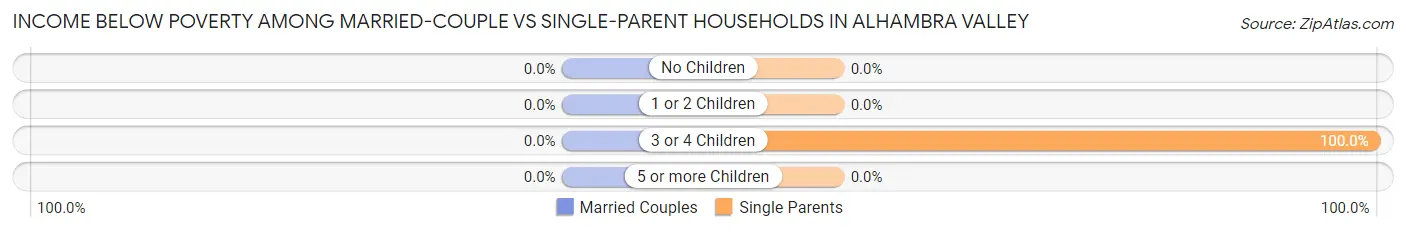
| Children | Married-Couple Families | Single-Parent Households |
| No Children | 0 (0.0%) | 0 (0.0%) |
| 1 or 2 Children | 0 (0.0%) | 0 (0.0%) |
| 3 or 4 Children | 0 (0.0%) | 51 (100.0%) |
| 5 or more Children | 0 (0.0%) | 0 (0.0%) |
| Total | 0 (0.0%) | 51 (79.7%) |
Race in Alhambra Valley
The most populous races in Alhambra Valley are White / Caucasian (736 | 80.3%), Black / African American (116 | 12.7%), and Hispanic or Latino (55 | 6.0%).
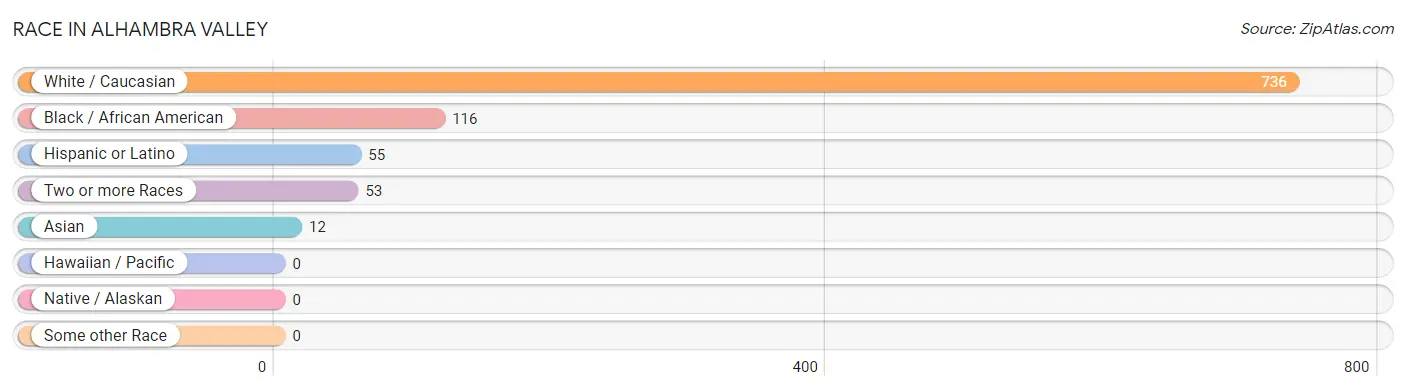
| Race | # Population | % Population |
| Asian | 12 | 1.3% |
| Black / African American | 116 | 12.7% |
| Hawaiian / Pacific | 0 | 0.0% |
| Hispanic or Latino | 55 | 6.0% |
| Native / Alaskan | 0 | 0.0% |
| White / Caucasian | 736 | 80.3% |
| Two or more Races | 53 | 5.8% |
| Some other Race | 0 | 0.0% |
| Total | 917 | 100.0% |
Ancestry in Alhambra Valley
The most populous ancestries reported in Alhambra Valley are European (195 | 21.3%), German (144 | 15.7%), English (125 | 13.6%), Italian (118 | 12.9%), and Norwegian (81 | 8.8%), together accounting for 72.3% of all Alhambra Valley residents.
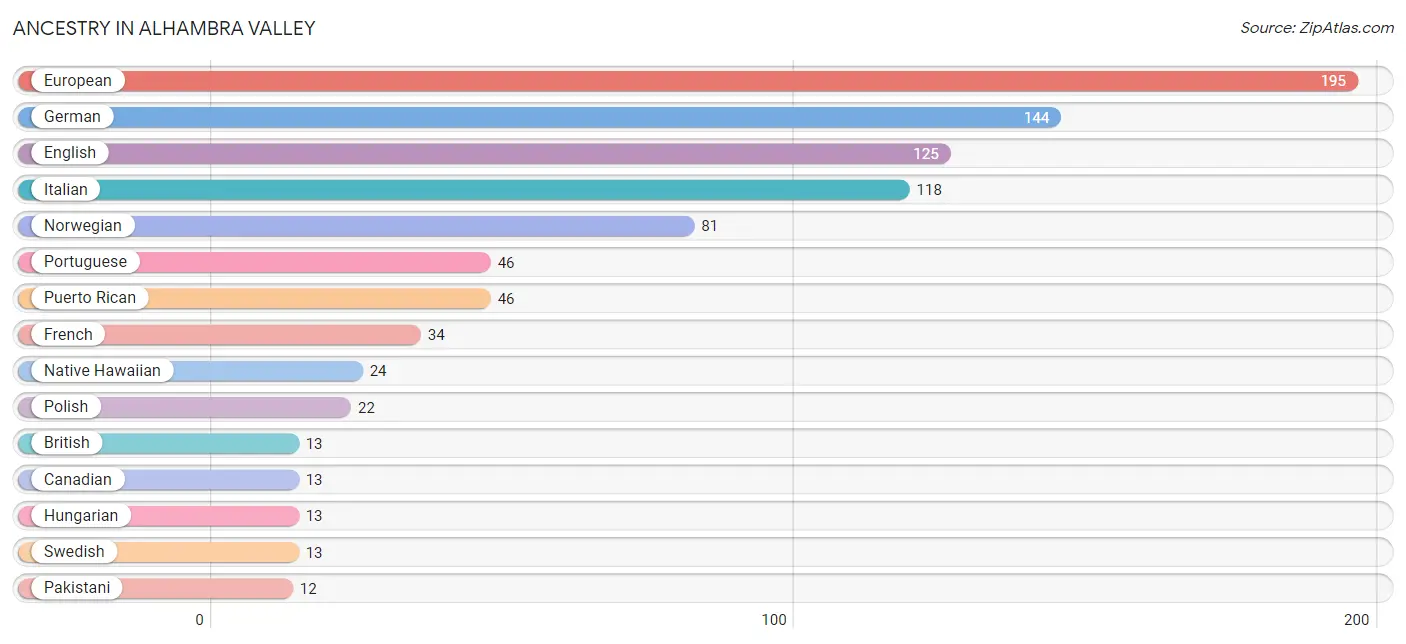
| Ancestry | # Population | % Population |
| British | 13 | 1.4% |
| Canadian | 13 | 1.4% |
| Central American | 9 | 1.0% |
| Eastern European | 9 | 1.0% |
| English | 125 | 13.6% |
| European | 195 | 21.3% |
| French | 34 | 3.7% |
| German | 144 | 15.7% |
| Hungarian | 13 | 1.4% |
| Irish | 9 | 1.0% |
| Italian | 118 | 12.9% |
| Native Hawaiian | 24 | 2.6% |
| Norwegian | 81 | 8.8% |
| Pakistani | 12 | 1.3% |
| Panamanian | 9 | 1.0% |
| Polish | 22 | 2.4% |
| Portuguese | 46 | 5.0% |
| Puerto Rican | 46 | 5.0% |
| Scottish | 8 | 0.9% |
| Swedish | 13 | 1.4% | View All 20 Rows |
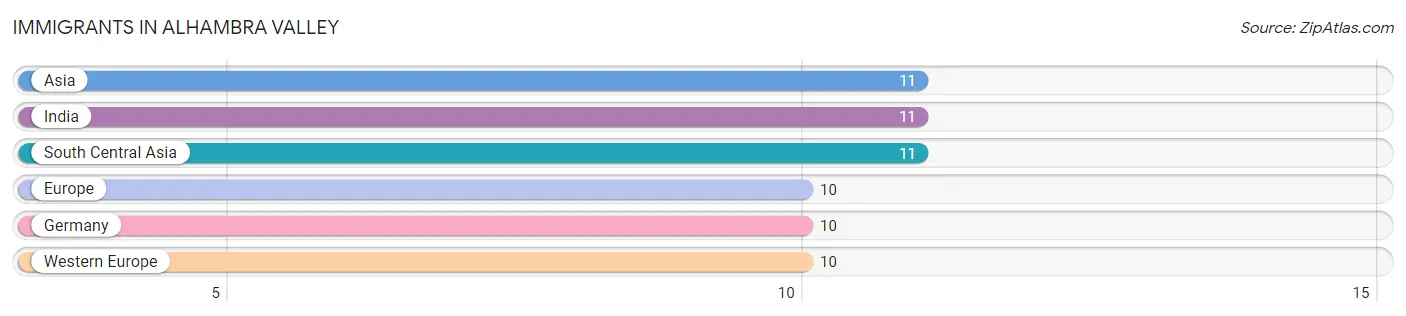
Immigrants in Alhambra Valley
The most numerous immigrant groups reported in Alhambra Valley came from Asia (11 | 1.2%), India (11 | 1.2%), South Central Asia (11 | 1.2%), Europe (10 | 1.1%), and Germany (10 | 1.1%), together accounting for 5.8% of all Alhambra Valley residents.
| Immigration Origin | # Population | % Population |
| Asia | 11 | 1.2% |
| Europe | 10 | 1.1% |
| Germany | 10 | 1.1% |
| India | 11 | 1.2% |
| South Central Asia | 11 | 1.2% |
| Western Europe | 10 | 1.1% | View All 6 Rows |
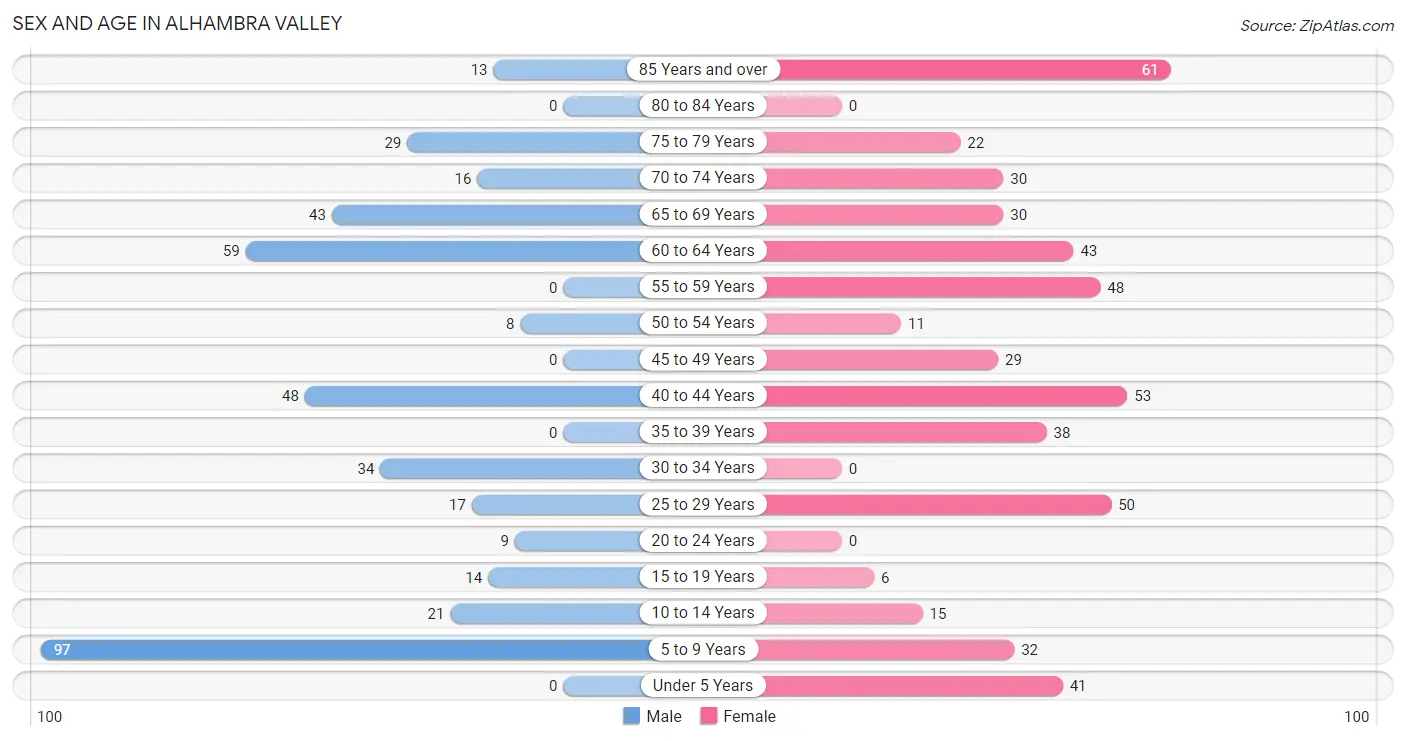
Sex and Age in Alhambra Valley
Sex and Age in Alhambra Valley
The most populous age groups in Alhambra Valley are 5 to 9 Years (97 | 23.8%) for men and 85 Years and over (61 | 12.0%) for women.
| Age Bracket | Male | Female |
| Under 5 Years | 0 (0.0%) | 41 (8.1%) |
| 5 to 9 Years | 97 (23.8%) | 32 (6.3%) |
| 10 to 14 Years | 21 (5.1%) | 15 (2.9%) |
| 15 to 19 Years | 14 (3.4%) | 6 (1.2%) |
| 20 to 24 Years | 9 (2.2%) | 0 (0.0%) |
| 25 to 29 Years | 17 (4.2%) | 50 (9.8%) |
| 30 to 34 Years | 34 (8.3%) | 0 (0.0%) |
| 35 to 39 Years | 0 (0.0%) | 38 (7.5%) |
| 40 to 44 Years | 48 (11.8%) | 53 (10.4%) |
| 45 to 49 Years | 0 (0.0%) | 29 (5.7%) |
| 50 to 54 Years | 8 (2.0%) | 11 (2.2%) |
| 55 to 59 Years | 0 (0.0%) | 48 (9.4%) |
| 60 to 64 Years | 59 (14.5%) | 43 (8.5%) |
| 65 to 69 Years | 43 (10.5%) | 30 (5.9%) |
| 70 to 74 Years | 16 (3.9%) | 30 (5.9%) |
| 75 to 79 Years | 29 (7.1%) | 22 (4.3%) |
| 80 to 84 Years | 0 (0.0%) | 0 (0.0%) |
| 85 Years and over | 13 (3.2%) | 61 (12.0%) |
| Total | 408 (100.0%) | 509 (100.0%) |
Families and Households in Alhambra Valley
Median Family Size in Alhambra Valley
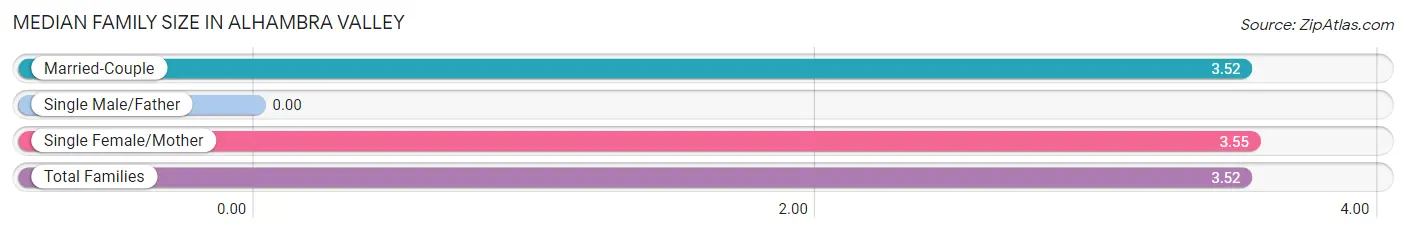
| Family Type | # Families | Family Size |
| Married-Couple | 165 (72.1%) | 3.52 |
| Single Male/Father | 0 (0.0%) | - |
| Single Female/Mother | 64 (28.0%) | 3.55 |
| Total Families | 229 (100.0%) | 3.52 |
Median Household Size in Alhambra Valley
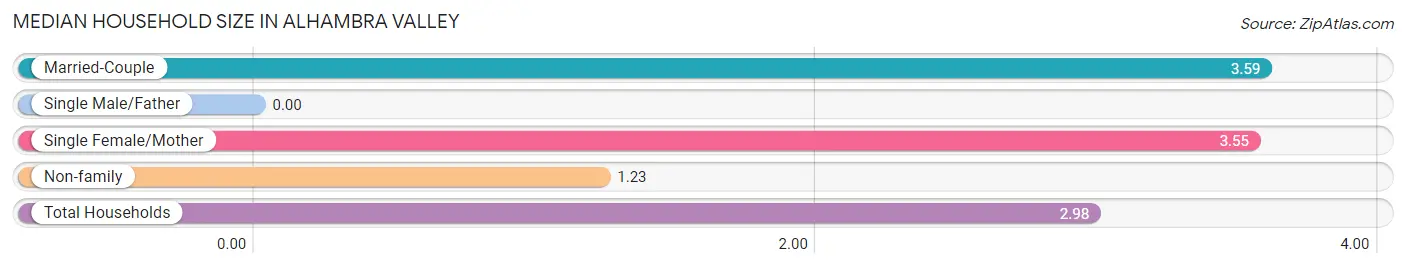
| Household Type | # Households | Household Size |
| Married-Couple | 165 (53.6%) | 3.59 |
| Single Male/Father | 0 (0.0%) | - |
| Single Female/Mother | 64 (20.8%) | 3.55 |
| Non-family | 79 (25.7%) | 1.23 |
| Total Households | 308 (100.0%) | 2.98 |
Household Size by Marriage Status in Alhambra Valley
Out of a total of 308 households in Alhambra Valley, 229 (74.4%) are family households, while 79 (25.7%) are nonfamily households. The most numerous type of family households are 5-person households, comprising 86, and the most common type of nonfamily households are 1-person households, comprising 61.
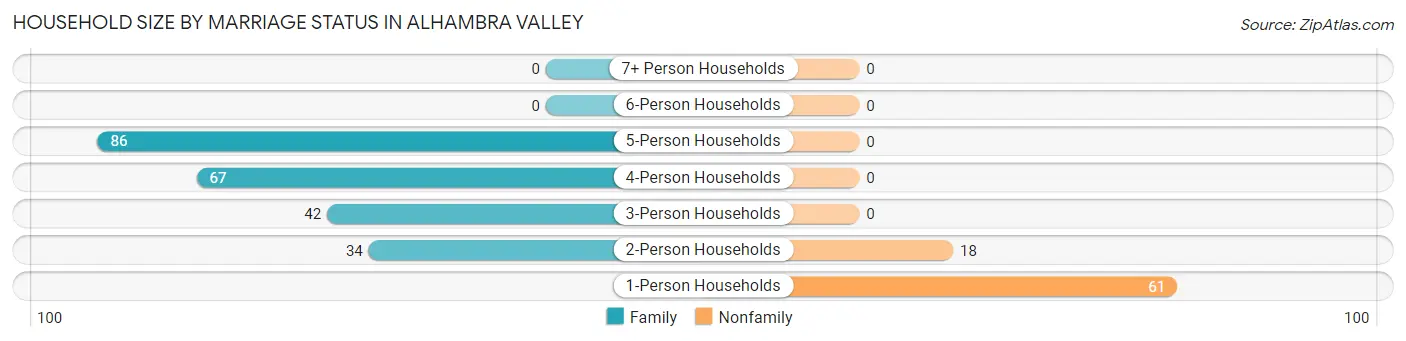
| Household Size | Family Households | Nonfamily Households |
| 1-Person Households | - | 61 (19.8%) |
| 2-Person Households | 34 (11.0%) | 18 (5.8%) |
| 3-Person Households | 42 (13.6%) | 0 (0.0%) |
| 4-Person Households | 67 (21.7%) | 0 (0.0%) |
| 5-Person Households | 86 (27.9%) | 0 (0.0%) |
| 6-Person Households | 0 (0.0%) | 0 (0.0%) |
| 7+ Person Households | 0 (0.0%) | 0 (0.0%) |
| Total | 229 (74.4%) | 79 (25.7%) |
Female Fertility in Alhambra Valley
Fertility by Age in Alhambra Valley
| Age Bracket | Women with Births | Births / 1,000 Women |
| 15 to 19 years | 0 (0.0%) | 0.0 |
| 20 to 34 years | 0 (0.0%) | 0.0 |
| 35 to 50 years | 0 (0.0%) | 0.0 |
| Total | 0 (0.0%) | 0.0 |
Fertility by Age by Marriage Status in Alhambra Valley
| Age Bracket | Married | Unmarried |
| 15 to 19 years | 0 (0.0%) | 0 (0.0%) |
| 20 to 34 years | 0 (0.0%) | 0 (0.0%) |
| 35 to 50 years | 0 (0.0%) | 0 (0.0%) |
| Total | 0 (0.0%) | 0 (0.0%) |
Fertility by Education in Alhambra Valley
| Educational Attainment | Women with Births | Births / 1,000 Women |
| Less than High School | 0 (0.0%) | 0.0 |
| High School Diploma | 0 (0.0%) | 0.0 |
| College or Associate's Degree | 0 (0.0%) | 0.0 |
| Bachelor's Degree | 0 (0.0%) | 0.0 |
| Graduate Degree | 0 (0.0%) | 0.0 |
| Total | 0 (0.0%) | 0.0 |
Fertility by Education by Marriage Status in Alhambra Valley
| Educational Attainment | Married | Unmarried |
| Less than High School | 0 (0.0%) | 0 (0.0%) |
| High School Diploma | 0 (0.0%) | 0 (0.0%) |
| College or Associate's Degree | 0 (0.0%) | 0 (0.0%) |
| Bachelor's Degree | 0 (0.0%) | 0 (0.0%) |
| Graduate Degree | 0 (0.0%) | 0 (0.0%) |
| Total | 0 (0.0%) | 0 (0.0%) |
Employment Characteristics in Alhambra Valley
Employment by Class of Employer in Alhambra Valley
Among the 372 employed individuals in Alhambra Valley, private company employees (250 | 67.2%), local government employees (53 | 14.2%), and self-employed (not incorporated) (32 | 8.6%) make up the most common classes of employment.
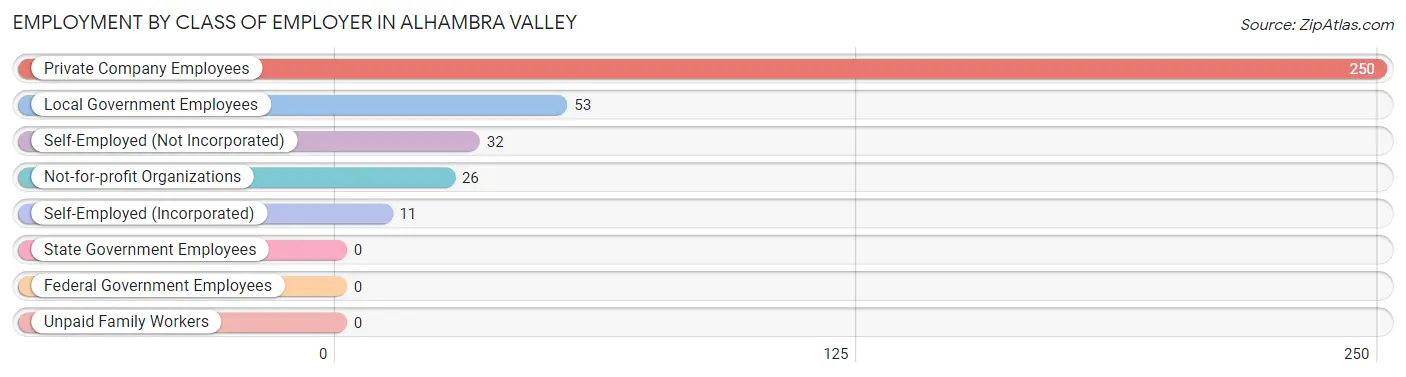
| Employer Class | # Employees | % Employees |
| Private Company Employees | 250 | 67.2% |
| Self-Employed (Incorporated) | 11 | 3.0% |
| Self-Employed (Not Incorporated) | 32 | 8.6% |
| Not-for-profit Organizations | 26 | 7.0% |
| Local Government Employees | 53 | 14.2% |
| State Government Employees | 0 | 0.0% |
| Federal Government Employees | 0 | 0.0% |
| Unpaid Family Workers | 0 | 0.0% |
| Total | 372 | 100.0% |
Employment Status by Age in Alhambra Valley
According to the labor force statistics for Alhambra Valley, out of the total population over 16 years of age (711), 60.3% or 429 individuals are in the labor force, with 12.1% or 52 of them unemployed. The age group with the highest labor force participation rate is 20 to 24 years, with 100.0% or 9 individuals in the labor force. Within the labor force, the 16 to 19 years age range has the highest percentage of unemployed individuals, with 100.0% or 14 of them being unemployed.
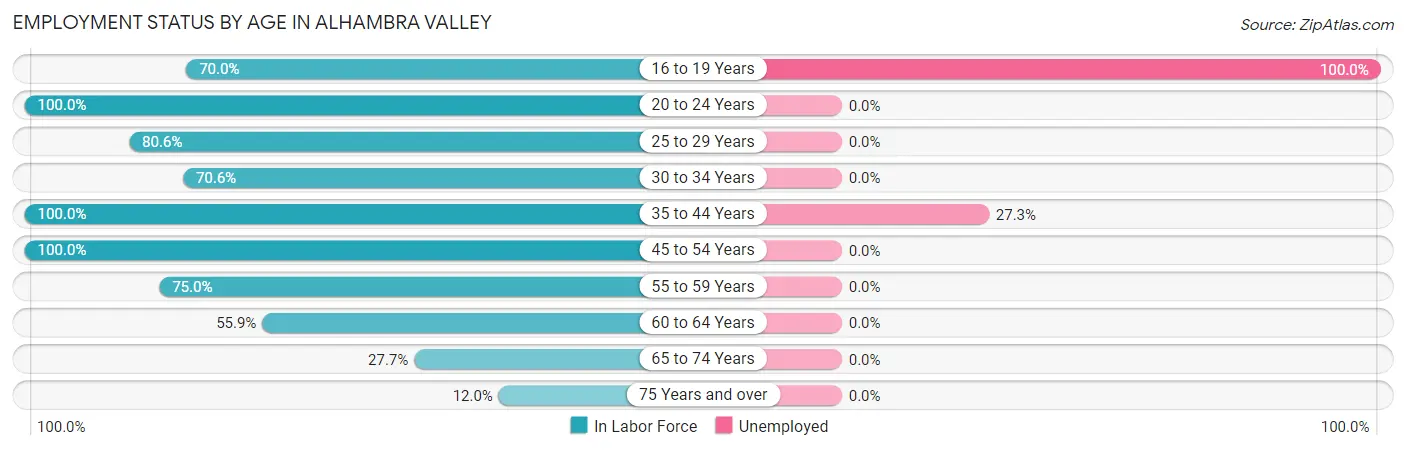
| Age Bracket | In Labor Force | Unemployed |
| 16 to 19 Years | 14 (70.0%) | 14 (100.0%) |
| 20 to 24 Years | 9 (100.0%) | 0 (0.0%) |
| 25 to 29 Years | 54 (80.6%) | 0 (0.0%) |
| 30 to 34 Years | 24 (70.6%) | 0 (0.0%) |
| 35 to 44 Years | 139 (100.0%) | 38 (27.3%) |
| 45 to 54 Years | 48 (100.0%) | 0 (0.0%) |
| 55 to 59 Years | 36 (75.0%) | 0 (0.0%) |
| 60 to 64 Years | 57 (55.9%) | 0 (0.0%) |
| 65 to 74 Years | 33 (27.7%) | 0 (0.0%) |
| 75 Years and over | 15 (12.0%) | 0 (0.0%) |
| Total | 429 (60.3%) | 52 (12.1%) |
Employment Status by Educational Attainment in Alhambra Valley
According to labor force statistics for Alhambra Valley, 81.7% of individuals (358) out of the total population between 25 and 64 years of age (438) are in the labor force, with 10.6% or 38 of them being unemployed. The group with the highest labor force participation rate are those with the educational attainment of college / associate degree, with 100.0% or 132 individuals in the labor force. Within the labor force, individuals with college / associate degree education have the highest percentage of unemployment, with 28.8% or 38 of them being unemployed.
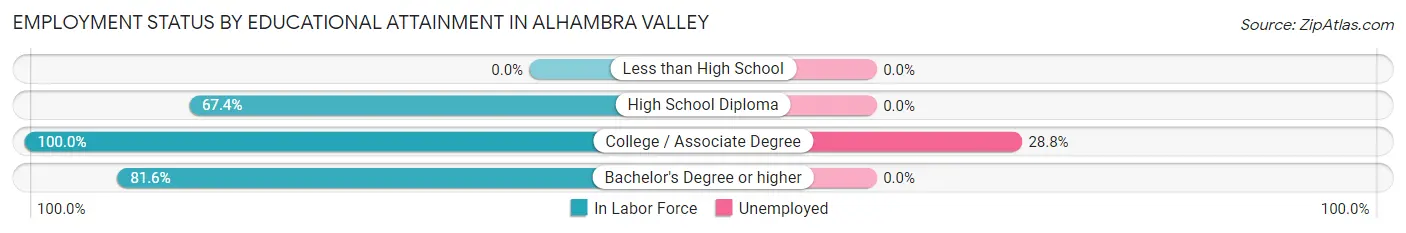
| Educational Attainment | In Labor Force | Unemployed |
| Less than High School | 0 (0.0%) | 0 (0.0%) |
| High School Diploma | 62 (67.4%) | 0 (0.0%) |
| College / Associate Degree | 132 (100.0%) | 38 (28.8%) |
| Bachelor's Degree or higher | 164 (81.6%) | 0 (0.0%) |
| Total | 358 (81.7%) | 46 (10.6%) |
Employment Occupations by Sex in Alhambra Valley
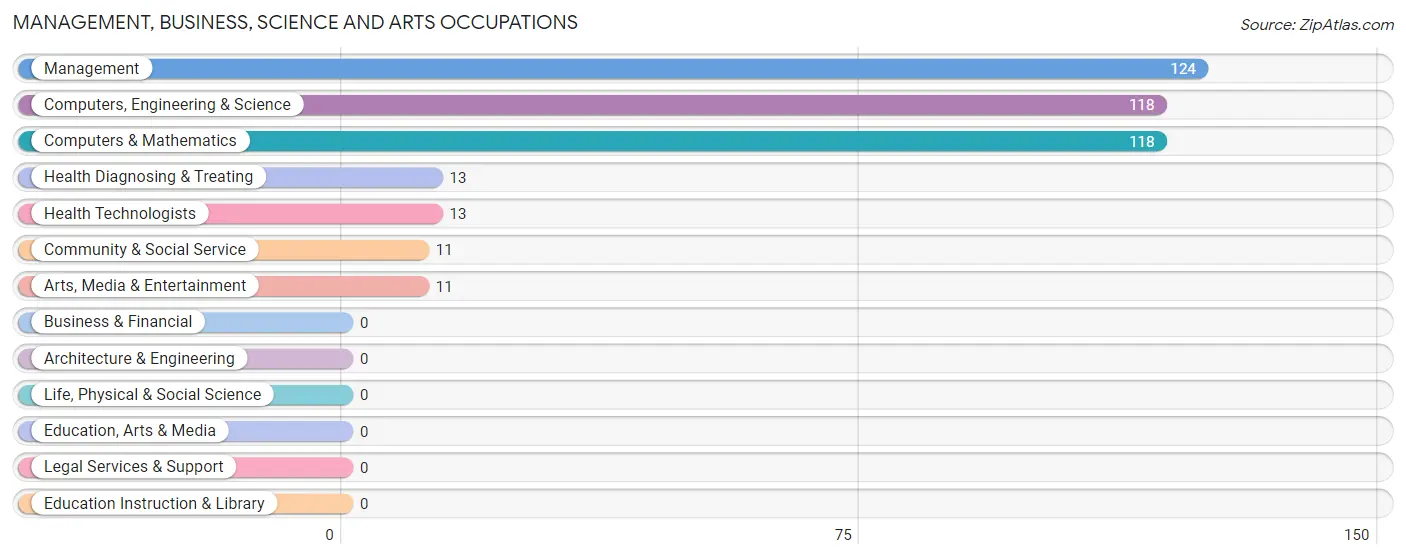
Management, Business, Science and Arts Occupations
The most common Management, Business, Science and Arts occupations in Alhambra Valley are Management (124 | 32.9%), Computers, Engineering & Science (118 | 31.3%), Computers & Mathematics (118 | 31.3%), Health Diagnosing & Treating (13 | 3.5%), and Health Technologists (13 | 3.5%).
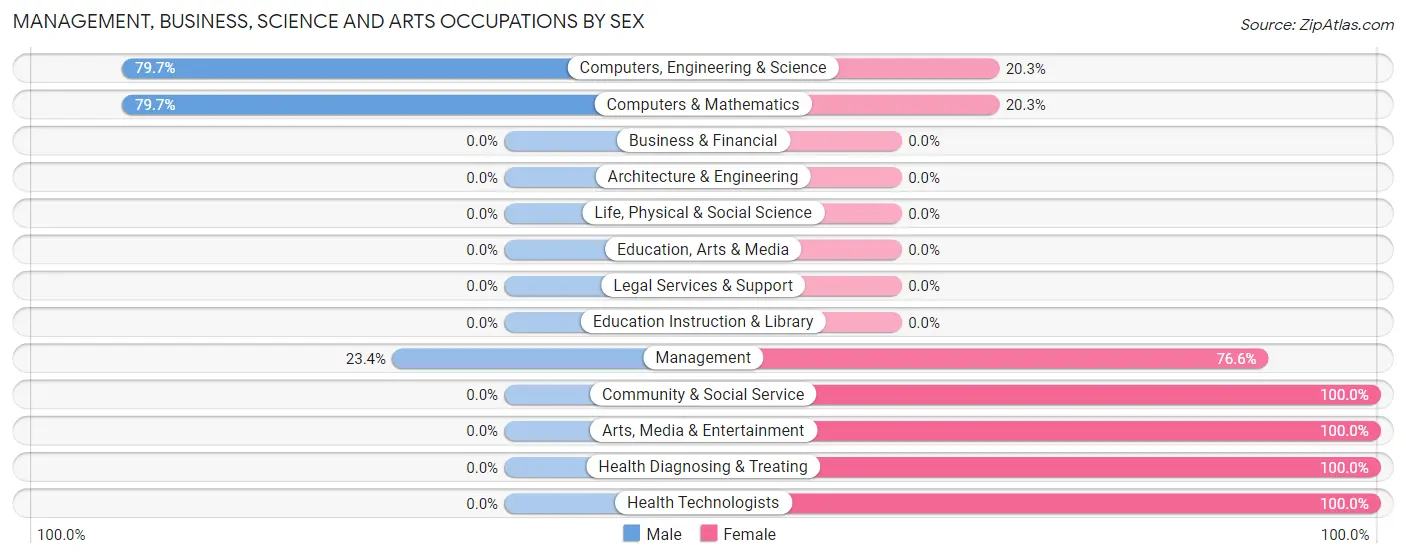
Management, Business, Science and Arts Occupations by Sex
Within the Management, Business, Science and Arts occupations in Alhambra Valley, the most male-oriented occupations are Computers, Engineering & Science (79.7%), Computers & Mathematics (79.7%), and Management (23.4%), while the most female-oriented occupations are Community & Social Service (100.0%), Arts, Media & Entertainment (100.0%), and Health Diagnosing & Treating (100.0%).
| Occupation | Male | Female |
| Management | 29 (23.4%) | 95 (76.6%) |
| Business & Financial | 0 (0.0%) | 0 (0.0%) |
| Computers, Engineering & Science | 94 (79.7%) | 24 (20.3%) |
| Computers & Mathematics | 94 (79.7%) | 24 (20.3%) |
| Architecture & Engineering | 0 (0.0%) | 0 (0.0%) |
| Life, Physical & Social Science | 0 (0.0%) | 0 (0.0%) |
| Community & Social Service | 0 (0.0%) | 11 (100.0%) |
| Education, Arts & Media | 0 (0.0%) | 0 (0.0%) |
| Legal Services & Support | 0 (0.0%) | 0 (0.0%) |
| Education Instruction & Library | 0 (0.0%) | 0 (0.0%) |
| Arts, Media & Entertainment | 0 (0.0%) | 11 (100.0%) |
| Health Diagnosing & Treating | 0 (0.0%) | 13 (100.0%) |
| Health Technologists | 0 (0.0%) | 13 (100.0%) |
| Total (Category) | 123 (46.2%) | 143 (53.8%) |
| Total (Overall) | 173 (45.9%) | 204 (54.1%) |
Services Occupations
Services Occupations by Sex
| Occupation | Male | Female |
| Healthcare Support | 0 (0.0%) | 0 (0.0%) |
| Security & Protection | 0 (0.0%) | 0 (0.0%) |
| Firefighting & Prevention | 0 (0.0%) | 0 (0.0%) |
| Law Enforcement | 0 (0.0%) | 0 (0.0%) |
| Food Preparation & Serving | 0 (0.0%) | 0 (0.0%) |
| Cleaning & Maintenance | 0 (0.0%) | 0 (0.0%) |
| Personal Care & Service | 0 (0.0%) | 0 (0.0%) |
| Total (Category) | 0 (0.0%) | 0 (0.0%) |
| Total (Overall) | 173 (45.9%) | 204 (54.1%) |
Sales and Office Occupations
The most common Sales and Office occupations in Alhambra Valley are Office & Administration (42 | 11.1%), and Sales & Related (38 | 10.1%).
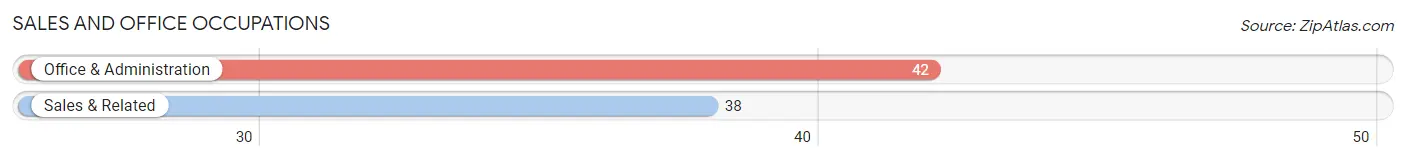
Sales and Office Occupations by Sex

| Occupation | Male | Female |
| Sales & Related | 19 (50.0%) | 19 (50.0%) |
| Office & Administration | 0 (0.0%) | 42 (100.0%) |
| Total (Category) | 19 (23.7%) | 61 (76.2%) |
| Total (Overall) | 173 (45.9%) | 204 (54.1%) |
Natural Resources, Construction and Maintenance Occupations
The most common Natural Resources, Construction and Maintenance occupations in Alhambra Valley are , and Installation, Maintenance & Repair (14 | 3.7%).
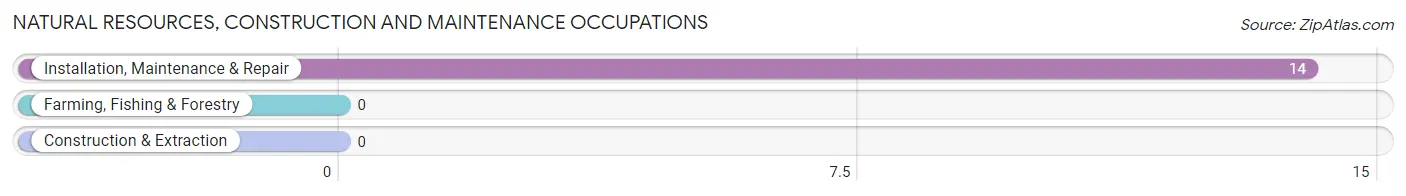
Natural Resources, Construction and Maintenance Occupations by Sex
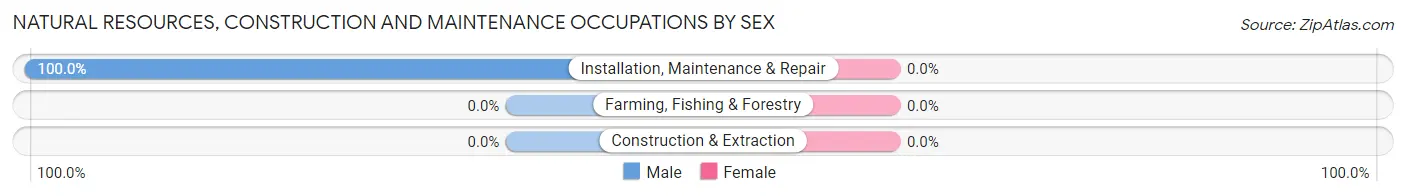
| Occupation | Male | Female |
| Farming, Fishing & Forestry | 0 (0.0%) | 0 (0.0%) |
| Construction & Extraction | 0 (0.0%) | 0 (0.0%) |
| Installation, Maintenance & Repair | 14 (100.0%) | 0 (0.0%) |
| Total (Category) | 14 (100.0%) | 0 (0.0%) |
| Total (Overall) | 173 (45.9%) | 204 (54.1%) |
Production, Transportation and Moving Occupations
The most common Production, Transportation and Moving occupations in Alhambra Valley are Material Moving (12 | 3.2%), and Production (5 | 1.3%).
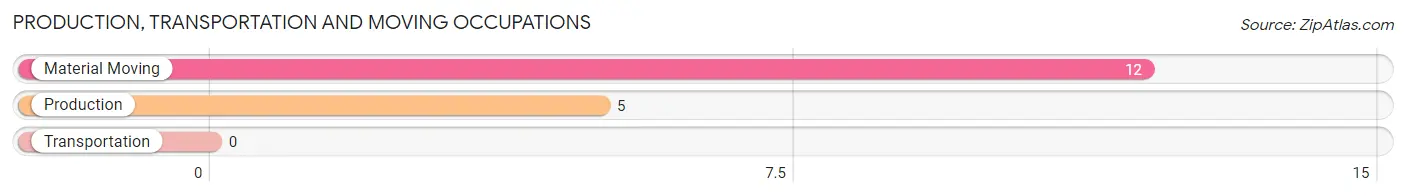
Production, Transportation and Moving Occupations by Sex
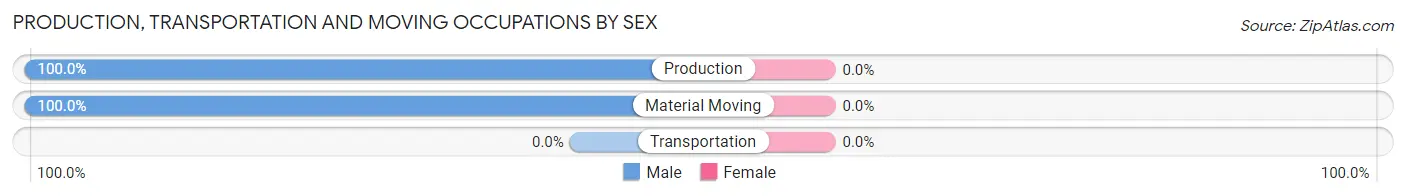
| Occupation | Male | Female |
| Production | 5 (100.0%) | 0 (0.0%) |
| Transportation | 0 (0.0%) | 0 (0.0%) |
| Material Moving | 12 (100.0%) | 0 (0.0%) |
| Total (Category) | 17 (100.0%) | 0 (0.0%) |
| Total (Overall) | 173 (45.9%) | 204 (54.1%) |
Employment Industries by Sex in Alhambra Valley
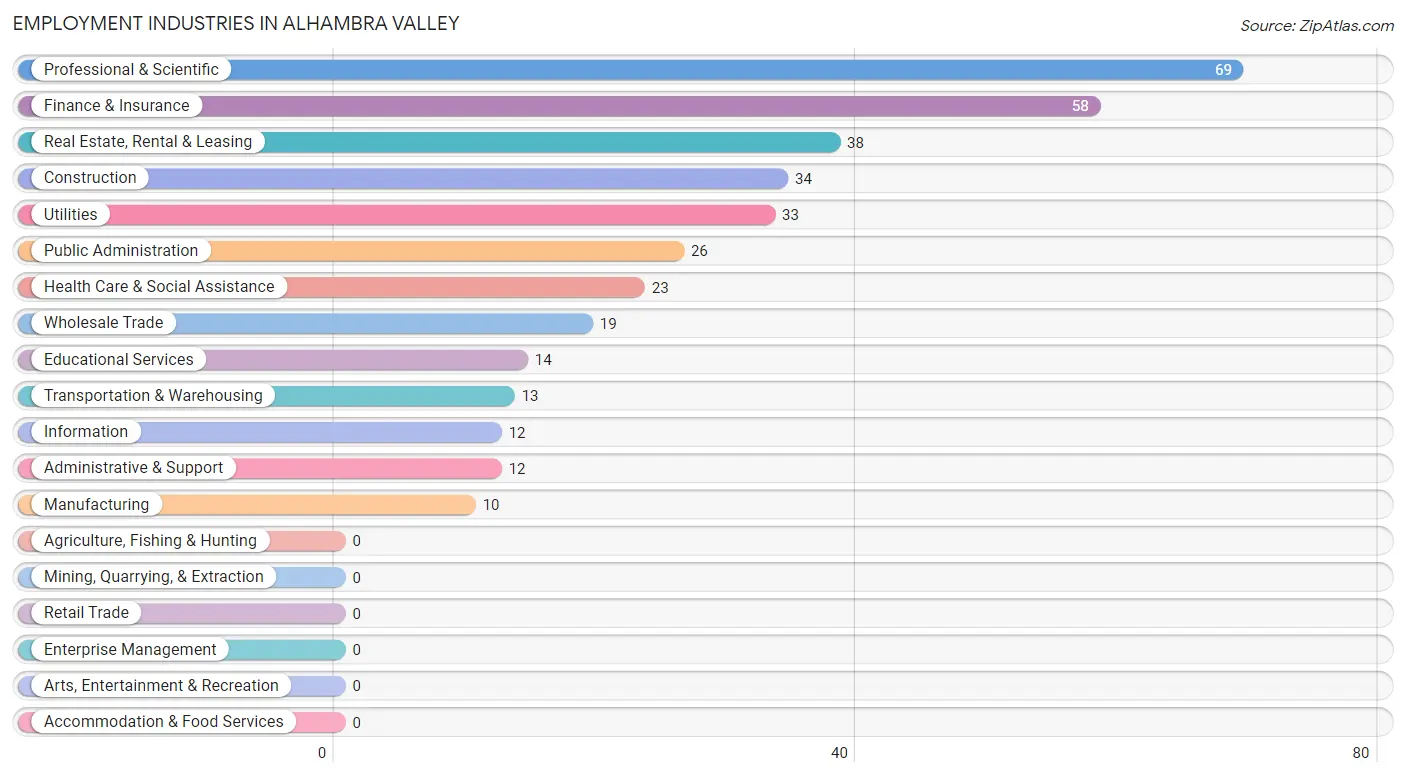
Employment Industries in Alhambra Valley
The major employment industries in Alhambra Valley include Professional & Scientific (69 | 18.3%), Finance & Insurance (58 | 15.4%), Real Estate, Rental & Leasing (38 | 10.1%), Construction (34 | 9.0%), and Utilities (33 | 8.7%).
Employment Industries by Sex in Alhambra Valley
The Alhambra Valley industries that see more men than women are Information (100.0%), Real Estate, Rental & Leasing (100.0%), and Administrative & Support (100.0%), whereas the industries that tend to have a higher number of women are Construction (100.0%), Manufacturing (100.0%), and Transportation & Warehousing (100.0%).
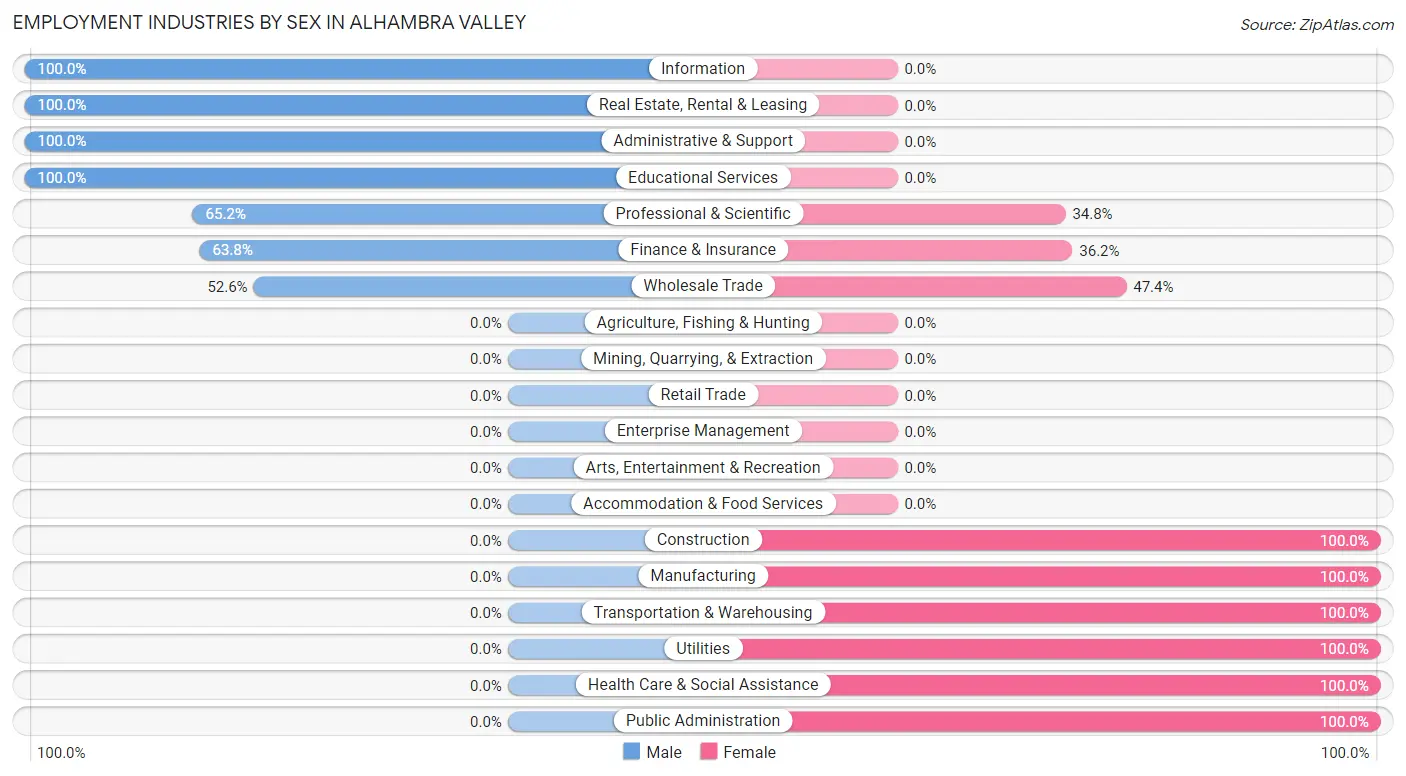
| Industry | Male | Female |
| Agriculture, Fishing & Hunting | 0 (0.0%) | 0 (0.0%) |
| Mining, Quarrying, & Extraction | 0 (0.0%) | 0 (0.0%) |
| Construction | 0 (0.0%) | 34 (100.0%) |
| Manufacturing | 0 (0.0%) | 10 (100.0%) |
| Wholesale Trade | 10 (52.6%) | 9 (47.4%) |
| Retail Trade | 0 (0.0%) | 0 (0.0%) |
| Transportation & Warehousing | 0 (0.0%) | 13 (100.0%) |
| Utilities | 0 (0.0%) | 33 (100.0%) |
| Information | 12 (100.0%) | 0 (0.0%) |
| Finance & Insurance | 37 (63.8%) | 21 (36.2%) |
| Real Estate, Rental & Leasing | 38 (100.0%) | 0 (0.0%) |
| Professional & Scientific | 45 (65.2%) | 24 (34.8%) |
| Enterprise Management | 0 (0.0%) | 0 (0.0%) |
| Administrative & Support | 12 (100.0%) | 0 (0.0%) |
| Educational Services | 14 (100.0%) | 0 (0.0%) |
| Health Care & Social Assistance | 0 (0.0%) | 23 (100.0%) |
| Arts, Entertainment & Recreation | 0 (0.0%) | 0 (0.0%) |
| Accommodation & Food Services | 0 (0.0%) | 0 (0.0%) |
| Public Administration | 0 (0.0%) | 26 (100.0%) |
| Total | 173 (45.9%) | 204 (54.1%) |
Education in Alhambra Valley
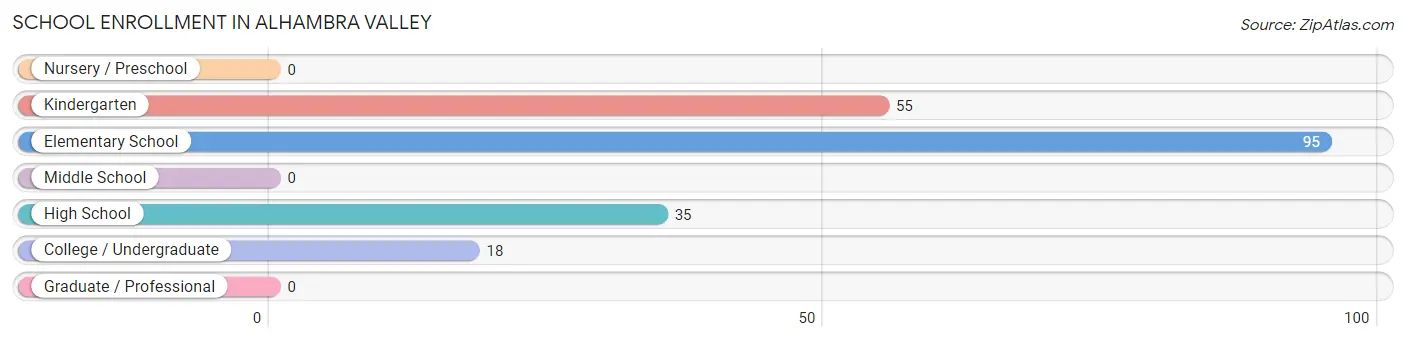
School Enrollment in Alhambra Valley
The most common levels of schooling among the 203 students in Alhambra Valley are elementary school (95 | 46.8%), kindergarten (55 | 27.1%), and high school (35 | 17.2%).
| School Level | # Students | % Students |
| Nursery / Preschool | 0 | 0.0% |
| Kindergarten | 55 | 27.1% |
| Elementary School | 95 | 46.8% |
| Middle School | 0 | 0.0% |
| High School | 35 | 17.2% |
| College / Undergraduate | 18 | 8.9% |
| Graduate / Professional | 0 | 0.0% |
| Total | 203 | 100.0% |
School Enrollment by Age by Funding Source in Alhambra Valley
Out of a total of 203 students who are enrolled in schools in Alhambra Valley, 55 (27.1%) attend a private institution, while the remaining 148 (72.9%) are enrolled in public schools. The age group of 5 to 9 year old has the highest likelihood of being enrolled in private schools, with 55 (42.6% in the age bracket) enrolled. Conversely, the age group of 10 to 14 year olds has the lowest likelihood of being enrolled in a private school, with 36 (100.0% in the age bracket) attending a public institution.
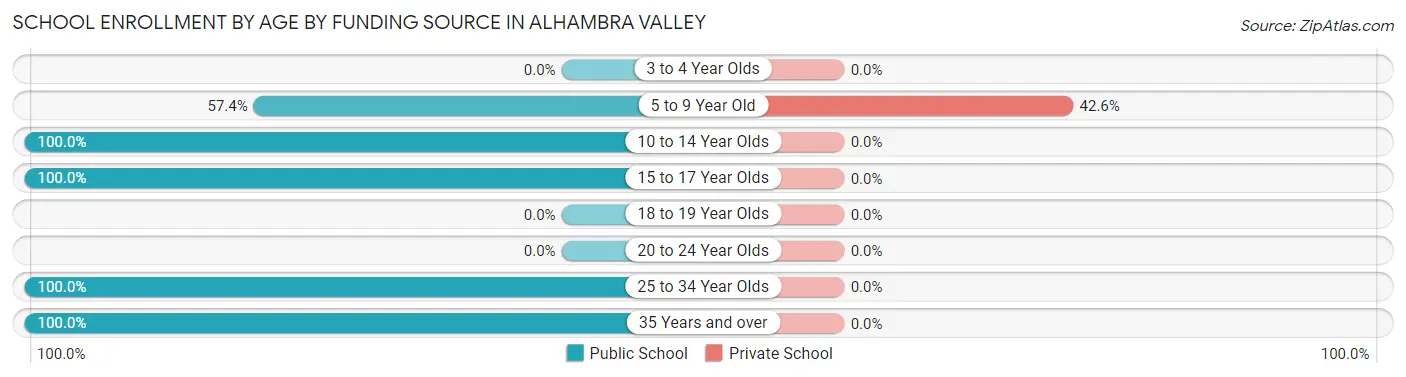
| Age Bracket | Public School | Private School |
| 3 to 4 Year Olds | 0 (0.0%) | 0 (0.0%) |
| 5 to 9 Year Old | 74 (57.4%) | 55 (42.6%) |
| 10 to 14 Year Olds | 36 (100.0%) | 0 (0.0%) |
| 15 to 17 Year Olds | 20 (100.0%) | 0 (0.0%) |
| 18 to 19 Year Olds | 0 (0.0%) | 0 (0.0%) |
| 20 to 24 Year Olds | 0 (0.0%) | 0 (0.0%) |
| 25 to 34 Year Olds | 8 (100.0%) | 0 (0.0%) |
| 35 Years and over | 10 (100.0%) | 0 (0.0%) |
| Total | 148 (72.9%) | 55 (27.1%) |
Educational Attainment by Field of Study in Alhambra Valley
Communications (69 | 20.6%), bio, nature & agricultural (36 | 10.7%), science & technology (35 | 10.4%), social sciences (32 | 9.6%), and physical & health sciences (28 | 8.4%) are the most common fields of study among 335 individuals in Alhambra Valley who have obtained a bachelor's degree or higher.
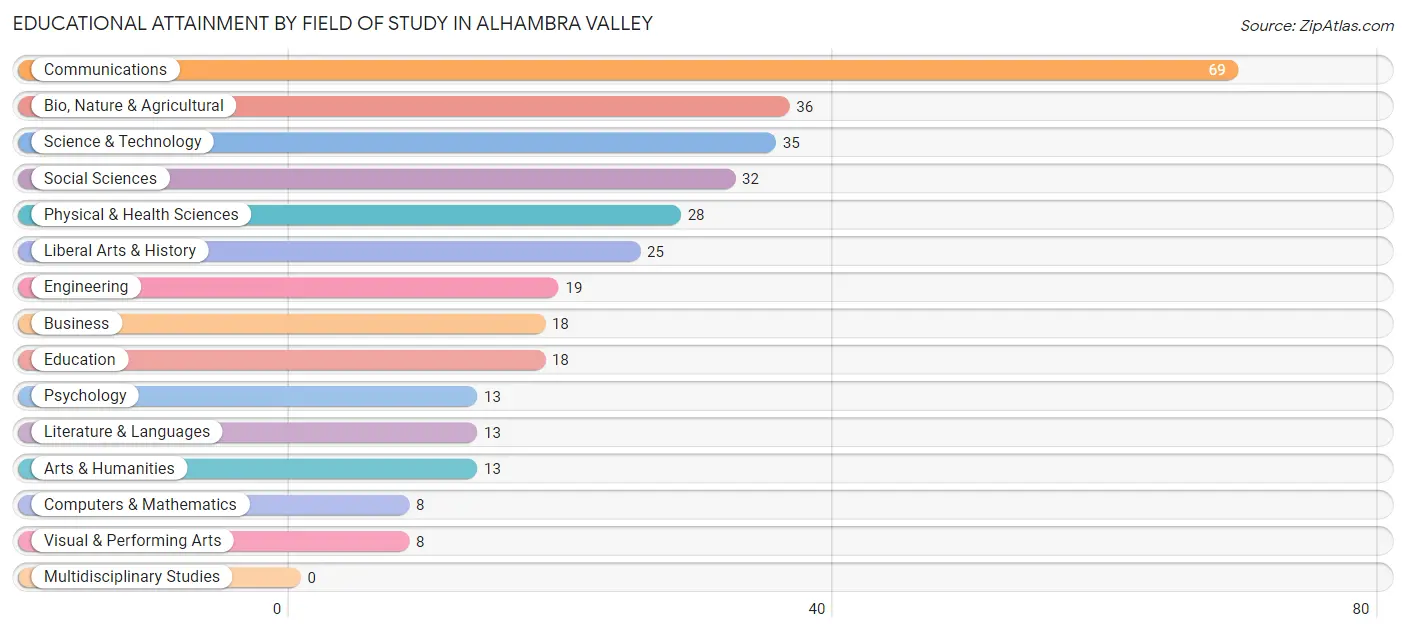
| Field of Study | # Graduates | % Graduates |
| Computers & Mathematics | 8 | 2.4% |
| Bio, Nature & Agricultural | 36 | 10.7% |
| Physical & Health Sciences | 28 | 8.4% |
| Psychology | 13 | 3.9% |
| Social Sciences | 32 | 9.6% |
| Engineering | 19 | 5.7% |
| Multidisciplinary Studies | 0 | 0.0% |
| Science & Technology | 35 | 10.4% |
| Business | 18 | 5.4% |
| Education | 18 | 5.4% |
| Literature & Languages | 13 | 3.9% |
| Liberal Arts & History | 25 | 7.5% |
| Visual & Performing Arts | 8 | 2.4% |
| Communications | 69 | 20.6% |
| Arts & Humanities | 13 | 3.9% |
| Total | 335 | 100.0% |
Transportation & Commute in Alhambra Valley
Vehicle Availability by Sex in Alhambra Valley
The most prevalent vehicle ownership categories in Alhambra Valley are males with 5 or more vehicles (66, accounting for 39.3%) and females with 5 or more vehicles (43, making up 32.4%).
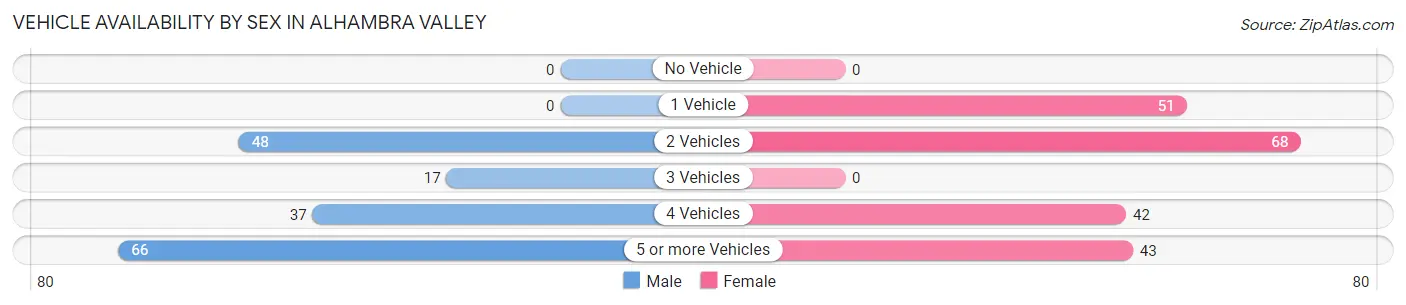
| Vehicles Available | Male | Female |
| No Vehicle | 0 (0.0%) | 0 (0.0%) |
| 1 Vehicle | 0 (0.0%) | 51 (25.0%) |
| 2 Vehicles | 48 (28.6%) | 68 (33.3%) |
| 3 Vehicles | 17 (10.1%) | 0 (0.0%) |
| 4 Vehicles | 37 (22.0%) | 42 (20.6%) |
| 5 or more Vehicles | 66 (39.3%) | 43 (21.1%) |
| Total | 168 (100.0%) | 204 (100.0%) |
Commute Time in Alhambra Valley
The most frequently occuring commute durations in Alhambra Valley are 20 to 24 minutes (44 commuters, 16.1%), 15 to 19 minutes (38 commuters, 13.9%), and 25 to 29 minutes (24 commuters, 8.8%).
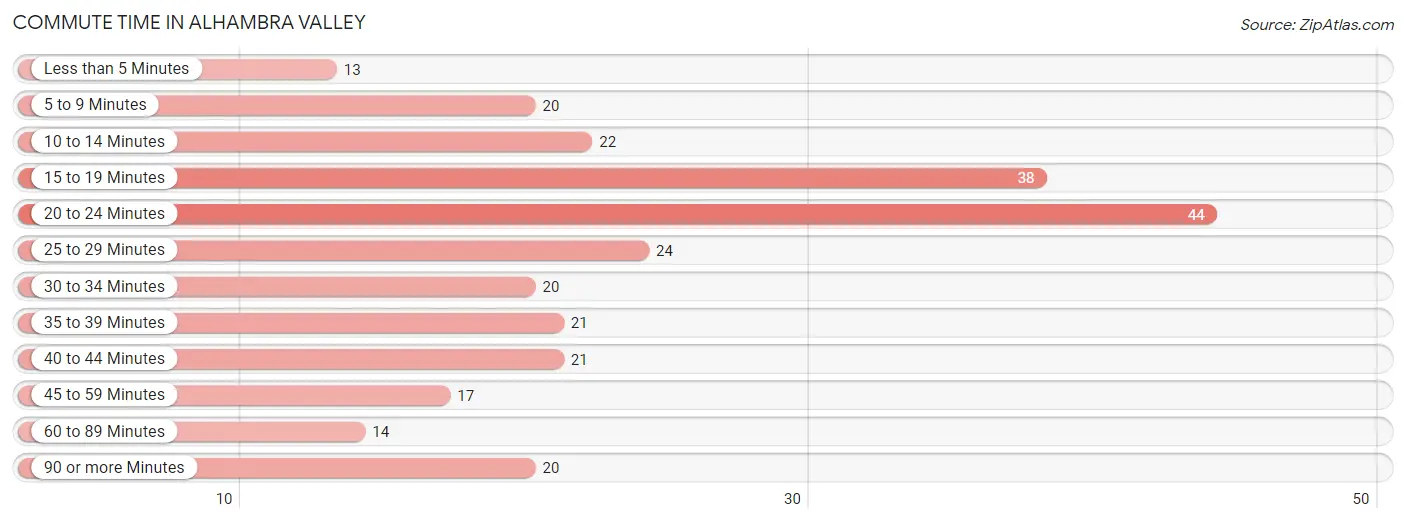
| Commute Time | # Commuters | % Commuters |
| Less than 5 Minutes | 13 | 4.7% |
| 5 to 9 Minutes | 20 | 7.3% |
| 10 to 14 Minutes | 22 | 8.0% |
| 15 to 19 Minutes | 38 | 13.9% |
| 20 to 24 Minutes | 44 | 16.1% |
| 25 to 29 Minutes | 24 | 8.8% |
| 30 to 34 Minutes | 20 | 7.3% |
| 35 to 39 Minutes | 21 | 7.7% |
| 40 to 44 Minutes | 21 | 7.7% |
| 45 to 59 Minutes | 17 | 6.2% |
| 60 to 89 Minutes | 14 | 5.1% |
| 90 or more Minutes | 20 | 7.3% |
Commute Time by Sex in Alhambra Valley
The most common commute times in Alhambra Valley are 15 to 19 minutes (20 commuters, 16.4%) for males and 20 to 24 minutes (32 commuters, 21.0%) for females.
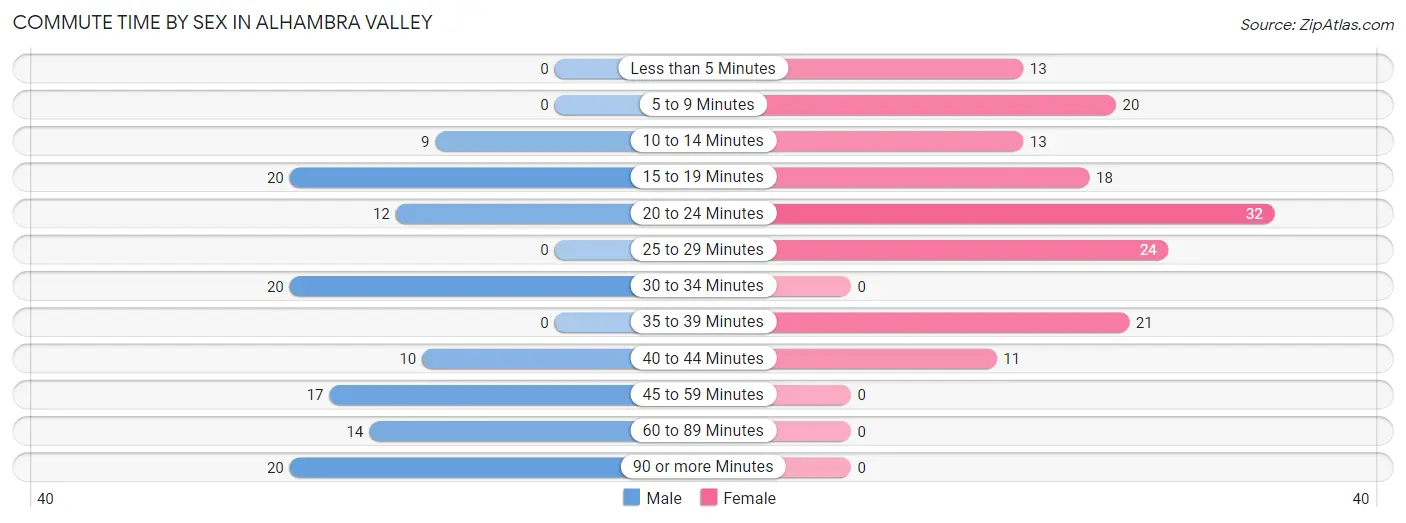
| Commute Time | Male | Female |
| Less than 5 Minutes | 0 (0.0%) | 13 (8.6%) |
| 5 to 9 Minutes | 0 (0.0%) | 20 (13.2%) |
| 10 to 14 Minutes | 9 (7.4%) | 13 (8.6%) |
| 15 to 19 Minutes | 20 (16.4%) | 18 (11.8%) |
| 20 to 24 Minutes | 12 (9.8%) | 32 (21.0%) |
| 25 to 29 Minutes | 0 (0.0%) | 24 (15.8%) |
| 30 to 34 Minutes | 20 (16.4%) | 0 (0.0%) |
| 35 to 39 Minutes | 0 (0.0%) | 21 (13.8%) |
| 40 to 44 Minutes | 10 (8.2%) | 11 (7.2%) |
| 45 to 59 Minutes | 17 (13.9%) | 0 (0.0%) |
| 60 to 89 Minutes | 14 (11.5%) | 0 (0.0%) |
| 90 or more Minutes | 20 (16.4%) | 0 (0.0%) |
Time of Departure to Work by Sex in Alhambra Valley
The most frequent times of departure to work in Alhambra Valley are 7:30 AM to 7:59 AM (47, 38.5%) for males and 10:00 AM to 10:59 AM (40, 26.3%) for females.
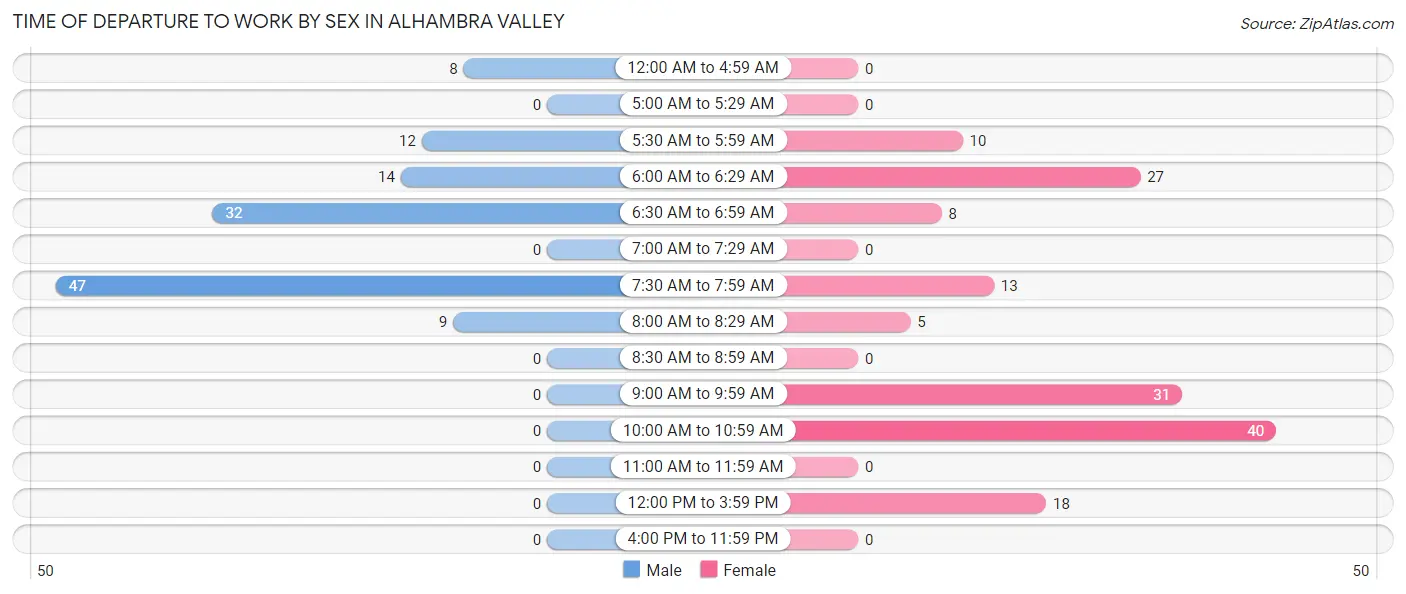
| Time of Departure | Male | Female |
| 12:00 AM to 4:59 AM | 8 (6.6%) | 0 (0.0%) |
| 5:00 AM to 5:29 AM | 0 (0.0%) | 0 (0.0%) |
| 5:30 AM to 5:59 AM | 12 (9.8%) | 10 (6.6%) |
| 6:00 AM to 6:29 AM | 14 (11.5%) | 27 (17.8%) |
| 6:30 AM to 6:59 AM | 32 (26.2%) | 8 (5.3%) |
| 7:00 AM to 7:29 AM | 0 (0.0%) | 0 (0.0%) |
| 7:30 AM to 7:59 AM | 47 (38.5%) | 13 (8.6%) |
| 8:00 AM to 8:29 AM | 9 (7.4%) | 5 (3.3%) |
| 8:30 AM to 8:59 AM | 0 (0.0%) | 0 (0.0%) |
| 9:00 AM to 9:59 AM | 0 (0.0%) | 31 (20.4%) |
| 10:00 AM to 10:59 AM | 0 (0.0%) | 40 (26.3%) |
| 11:00 AM to 11:59 AM | 0 (0.0%) | 0 (0.0%) |
| 12:00 PM to 3:59 PM | 0 (0.0%) | 18 (11.8%) |
| 4:00 PM to 11:59 PM | 0 (0.0%) | 0 (0.0%) |
| Total | 122 (100.0%) | 152 (100.0%) |
Housing Occupancy in Alhambra Valley
Occupancy by Ownership in Alhambra Valley
Of the total 308 dwellings in Alhambra Valley, owner-occupied units account for 282 (91.6%), while renter-occupied units make up 26 (8.4%).
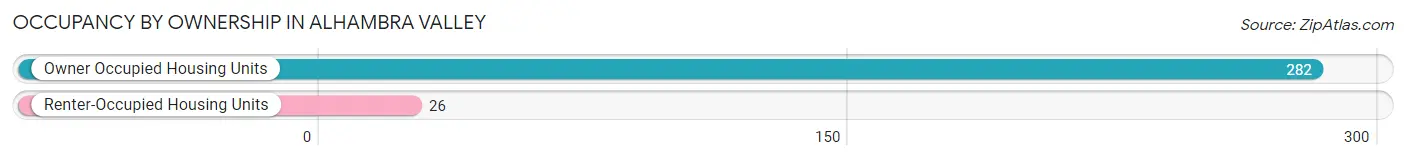
| Occupancy | # Housing Units | % Housing Units |
| Owner Occupied Housing Units | 282 | 91.6% |
| Renter-Occupied Housing Units | 26 | 8.4% |
| Total Occupied Housing Units | 308 | 100.0% |
Occupancy by Household Size in Alhambra Valley
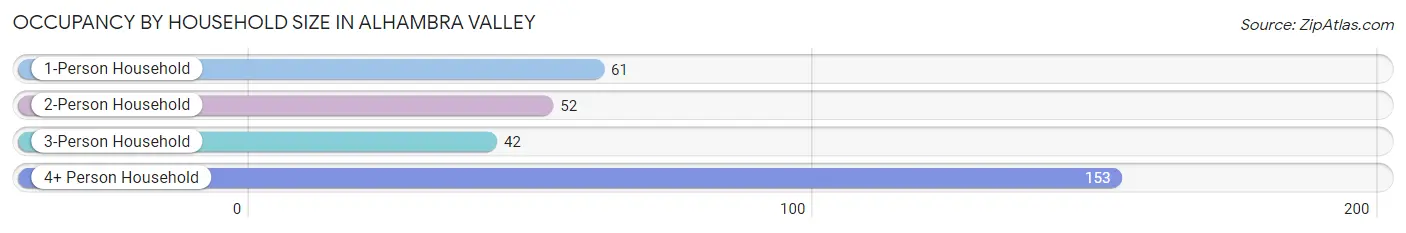
| Household Size | # Housing Units | % Housing Units |
| 1-Person Household | 61 | 19.8% |
| 2-Person Household | 52 | 16.9% |
| 3-Person Household | 42 | 13.6% |
| 4+ Person Household | 153 | 49.7% |
| Total Housing Units | 308 | 100.0% |
Occupancy by Ownership by Household Size in Alhambra Valley
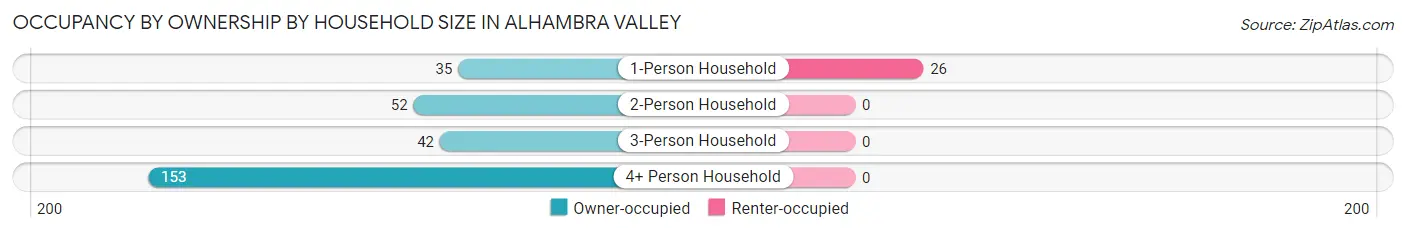
| Household Size | Owner-occupied | Renter-occupied |
| 1-Person Household | 35 (57.4%) | 26 (42.6%) |
| 2-Person Household | 52 (100.0%) | 0 (0.0%) |
| 3-Person Household | 42 (100.0%) | 0 (0.0%) |
| 4+ Person Household | 153 (100.0%) | 0 (0.0%) |
| Total Housing Units | 282 (91.6%) | 26 (8.4%) |
Occupancy by Educational Attainment in Alhambra Valley
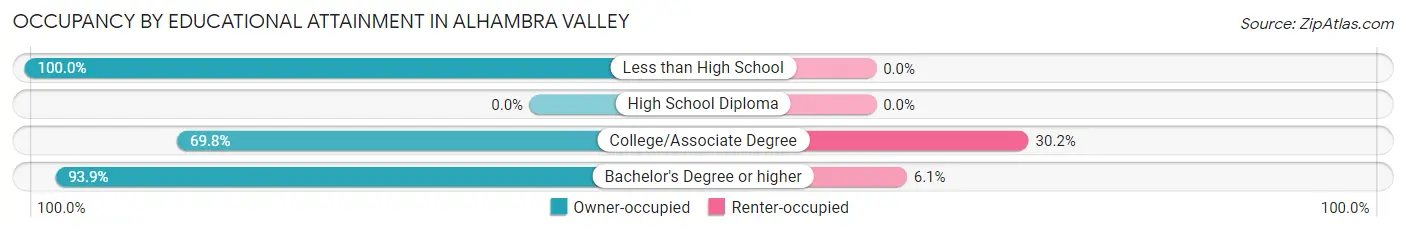
| Household Size | Owner-occupied | Renter-occupied |
| Less than High School | 51 (100.0%) | 0 (0.0%) |
| High School Diploma | 0 (0.0%) | 0 (0.0%) |
| College/Associate Degree | 30 (69.8%) | 13 (30.2%) |
| Bachelor's Degree or higher | 201 (93.9%) | 13 (6.1%) |
Occupancy by Age of Householder in Alhambra Valley
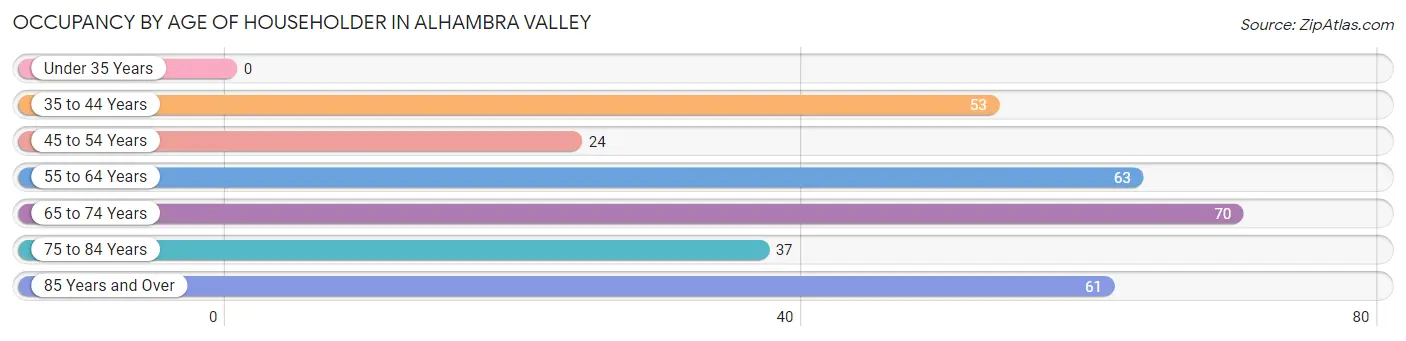
| Age Bracket | # Households | % Households |
| Under 35 Years | 0 | 0.0% |
| 35 to 44 Years | 53 | 17.2% |
| 45 to 54 Years | 24 | 7.8% |
| 55 to 64 Years | 63 | 20.4% |
| 65 to 74 Years | 70 | 22.7% |
| 75 to 84 Years | 37 | 12.0% |
| 85 Years and Over | 61 | 19.8% |
| Total | 308 | 100.0% |
Housing Finances in Alhambra Valley
Median Income by Occupancy in Alhambra Valley
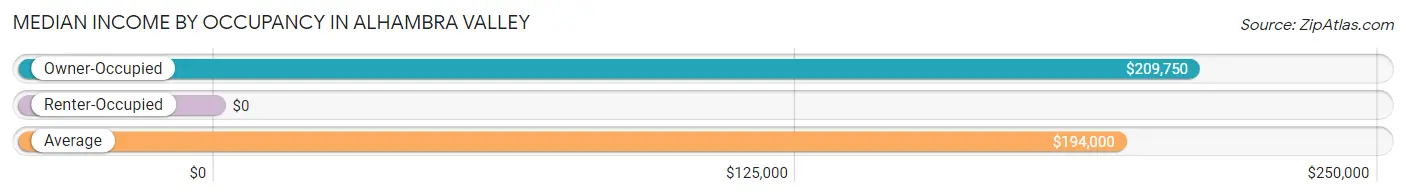
| Occupancy Type | # Households | Median Income |
| Owner-Occupied | 282 (91.6%) | $209,750 |
| Renter-Occupied | 26 (8.4%) | $0 |
| Average | 308 (100.0%) | $194,000 |
Occupancy by Householder Income Bracket in Alhambra Valley
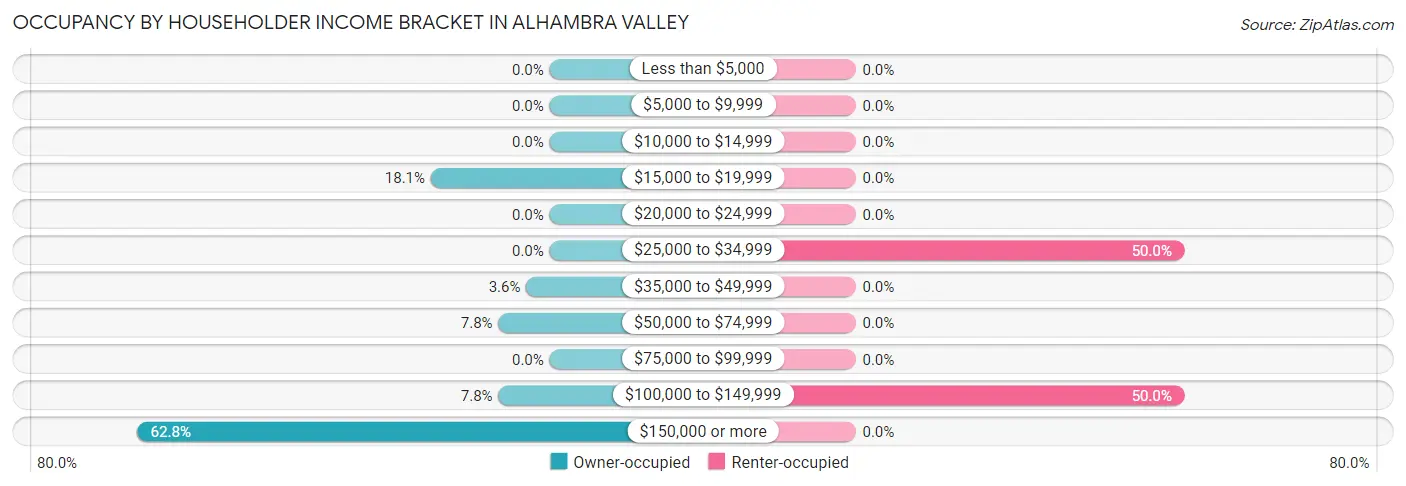
| Income Bracket | Owner-occupied | Renter-occupied |
| Less than $5,000 | 0 (0.0%) | 0 (0.0%) |
| $5,000 to $9,999 | 0 (0.0%) | 0 (0.0%) |
| $10,000 to $14,999 | 0 (0.0%) | 0 (0.0%) |
| $15,000 to $19,999 | 51 (18.1%) | 0 (0.0%) |
| $20,000 to $24,999 | 0 (0.0%) | 0 (0.0%) |
| $25,000 to $34,999 | 0 (0.0%) | 13 (50.0%) |
| $35,000 to $49,999 | 10 (3.5%) | 0 (0.0%) |
| $50,000 to $74,999 | 22 (7.8%) | 0 (0.0%) |
| $75,000 to $99,999 | 0 (0.0%) | 0 (0.0%) |
| $100,000 to $149,999 | 22 (7.8%) | 13 (50.0%) |
| $150,000 or more | 177 (62.8%) | 0 (0.0%) |
| Total | 282 (100.0%) | 26 (100.0%) |
Monthly Housing Cost Tiers in Alhambra Valley
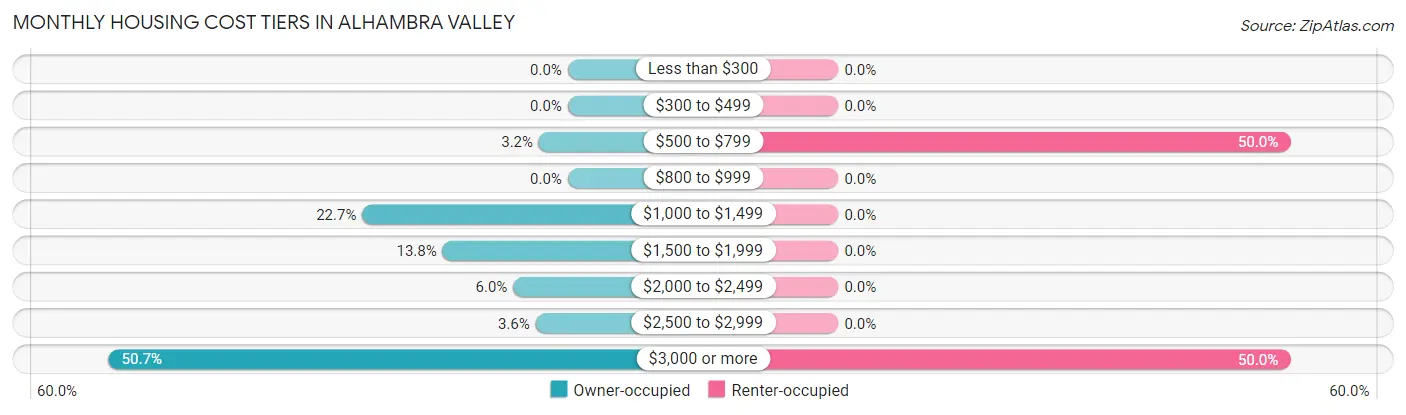
| Monthly Cost | Owner-occupied | Renter-occupied |
| Less than $300 | 0 (0.0%) | 0 (0.0%) |
| $300 to $499 | 0 (0.0%) | 0 (0.0%) |
| $500 to $799 | 9 (3.2%) | 13 (50.0%) |
| $800 to $999 | 0 (0.0%) | 0 (0.0%) |
| $1,000 to $1,499 | 64 (22.7%) | 0 (0.0%) |
| $1,500 to $1,999 | 39 (13.8%) | 0 (0.0%) |
| $2,000 to $2,499 | 17 (6.0%) | 0 (0.0%) |
| $2,500 to $2,999 | 10 (3.5%) | 0 (0.0%) |
| $3,000 or more | 143 (50.7%) | 13 (50.0%) |
| Total | 282 (100.0%) | 26 (100.0%) |
Physical Housing Characteristics in Alhambra Valley
Housing Structures in Alhambra Valley
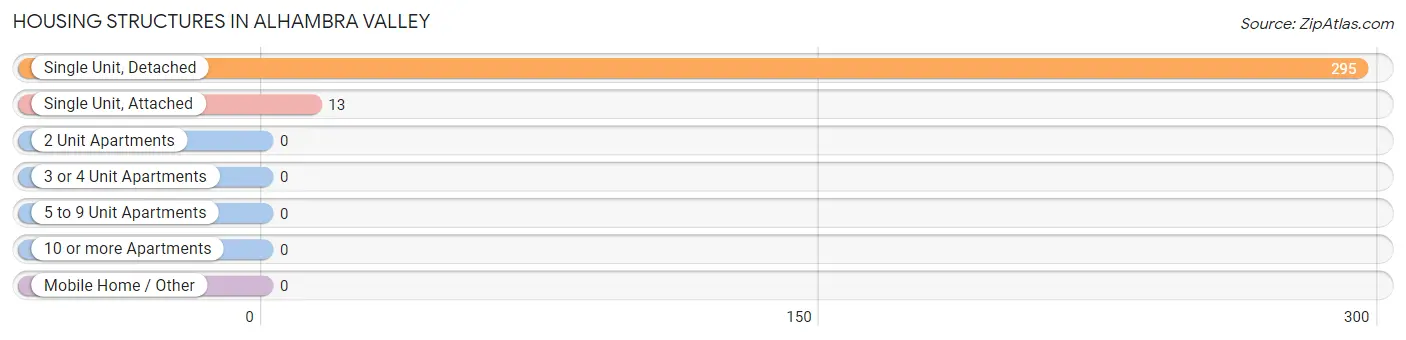
| Structure Type | # Housing Units | % Housing Units |
| Single Unit, Detached | 295 | 95.8% |
| Single Unit, Attached | 13 | 4.2% |
| 2 Unit Apartments | 0 | 0.0% |
| 3 or 4 Unit Apartments | 0 | 0.0% |
| 5 to 9 Unit Apartments | 0 | 0.0% |
| 10 or more Apartments | 0 | 0.0% |
| Mobile Home / Other | 0 | 0.0% |
| Total | 308 | 100.0% |
Housing Structures by Occupancy in Alhambra Valley
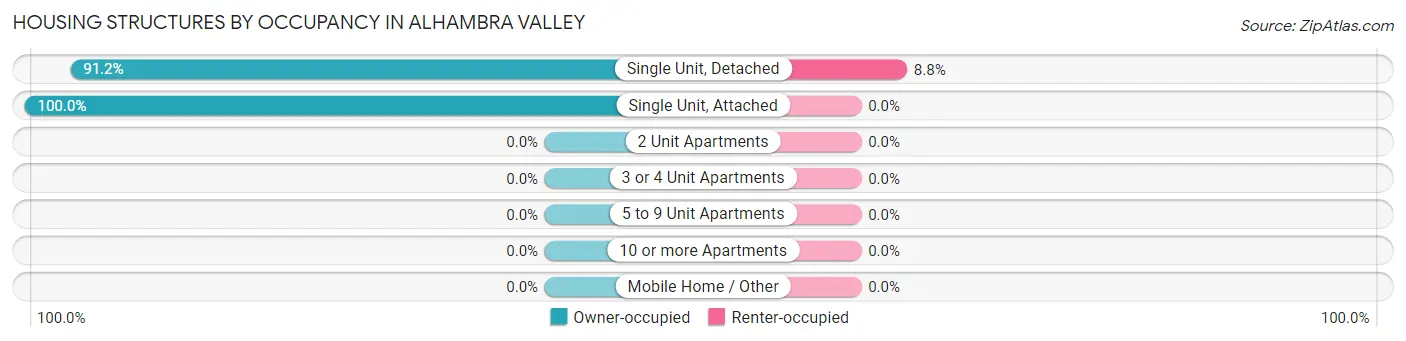
| Structure Type | Owner-occupied | Renter-occupied |
| Single Unit, Detached | 269 (91.2%) | 26 (8.8%) |
| Single Unit, Attached | 13 (100.0%) | 0 (0.0%) |
| 2 Unit Apartments | 0 (0.0%) | 0 (0.0%) |
| 3 or 4 Unit Apartments | 0 (0.0%) | 0 (0.0%) |
| 5 to 9 Unit Apartments | 0 (0.0%) | 0 (0.0%) |
| 10 or more Apartments | 0 (0.0%) | 0 (0.0%) |
| Mobile Home / Other | 0 (0.0%) | 0 (0.0%) |
| Total | 282 (91.6%) | 26 (8.4%) |
Housing Structures by Number of Rooms in Alhambra Valley
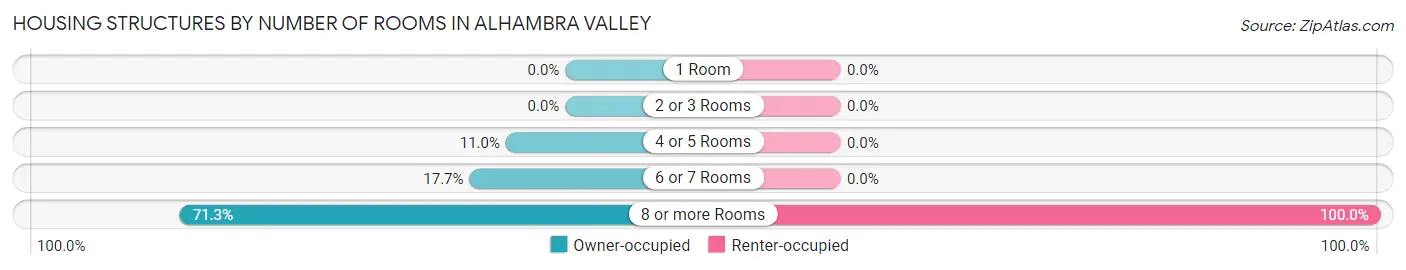
| Number of Rooms | Owner-occupied | Renter-occupied |
| 1 Room | 0 (0.0%) | 0 (0.0%) |
| 2 or 3 Rooms | 0 (0.0%) | 0 (0.0%) |
| 4 or 5 Rooms | 31 (11.0%) | 0 (0.0%) |
| 6 or 7 Rooms | 50 (17.7%) | 0 (0.0%) |
| 8 or more Rooms | 201 (71.3%) | 26 (100.0%) |
| Total | 282 (100.0%) | 26 (100.0%) |
Housing Structure by Heating Type in Alhambra Valley
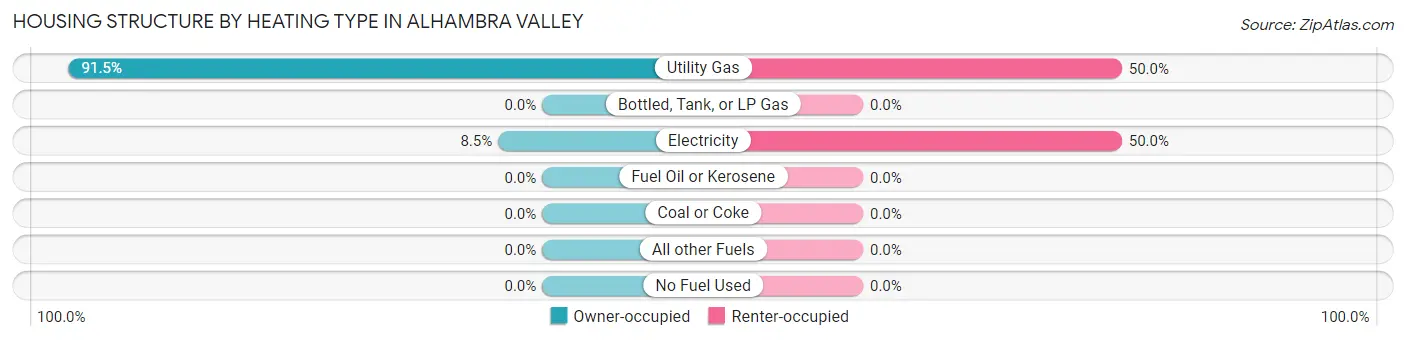
| Heating Type | Owner-occupied | Renter-occupied |
| Utility Gas | 258 (91.5%) | 13 (50.0%) |
| Bottled, Tank, or LP Gas | 0 (0.0%) | 0 (0.0%) |
| Electricity | 24 (8.5%) | 13 (50.0%) |
| Fuel Oil or Kerosene | 0 (0.0%) | 0 (0.0%) |
| Coal or Coke | 0 (0.0%) | 0 (0.0%) |
| All other Fuels | 0 (0.0%) | 0 (0.0%) |
| No Fuel Used | 0 (0.0%) | 0 (0.0%) |
| Total | 282 (100.0%) | 26 (100.0%) |
Household Vehicle Usage in Alhambra Valley
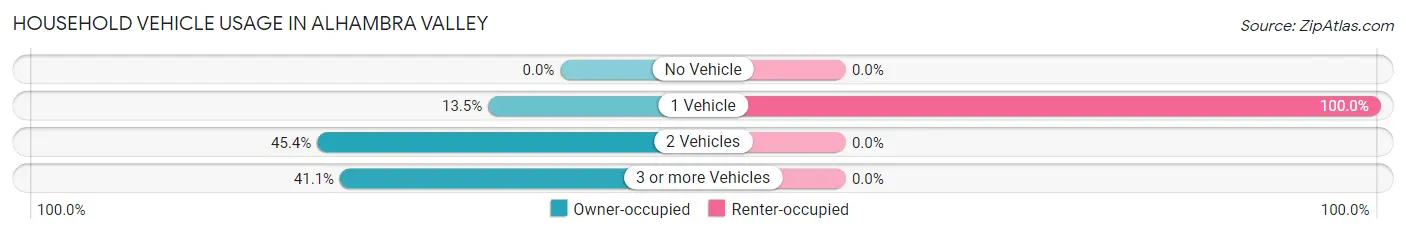
| Vehicles per Household | Owner-occupied | Renter-occupied |
| No Vehicle | 0 (0.0%) | 0 (0.0%) |
| 1 Vehicle | 38 (13.5%) | 26 (100.0%) |
| 2 Vehicles | 128 (45.4%) | 0 (0.0%) |
| 3 or more Vehicles | 116 (41.1%) | 0 (0.0%) |
| Total | 282 (100.0%) | 26 (100.0%) |
Real Estate & Mortgages in Alhambra Valley
Real Estate and Mortgage Overview in Alhambra Valley
| Characteristic | Without Mortgage | With Mortgage |
| Housing Units | 102 | 180 |
| Median Property Value | $1,136,900 | $1,194,100 |
| Median Household Income | - | - |
| Monthly Housing Costs | $1,357 | $143 |
| Real Estate Taxes | $8,733 | $0 |
Property Value by Mortgage Status in Alhambra Valley
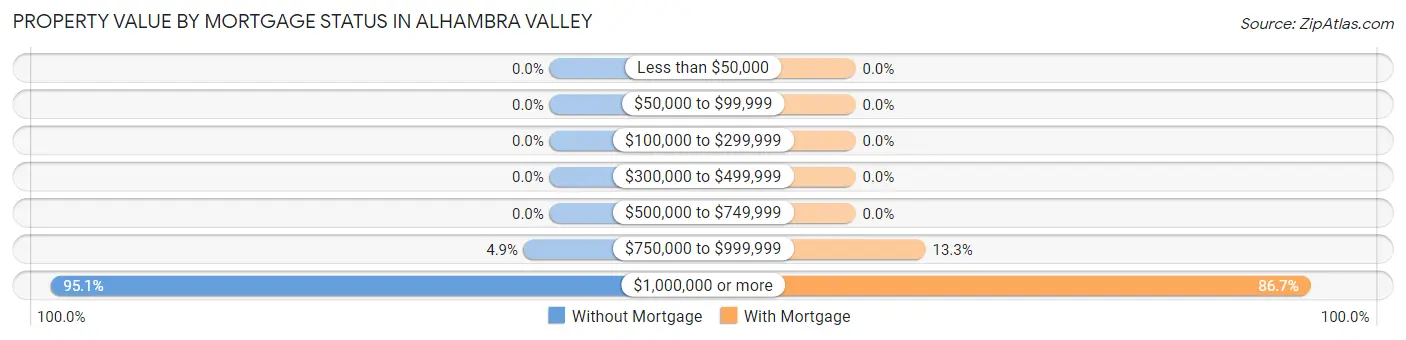
| Property Value | Without Mortgage | With Mortgage |
| Less than $50,000 | 0 (0.0%) | 0 (0.0%) |
| $50,000 to $99,999 | 0 (0.0%) | 0 (0.0%) |
| $100,000 to $299,999 | 0 (0.0%) | 0 (0.0%) |
| $300,000 to $499,999 | 0 (0.0%) | 0 (0.0%) |
| $500,000 to $749,999 | 0 (0.0%) | 0 (0.0%) |
| $750,000 to $999,999 | 5 (4.9%) | 24 (13.3%) |
| $1,000,000 or more | 97 (95.1%) | 156 (86.7%) |
| Total | 102 (100.0%) | 180 (100.0%) |
Household Income by Mortgage Status in Alhambra Valley
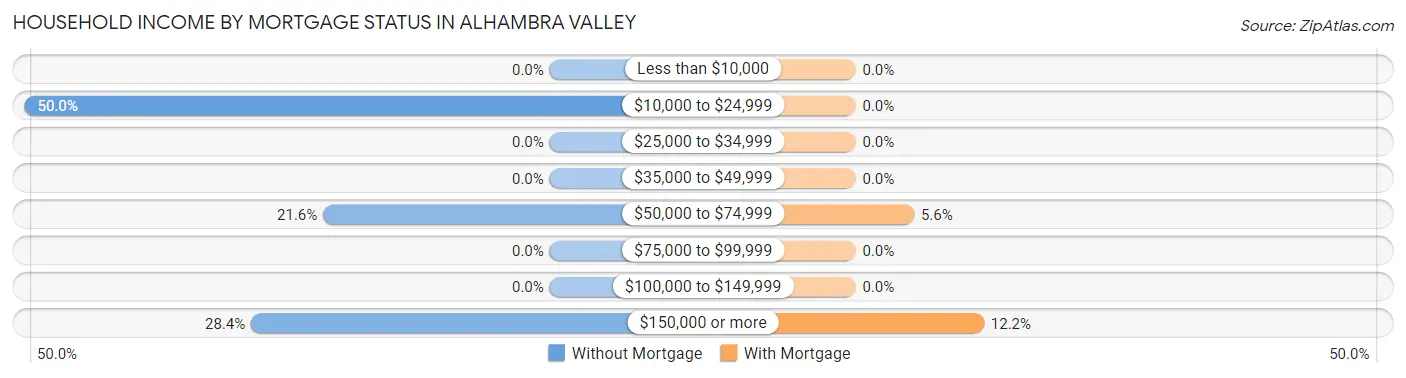
| Household Income | Without Mortgage | With Mortgage |
| Less than $10,000 | 0 (0.0%) | 0 (0.0%) |
| $10,000 to $24,999 | 51 (50.0%) | 0 (0.0%) |
| $25,000 to $34,999 | 0 (0.0%) | 0 (0.0%) |
| $35,000 to $49,999 | 0 (0.0%) | 0 (0.0%) |
| $50,000 to $74,999 | 22 (21.6%) | 10 (5.6%) |
| $75,000 to $99,999 | 0 (0.0%) | 0 (0.0%) |
| $100,000 to $149,999 | 0 (0.0%) | 0 (0.0%) |
| $150,000 or more | 29 (28.4%) | 22 (12.2%) |
| Total | 102 (100.0%) | 180 (100.0%) |
Property Value to Household Income Ratio in Alhambra Valley
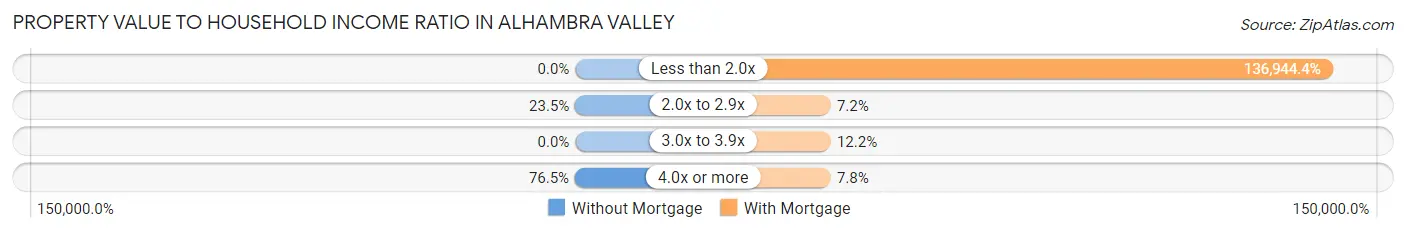
| Value-to-Income Ratio | Without Mortgage | With Mortgage |
| Less than 2.0x | 0 (0.0%) | 246,500 (136,944.4%) |
| 2.0x to 2.9x | 24 (23.5%) | 13 (7.2%) |
| 3.0x to 3.9x | 0 (0.0%) | 22 (12.2%) |
| 4.0x or more | 78 (76.5%) | 14 (7.8%) |
| Total | 102 (100.0%) | 180 (100.0%) |
Real Estate Taxes by Mortgage Status in Alhambra Valley
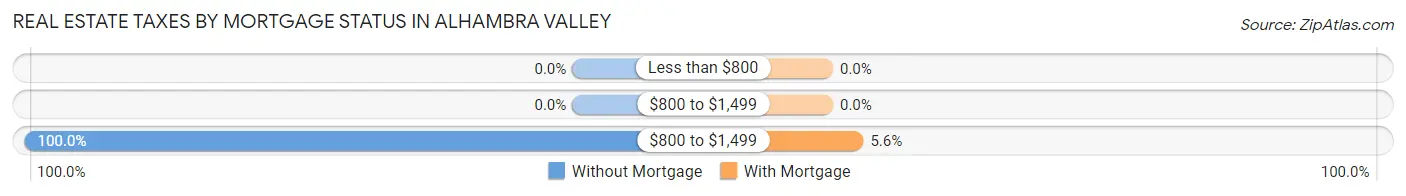
| Property Taxes | Without Mortgage | With Mortgage |
| Less than $800 | 0 (0.0%) | 0 (0.0%) |
| $800 to $1,499 | 0 (0.0%) | 0 (0.0%) |
| $800 to $1,499 | 102 (100.0%) | 10 (5.6%) |
| Total | 102 (100.0%) | 180 (100.0%) |
Health & Disability in Alhambra Valley
Health Insurance Coverage by Age in Alhambra Valley
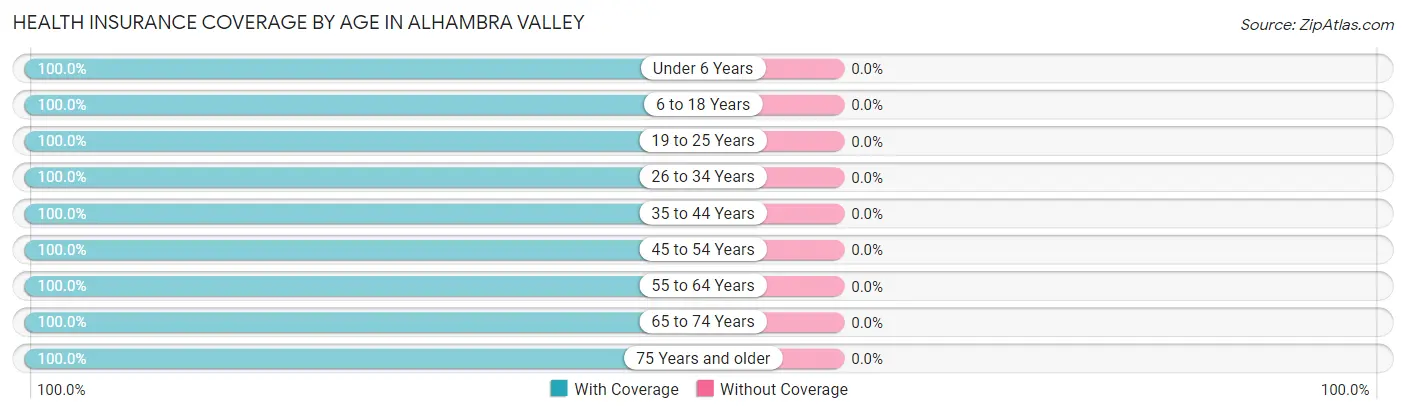
| Age Bracket | With Coverage | Without Coverage |
| Under 6 Years | 41 (100.0%) | 0 (0.0%) |
| 6 to 18 Years | 185 (100.0%) | 0 (0.0%) |
| 19 to 25 Years | 9 (100.0%) | 0 (0.0%) |
| 26 to 34 Years | 101 (100.0%) | 0 (0.0%) |
| 35 to 44 Years | 139 (100.0%) | 0 (0.0%) |
| 45 to 54 Years | 48 (100.0%) | 0 (0.0%) |
| 55 to 64 Years | 150 (100.0%) | 0 (0.0%) |
| 65 to 74 Years | 119 (100.0%) | 0 (0.0%) |
| 75 Years and older | 125 (100.0%) | 0 (0.0%) |
| Total | 917 (100.0%) | 0 (0.0%) |
Health Insurance Coverage by Citizenship Status in Alhambra Valley

| Citizenship Status | With Coverage | Without Coverage |
| Native Born | 41 (100.0%) | 0 (0.0%) |
| Foreign Born, Citizen | 185 (100.0%) | 0 (0.0%) |
| Foreign Born, not a Citizen | 9 (100.0%) | 0 (0.0%) |
Health Insurance Coverage by Household Income in Alhambra Valley
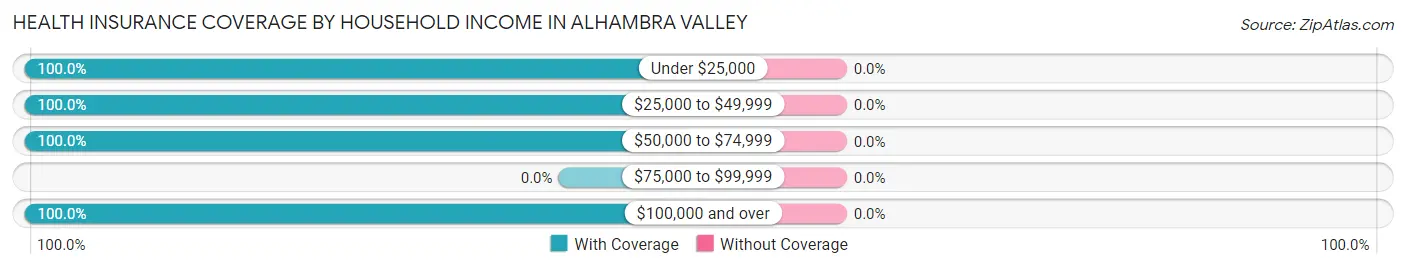
| Household Income | With Coverage | Without Coverage |
| Under $25,000 | 183 (100.0%) | 0 (0.0%) |
| $25,000 to $49,999 | 45 (100.0%) | 0 (0.0%) |
| $50,000 to $74,999 | 34 (100.0%) | 0 (0.0%) |
| $75,000 to $99,999 | 0 (0.0%) | 0 (0.0%) |
| $100,000 and over | 655 (100.0%) | 0 (0.0%) |
Public vs Private Health Insurance Coverage by Age in Alhambra Valley
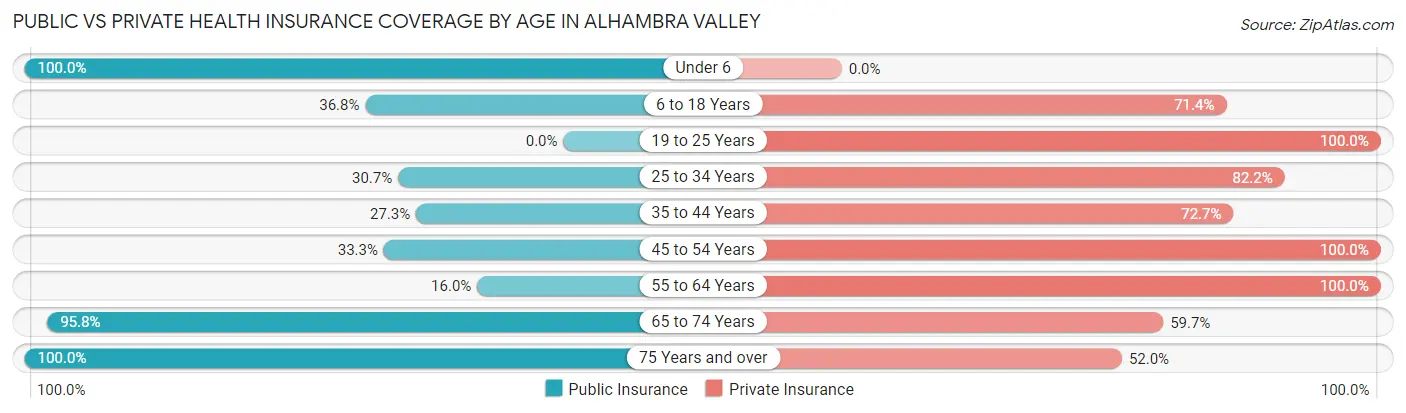
| Age Bracket | Public Insurance | Private Insurance |
| Under 6 | 41 (100.0%) | 0 (0.0%) |
| 6 to 18 Years | 68 (36.8%) | 132 (71.4%) |
| 19 to 25 Years | 0 (0.0%) | 9 (100.0%) |
| 25 to 34 Years | 31 (30.7%) | 83 (82.2%) |
| 35 to 44 Years | 38 (27.3%) | 101 (72.7%) |
| 45 to 54 Years | 16 (33.3%) | 48 (100.0%) |
| 55 to 64 Years | 24 (16.0%) | 150 (100.0%) |
| 65 to 74 Years | 114 (95.8%) | 71 (59.7%) |
| 75 Years and over | 125 (100.0%) | 65 (52.0%) |
| Total | 457 (49.8%) | 659 (71.9%) |
Disability Status by Sex by Age in Alhambra Valley
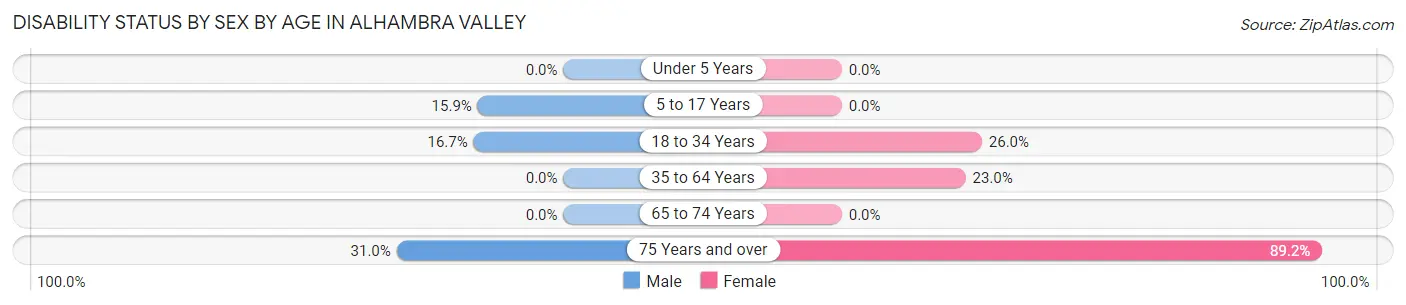
| Age Bracket | Male | Female |
| Under 5 Years | 0 (0.0%) | 0 (0.0%) |
| 5 to 17 Years | 21 (15.9%) | 0 (0.0%) |
| 18 to 34 Years | 10 (16.7%) | 13 (26.0%) |
| 35 to 64 Years | 0 (0.0%) | 51 (23.0%) |
| 65 to 74 Years | 0 (0.0%) | 0 (0.0%) |
| 75 Years and over | 13 (30.9%) | 74 (89.2%) |
Disability Class by Sex by Age in Alhambra Valley
Disability Class: Hearing Difficulty
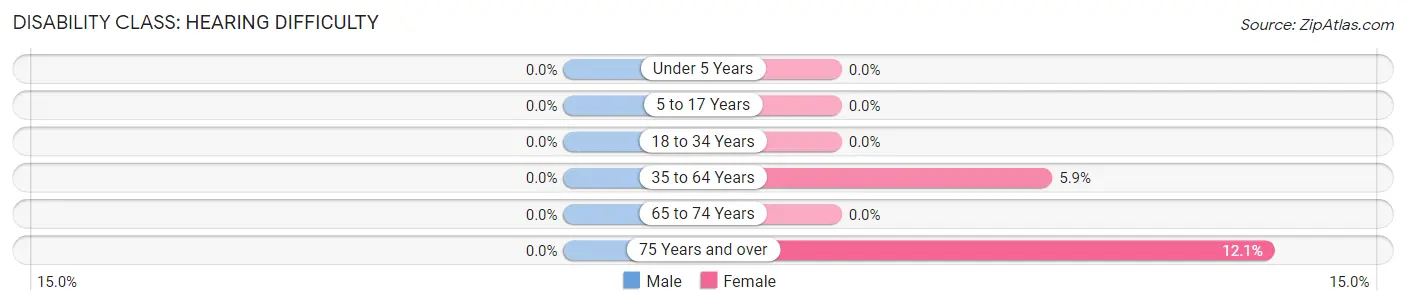
| Age Bracket | Male | Female |
| Under 5 Years | 0 (0.0%) | 0 (0.0%) |
| 5 to 17 Years | 0 (0.0%) | 0 (0.0%) |
| 18 to 34 Years | 0 (0.0%) | 0 (0.0%) |
| 35 to 64 Years | 0 (0.0%) | 13 (5.9%) |
| 65 to 74 Years | 0 (0.0%) | 0 (0.0%) |
| 75 Years and over | 0 (0.0%) | 10 (12.0%) |
Disability Class: Vision Difficulty
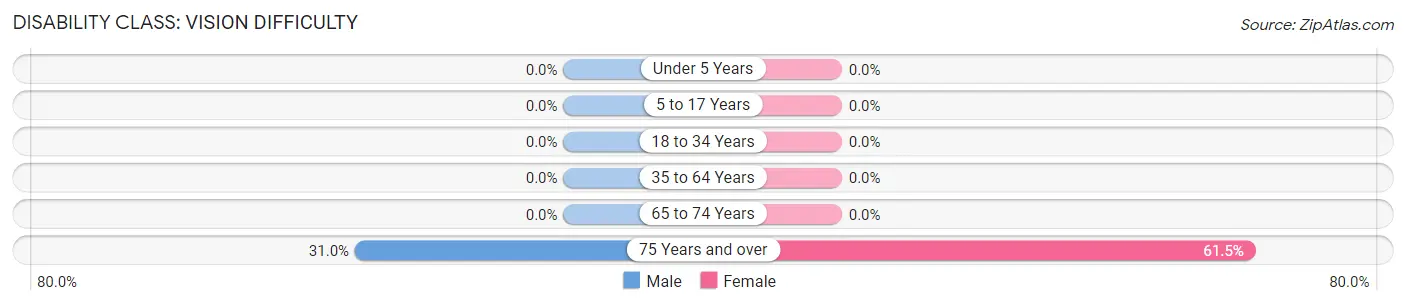
| Age Bracket | Male | Female |
| Under 5 Years | 0 (0.0%) | 0 (0.0%) |
| 5 to 17 Years | 0 (0.0%) | 0 (0.0%) |
| 18 to 34 Years | 0 (0.0%) | 0 (0.0%) |
| 35 to 64 Years | 0 (0.0%) | 0 (0.0%) |
| 65 to 74 Years | 0 (0.0%) | 0 (0.0%) |
| 75 Years and over | 13 (30.9%) | 51 (61.5%) |
Disability Class: Cognitive Difficulty
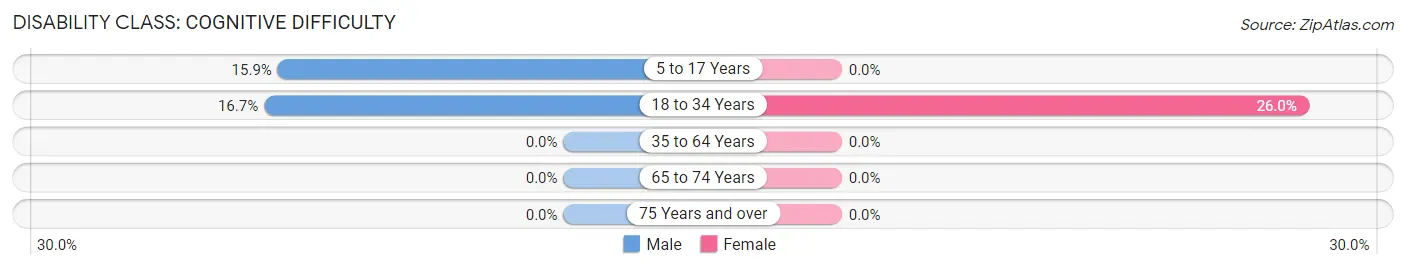
| Age Bracket | Male | Female |
| 5 to 17 Years | 21 (15.9%) | 0 (0.0%) |
| 18 to 34 Years | 10 (16.7%) | 13 (26.0%) |
| 35 to 64 Years | 0 (0.0%) | 0 (0.0%) |
| 65 to 74 Years | 0 (0.0%) | 0 (0.0%) |
| 75 Years and over | 0 (0.0%) | 0 (0.0%) |
Disability Class: Ambulatory Difficulty
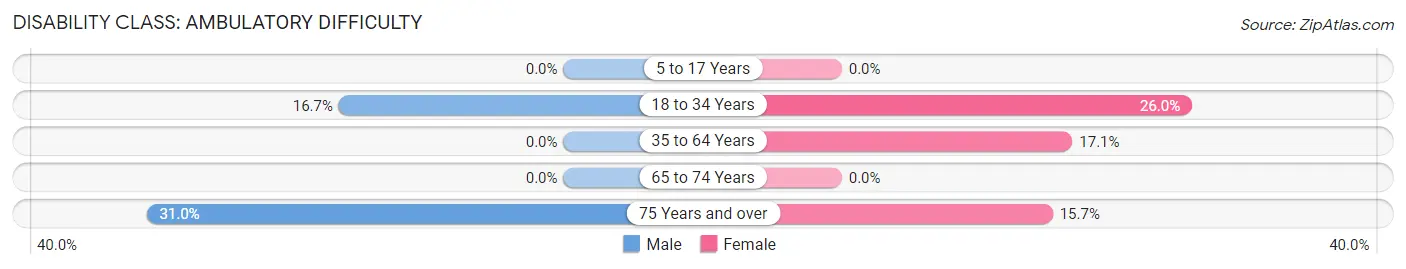
| Age Bracket | Male | Female |
| 5 to 17 Years | 0 (0.0%) | 0 (0.0%) |
| 18 to 34 Years | 10 (16.7%) | 13 (26.0%) |
| 35 to 64 Years | 0 (0.0%) | 38 (17.1%) |
| 65 to 74 Years | 0 (0.0%) | 0 (0.0%) |
| 75 Years and over | 13 (30.9%) | 13 (15.7%) |
Disability Class: Self-Care Difficulty
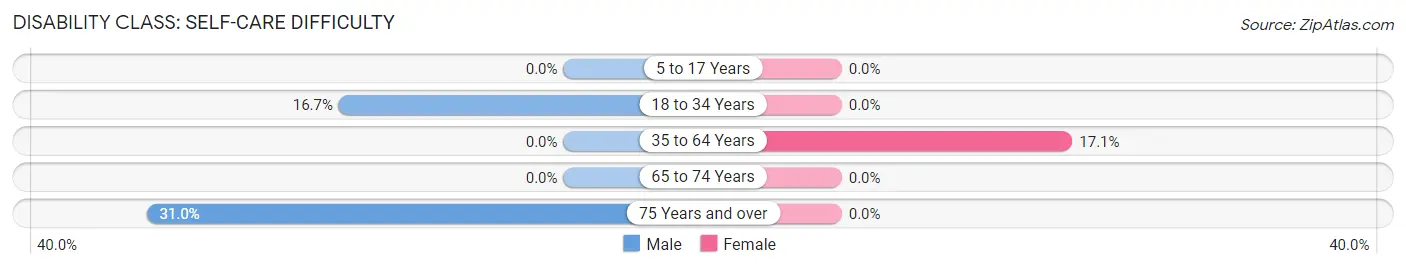
| Age Bracket | Male | Female |
| 5 to 17 Years | 0 (0.0%) | 0 (0.0%) |
| 18 to 34 Years | 10 (16.7%) | 0 (0.0%) |
| 35 to 64 Years | 0 (0.0%) | 38 (17.1%) |
| 65 to 74 Years | 0 (0.0%) | 0 (0.0%) |
| 75 Years and over | 13 (30.9%) | 0 (0.0%) |
Technology Access in Alhambra Valley
Computing Device Access in Alhambra Valley
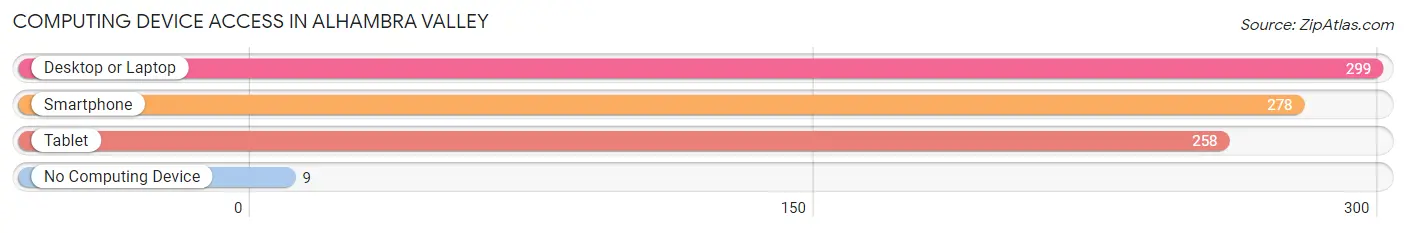
| Device Type | # Households | % Households |
| Desktop or Laptop | 299 | 97.1% |
| Smartphone | 278 | 90.3% |
| Tablet | 258 | 83.8% |
| No Computing Device | 9 | 2.9% |
| Total | 308 | 100.0% |
Internet Access in Alhambra Valley
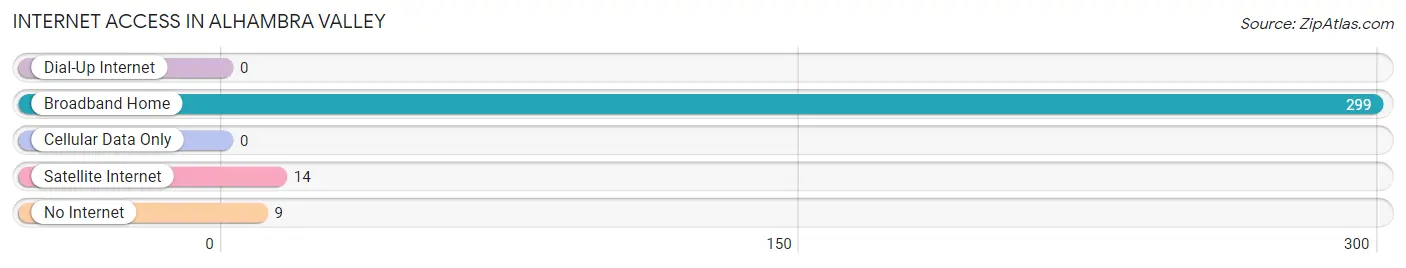
| Internet Type | # Households | % Households |
| Dial-Up Internet | 0 | 0.0% |
| Broadband Home | 299 | 97.1% |
| Cellular Data Only | 0 | 0.0% |
| Satellite Internet | 14 | 4.5% |
| No Internet | 9 | 2.9% |
| Total | 308 | 100.0% |
Alhambra Valley Summary
Alhambra Valley is a small unincorporated community located in Contra Costa County, California. It is situated in the foothills of the Diablo Range, approximately 25 miles east of San Francisco. The community is surrounded by rolling hills and open space, and is home to a diverse population of approximately 1,000 people.
History
The area now known as Alhambra Valley was originally inhabited by the Ohlone people, who lived in the area for thousands of years before the arrival of Europeans. The first Europeans to settle in the area were Spanish missionaries, who established a mission in nearby Martinez in 1817. The area was later settled by ranchers and farmers, who established small farms and ranches in the area.
In the late 19th century, the area was developed as a resort community, with the construction of several large estates. The area was also home to a number of small wineries, which produced some of the first wines in the region.
In the early 20th century, the area was developed as a residential community, with the construction of several small subdivisions. The area was also home to a number of small businesses, including a general store, a post office, and a blacksmith shop.
Geography
Alhambra Valley is located in the foothills of the Diablo Range, approximately 25 miles east of San Francisco. The area is characterized by rolling hills and open space, with a number of small creeks and streams running through the area. The area is home to a number of small lakes, including Lake Chabot and Lake Anza.
The climate in Alhambra Valley is mild, with temperatures ranging from the mid-50s in the winter to the mid-80s in the summer. The area receives an average of 20 inches of rain per year.
Economy
The economy of Alhambra Valley is largely based on agriculture and tourism. The area is home to a number of small farms and ranches, which produce a variety of fruits and vegetables, as well as livestock. The area is also home to a number of small wineries, which produce a variety of wines.
The area is also home to a number of small businesses, including restaurants, shops, and other services. The area is also home to a number of small bed and breakfasts, which cater to tourists visiting the area.
Demographics
As of the 2010 census, the population of Alhambra Valley was 1,000. The population is largely white (77.3%), with smaller percentages of Hispanic (14.3%), Asian (4.3%), and African American (2.3%) residents. The median household income in the area is $90,000, and the median home value is $735,000.
Conclusion
Alhambra Valley is a small unincorporated community located in Contra Costa County, California. It is situated in the foothills of the Diablo Range, approximately 25 miles east of San Francisco. The area is characterized by rolling hills and open space, and is home to a diverse population of approximately 1,000 people. The economy of Alhambra Valley is largely based on agriculture and tourism, and the area is home to a number of small farms and ranches, wineries, and businesses. The population of Alhambra Valley is largely white, with smaller percentages of Hispanic, Asian, and African American residents.
Common Questions
What is Per Capita Income in Alhambra Valley?
Per Capita income in Alhambra Valley is $70,264.
What is the Median Family Income in Alhambra Valley?
Median Family Income in Alhambra Valley is $236,250.
What is the Median Household income in Alhambra Valley?
Median Household Income in Alhambra Valley is $194,000.
What is Income or Wage Gap in Alhambra Valley?
Income or Wage Gap in Alhambra Valley is 22.6%.
Women in Alhambra Valley earn 77.4 cents for every dollar earned by a man.
What is Inequality or Gini Index in Alhambra Valley?
Inequality or Gini Index in Alhambra Valley is 0.43.
What is the Total Population of Alhambra Valley?
Total Population of Alhambra Valley is 917.
What is the Total Male Population of Alhambra Valley?
Total Male Population of Alhambra Valley is 408.
What is the Total Female Population of Alhambra Valley?
Total Female Population of Alhambra Valley is 509.
What is the Ratio of Males per 100 Females in Alhambra Valley?
There are 80.16 Males per 100 Females in Alhambra Valley.
What is the Ratio of Females per 100 Males in Alhambra Valley?
There are 124.75 Females per 100 Males in Alhambra Valley.
What is the Median Population Age in Alhambra Valley?
Median Population Age in Alhambra Valley is 44.7 Years.
What is the Average Family Size in Alhambra Valley
Average Family Size in Alhambra Valley is 3.5 People.
What is the Average Household Size in Alhambra Valley
Average Household Size in Alhambra Valley is 3.0 People.
How Large is the Labor Force in Alhambra Valley?
There are 429 People in the Labor Forcein in Alhambra Valley.
What is the Percentage of People in the Labor Force in Alhambra Valley?
60.3% of People are in the Labor Force in Alhambra Valley.
What is the Unemployment Rate in Alhambra Valley?
Unemployment Rate in Alhambra Valley is 12.1%.