Cities with the Highest Percentage of Population Employed in Computer, Engineering & Science in Illinois
RELATED REPORTS & OPTIONS
Computer, Engineering & Science
Illinois
Compare Cities
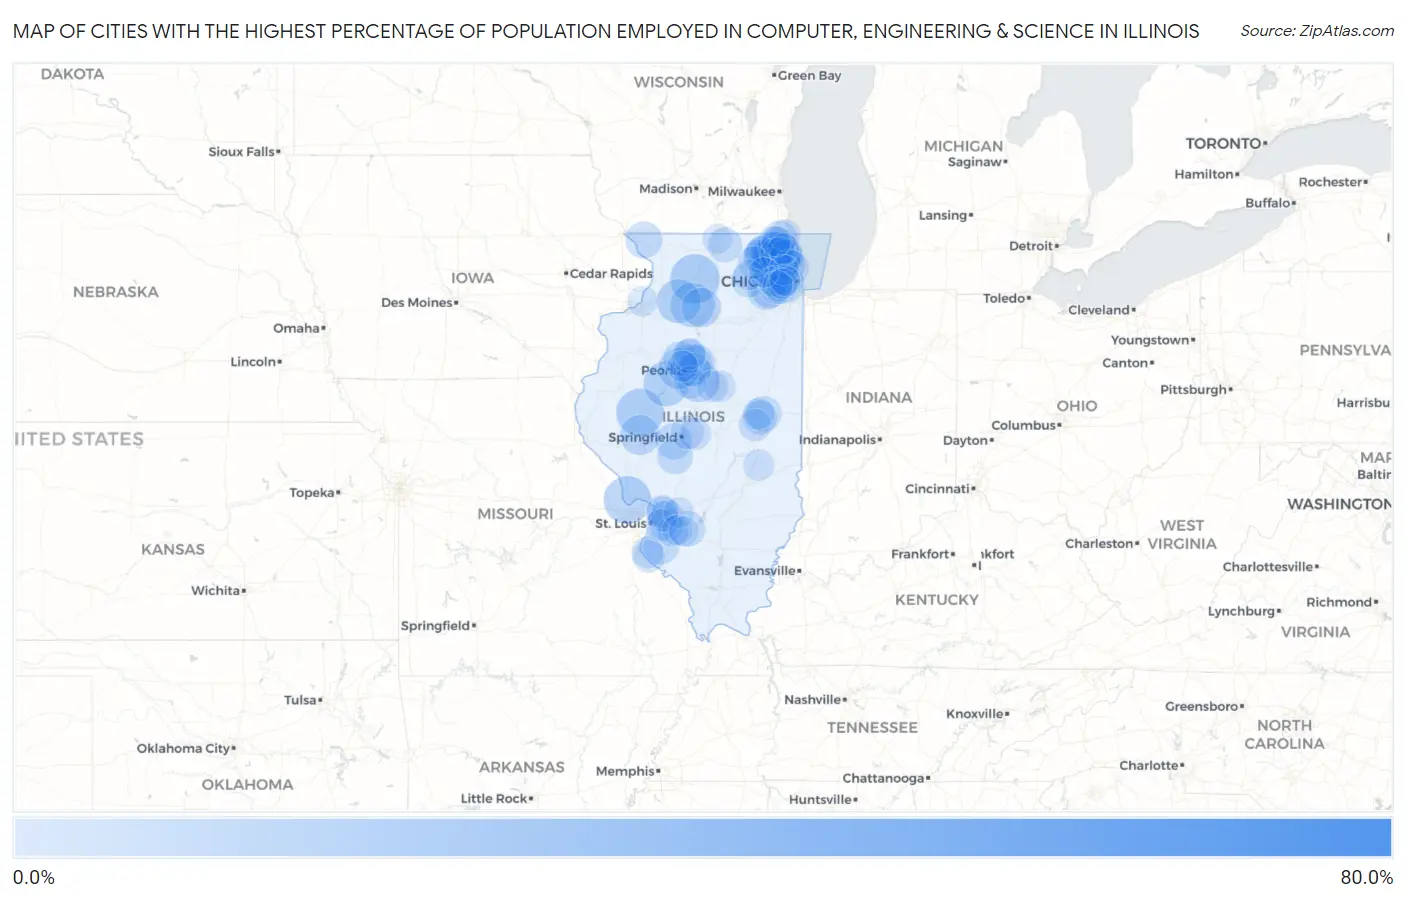
Map of Cities with the Highest Percentage of Population Employed in Computer, Engineering & Science in Illinois
0.0%
80.0%
Cities with the Highest Percentage of Population Employed in Computer, Engineering & Science in Illinois
| City | % Employed | vs State | vs National | |
| 1. | Mossville | 63.3% | 6.4%(+56.9)#1 | 6.8%(+56.6)#37 |
| 2. | Wilton Center | 26.4% | 6.4%(+20.0)#2 | 6.8%(+19.6)#301 |
| 3. | Grand Detour | 22.1% | 6.4%(+15.6)#3 | 6.8%(+15.3)#440 |
| 4. | Taylor Ridge | 21.3% | 6.4%(+14.8)#4 | 6.8%(+14.5)#483 |
| 5. | Brussels | 21.0% | 6.4%(+14.5)#5 | 6.8%(+14.2)#510 |
| 6. | Browning | 20.9% | 6.4%(+14.5)#6 | 6.8%(+14.2)#513 |
| 7. | Lincolnshire | 20.8% | 6.4%(+14.4)#7 | 6.8%(+14.0)#519 |
| 8. | Buffalo Grove | 19.4% | 6.4%(+13.0)#8 | 6.8%(+12.7)#598 |
| 9. | Banner | 19.3% | 6.4%(+12.9)#9 | 6.8%(+12.5)#604 |
| 10. | Ohio | 18.8% | 6.4%(+12.3)#10 | 6.8%(+12.0)#656 |
| 11. | Deer Grove | 18.5% | 6.4%(+12.1)#11 | 6.8%(+11.8)#676 |
| 12. | Preemption | 17.7% | 6.4%(+11.3)#12 | 6.8%(+11.0)#752 |
| 13. | Riverwoods | 17.4% | 6.4%(+10.9)#13 | 6.8%(+10.6)#790 |
| 14. | Heritage Lake | 17.1% | 6.4%(+10.7)#14 | 6.8%(+10.4)#818 |
| 15. | Germantown Hills | 17.0% | 6.4%(+10.5)#15 | 6.8%(+10.2)#836 |
| 16. | Kildeer | 16.9% | 6.4%(+10.5)#16 | 6.8%(+10.1)#849 |
| 17. | Norwood | 16.4% | 6.4%(+9.95)#17 | 6.8%(+9.62)#908 |
| 18. | Bonnie Brae | 16.3% | 6.4%(+9.84)#18 | 6.8%(+9.51)#919 |
| 19. | Ridgefield | 16.0% | 6.4%(+9.59)#19 | 6.8%(+9.26)#956 |
| 20. | Hawthorn Woods | 15.9% | 6.4%(+9.49)#20 | 6.8%(+9.16)#967 |
| 21. | Concord | 15.9% | 6.4%(+9.47)#21 | 6.8%(+9.14)#970 |
| 22. | Lisle | 15.7% | 6.4%(+9.29)#22 | 6.8%(+8.96)#1,000 |
| 23. | La Moille | 15.5% | 6.4%(+9.07)#23 | 6.8%(+8.74)#1,034 |
| 24. | Tower Lakes | 15.0% | 6.4%(+8.60)#24 | 6.8%(+8.27)#1,133 |
| 25. | Naperville | 14.3% | 6.4%(+7.84)#25 | 6.8%(+7.51)#1,283 |
| 26. | Vernon Hills | 14.1% | 6.4%(+7.69)#26 | 6.8%(+7.36)#1,306 |
| 27. | Argyle | 14.1% | 6.4%(+7.62)#27 | 6.8%(+7.29)#1,319 |
| 28. | Fox River Grove | 14.0% | 6.4%(+7.57)#28 | 6.8%(+7.24)#1,335 |
| 29. | The Galena Territory | 13.8% | 6.4%(+7.36)#29 | 6.8%(+7.03)#1,394 |
| 30. | Curran | 13.6% | 6.4%(+7.20)#30 | 6.8%(+6.87)#1,441 |
| 31. | Thayer | 13.2% | 6.4%(+6.81)#31 | 6.8%(+6.48)#1,567 |
| 32. | Germantown | 13.2% | 6.4%(+6.75)#32 | 6.8%(+6.42)#1,576 |
| 33. | Metamora | 13.1% | 6.4%(+6.68)#33 | 6.8%(+6.35)#1,595 |
| 34. | Hecker | 13.0% | 6.4%(+6.58)#34 | 6.8%(+6.25)#1,628 |
| 35. | Urbana | 13.0% | 6.4%(+6.51)#35 | 6.8%(+6.19)#1,640 |
| 36. | Libertyville | 12.9% | 6.4%(+6.51)#36 | 6.8%(+6.18)#1,643 |
| 37. | Itasca | 12.8% | 6.4%(+6.40)#37 | 6.8%(+6.07)#1,683 |
| 38. | Schaumburg | 12.8% | 6.4%(+6.37)#38 | 6.8%(+6.04)#1,692 |
| 39. | Stickney | 12.8% | 6.4%(+6.36)#39 | 6.8%(+6.03)#1,696 |
| 40. | Elburn | 12.6% | 6.4%(+6.14)#40 | 6.8%(+5.81)#1,759 |
| 41. | Timberlane | 12.5% | 6.4%(+6.06)#41 | 6.8%(+5.74)#1,766 |
| 42. | Dunlap | 12.4% | 6.4%(+5.92)#42 | 6.8%(+5.59)#1,821 |
| 43. | Hoffman Estates | 12.3% | 6.4%(+5.90)#43 | 6.8%(+5.57)#1,830 |
| 44. | Savoy | 12.3% | 6.4%(+5.87)#44 | 6.8%(+5.54)#1,840 |
| 45. | Lake Zurich | 12.3% | 6.4%(+5.83)#45 | 6.8%(+5.50)#1,853 |
| 46. | Washington | 12.1% | 6.4%(+5.68)#46 | 6.8%(+5.35)#1,912 |
| 47. | Rome | 12.0% | 6.4%(+5.56)#47 | 6.8%(+5.23)#1,944 |
| 48. | Evanston | 11.8% | 6.4%(+5.41)#48 | 6.8%(+5.08)#1,992 |
| 49. | Wadsworth | 11.8% | 6.4%(+5.37)#49 | 6.8%(+5.04)#2,007 |
| 50. | Spaulding | 11.7% | 6.4%(+5.22)#50 | 6.8%(+4.89)#2,053 |
| 51. | O Fallon | 11.6% | 6.4%(+5.19)#51 | 6.8%(+4.86)#2,062 |
| 52. | Trout Valley | 11.4% | 6.4%(+4.96)#52 | 6.8%(+4.63)#2,165 |
| 53. | Lake Barrington | 11.4% | 6.4%(+4.93)#53 | 6.8%(+4.60)#2,186 |
| 54. | Arlington Heights | 11.4% | 6.4%(+4.92)#54 | 6.8%(+4.59)#2,200 |
| 55. | Northbrook | 11.3% | 6.4%(+4.85)#55 | 6.8%(+4.52)#2,223 |
| 56. | Oak Park | 11.2% | 6.4%(+4.81)#56 | 6.8%(+4.48)#2,248 |
| 57. | Gurnee | 11.2% | 6.4%(+4.80)#57 | 6.8%(+4.47)#2,254 |
| 58. | Oakwood Hills | 11.2% | 6.4%(+4.76)#58 | 6.8%(+4.43)#2,269 |
| 59. | Tremont | 11.2% | 6.4%(+4.75)#59 | 6.8%(+4.42)#2,274 |
| 60. | Fults | 11.1% | 6.4%(+4.68)#60 | 6.8%(+4.35)#2,327 |
| 61. | Westmont | 11.1% | 6.4%(+4.66)#61 | 6.8%(+4.33)#2,331 |
| 62. | Oakbrook Terrace | 11.1% | 6.4%(+4.63)#62 | 6.8%(+4.30)#2,344 |
| 63. | Edwardsville | 11.0% | 6.4%(+4.61)#63 | 6.8%(+4.28)#2,354 |
| 64. | Gilberts | 11.0% | 6.4%(+4.60)#64 | 6.8%(+4.27)#2,359 |
| 65. | Third Lake | 11.0% | 6.4%(+4.59)#65 | 6.8%(+4.26)#2,364 |
| 66. | Troy | 11.0% | 6.4%(+4.55)#66 | 6.8%(+4.22)#2,380 |
| 67. | Sadorus | 10.9% | 6.4%(+4.48)#67 | 6.8%(+4.15)#2,405 |
| 68. | Buffalo | 10.8% | 6.4%(+4.33)#68 | 6.8%(+4.00)#2,481 |
| 69. | Maeystown | 10.7% | 6.4%(+4.28)#69 | 6.8%(+3.95)#2,513 |
| 70. | Indian Creek | 10.7% | 6.4%(+4.24)#70 | 6.8%(+3.91)#2,534 |
| 71. | Bloomington | 10.6% | 6.4%(+4.12)#71 | 6.8%(+3.79)#2,604 |
| 72. | Glen Carbon | 10.6% | 6.4%(+4.11)#72 | 6.8%(+3.79)#2,609 |
| 73. | Twin Grove | 10.5% | 6.4%(+4.08)#73 | 6.8%(+3.75)#2,629 |
| 74. | Highwood | 10.5% | 6.4%(+4.03)#74 | 6.8%(+3.70)#2,656 |
| 75. | Champaign | 10.4% | 6.4%(+4.00)#75 | 6.8%(+3.67)#2,666 |
| 76. | Chillicothe | 10.4% | 6.4%(+3.97)#76 | 6.8%(+3.64)#2,691 |
| 77. | Fairview Heights | 10.3% | 6.4%(+3.87)#77 | 6.8%(+3.54)#2,751 |
| 78. | Lerna | 10.2% | 6.4%(+3.79)#78 | 6.8%(+3.46)#2,795 |
| 79. | Mascoutah | 10.2% | 6.4%(+3.76)#79 | 6.8%(+3.43)#2,820 |
| 80. | Winthrop Harbor | 10.2% | 6.4%(+3.74)#80 | 6.8%(+3.41)#2,829 |
| 81. | Wilmette | 10.1% | 6.4%(+3.69)#81 | 6.8%(+3.36)#2,864 |
| 82. | Peoria | 10.1% | 6.4%(+3.64)#82 | 6.8%(+3.31)#2,896 |
| 83. | Maryville | 10.0% | 6.4%(+3.54)#83 | 6.8%(+3.21)#2,967 |
| 84. | Lombard | 9.8% | 6.4%(+3.35)#84 | 6.8%(+3.02)#3,084 |
| 85. | Lake Bluff | 9.8% | 6.4%(+3.33)#85 | 6.8%(+3.00)#3,099 |
| 86. | Indian Head Park | 9.7% | 6.4%(+3.30)#86 | 6.8%(+2.97)#3,123 |
| 87. | River Forest | 9.7% | 6.4%(+3.28)#87 | 6.8%(+2.95)#3,146 |
| 88. | Lily Lake | 9.7% | 6.4%(+3.27)#88 | 6.8%(+2.94)#3,148 |
| 89. | Mettawa | 9.7% | 6.4%(+3.25)#89 | 6.8%(+2.93)#3,161 |
| 90. | Highland | 9.7% | 6.4%(+3.24)#90 | 6.8%(+2.91)#3,176 |
| 91. | New Baden | 9.7% | 6.4%(+3.23)#91 | 6.8%(+2.90)#3,179 |
| 92. | Forest Park | 9.7% | 6.4%(+3.23)#92 | 6.8%(+2.90)#3,180 |
| 93. | Port Byron | 9.7% | 6.4%(+3.22)#93 | 6.8%(+2.89)#3,187 |
| 94. | Clarendon Hills | 9.6% | 6.4%(+3.13)#94 | 6.8%(+2.80)#3,263 |
| 95. | Park Ridge | 9.6% | 6.4%(+3.13)#95 | 6.8%(+2.80)#3,269 |
| 96. | Bartlett | 9.5% | 6.4%(+3.11)#96 | 6.8%(+2.78)#3,275 |
| 97. | La Grange Park | 9.5% | 6.4%(+3.10)#97 | 6.8%(+2.77)#3,283 |
| 98. | Grandwood Park | 9.5% | 6.4%(+3.04)#98 | 6.8%(+2.71)#3,327 |
| 99. | Damiansville | 9.5% | 6.4%(+3.03)#99 | 6.8%(+2.70)#3,335 |
| 100. | Roscoe | 9.5% | 6.4%(+3.03)#100 | 6.8%(+2.70)#3,336 |
Common Questions
What are the Top 10 Cities with the Highest Percentage of Population Employed in Computer, Engineering & Science in Illinois?
Top 10 Cities with the Highest Percentage of Population Employed in Computer, Engineering & Science in Illinois are:
#1
22.1%
#2
21.0%
#3
20.9%
#4
20.8%
#5
19.4%
#6
19.3%
#7
18.8%
#8
18.5%
#9
17.4%
#10
17.1%
What city has the Highest Percentage of Population Employed in Computer, Engineering & Science in Illinois?
Grand Detour has the Highest Percentage of Population Employed in Computer, Engineering & Science in Illinois with 22.1%.
What is the Percentage of Population Employed in Computer, Engineering & Science in the State of Illinois?
Percentage of Population Employed in Computer, Engineering & Science in Illinois is 6.4%.
What is the Percentage of Population Employed in Computer, Engineering & Science in the United States?
Percentage of Population Employed in Computer, Engineering & Science in the United States is 6.8%.