Swall Meadows, CA Map & Demographics
Swall Meadows Map
Swall Meadows Overview
$78,525
PER CAPITA INCOME
$129,300
AVG FAMILY INCOME
$179,792
AVG HOUSEHOLD INCOME
0.30
INEQUALITY / GINI INDEX
365
TOTAL POPULATION
243
MALE POPULATION
122
FEMALE POPULATION
199.18
MALES / 100 FEMALES
50.21
FEMALES / 100 MALES
59.2
MEDIAN AGE
2.3
AVG FAMILY SIZE
2.2
AVG HOUSEHOLD SIZE
241
LABOR FORCE [ PEOPLE ]
70.5%
PERCENT IN LABOR FORCE
2.1%
UNEMPLOYMENT RATE
Income in Swall Meadows
Income Overview in Swall Meadows
Per Capita Income in Swall Meadows is $78,525, while median incomes of families and households are $129,300 and $179,792 respectively.
| Characteristic | Number | Measure |
| Per Capita Income | 365 | $78,525 |
| Median Family Income | 150 | $129,300 |
| Mean Family Income | 150 | $183,740 |
| Median Household Income | 162 | $179,792 |
| Mean Household Income | 162 | $193,731 |
| Income Deficit | 150 | $0 |
| Wage / Income Gap (%) | 365 | 0.00% |
| Wage / Income Gap ($) | 365 | 100.00¢ per $1 |
| Gini / Inequality Index | 365 | 0.30 |
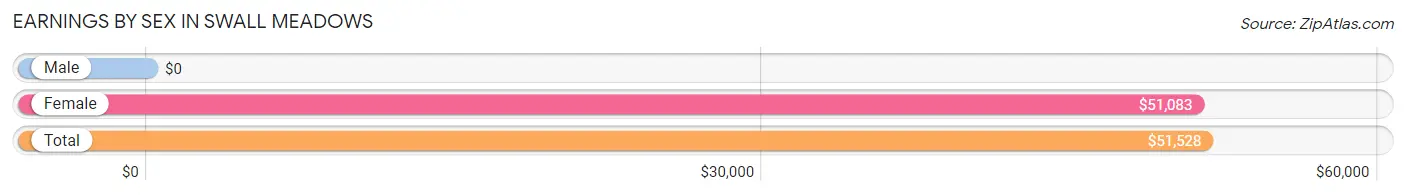
Earnings by Sex in Swall Meadows
| Sex | Number | Average Earnings |
| Male | 201 (76.7%) | $0 |
| Female | 61 (23.3%) | $51,083 |
| Total | 262 (100.0%) | $51,528 |
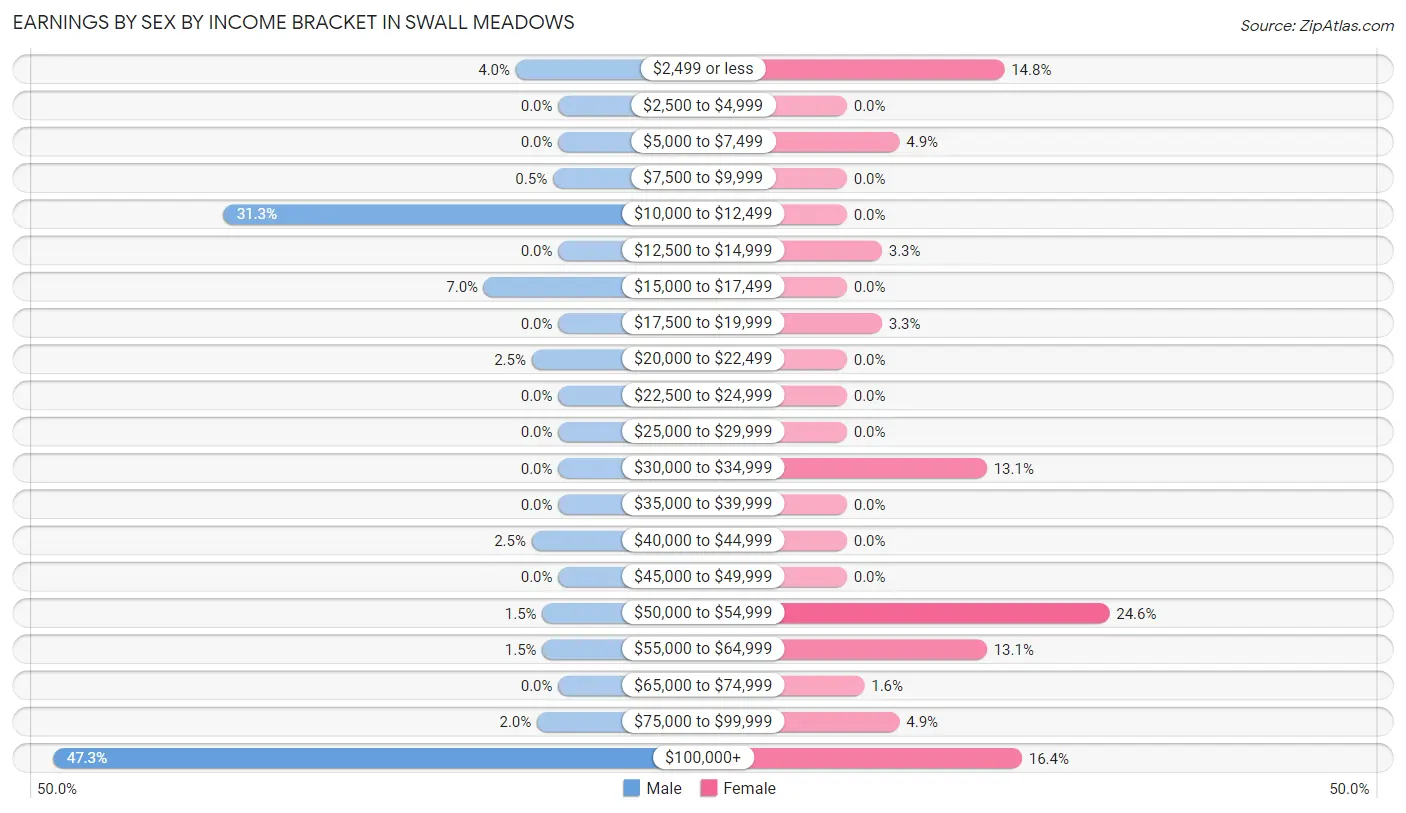
Earnings by Sex by Income Bracket in Swall Meadows
The most common earnings brackets in Swall Meadows are $100,000+ for men (95 | 47.3%) and $50,000 to $54,999 for women (15 | 24.6%).
| Income | Male | Female |
| $2,499 or less | 8 (4.0%) | 9 (14.7%) |
| $2,500 to $4,999 | 0 (0.0%) | 0 (0.0%) |
| $5,000 to $7,499 | 0 (0.0%) | 3 (4.9%) |
| $7,500 to $9,999 | 1 (0.5%) | 0 (0.0%) |
| $10,000 to $12,499 | 63 (31.3%) | 0 (0.0%) |
| $12,500 to $14,999 | 0 (0.0%) | 2 (3.3%) |
| $15,000 to $17,499 | 14 (7.0%) | 0 (0.0%) |
| $17,500 to $19,999 | 0 (0.0%) | 2 (3.3%) |
| $20,000 to $22,499 | 5 (2.5%) | 0 (0.0%) |
| $22,500 to $24,999 | 0 (0.0%) | 0 (0.0%) |
| $25,000 to $29,999 | 0 (0.0%) | 0 (0.0%) |
| $30,000 to $34,999 | 0 (0.0%) | 8 (13.1%) |
| $35,000 to $39,999 | 0 (0.0%) | 0 (0.0%) |
| $40,000 to $44,999 | 5 (2.5%) | 0 (0.0%) |
| $45,000 to $49,999 | 0 (0.0%) | 0 (0.0%) |
| $50,000 to $54,999 | 3 (1.5%) | 15 (24.6%) |
| $55,000 to $64,999 | 3 (1.5%) | 8 (13.1%) |
| $65,000 to $74,999 | 0 (0.0%) | 1 (1.6%) |
| $75,000 to $99,999 | 4 (2.0%) | 3 (4.9%) |
| $100,000+ | 95 (47.3%) | 10 (16.4%) |
| Total | 201 (100.0%) | 61 (100.0%) |
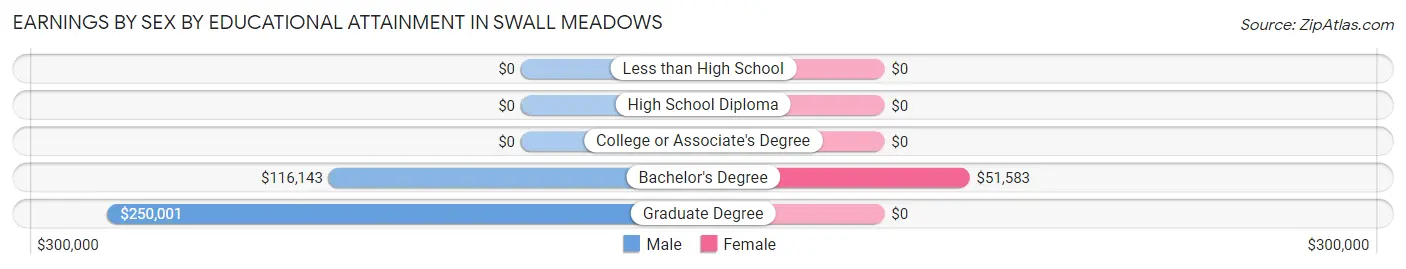
Earnings by Sex by Educational Attainment in Swall Meadows
Average earnings in Swall Meadows are $115,607 for men and $51,083 for women, a difference of 55.8%. Men with an educational attainment of graduate degree enjoy the highest average annual earnings of $250,001, while those with bachelor's degree education earn the least with $116,143. Women with an educational attainment of bachelor's degree earn the most with the average annual earnings of $51,583, while those with bachelor's degree education have the smallest earnings of $51,583.
| Educational Attainment | Male Income | Female Income |
| Less than High School | - | - |
| High School Diploma | - | - |
| College or Associate's Degree | - | - |
| Bachelor's Degree | $116,143 | $51,583 |
| Graduate Degree | $250,001 | $0 |
| Total | $115,607 | $51,083 |
Family Income in Swall Meadows
Family Income Brackets in Swall Meadows
According to the Swall Meadows family income data, there are 75 families falling into the $100,000 to $149,999 income range, which is the most common income bracket and makes up 50.0% of all families.
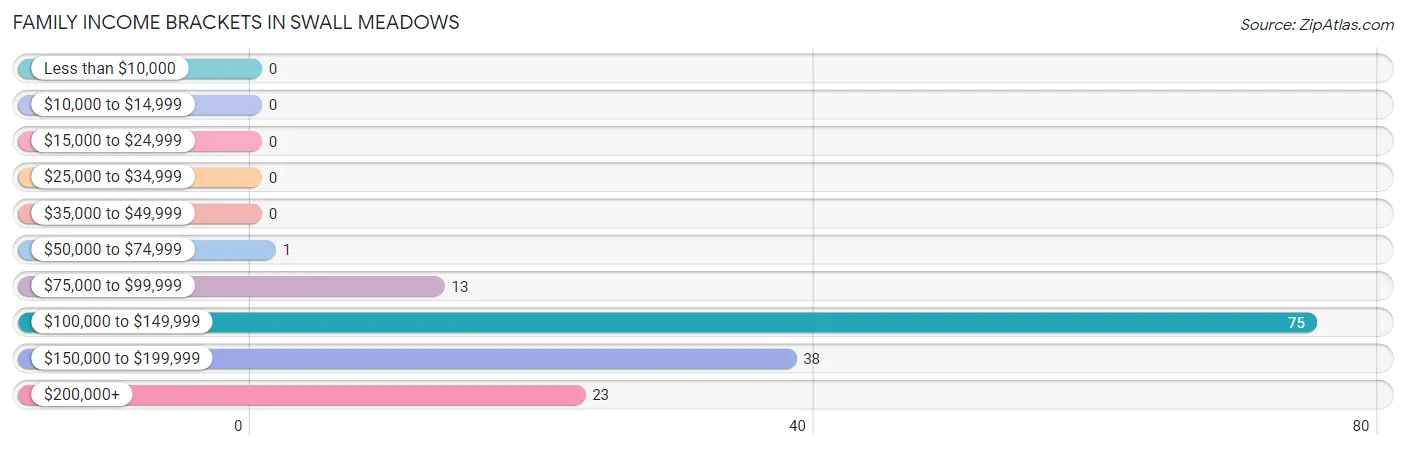
| Income Bracket | # Families | % Families |
| Less than $10,000 | 0 | 0.0% |
| $10,000 to $14,999 | 0 | 0.0% |
| $15,000 to $24,999 | 0 | 0.0% |
| $25,000 to $34,999 | 0 | 0.0% |
| $35,000 to $49,999 | 0 | 0.0% |
| $50,000 to $74,999 | 1 | 0.7% |
| $75,000 to $99,999 | 13 | 8.7% |
| $100,000 to $149,999 | 75 | 50.0% |
| $150,000 to $199,999 | 38 | 25.3% |
| $200,000+ | 23 | 15.3% |
Family Income by Famaliy Size in Swall Meadows
3-person families (8 | 5.3%) account for the highest median family income in Swall Meadows with $250,001 per family, while 3-person families (8 | 5.3%) have the highest median income of $83,334 per family member.
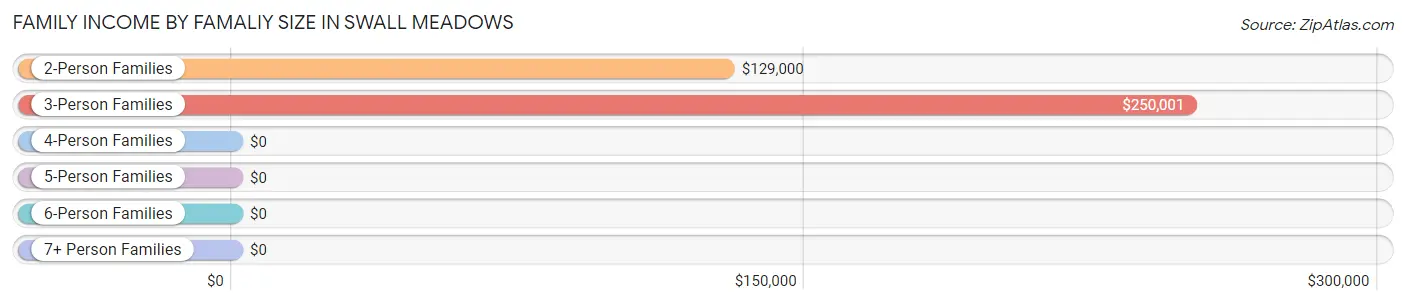
| Income Bracket | # Families | Median Income |
| 2-Person Families | 136 (90.7%) | $129,000 |
| 3-Person Families | 8 (5.3%) | $250,001 |
| 4-Person Families | 6 (4.0%) | $0 |
| 5-Person Families | 0 (0.0%) | $0 |
| 6-Person Families | 0 (0.0%) | $0 |
| 7+ Person Families | 0 (0.0%) | $0 |
| Total | 150 (100.0%) | $129,300 |
Family Income by Number of Earners in Swall Meadows
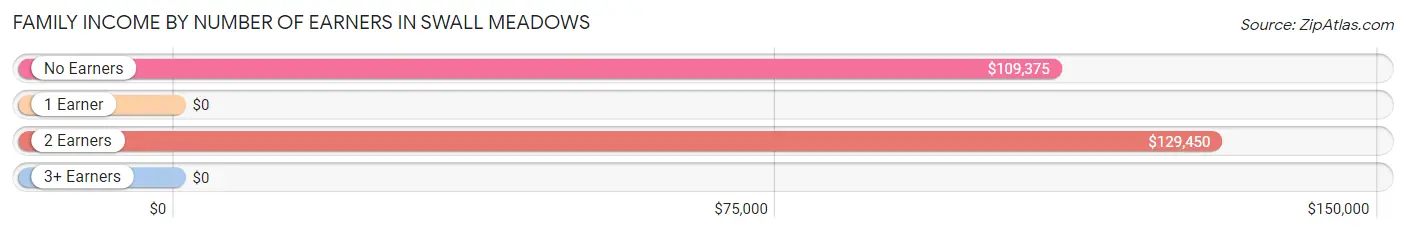
| Number of Earners | # Families | Median Income |
| No Earners | 20 (13.3%) | $109,375 |
| 1 Earner | 18 (12.0%) | $0 |
| 2 Earners | 112 (74.7%) | $129,450 |
| 3+ Earners | 0 (0.0%) | $0 |
| Total | 150 (100.0%) | $129,300 |
Household Income in Swall Meadows
Household Income Brackets in Swall Meadows
With 88 households falling in the category, the $150,000 to $199,999 income range is the most frequent in Swall Meadows, accounting for 54.3% of all households.
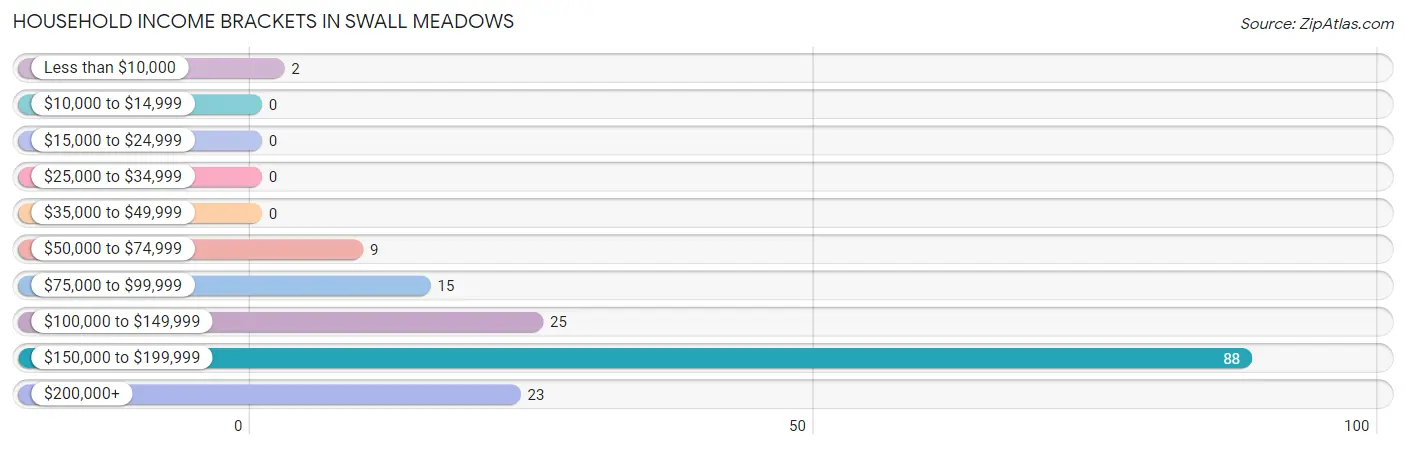
| Income Bracket | # Households | % Households |
| Less than $10,000 | 2 | 1.2% |
| $10,000 to $14,999 | 0 | 0.0% |
| $15,000 to $24,999 | 0 | 0.0% |
| $25,000 to $34,999 | 0 | 0.0% |
| $35,000 to $49,999 | 0 | 0.0% |
| $50,000 to $74,999 | 9 | 5.6% |
| $75,000 to $99,999 | 15 | 9.3% |
| $100,000 to $149,999 | 25 | 15.4% |
| $150,000 to $199,999 | 88 | 54.3% |
| $200,000+ | 23 | 14.2% |
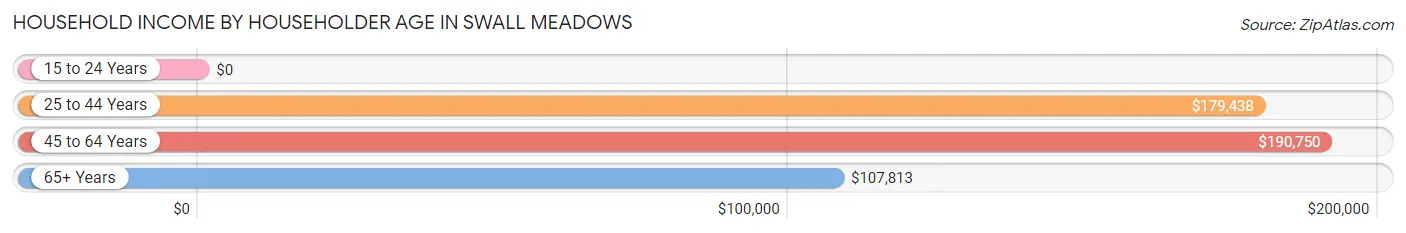
Household Income by Householder Age in Swall Meadows
The median household income in Swall Meadows is $179,792, with the highest median household income of $190,750 found in the 45 to 64 years age bracket for the primary householder. A total of 76 households (46.9%) fall into this category.
| Income Bracket | # Households | Median Income |
| 15 to 24 Years | 0 (0.0%) | $0 |
| 25 to 44 Years | 31 (19.1%) | $179,438 |
| 45 to 64 Years | 76 (46.9%) | $190,750 |
| 65+ Years | 55 (34.0%) | $107,813 |
| Total | 162 (100.0%) | $179,792 |
Poverty in Swall Meadows
Income Below Poverty by Sex and Age in Swall Meadows
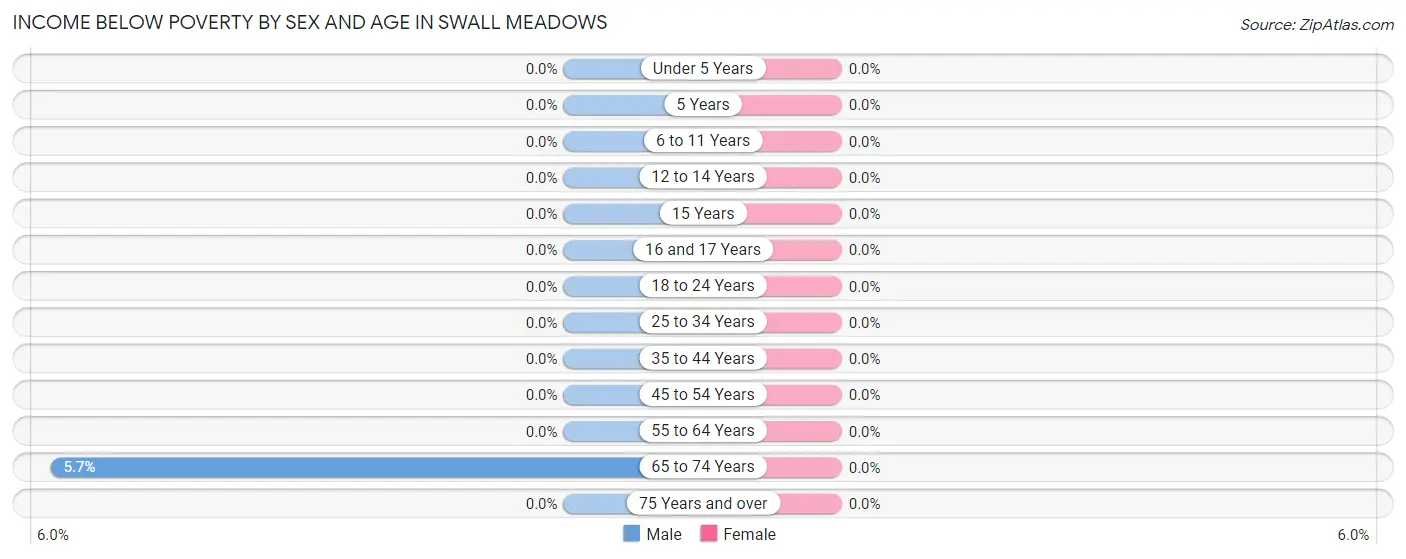
| Age Bracket | Male | Female |
| Under 5 Years | 0 (0.0%) | 0 (0.0%) |
| 5 Years | 0 (0.0%) | 0 (0.0%) |
| 6 to 11 Years | 0 (0.0%) | 0 (0.0%) |
| 12 to 14 Years | 0 (0.0%) | 0 (0.0%) |
| 15 Years | 0 (0.0%) | 0 (0.0%) |
| 16 and 17 Years | 0 (0.0%) | 0 (0.0%) |
| 18 to 24 Years | 0 (0.0%) | 0 (0.0%) |
| 25 to 34 Years | 0 (0.0%) | 0 (0.0%) |
| 35 to 44 Years | 0 (0.0%) | 0 (0.0%) |
| 45 to 54 Years | 0 (0.0%) | 0 (0.0%) |
| 55 to 64 Years | 0 (0.0%) | 0 (0.0%) |
| 65 to 74 Years | 2 (5.7%) | 0 (0.0%) |
| 75 Years and over | 0 (0.0%) | 0 (0.0%) |
| Total | 2 (0.8%) | 0 (0.0%) |
Income Above Poverty by Sex and Age in Swall Meadows
According to the poverty statistics in Swall Meadows, males aged under 5 years and females aged under 5 years are the age groups that are most secure financially, with 100.0% of males and 100.0% of females in these age groups living above the poverty line.
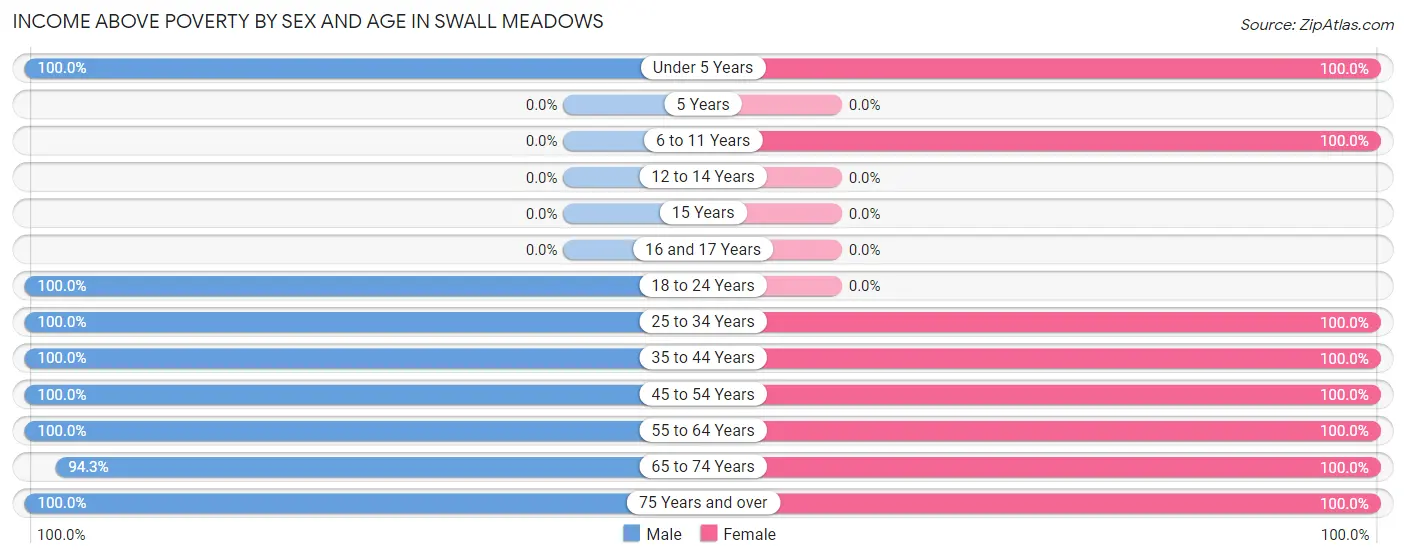
| Age Bracket | Male | Female |
| Under 5 Years | 3 (100.0%) | 13 (100.0%) |
| 5 Years | 0 (0.0%) | 0 (0.0%) |
| 6 to 11 Years | 0 (0.0%) | 7 (100.0%) |
| 12 to 14 Years | 0 (0.0%) | 0 (0.0%) |
| 15 Years | 0 (0.0%) | 0 (0.0%) |
| 16 and 17 Years | 0 (0.0%) | 0 (0.0%) |
| 18 to 24 Years | 63 (100.0%) | 0 (0.0%) |
| 25 to 34 Years | 3 (100.0%) | 3 (100.0%) |
| 35 to 44 Years | 37 (100.0%) | 24 (100.0%) |
| 45 to 54 Years | 5 (100.0%) | 6 (100.0%) |
| 55 to 64 Years | 83 (100.0%) | 26 (100.0%) |
| 65 to 74 Years | 33 (94.3%) | 24 (100.0%) |
| 75 Years and over | 14 (100.0%) | 19 (100.0%) |
| Total | 241 (99.2%) | 122 (100.0%) |
Income Below Poverty Among Married-Couple Families in Swall Meadows
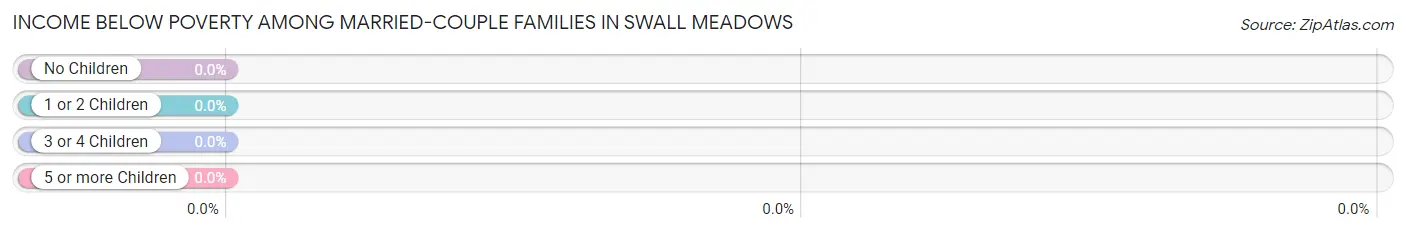
| Children | Above Poverty | Below Poverty |
| No Children | 83 (100.0%) | 0 (0.0%) |
| 1 or 2 Children | 11 (100.0%) | 0 (0.0%) |
| 3 or 4 Children | 0 (0.0%) | 0 (0.0%) |
| 5 or more Children | 0 (0.0%) | 0 (0.0%) |
| Total | 94 (100.0%) | 0 (0.0%) |
Income Below Poverty Among Single-Parent Households in Swall Meadows
| Children | Single Father | Single Mother |
| No Children | 0 (0.0%) | 0 (0.0%) |
| 1 or 2 Children | 0 (0.0%) | 0 (0.0%) |
| 3 or 4 Children | 0 (0.0%) | 0 (0.0%) |
| 5 or more Children | 0 (0.0%) | 0 (0.0%) |
| Total | 0 (0.0%) | 0 (0.0%) |
Income Below Poverty Among Married-Couple vs Single-Parent Households in Swall Meadows
| Children | Married-Couple Families | Single-Parent Households |
| No Children | 0 (0.0%) | 0 (0.0%) |
| 1 or 2 Children | 0 (0.0%) | 0 (0.0%) |
| 3 or 4 Children | 0 (0.0%) | 0 (0.0%) |
| 5 or more Children | 0 (0.0%) | 0 (0.0%) |
| Total | 0 (0.0%) | 0 (0.0%) |
Race in Swall Meadows
The most populous races in Swall Meadows are White / Caucasian (359 | 98.4%), Hispanic or Latino (113 | 31.0%), and Two or more Races (3 | 0.8%).
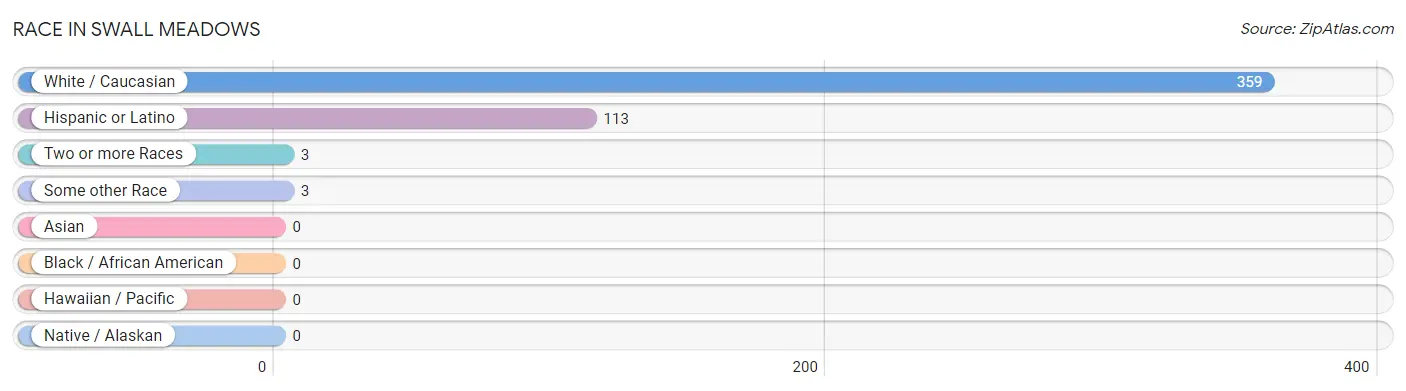
| Race | # Population | % Population |
| Asian | 0 | 0.0% |
| Black / African American | 0 | 0.0% |
| Hawaiian / Pacific | 0 | 0.0% |
| Hispanic or Latino | 113 | 31.0% |
| Native / Alaskan | 0 | 0.0% |
| White / Caucasian | 359 | 98.4% |
| Two or more Races | 3 | 0.8% |
| Some other Race | 3 | 0.8% |
| Total | 365 | 100.0% |
Ancestry in Swall Meadows
The most populous ancestries reported in Swall Meadows are Portuguese (116 | 31.8%), Mexican (113 | 31.0%), English (50 | 13.7%), Scottish (24 | 6.6%), and American (22 | 6.0%), together accounting for 89.0% of all Swall Meadows residents.
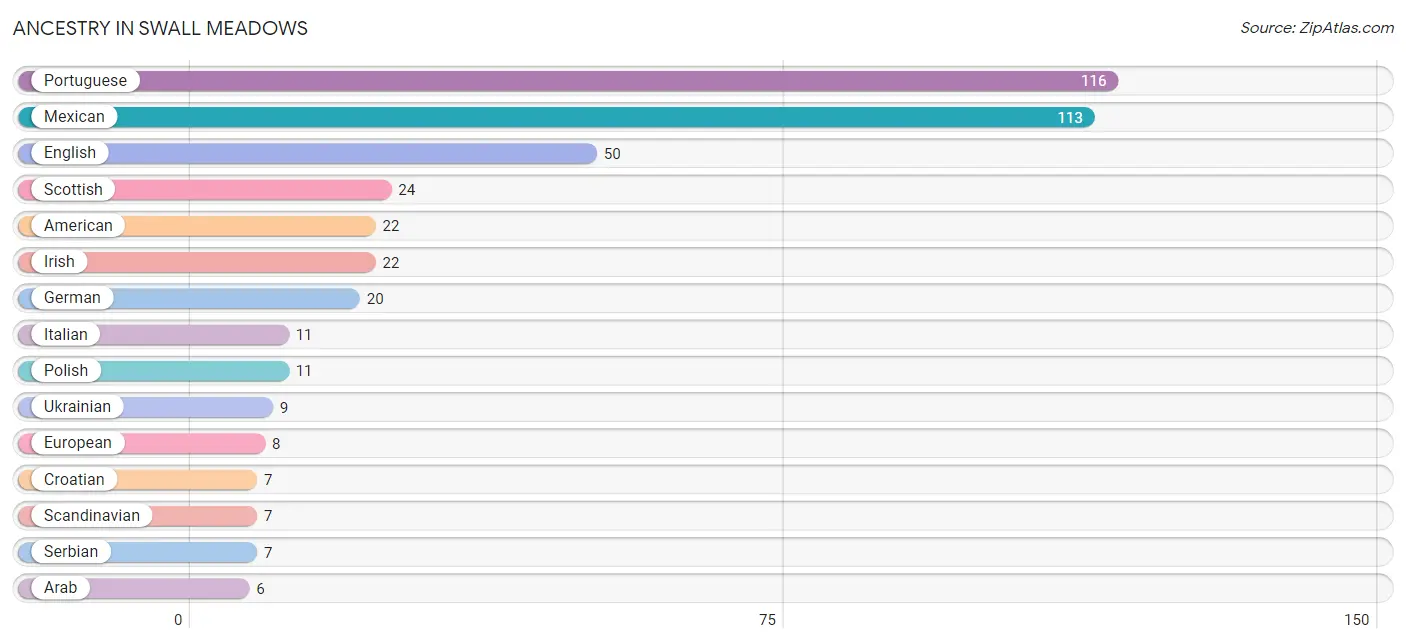
| Ancestry | # Population | % Population |
| American | 22 | 6.0% |
| Arab | 6 | 1.6% |
| Belgian | 3 | 0.8% |
| British | 5 | 1.4% |
| Croatian | 7 | 1.9% |
| Dutch | 4 | 1.1% |
| English | 50 | 13.7% |
| European | 8 | 2.2% |
| French | 3 | 0.8% |
| German | 20 | 5.5% |
| Irish | 22 | 6.0% |
| Italian | 11 | 3.0% |
| Lithuanian | 4 | 1.1% |
| Mexican | 113 | 31.0% |
| Moroccan | 6 | 1.6% |
| Norwegian | 4 | 1.1% |
| Polish | 11 | 3.0% |
| Portuguese | 116 | 31.8% |
| Scandinavian | 7 | 1.9% |
| Scottish | 24 | 6.6% |
| Serbian | 7 | 1.9% |
| Swedish | 5 | 1.4% |
| Ukrainian | 9 | 2.5% |
| Welsh | 3 | 0.8% | View All 24 Rows |
Immigrants in Swall Meadows
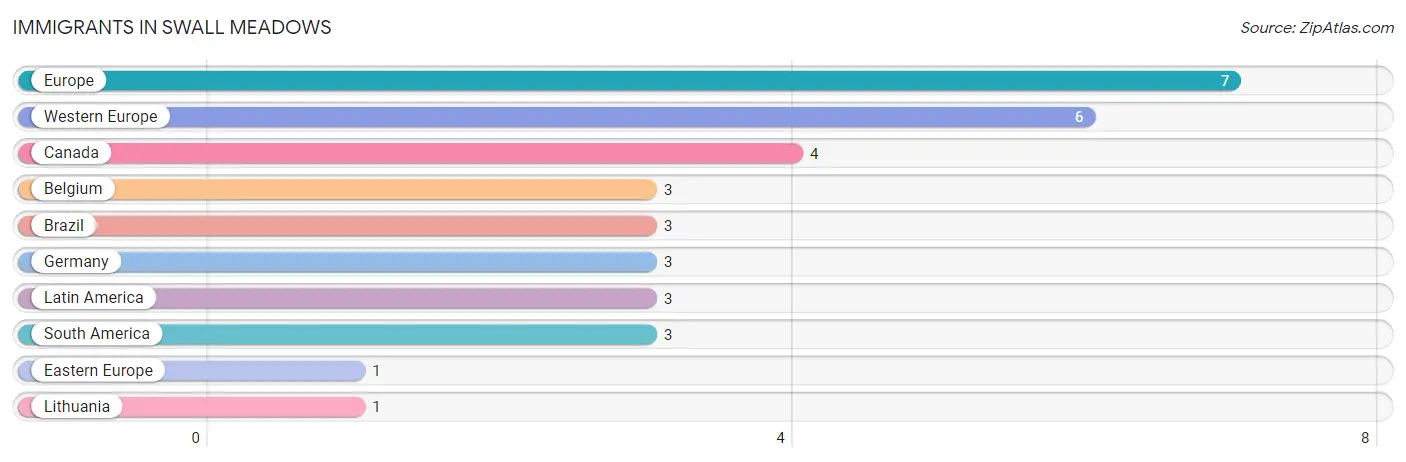
The most numerous immigrant groups reported in Swall Meadows came from Europe (7 | 1.9%), Western Europe (6 | 1.6%), Canada (4 | 1.1%), Belgium (3 | 0.8%), and Brazil (3 | 0.8%), together accounting for 6.3% of all Swall Meadows residents.
| Immigration Origin | # Population | % Population |
| Belgium | 3 | 0.8% |
| Brazil | 3 | 0.8% |
| Canada | 4 | 1.1% |
| Eastern Europe | 1 | 0.3% |
| Europe | 7 | 1.9% |
| Germany | 3 | 0.8% |
| Latin America | 3 | 0.8% |
| Lithuania | 1 | 0.3% |
| South America | 3 | 0.8% |
| Western Europe | 6 | 1.6% | View All 10 Rows |
Sex and Age in Swall Meadows
Sex and Age in Swall Meadows
The most populous age groups in Swall Meadows are 20 to 24 Years (63 | 25.9%) for men and 35 to 39 Years (24 | 19.7%) for women.
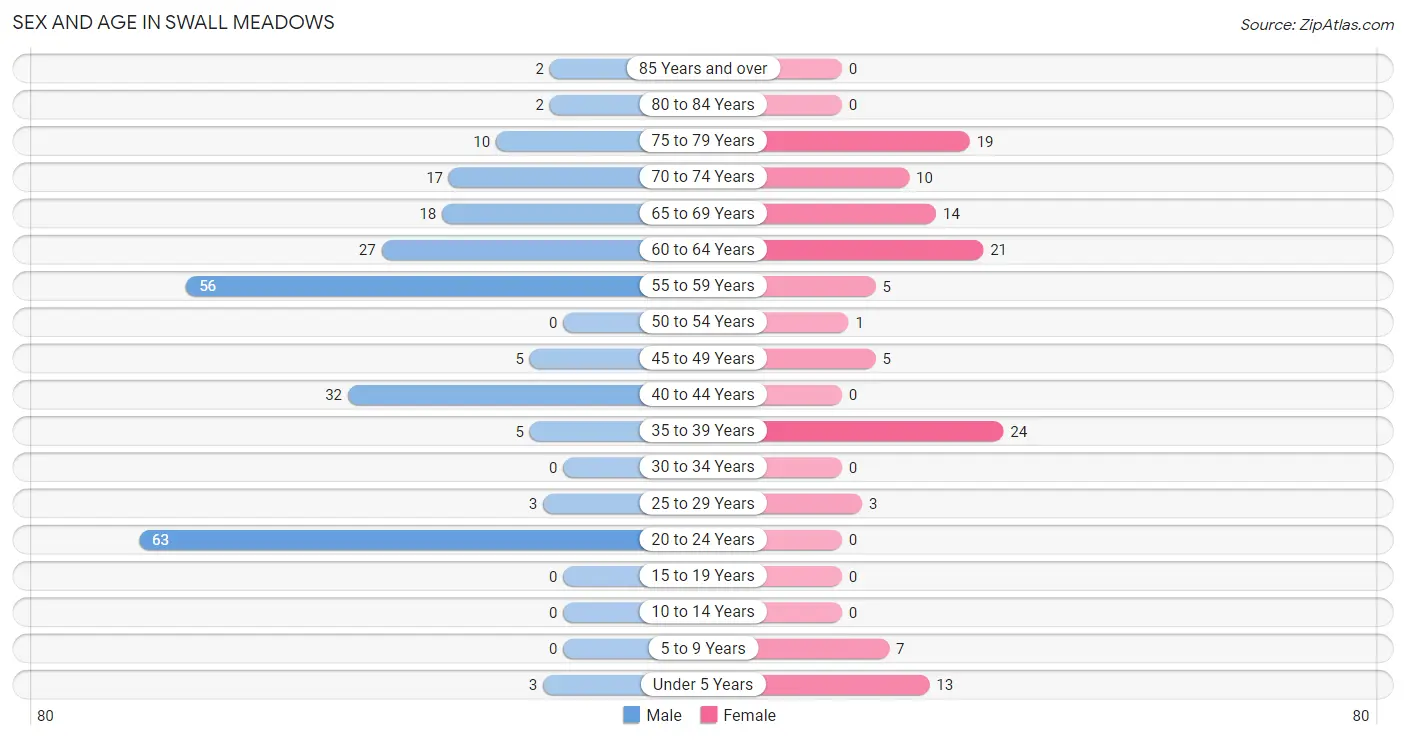
| Age Bracket | Male | Female |
| Under 5 Years | 3 (1.2%) | 13 (10.7%) |
| 5 to 9 Years | 0 (0.0%) | 7 (5.7%) |
| 10 to 14 Years | 0 (0.0%) | 0 (0.0%) |
| 15 to 19 Years | 0 (0.0%) | 0 (0.0%) |
| 20 to 24 Years | 63 (25.9%) | 0 (0.0%) |
| 25 to 29 Years | 3 (1.2%) | 3 (2.5%) |
| 30 to 34 Years | 0 (0.0%) | 0 (0.0%) |
| 35 to 39 Years | 5 (2.1%) | 24 (19.7%) |
| 40 to 44 Years | 32 (13.2%) | 0 (0.0%) |
| 45 to 49 Years | 5 (2.1%) | 5 (4.1%) |
| 50 to 54 Years | 0 (0.0%) | 1 (0.8%) |
| 55 to 59 Years | 56 (23.1%) | 5 (4.1%) |
| 60 to 64 Years | 27 (11.1%) | 21 (17.2%) |
| 65 to 69 Years | 18 (7.4%) | 14 (11.5%) |
| 70 to 74 Years | 17 (7.0%) | 10 (8.2%) |
| 75 to 79 Years | 10 (4.1%) | 19 (15.6%) |
| 80 to 84 Years | 2 (0.8%) | 0 (0.0%) |
| 85 Years and over | 2 (0.8%) | 0 (0.0%) |
| Total | 243 (100.0%) | 122 (100.0%) |
Families and Households in Swall Meadows
Median Family Size in Swall Meadows
The median family size in Swall Meadows is 2.31 persons per family, with married-couple families (94 | 62.7%) accounting for the largest median family size of 2.37 persons per family. On the other hand, single female/mother families (3 | 2.0%) represent the smallest median family size with 1.33 persons per family.
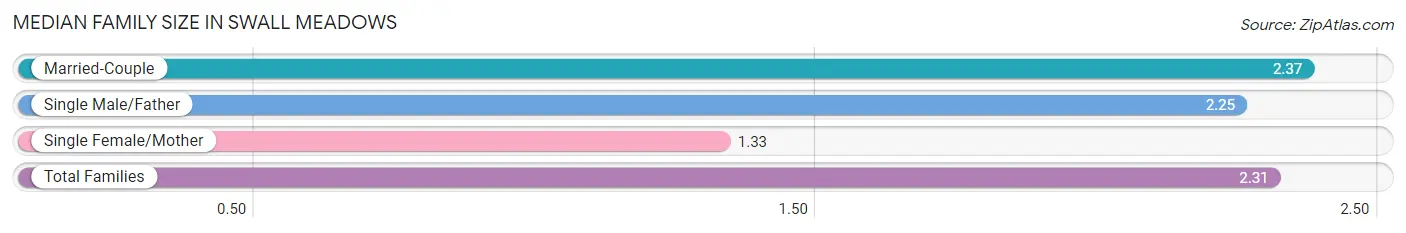
| Family Type | # Families | Family Size |
| Married-Couple | 94 (62.7%) | 2.37 |
| Single Male/Father | 53 (35.3%) | 2.25 |
| Single Female/Mother | 3 (2.0%) | 1.33 |
| Total Families | 150 (100.0%) | 2.31 |
Median Household Size in Swall Meadows
The median household size in Swall Meadows is 2.25 persons per household, with married-couple households (94 | 58.0%) accounting for the largest median household size of 2.37 persons per household. single female/mother households (3 | 1.8%) represent the smallest median household size with 1.33 persons per household.
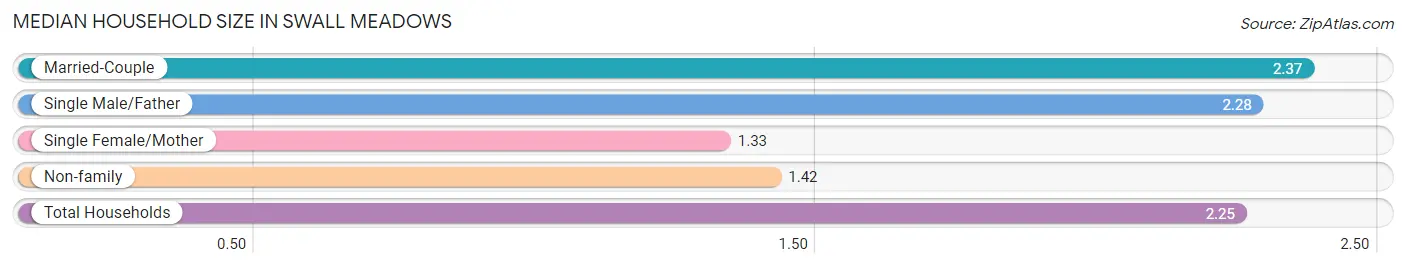
| Household Type | # Households | Household Size |
| Married-Couple | 94 (58.0%) | 2.37 |
| Single Male/Father | 53 (32.7%) | 2.28 |
| Single Female/Mother | 3 (1.8%) | 1.33 |
| Non-family | 12 (7.4%) | 1.42 |
| Total Households | 162 (100.0%) | 2.25 |
Household Size by Marriage Status in Swall Meadows
Out of a total of 162 households in Swall Meadows, 150 (92.6%) are family households, while 12 (7.4%) are nonfamily households. The most numerous type of family households are 2-person households, comprising 86, and the most common type of nonfamily households are 1-person households, comprising 6.
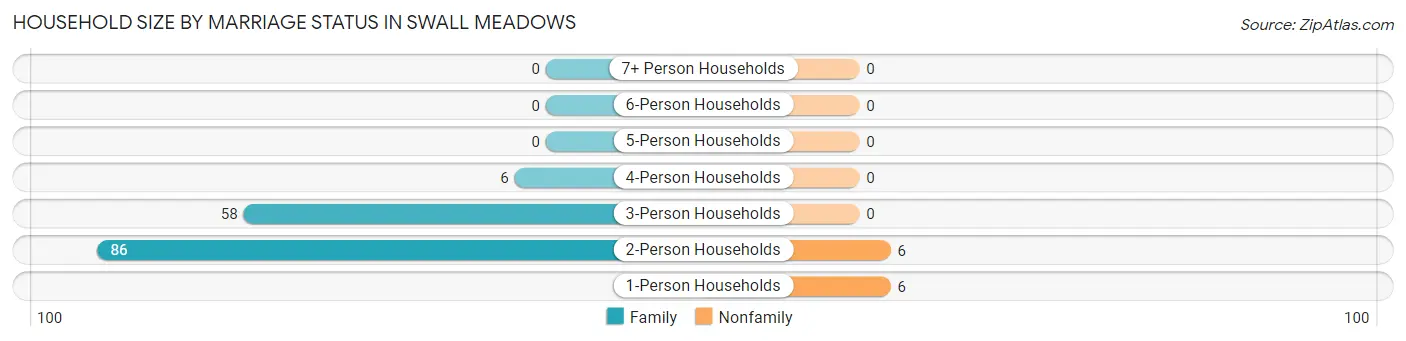
| Household Size | Family Households | Nonfamily Households |
| 1-Person Households | - | 6 (3.7%) |
| 2-Person Households | 86 (53.1%) | 6 (3.7%) |
| 3-Person Households | 58 (35.8%) | 0 (0.0%) |
| 4-Person Households | 6 (3.7%) | 0 (0.0%) |
| 5-Person Households | 0 (0.0%) | 0 (0.0%) |
| 6-Person Households | 0 (0.0%) | 0 (0.0%) |
| 7+ Person Households | 0 (0.0%) | 0 (0.0%) |
| Total | 150 (92.6%) | 12 (7.4%) |
Female Fertility in Swall Meadows
Fertility by Age in Swall Meadows
| Age Bracket | Women with Births | Births / 1,000 Women |
| 15 to 19 years | 0 (0.0%) | 0.0 |
| 20 to 34 years | 0 (0.0%) | 0.0 |
| 35 to 50 years | 0 (0.0%) | 0.0 |
| Total | 0 (0.0%) | 0.0 |
Fertility by Age by Marriage Status in Swall Meadows
| Age Bracket | Married | Unmarried |
| 15 to 19 years | 0 (0.0%) | 0 (0.0%) |
| 20 to 34 years | 0 (0.0%) | 0 (0.0%) |
| 35 to 50 years | 0 (0.0%) | 0 (0.0%) |
| Total | 0 (0.0%) | 0 (0.0%) |
Fertility by Education in Swall Meadows
| Educational Attainment | Women with Births | Births / 1,000 Women |
| Less than High School | 0 (0.0%) | 0.0 |
| High School Diploma | 0 (0.0%) | 0.0 |
| College or Associate's Degree | 0 (0.0%) | 0.0 |
| Bachelor's Degree | 0 (0.0%) | 0.0 |
| Graduate Degree | 0 (0.0%) | 0.0 |
| Total | 0 (0.0%) | 0.0 |
Fertility by Education by Marriage Status in Swall Meadows
| Educational Attainment | Married | Unmarried |
| Less than High School | 0 (0.0%) | 0 (0.0%) |
| High School Diploma | 0 (0.0%) | 0 (0.0%) |
| College or Associate's Degree | 0 (0.0%) | 0 (0.0%) |
| Bachelor's Degree | 0 (0.0%) | 0 (0.0%) |
| Graduate Degree | 0 (0.0%) | 0 (0.0%) |
| Total | 0 (0.0%) | 0 (0.0%) |
Employment Characteristics in Swall Meadows
Employment by Class of Employer in Swall Meadows
Among the 236 employed individuals in Swall Meadows, private company employees (133 | 56.4%), local government employees (59 | 25.0%), and self-employed (not incorporated) (20 | 8.5%) make up the most common classes of employment.
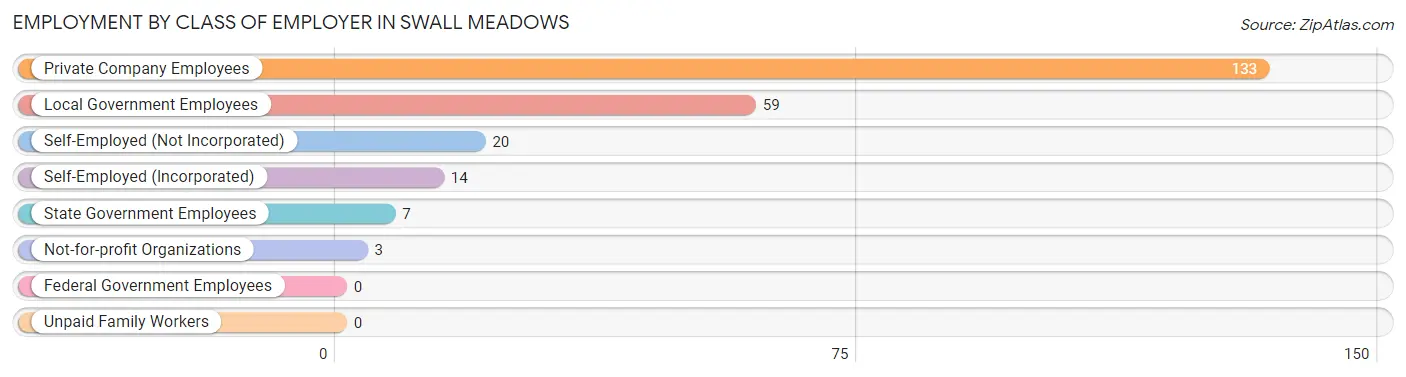
| Employer Class | # Employees | % Employees |
| Private Company Employees | 133 | 56.4% |
| Self-Employed (Incorporated) | 14 | 5.9% |
| Self-Employed (Not Incorporated) | 20 | 8.5% |
| Not-for-profit Organizations | 3 | 1.3% |
| Local Government Employees | 59 | 25.0% |
| State Government Employees | 7 | 3.0% |
| Federal Government Employees | 0 | 0.0% |
| Unpaid Family Workers | 0 | 0.0% |
| Total | 236 | 100.0% |
Employment Status by Age in Swall Meadows
According to the labor force statistics for Swall Meadows, out of the total population over 16 years of age (342), 70.5% or 241 individuals are in the labor force, with 2.1% or 5 of them unemployed. The age group with the highest labor force participation rate is 20 to 24 years, with 100.0% or 63 individuals in the labor force. Within the labor force, the 60 to 64 years age range has the highest percentage of unemployed individuals, with 21.7% or 5 of them being unemployed.
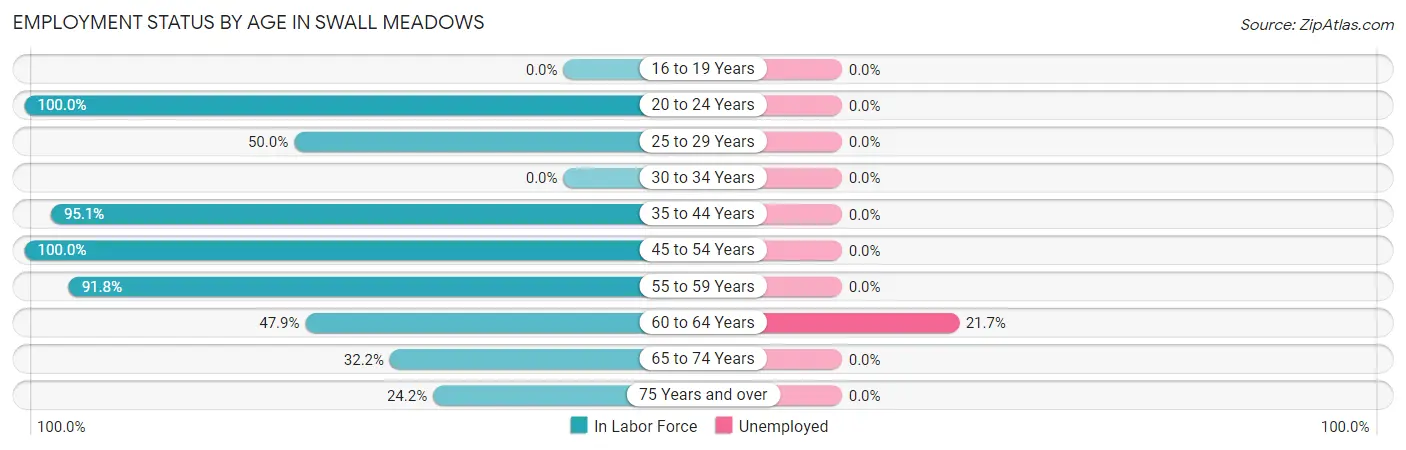
| Age Bracket | In Labor Force | Unemployed |
| 16 to 19 Years | 0 (0.0%) | 0 (0.0%) |
| 20 to 24 Years | 63 (100.0%) | 0 (0.0%) |
| 25 to 29 Years | 3 (50.0%) | 0 (0.0%) |
| 30 to 34 Years | 0 (0.0%) | 0 (0.0%) |
| 35 to 44 Years | 58 (95.1%) | 0 (0.0%) |
| 45 to 54 Years | 11 (100.0%) | 0 (0.0%) |
| 55 to 59 Years | 56 (91.8%) | 0 (0.0%) |
| 60 to 64 Years | 23 (47.9%) | 5 (21.7%) |
| 65 to 74 Years | 19 (32.2%) | 0 (0.0%) |
| 75 Years and over | 8 (24.2%) | 0 (0.0%) |
| Total | 241 (70.5%) | 5 (2.1%) |
Employment Status by Educational Attainment in Swall Meadows
According to labor force statistics for Swall Meadows, 80.7% of individuals (151) out of the total population between 25 and 64 years of age (187) are in the labor force, with 3.3% or 5 of them being unemployed. The group with the highest labor force participation rate are those with the educational attainment of high school diploma, with 100.0% or 8 individuals in the labor force. Within the labor force, individuals with college / associate degree education have the highest percentage of unemployment, with 15.6% or 5 of them being unemployed.
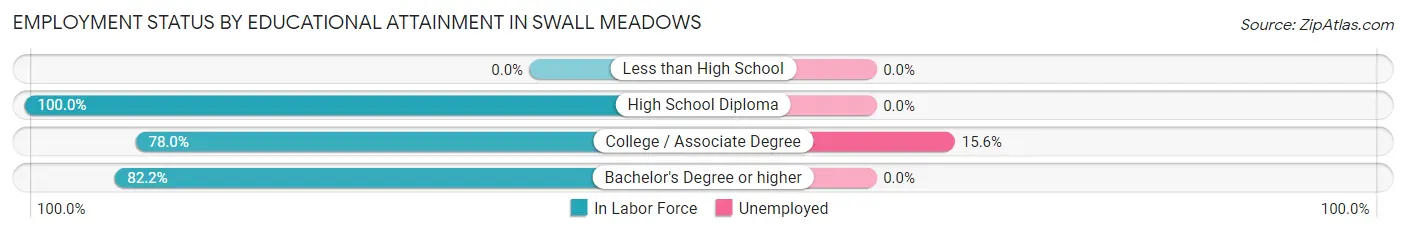
| Educational Attainment | In Labor Force | Unemployed |
| Less than High School | 0 (0.0%) | 0 (0.0%) |
| High School Diploma | 8 (100.0%) | 0 (0.0%) |
| College / Associate Degree | 32 (78.0%) | 6 (15.6%) |
| Bachelor's Degree or higher | 111 (82.2%) | 0 (0.0%) |
| Total | 151 (80.7%) | 6 (3.3%) |
Employment Occupations by Sex in Swall Meadows
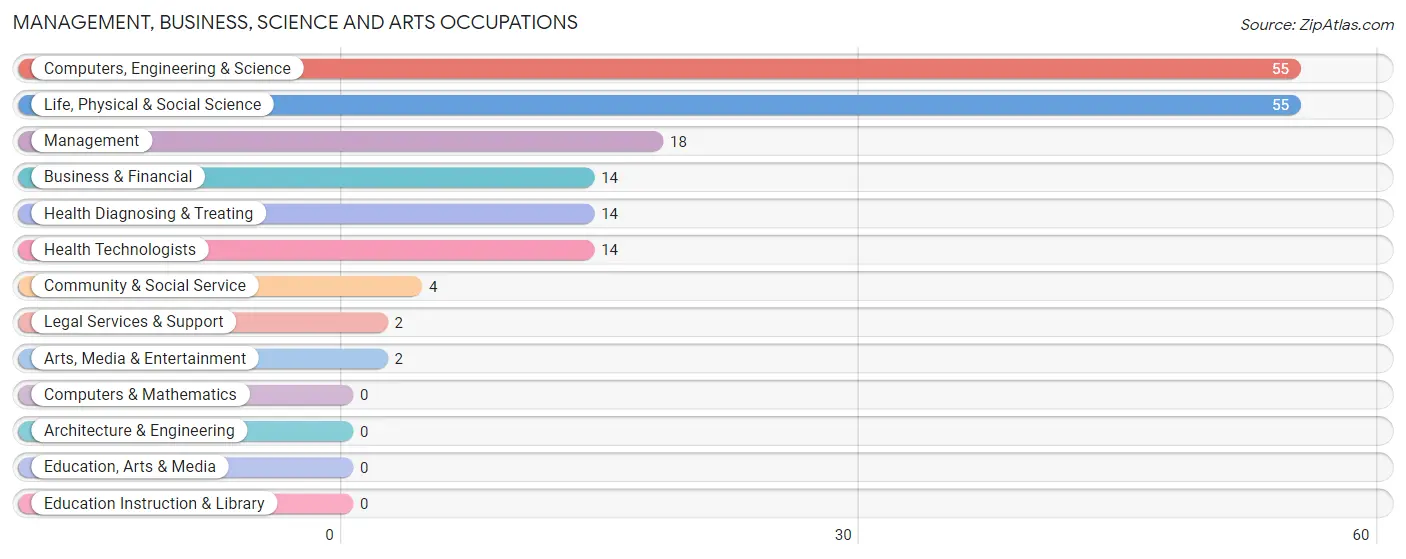
Management, Business, Science and Arts Occupations
The most common Management, Business, Science and Arts occupations in Swall Meadows are Computers, Engineering & Science (55 | 23.3%), Life, Physical & Social Science (55 | 23.3%), Management (18 | 7.6%), Business & Financial (14 | 5.9%), and Health Diagnosing & Treating (14 | 5.9%).
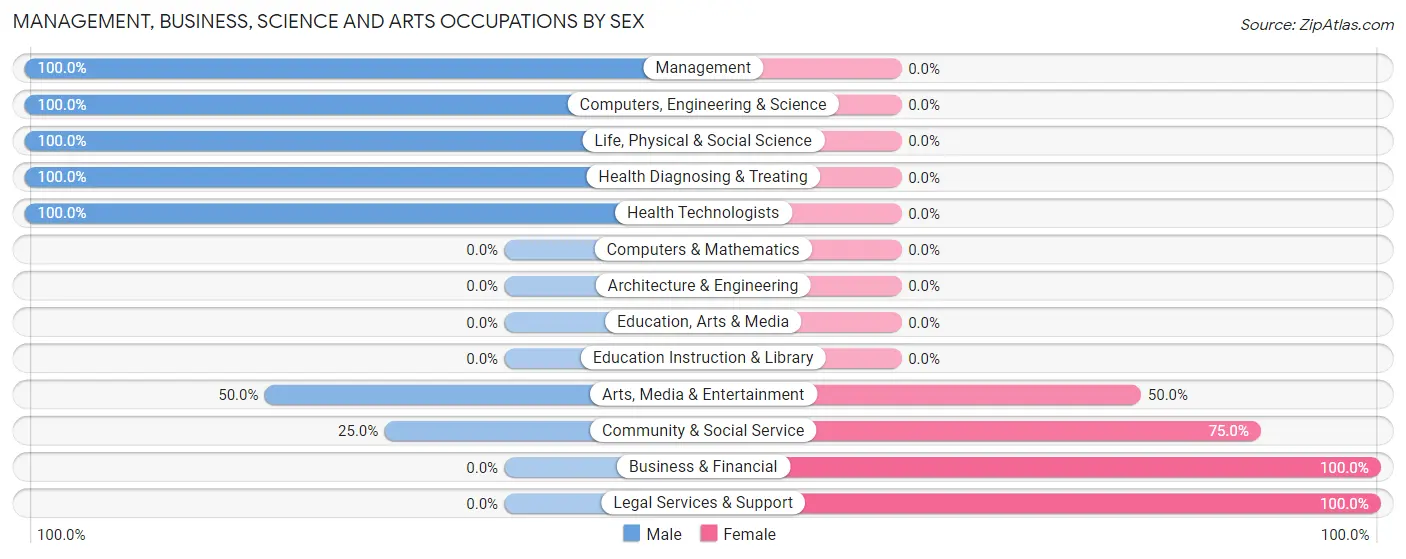
Management, Business, Science and Arts Occupations by Sex
Within the Management, Business, Science and Arts occupations in Swall Meadows, the most male-oriented occupations are Management (100.0%), Computers, Engineering & Science (100.0%), and Life, Physical & Social Science (100.0%), while the most female-oriented occupations are Business & Financial (100.0%), Legal Services & Support (100.0%), and Community & Social Service (75.0%).
| Occupation | Male | Female |
| Management | 18 (100.0%) | 0 (0.0%) |
| Business & Financial | 0 (0.0%) | 14 (100.0%) |
| Computers, Engineering & Science | 55 (100.0%) | 0 (0.0%) |
| Computers & Mathematics | 0 (0.0%) | 0 (0.0%) |
| Architecture & Engineering | 0 (0.0%) | 0 (0.0%) |
| Life, Physical & Social Science | 55 (100.0%) | 0 (0.0%) |
| Community & Social Service | 1 (25.0%) | 3 (75.0%) |
| Education, Arts & Media | 0 (0.0%) | 0 (0.0%) |
| Legal Services & Support | 0 (0.0%) | 2 (100.0%) |
| Education Instruction & Library | 0 (0.0%) | 0 (0.0%) |
| Arts, Media & Entertainment | 1 (50.0%) | 1 (50.0%) |
| Health Diagnosing & Treating | 14 (100.0%) | 0 (0.0%) |
| Health Technologists | 14 (100.0%) | 0 (0.0%) |
| Total (Category) | 88 (83.8%) | 17 (16.2%) |
| Total (Overall) | 191 (80.9%) | 45 (19.1%) |
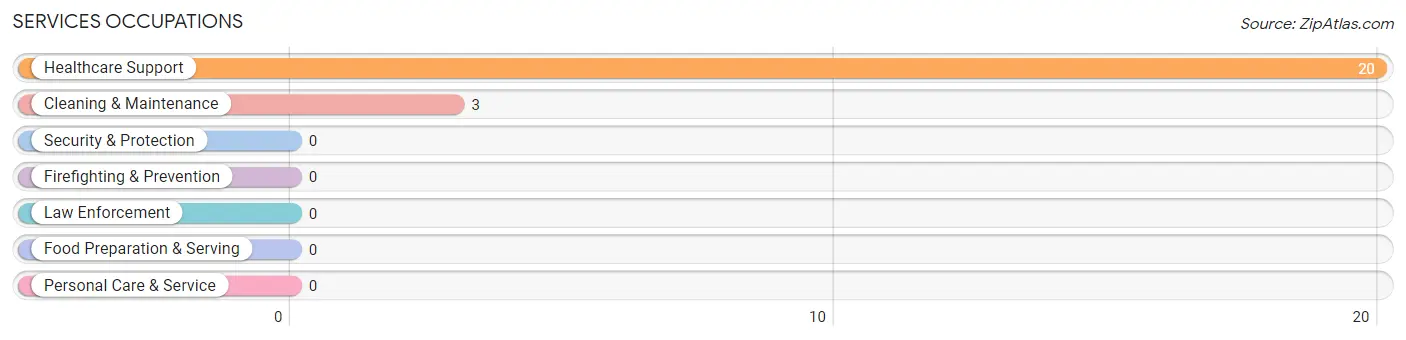
Services Occupations
The most common Services occupations in Swall Meadows are Healthcare Support (20 | 8.5%), and Cleaning & Maintenance (3 | 1.3%).
Services Occupations by Sex
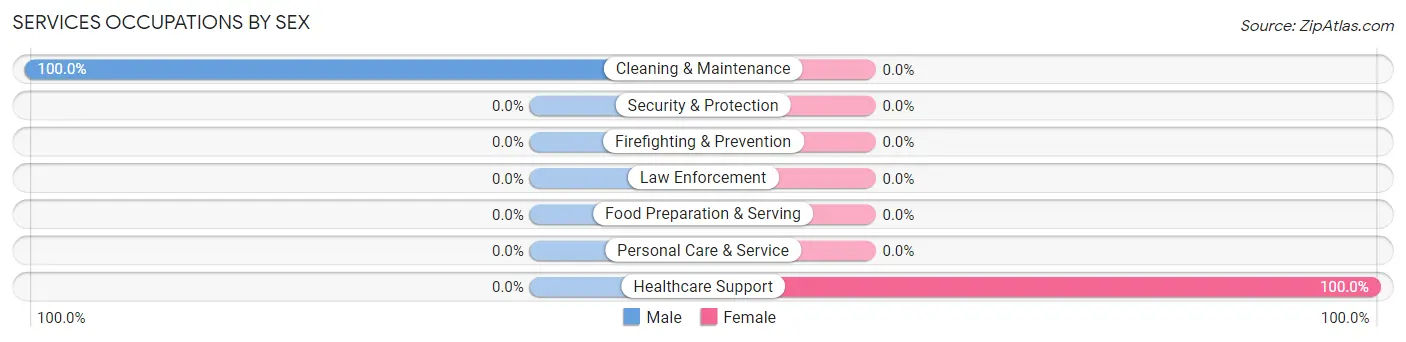
| Occupation | Male | Female |
| Healthcare Support | 0 (0.0%) | 20 (100.0%) |
| Security & Protection | 0 (0.0%) | 0 (0.0%) |
| Firefighting & Prevention | 0 (0.0%) | 0 (0.0%) |
| Law Enforcement | 0 (0.0%) | 0 (0.0%) |
| Food Preparation & Serving | 0 (0.0%) | 0 (0.0%) |
| Cleaning & Maintenance | 3 (100.0%) | 0 (0.0%) |
| Personal Care & Service | 0 (0.0%) | 0 (0.0%) |
| Total (Category) | 3 (13.0%) | 20 (87.0%) |
| Total (Overall) | 191 (80.9%) | 45 (19.1%) |
Sales and Office Occupations
The most common Sales and Office occupations in Swall Meadows are Sales & Related (66 | 28.0%), and Office & Administration (8 | 3.4%).
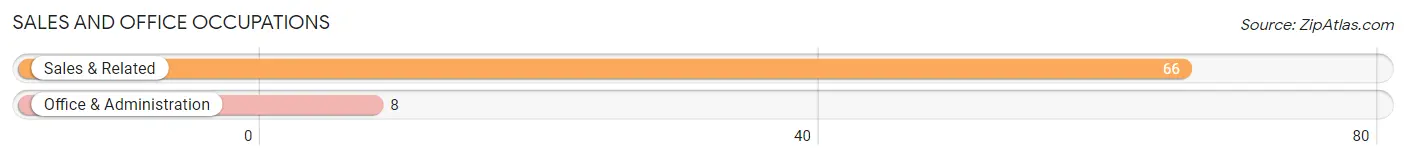
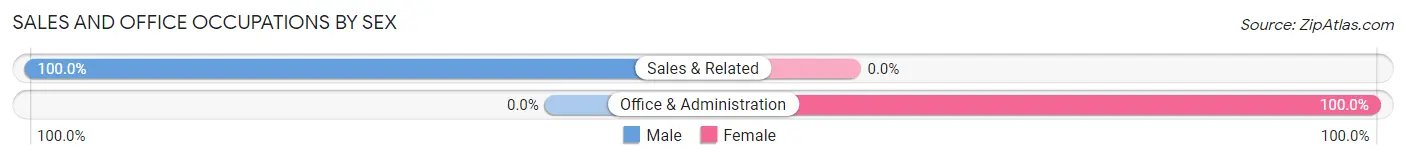
Sales and Office Occupations by Sex
| Occupation | Male | Female |
| Sales & Related | 66 (100.0%) | 0 (0.0%) |
| Office & Administration | 0 (0.0%) | 8 (100.0%) |
| Total (Category) | 66 (89.2%) | 8 (10.8%) |
| Total (Overall) | 191 (80.9%) | 45 (19.1%) |
Natural Resources, Construction and Maintenance Occupations
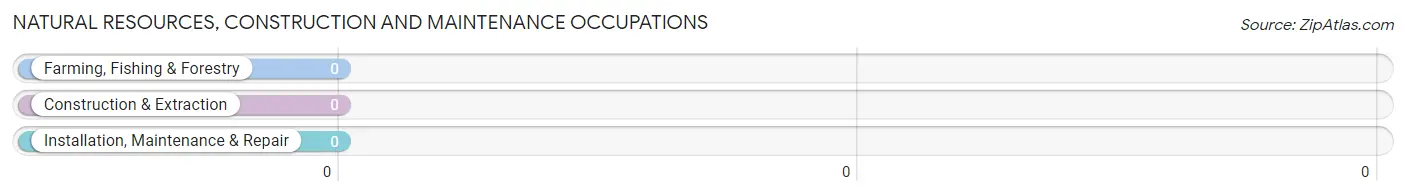
Natural Resources, Construction and Maintenance Occupations by Sex
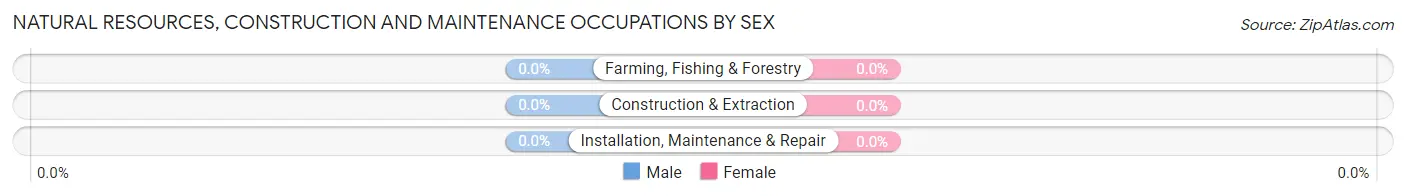
| Occupation | Male | Female |
| Farming, Fishing & Forestry | 0 (0.0%) | 0 (0.0%) |
| Construction & Extraction | 0 (0.0%) | 0 (0.0%) |
| Installation, Maintenance & Repair | 0 (0.0%) | 0 (0.0%) |
| Total (Category) | 0 (0.0%) | 0 (0.0%) |
| Total (Overall) | 191 (80.9%) | 45 (19.1%) |
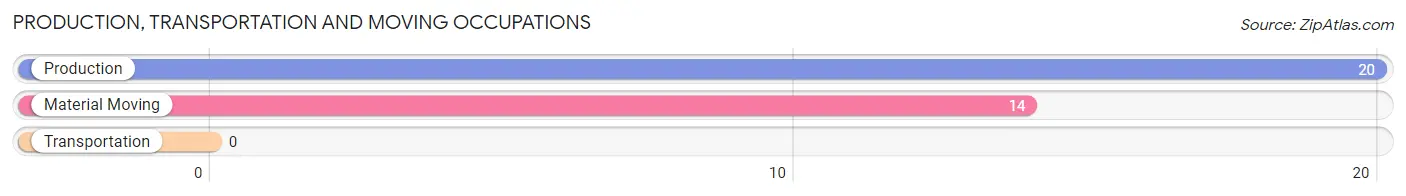
Production, Transportation and Moving Occupations
The most common Production, Transportation and Moving occupations in Swall Meadows are Production (20 | 8.5%), and Material Moving (14 | 5.9%).
Production, Transportation and Moving Occupations by Sex
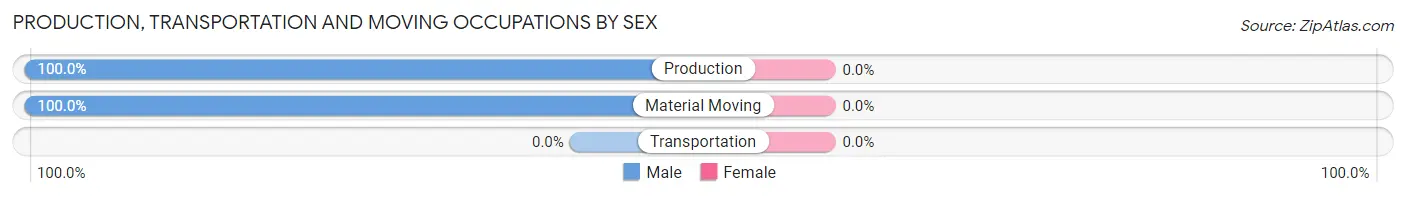
| Occupation | Male | Female |
| Production | 20 (100.0%) | 0 (0.0%) |
| Transportation | 0 (0.0%) | 0 (0.0%) |
| Material Moving | 14 (100.0%) | 0 (0.0%) |
| Total (Category) | 34 (100.0%) | 0 (0.0%) |
| Total (Overall) | 191 (80.9%) | 45 (19.1%) |
Employment Industries by Sex in Swall Meadows
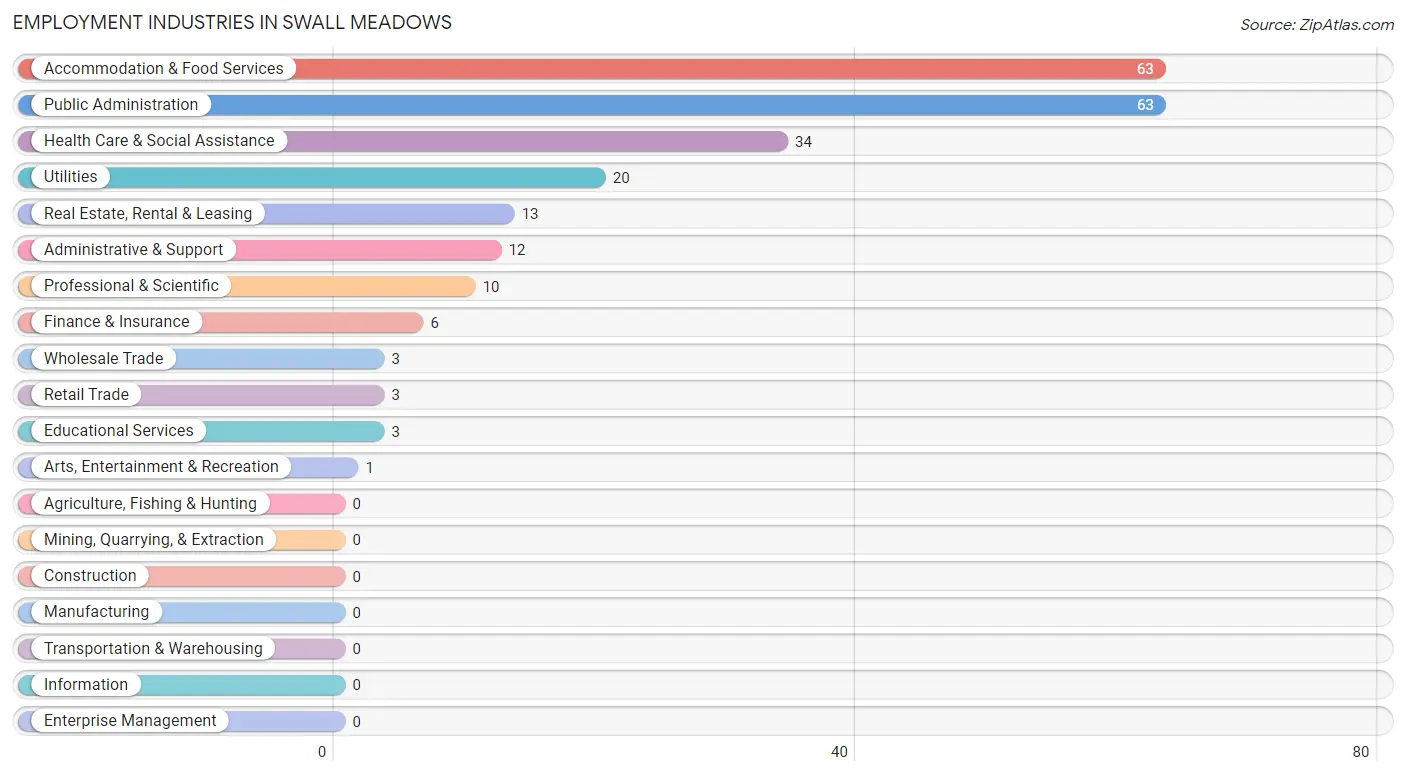
Employment Industries in Swall Meadows
The major employment industries in Swall Meadows include Accommodation & Food Services (63 | 26.7%), Public Administration (63 | 26.7%), Health Care & Social Assistance (34 | 14.4%), Utilities (20 | 8.5%), and Real Estate, Rental & Leasing (13 | 5.5%).
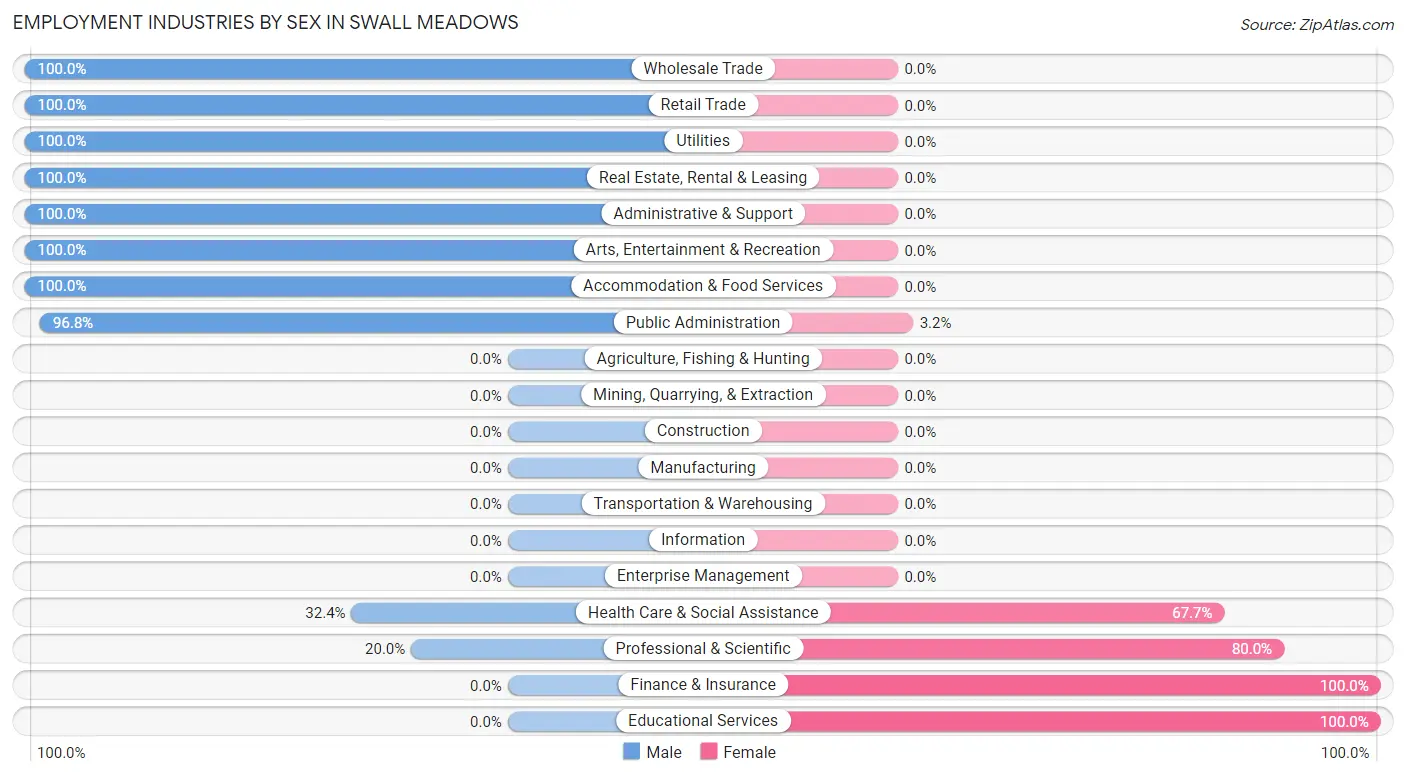
Employment Industries by Sex in Swall Meadows
The Swall Meadows industries that see more men than women are Wholesale Trade (100.0%), Retail Trade (100.0%), and Utilities (100.0%), whereas the industries that tend to have a higher number of women are Finance & Insurance (100.0%), Educational Services (100.0%), and Professional & Scientific (80.0%).
| Industry | Male | Female |
| Agriculture, Fishing & Hunting | 0 (0.0%) | 0 (0.0%) |
| Mining, Quarrying, & Extraction | 0 (0.0%) | 0 (0.0%) |
| Construction | 0 (0.0%) | 0 (0.0%) |
| Manufacturing | 0 (0.0%) | 0 (0.0%) |
| Wholesale Trade | 3 (100.0%) | 0 (0.0%) |
| Retail Trade | 3 (100.0%) | 0 (0.0%) |
| Transportation & Warehousing | 0 (0.0%) | 0 (0.0%) |
| Utilities | 20 (100.0%) | 0 (0.0%) |
| Information | 0 (0.0%) | 0 (0.0%) |
| Finance & Insurance | 0 (0.0%) | 6 (100.0%) |
| Real Estate, Rental & Leasing | 13 (100.0%) | 0 (0.0%) |
| Professional & Scientific | 2 (20.0%) | 8 (80.0%) |
| Enterprise Management | 0 (0.0%) | 0 (0.0%) |
| Administrative & Support | 12 (100.0%) | 0 (0.0%) |
| Educational Services | 0 (0.0%) | 3 (100.0%) |
| Health Care & Social Assistance | 11 (32.4%) | 23 (67.6%) |
| Arts, Entertainment & Recreation | 1 (100.0%) | 0 (0.0%) |
| Accommodation & Food Services | 63 (100.0%) | 0 (0.0%) |
| Public Administration | 61 (96.8%) | 2 (3.2%) |
| Total | 191 (80.9%) | 45 (19.1%) |
Education in Swall Meadows
School Enrollment in Swall Meadows
| School Level | # Students | % Students |
| Nursery / Preschool | 0 | 0.0% |
| Kindergarten | 0 | 0.0% |
| Elementary School | 0 | 0.0% |
| Middle School | 0 | 0.0% |
| High School | 0 | 0.0% |
| College / Undergraduate | 0 | 0.0% |
| Graduate / Professional | 0 | 0.0% |
| Total | 0 | 0.0% |
School Enrollment by Age by Funding Source in Swall Meadows
| Age Bracket | Public School | Private School |
| 3 to 4 Year Olds | 0 (0.0%) | 0 (0.0%) |
| 5 to 9 Year Old | 0 (0.0%) | 0 (0.0%) |
| 10 to 14 Year Olds | 0 (0.0%) | 0 (0.0%) |
| 15 to 17 Year Olds | 0 (0.0%) | 0 (0.0%) |
| 18 to 19 Year Olds | 0 (0.0%) | 0 (0.0%) |
| 20 to 24 Year Olds | 0 (0.0%) | 0 (0.0%) |
| 25 to 34 Year Olds | 0 (0.0%) | 0 (0.0%) |
| 35 Years and over | 0 (0.0%) | 0 (0.0%) |
| Total | 0 (0.0%) | 0 (0.0%) |
Educational Attainment by Field of Study in Swall Meadows
Bio, nature & agricultural (94 | 46.3%), education (28 | 13.8%), social sciences (19 | 9.4%), liberal arts & history (13 | 6.4%), and literature & languages (12 | 5.9%) are the most common fields of study among 203 individuals in Swall Meadows who have obtained a bachelor's degree or higher.
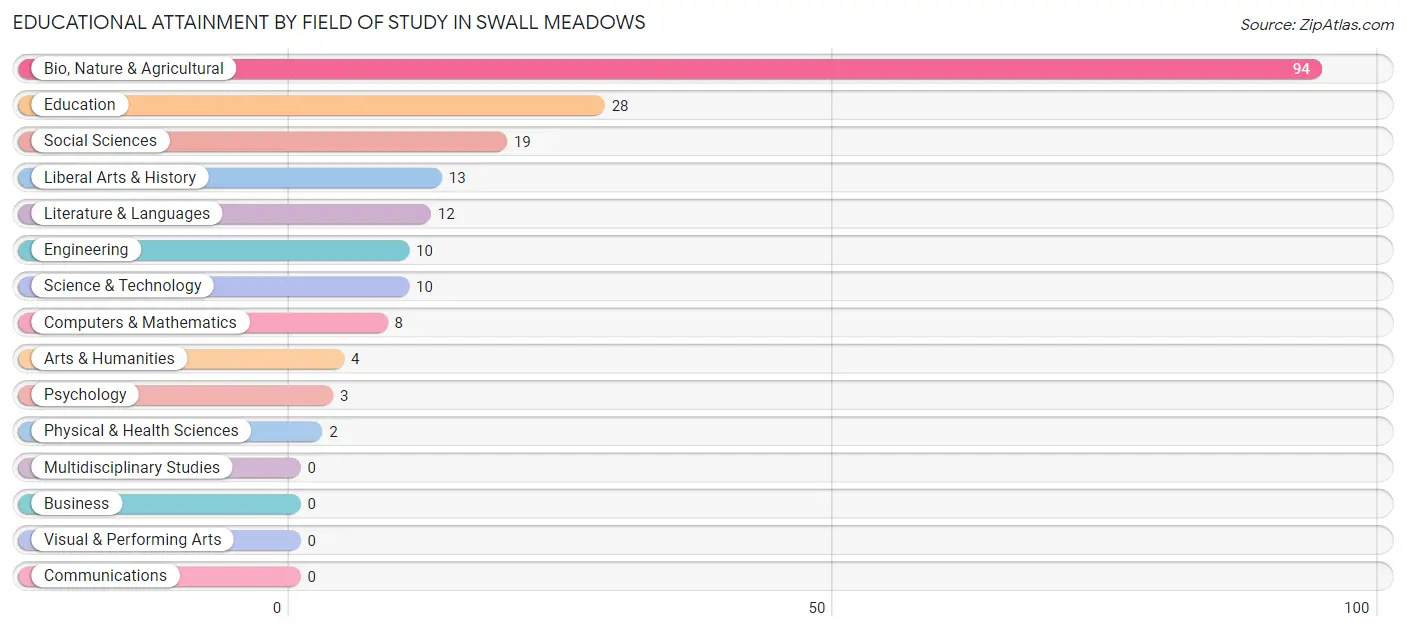
| Field of Study | # Graduates | % Graduates |
| Computers & Mathematics | 8 | 3.9% |
| Bio, Nature & Agricultural | 94 | 46.3% |
| Physical & Health Sciences | 2 | 1.0% |
| Psychology | 3 | 1.5% |
| Social Sciences | 19 | 9.4% |
| Engineering | 10 | 4.9% |
| Multidisciplinary Studies | 0 | 0.0% |
| Science & Technology | 10 | 4.9% |
| Business | 0 | 0.0% |
| Education | 28 | 13.8% |
| Literature & Languages | 12 | 5.9% |
| Liberal Arts & History | 13 | 6.4% |
| Visual & Performing Arts | 0 | 0.0% |
| Communications | 0 | 0.0% |
| Arts & Humanities | 4 | 2.0% |
| Total | 203 | 100.0% |
Transportation & Commute in Swall Meadows
Vehicle Availability by Sex in Swall Meadows
The most prevalent vehicle ownership categories in Swall Meadows are males with 5 or more vehicles (115, accounting for 60.2%) and females with 5 or more vehicles (4, making up 255.6%).
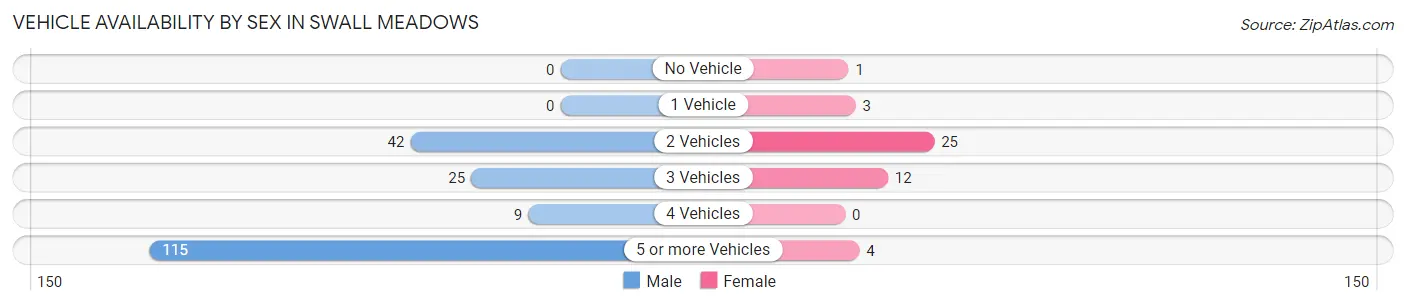
| Vehicles Available | Male | Female |
| No Vehicle | 0 (0.0%) | 1 (2.2%) |
| 1 Vehicle | 0 (0.0%) | 3 (6.7%) |
| 2 Vehicles | 42 (22.0%) | 25 (55.6%) |
| 3 Vehicles | 25 (13.1%) | 12 (26.7%) |
| 4 Vehicles | 9 (4.7%) | 0 (0.0%) |
| 5 or more Vehicles | 115 (60.2%) | 4 (8.9%) |
| Total | 191 (100.0%) | 45 (100.0%) |
Commute Time in Swall Meadows
The most frequently occuring commute durations in Swall Meadows are 30 to 34 minutes (150 commuters, 73.5%), 25 to 29 minutes (34 commuters, 16.7%), and 20 to 24 minutes (9 commuters, 4.4%).
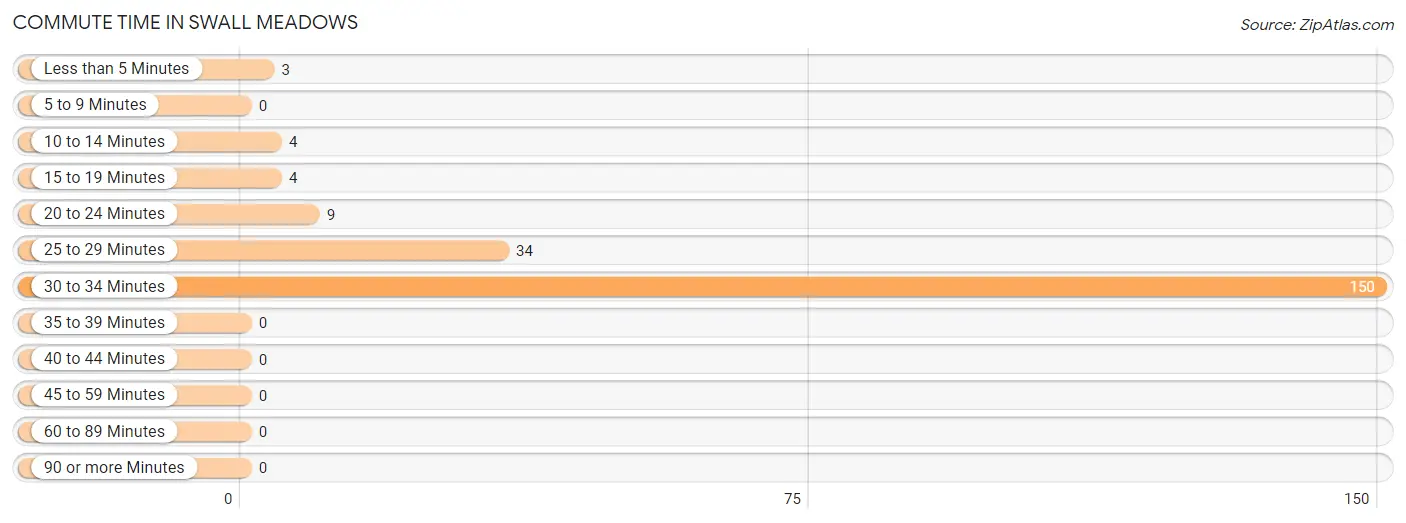
| Commute Time | # Commuters | % Commuters |
| Less than 5 Minutes | 3 | 1.5% |
| 5 to 9 Minutes | 0 | 0.0% |
| 10 to 14 Minutes | 4 | 2.0% |
| 15 to 19 Minutes | 4 | 2.0% |
| 20 to 24 Minutes | 9 | 4.4% |
| 25 to 29 Minutes | 34 | 16.7% |
| 30 to 34 Minutes | 150 | 73.5% |
| 35 to 39 Minutes | 0 | 0.0% |
| 40 to 44 Minutes | 0 | 0.0% |
| 45 to 59 Minutes | 0 | 0.0% |
| 60 to 89 Minutes | 0 | 0.0% |
| 90 or more Minutes | 0 | 0.0% |
Commute Time by Sex in Swall Meadows
The most common commute times in Swall Meadows are 30 to 34 minutes (123 commuters, 72.4%) for males and 30 to 34 minutes (27 commuters, 79.4%) for females.
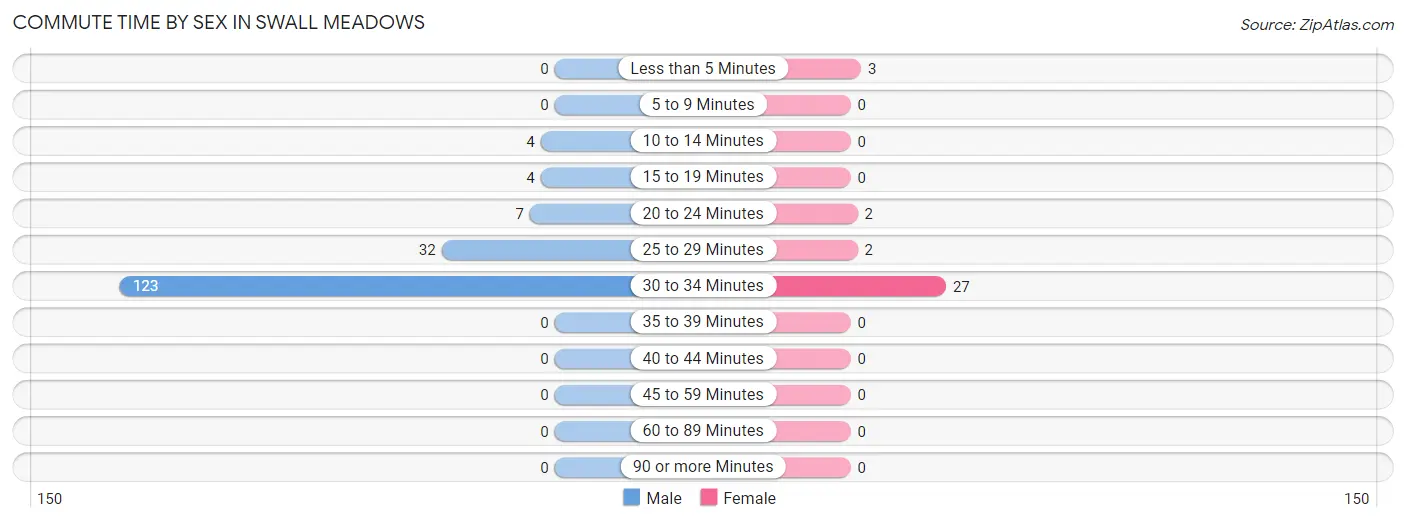
| Commute Time | Male | Female |
| Less than 5 Minutes | 0 (0.0%) | 3 (8.8%) |
| 5 to 9 Minutes | 0 (0.0%) | 0 (0.0%) |
| 10 to 14 Minutes | 4 (2.4%) | 0 (0.0%) |
| 15 to 19 Minutes | 4 (2.4%) | 0 (0.0%) |
| 20 to 24 Minutes | 7 (4.1%) | 2 (5.9%) |
| 25 to 29 Minutes | 32 (18.8%) | 2 (5.9%) |
| 30 to 34 Minutes | 123 (72.4%) | 27 (79.4%) |
| 35 to 39 Minutes | 0 (0.0%) | 0 (0.0%) |
| 40 to 44 Minutes | 0 (0.0%) | 0 (0.0%) |
| 45 to 59 Minutes | 0 (0.0%) | 0 (0.0%) |
| 60 to 89 Minutes | 0 (0.0%) | 0 (0.0%) |
| 90 or more Minutes | 0 (0.0%) | 0 (0.0%) |
Time of Departure to Work by Sex in Swall Meadows
The most frequent times of departure to work in Swall Meadows are 12:00 PM to 3:59 PM (63, 37.1%) for males and 5:30 AM to 5:59 AM (15, 44.1%) for females.
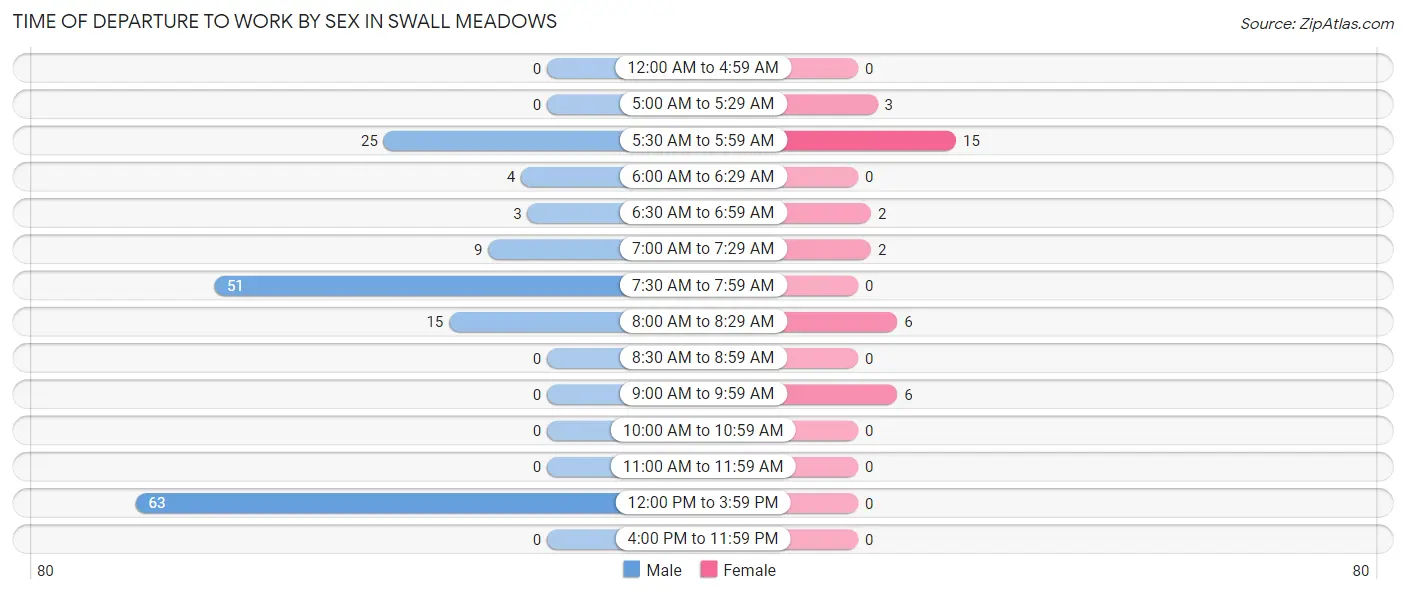
| Time of Departure | Male | Female |
| 12:00 AM to 4:59 AM | 0 (0.0%) | 0 (0.0%) |
| 5:00 AM to 5:29 AM | 0 (0.0%) | 3 (8.8%) |
| 5:30 AM to 5:59 AM | 25 (14.7%) | 15 (44.1%) |
| 6:00 AM to 6:29 AM | 4 (2.4%) | 0 (0.0%) |
| 6:30 AM to 6:59 AM | 3 (1.8%) | 2 (5.9%) |
| 7:00 AM to 7:29 AM | 9 (5.3%) | 2 (5.9%) |
| 7:30 AM to 7:59 AM | 51 (30.0%) | 0 (0.0%) |
| 8:00 AM to 8:29 AM | 15 (8.8%) | 6 (17.6%) |
| 8:30 AM to 8:59 AM | 0 (0.0%) | 0 (0.0%) |
| 9:00 AM to 9:59 AM | 0 (0.0%) | 6 (17.6%) |
| 10:00 AM to 10:59 AM | 0 (0.0%) | 0 (0.0%) |
| 11:00 AM to 11:59 AM | 0 (0.0%) | 0 (0.0%) |
| 12:00 PM to 3:59 PM | 63 (37.1%) | 0 (0.0%) |
| 4:00 PM to 11:59 PM | 0 (0.0%) | 0 (0.0%) |
| Total | 170 (100.0%) | 34 (100.0%) |
Housing Occupancy in Swall Meadows
Occupancy by Ownership in Swall Meadows
Of the total 162 dwellings in Swall Meadows, owner-occupied units account for 162 (100.0%), while renter-occupied units make up 0 (0.0%).
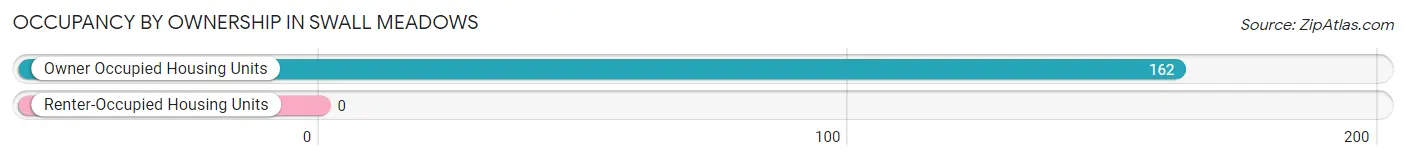
| Occupancy | # Housing Units | % Housing Units |
| Owner Occupied Housing Units | 162 | 100.0% |
| Renter-Occupied Housing Units | 0 | 0.0% |
| Total Occupied Housing Units | 162 | 100.0% |
Occupancy by Household Size in Swall Meadows
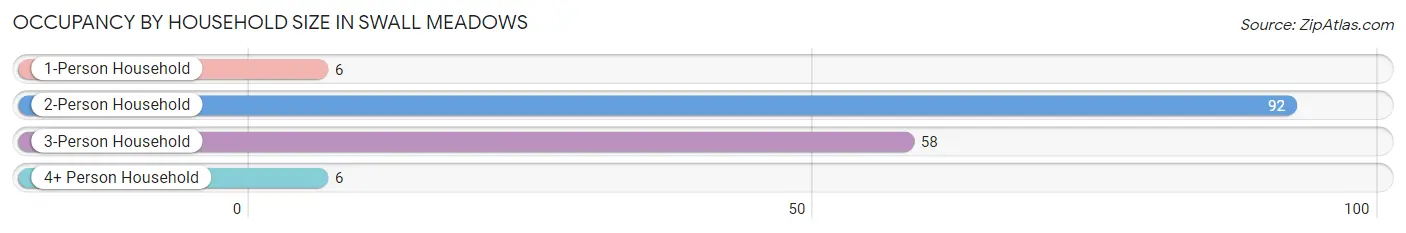
| Household Size | # Housing Units | % Housing Units |
| 1-Person Household | 6 | 3.7% |
| 2-Person Household | 92 | 56.8% |
| 3-Person Household | 58 | 35.8% |
| 4+ Person Household | 6 | 3.7% |
| Total Housing Units | 162 | 100.0% |
Occupancy by Ownership by Household Size in Swall Meadows
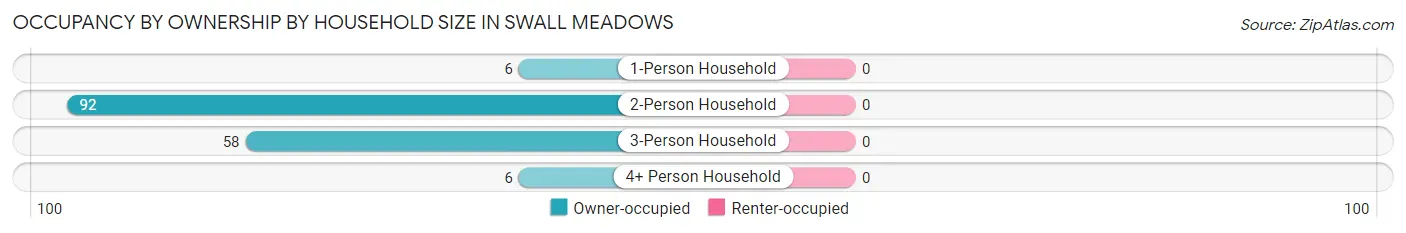
| Household Size | Owner-occupied | Renter-occupied |
| 1-Person Household | 6 (100.0%) | 0 (0.0%) |
| 2-Person Household | 92 (100.0%) | 0 (0.0%) |
| 3-Person Household | 58 (100.0%) | 0 (0.0%) |
| 4+ Person Household | 6 (100.0%) | 0 (0.0%) |
| Total Housing Units | 162 (100.0%) | 0 (0.0%) |
Occupancy by Educational Attainment in Swall Meadows
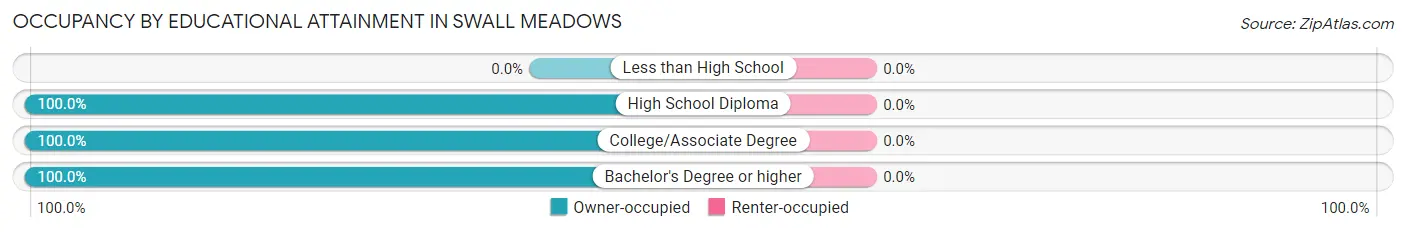
| Household Size | Owner-occupied | Renter-occupied |
| Less than High School | 0 (0.0%) | 0 (0.0%) |
| High School Diploma | 5 (100.0%) | 0 (0.0%) |
| College/Associate Degree | 26 (100.0%) | 0 (0.0%) |
| Bachelor's Degree or higher | 131 (100.0%) | 0 (0.0%) |
Occupancy by Age of Householder in Swall Meadows
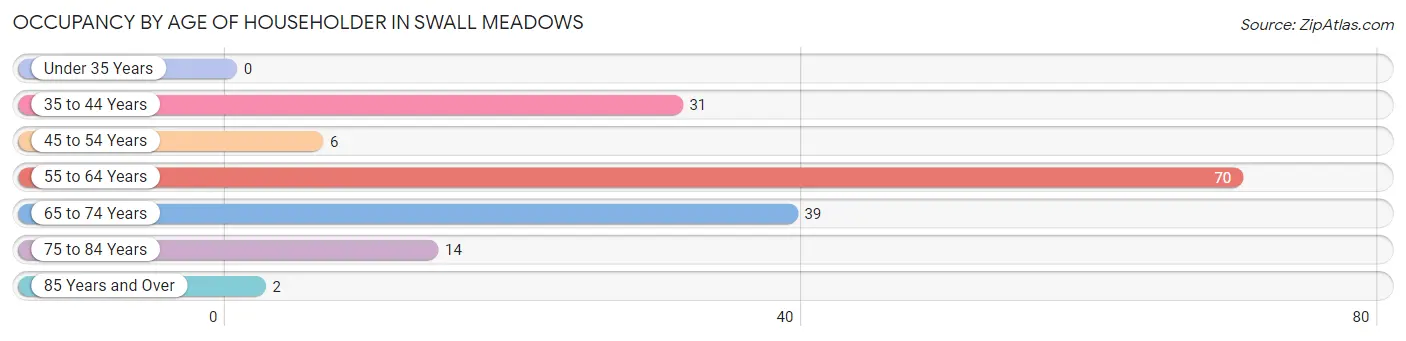
| Age Bracket | # Households | % Households |
| Under 35 Years | 0 | 0.0% |
| 35 to 44 Years | 31 | 19.1% |
| 45 to 54 Years | 6 | 3.7% |
| 55 to 64 Years | 70 | 43.2% |
| 65 to 74 Years | 39 | 24.1% |
| 75 to 84 Years | 14 | 8.6% |
| 85 Years and Over | 2 | 1.2% |
| Total | 162 | 100.0% |
Housing Finances in Swall Meadows
Median Income by Occupancy in Swall Meadows
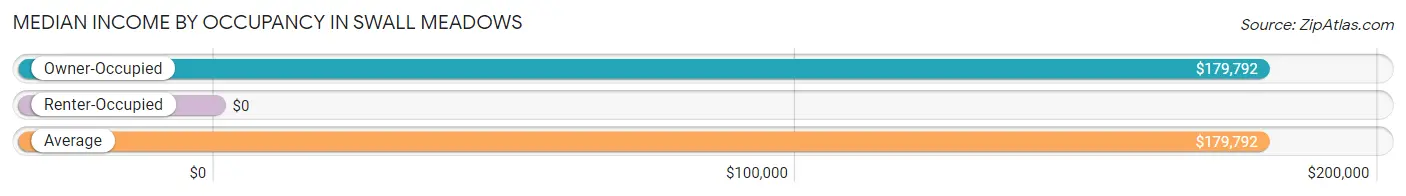
| Occupancy Type | # Households | Median Income |
| Owner-Occupied | 162 (100.0%) | $179,792 |
| Renter-Occupied | 0 (0.0%) | $0 |
| Average | 162 (100.0%) | $179,792 |
Occupancy by Householder Income Bracket in Swall Meadows
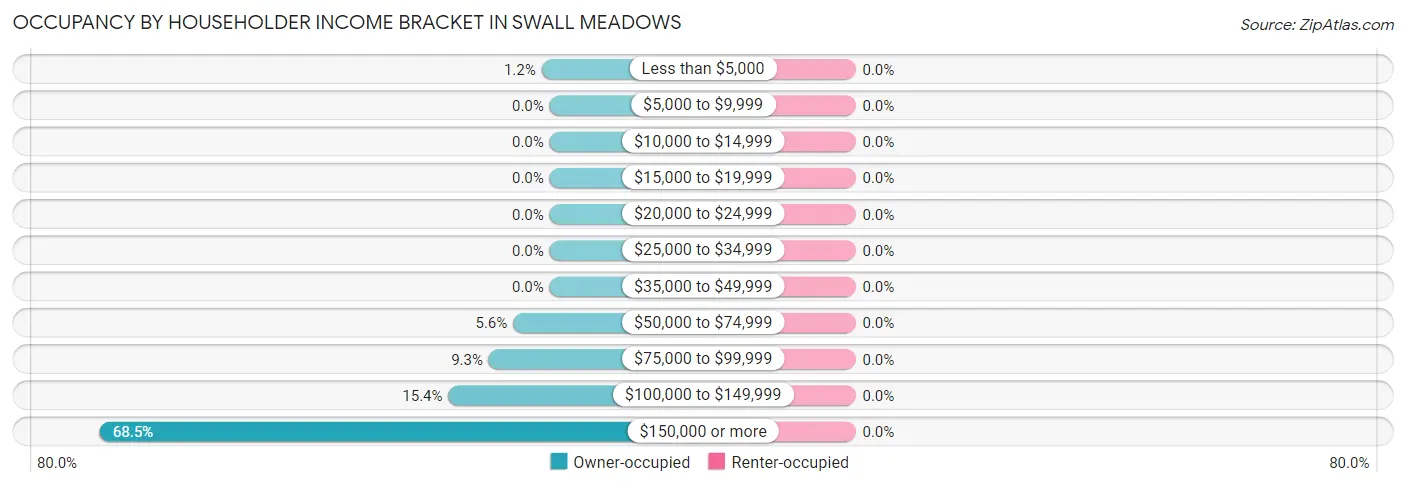
| Income Bracket | Owner-occupied | Renter-occupied |
| Less than $5,000 | 2 (1.2%) | 0 (0.0%) |
| $5,000 to $9,999 | 0 (0.0%) | 0 (0.0%) |
| $10,000 to $14,999 | 0 (0.0%) | 0 (0.0%) |
| $15,000 to $19,999 | 0 (0.0%) | 0 (0.0%) |
| $20,000 to $24,999 | 0 (0.0%) | 0 (0.0%) |
| $25,000 to $34,999 | 0 (0.0%) | 0 (0.0%) |
| $35,000 to $49,999 | 0 (0.0%) | 0 (0.0%) |
| $50,000 to $74,999 | 9 (5.6%) | 0 (0.0%) |
| $75,000 to $99,999 | 15 (9.3%) | 0 (0.0%) |
| $100,000 to $149,999 | 25 (15.4%) | 0 (0.0%) |
| $150,000 or more | 111 (68.5%) | 0 (0.0%) |
| Total | 162 (100.0%) | 0 (0.0%) |
Monthly Housing Cost Tiers in Swall Meadows
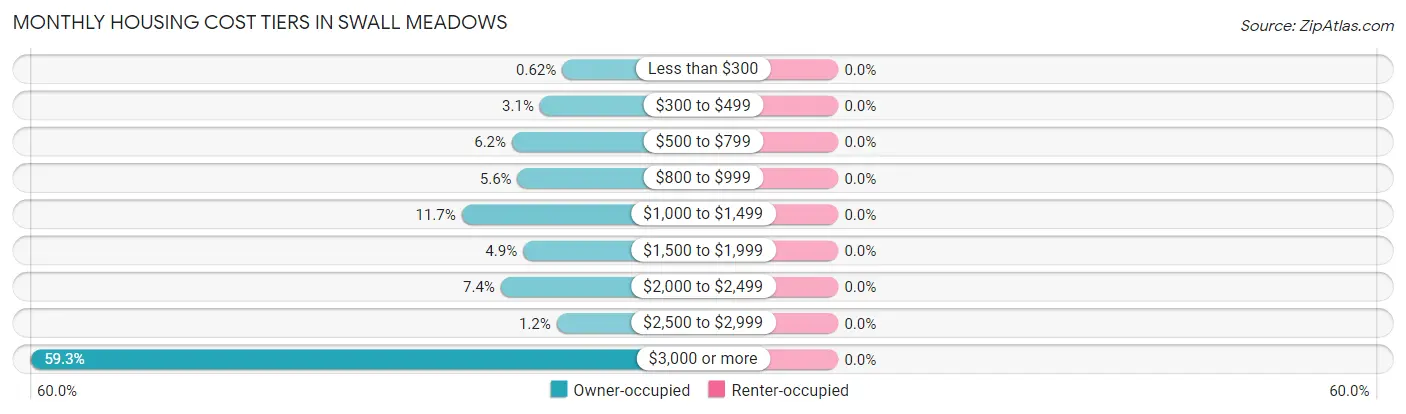
| Monthly Cost | Owner-occupied | Renter-occupied |
| Less than $300 | 1 (0.6%) | 0 (0.0%) |
| $300 to $499 | 5 (3.1%) | 0 (0.0%) |
| $500 to $799 | 10 (6.2%) | 0 (0.0%) |
| $800 to $999 | 9 (5.6%) | 0 (0.0%) |
| $1,000 to $1,499 | 19 (11.7%) | 0 (0.0%) |
| $1,500 to $1,999 | 8 (4.9%) | 0 (0.0%) |
| $2,000 to $2,499 | 12 (7.4%) | 0 (0.0%) |
| $2,500 to $2,999 | 2 (1.2%) | 0 (0.0%) |
| $3,000 or more | 96 (59.3%) | 0 (0.0%) |
| Total | 162 (100.0%) | 0 (0.0%) |
Physical Housing Characteristics in Swall Meadows
Housing Structures in Swall Meadows
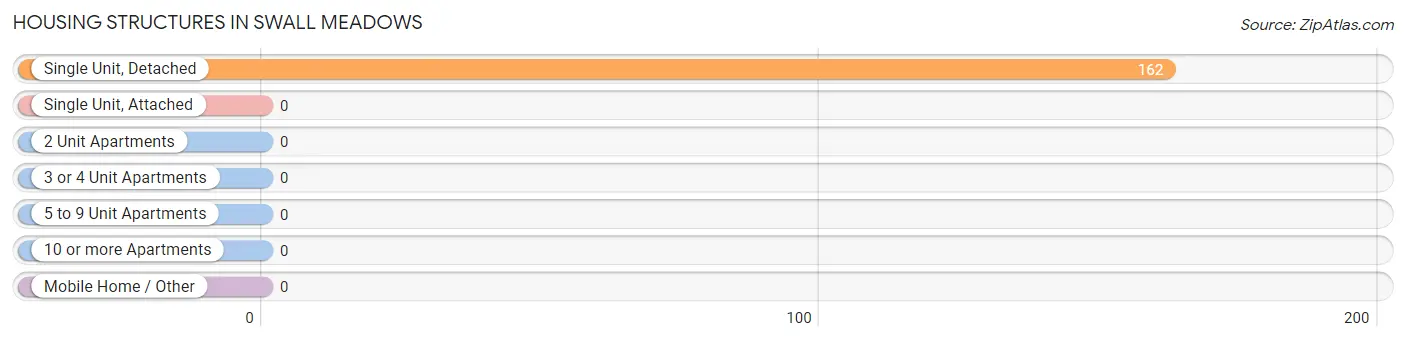
| Structure Type | # Housing Units | % Housing Units |
| Single Unit, Detached | 162 | 100.0% |
| Single Unit, Attached | 0 | 0.0% |
| 2 Unit Apartments | 0 | 0.0% |
| 3 or 4 Unit Apartments | 0 | 0.0% |
| 5 to 9 Unit Apartments | 0 | 0.0% |
| 10 or more Apartments | 0 | 0.0% |
| Mobile Home / Other | 0 | 0.0% |
| Total | 162 | 100.0% |
Housing Structures by Occupancy in Swall Meadows
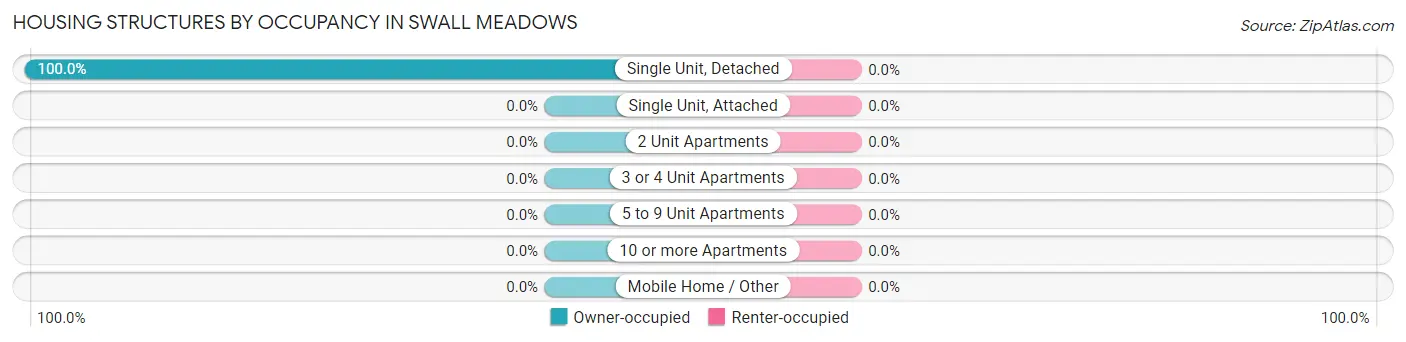
| Structure Type | Owner-occupied | Renter-occupied |
| Single Unit, Detached | 162 (100.0%) | 0 (0.0%) |
| Single Unit, Attached | 0 (0.0%) | 0 (0.0%) |
| 2 Unit Apartments | 0 (0.0%) | 0 (0.0%) |
| 3 or 4 Unit Apartments | 0 (0.0%) | 0 (0.0%) |
| 5 to 9 Unit Apartments | 0 (0.0%) | 0 (0.0%) |
| 10 or more Apartments | 0 (0.0%) | 0 (0.0%) |
| Mobile Home / Other | 0 (0.0%) | 0 (0.0%) |
| Total | 162 (100.0%) | 0 (0.0%) |
Housing Structures by Number of Rooms in Swall Meadows
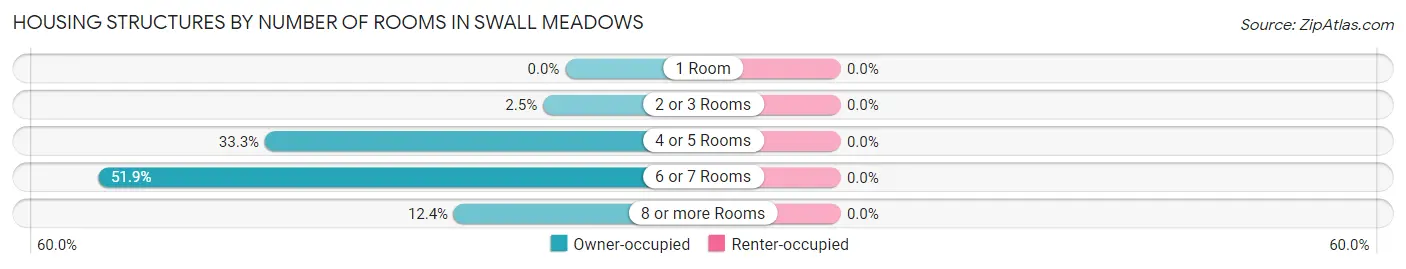
| Number of Rooms | Owner-occupied | Renter-occupied |
| 1 Room | 0 (0.0%) | 0 (0.0%) |
| 2 or 3 Rooms | 4 (2.5%) | 0 (0.0%) |
| 4 or 5 Rooms | 54 (33.3%) | 0 (0.0%) |
| 6 or 7 Rooms | 84 (51.8%) | 0 (0.0%) |
| 8 or more Rooms | 20 (12.3%) | 0 (0.0%) |
| Total | 162 (100.0%) | 0 (0.0%) |
Housing Structure by Heating Type in Swall Meadows
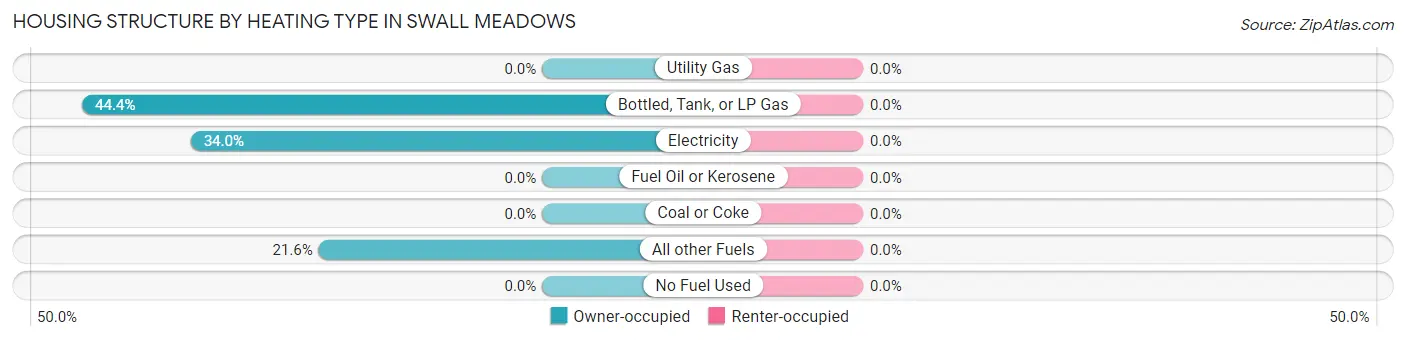
| Heating Type | Owner-occupied | Renter-occupied |
| Utility Gas | 0 (0.0%) | 0 (0.0%) |
| Bottled, Tank, or LP Gas | 72 (44.4%) | 0 (0.0%) |
| Electricity | 55 (34.0%) | 0 (0.0%) |
| Fuel Oil or Kerosene | 0 (0.0%) | 0 (0.0%) |
| Coal or Coke | 0 (0.0%) | 0 (0.0%) |
| All other Fuels | 35 (21.6%) | 0 (0.0%) |
| No Fuel Used | 0 (0.0%) | 0 (0.0%) |
| Total | 162 (100.0%) | 0 (0.0%) |
Household Vehicle Usage in Swall Meadows
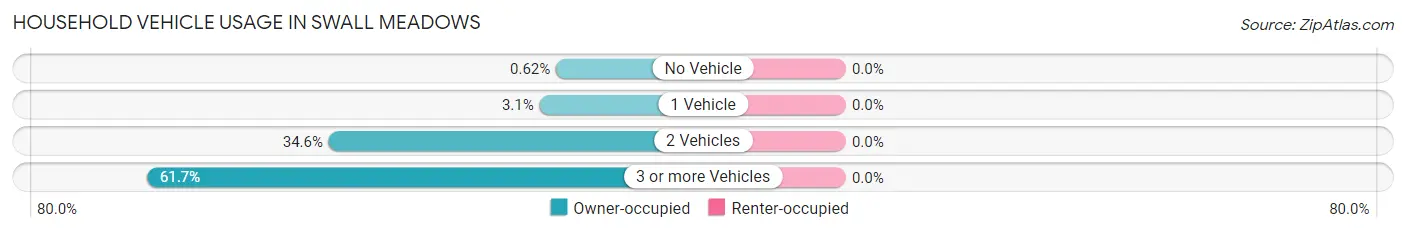
| Vehicles per Household | Owner-occupied | Renter-occupied |
| No Vehicle | 1 (0.6%) | 0 (0.0%) |
| 1 Vehicle | 5 (3.1%) | 0 (0.0%) |
| 2 Vehicles | 56 (34.6%) | 0 (0.0%) |
| 3 or more Vehicles | 100 (61.7%) | 0 (0.0%) |
| Total | 162 (100.0%) | 0 (0.0%) |
Real Estate & Mortgages in Swall Meadows
Real Estate and Mortgage Overview in Swall Meadows
| Characteristic | Without Mortgage | With Mortgage |
| Housing Units | 44 | 118 |
| Median Property Value | $940,500 | $709,700 |
| Median Household Income | $104,444 | $99 |
| Monthly Housing Costs | $957 | $96 |
| Real Estate Taxes | $6,000 | $0 |
Property Value by Mortgage Status in Swall Meadows
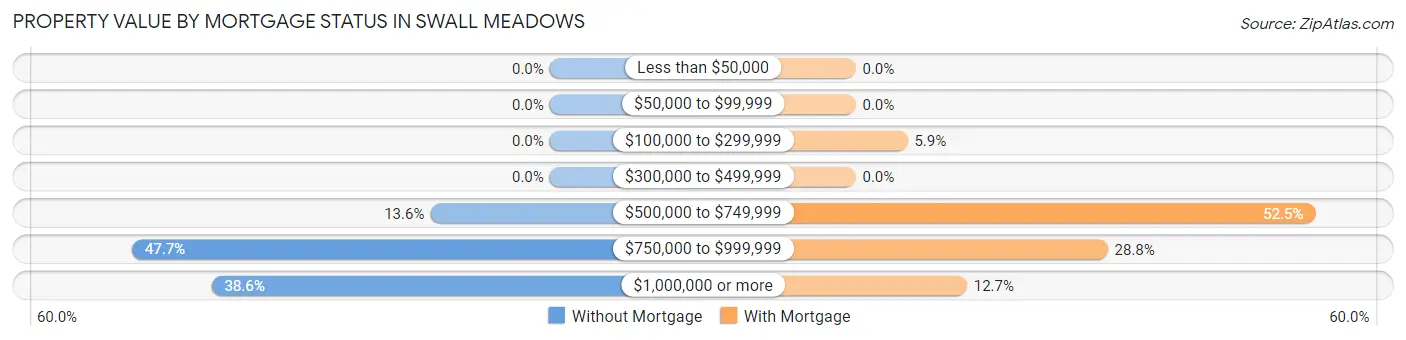
| Property Value | Without Mortgage | With Mortgage |
| Less than $50,000 | 0 (0.0%) | 0 (0.0%) |
| $50,000 to $99,999 | 0 (0.0%) | 0 (0.0%) |
| $100,000 to $299,999 | 0 (0.0%) | 7 (5.9%) |
| $300,000 to $499,999 | 0 (0.0%) | 0 (0.0%) |
| $500,000 to $749,999 | 6 (13.6%) | 62 (52.5%) |
| $750,000 to $999,999 | 21 (47.7%) | 34 (28.8%) |
| $1,000,000 or more | 17 (38.6%) | 15 (12.7%) |
| Total | 44 (100.0%) | 118 (100.0%) |
Household Income by Mortgage Status in Swall Meadows
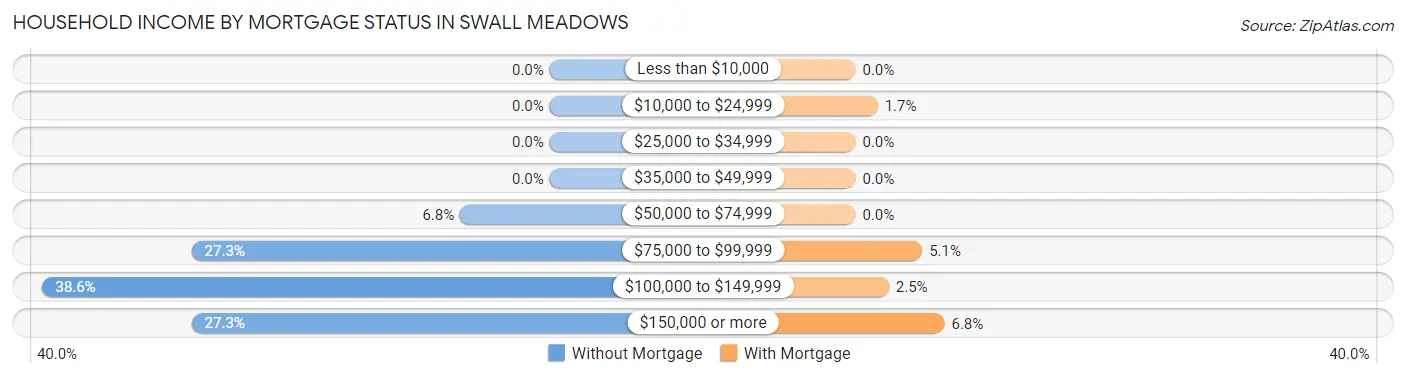
| Household Income | Without Mortgage | With Mortgage |
| Less than $10,000 | 0 (0.0%) | 0 (0.0%) |
| $10,000 to $24,999 | 0 (0.0%) | 2 (1.7%) |
| $25,000 to $34,999 | 0 (0.0%) | 0 (0.0%) |
| $35,000 to $49,999 | 0 (0.0%) | 0 (0.0%) |
| $50,000 to $74,999 | 3 (6.8%) | 0 (0.0%) |
| $75,000 to $99,999 | 12 (27.3%) | 6 (5.1%) |
| $100,000 to $149,999 | 17 (38.6%) | 3 (2.5%) |
| $150,000 or more | 12 (27.3%) | 8 (6.8%) |
| Total | 44 (100.0%) | 118 (100.0%) |
Property Value to Household Income Ratio in Swall Meadows
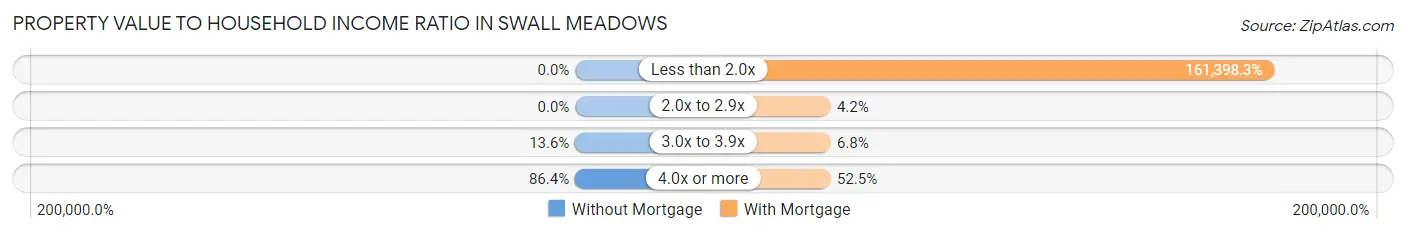
| Value-to-Income Ratio | Without Mortgage | With Mortgage |
| Less than 2.0x | 0 (0.0%) | 190,450 (161,398.3%) |
| 2.0x to 2.9x | 0 (0.0%) | 5 (4.2%) |
| 3.0x to 3.9x | 6 (13.6%) | 8 (6.8%) |
| 4.0x or more | 38 (86.4%) | 62 (52.5%) |
| Total | 44 (100.0%) | 118 (100.0%) |
Real Estate Taxes by Mortgage Status in Swall Meadows
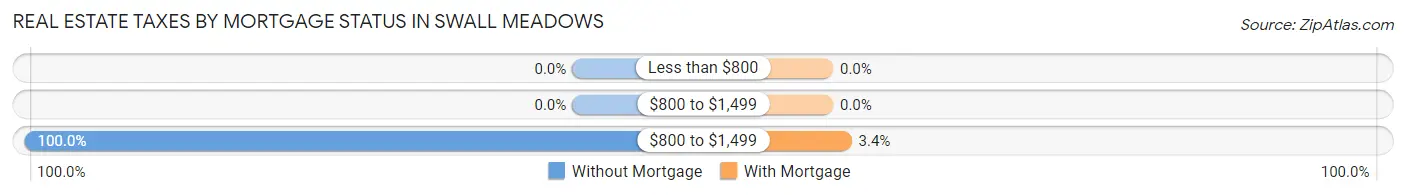
| Property Taxes | Without Mortgage | With Mortgage |
| Less than $800 | 0 (0.0%) | 0 (0.0%) |
| $800 to $1,499 | 0 (0.0%) | 0 (0.0%) |
| $800 to $1,499 | 44 (100.0%) | 4 (3.4%) |
| Total | 44 (100.0%) | 118 (100.0%) |
Health & Disability in Swall Meadows
Health Insurance Coverage by Age in Swall Meadows
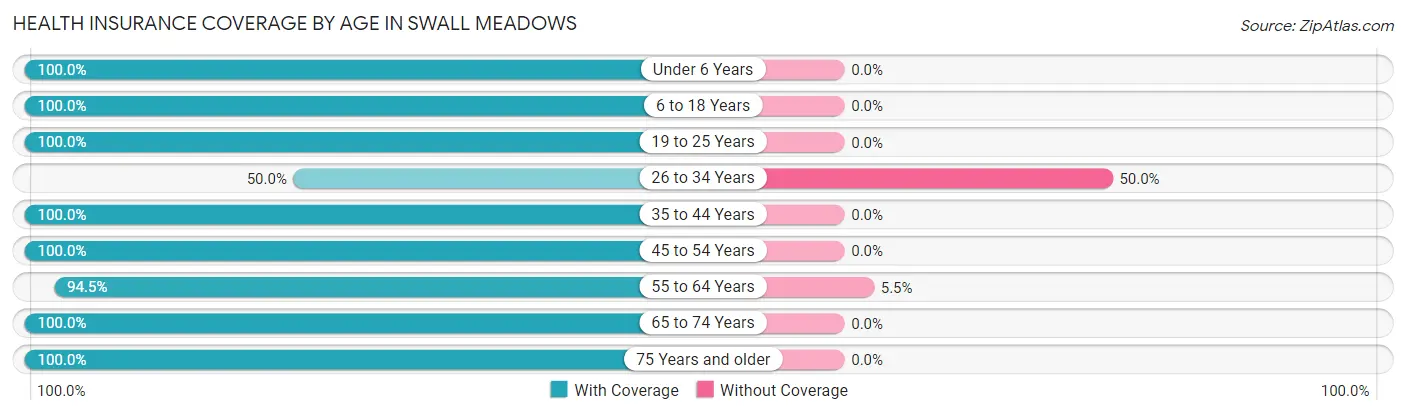
| Age Bracket | With Coverage | Without Coverage |
| Under 6 Years | 16 (100.0%) | 0 (0.0%) |
| 6 to 18 Years | 7 (100.0%) | 0 (0.0%) |
| 19 to 25 Years | 63 (100.0%) | 0 (0.0%) |
| 26 to 34 Years | 3 (50.0%) | 3 (50.0%) |
| 35 to 44 Years | 61 (100.0%) | 0 (0.0%) |
| 45 to 54 Years | 11 (100.0%) | 0 (0.0%) |
| 55 to 64 Years | 103 (94.5%) | 6 (5.5%) |
| 65 to 74 Years | 59 (100.0%) | 0 (0.0%) |
| 75 Years and older | 33 (100.0%) | 0 (0.0%) |
| Total | 356 (97.5%) | 9 (2.5%) |
Health Insurance Coverage by Citizenship Status in Swall Meadows
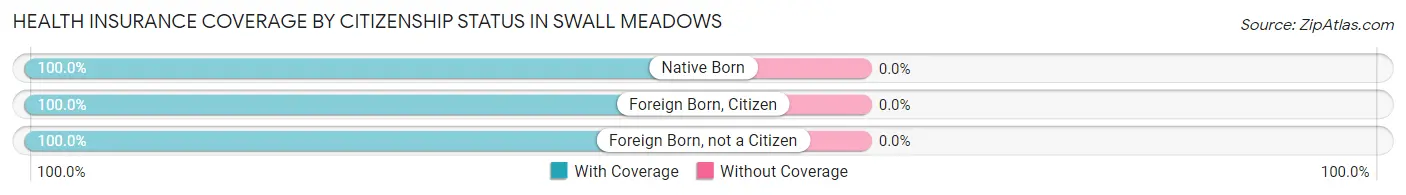
| Citizenship Status | With Coverage | Without Coverage |
| Native Born | 16 (100.0%) | 0 (0.0%) |
| Foreign Born, Citizen | 7 (100.0%) | 0 (0.0%) |
| Foreign Born, not a Citizen | 63 (100.0%) | 0 (0.0%) |
Health Insurance Coverage by Household Income in Swall Meadows
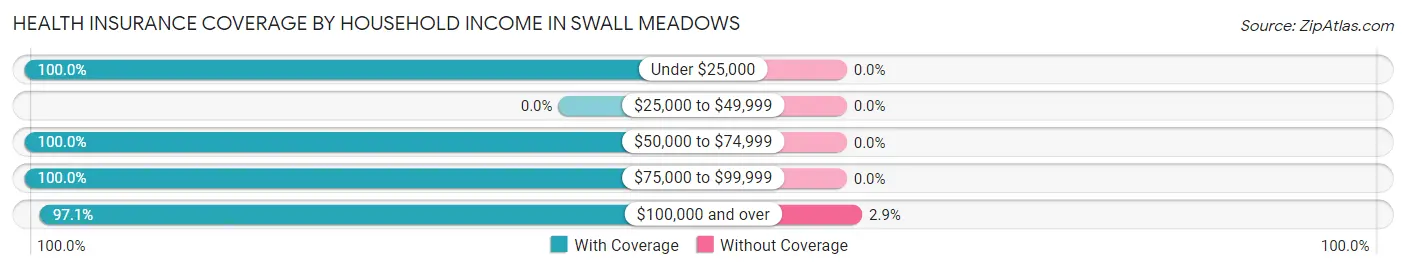
| Household Income | With Coverage | Without Coverage |
| Under $25,000 | 2 (100.0%) | 0 (0.0%) |
| $25,000 to $49,999 | 0 (0.0%) | 0 (0.0%) |
| $50,000 to $74,999 | 18 (100.0%) | 0 (0.0%) |
| $75,000 to $99,999 | 31 (100.0%) | 0 (0.0%) |
| $100,000 and over | 305 (97.1%) | 9 (2.9%) |
Public vs Private Health Insurance Coverage by Age in Swall Meadows
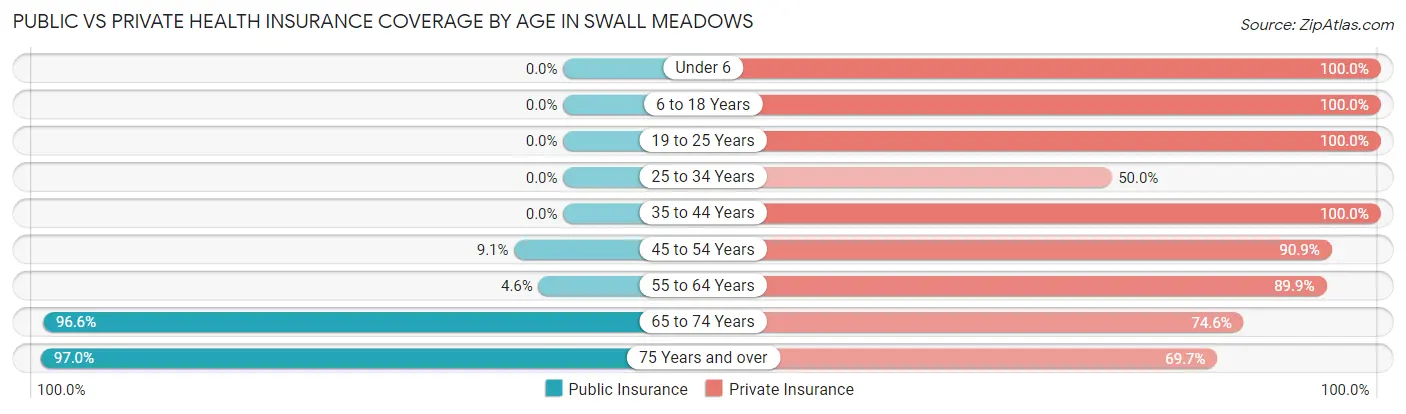
| Age Bracket | Public Insurance | Private Insurance |
| Under 6 | 0 (0.0%) | 16 (100.0%) |
| 6 to 18 Years | 0 (0.0%) | 7 (100.0%) |
| 19 to 25 Years | 0 (0.0%) | 63 (100.0%) |
| 25 to 34 Years | 0 (0.0%) | 3 (50.0%) |
| 35 to 44 Years | 0 (0.0%) | 61 (100.0%) |
| 45 to 54 Years | 1 (9.1%) | 10 (90.9%) |
| 55 to 64 Years | 5 (4.6%) | 98 (89.9%) |
| 65 to 74 Years | 57 (96.6%) | 44 (74.6%) |
| 75 Years and over | 32 (97.0%) | 23 (69.7%) |
| Total | 95 (26.0%) | 325 (89.0%) |
Disability Status by Sex by Age in Swall Meadows
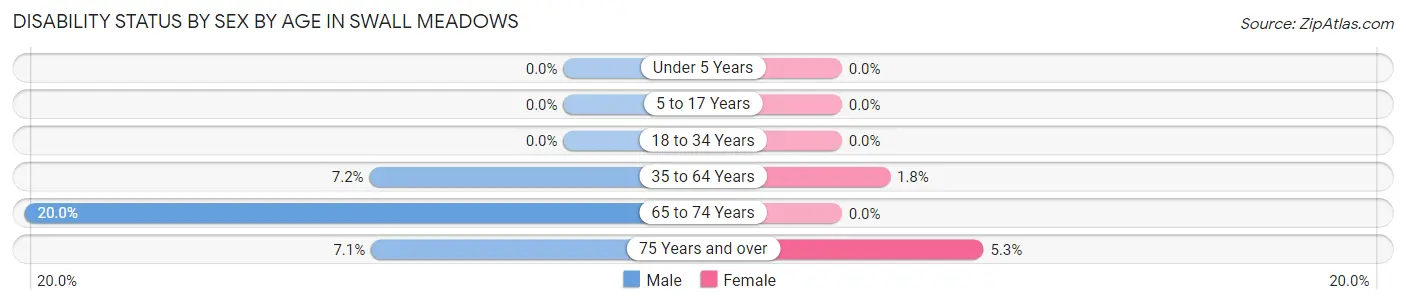
| Age Bracket | Male | Female |
| Under 5 Years | 0 (0.0%) | 0 (0.0%) |
| 5 to 17 Years | 0 (0.0%) | 0 (0.0%) |
| 18 to 34 Years | 0 (0.0%) | 0 (0.0%) |
| 35 to 64 Years | 9 (7.2%) | 1 (1.8%) |
| 65 to 74 Years | 7 (20.0%) | 0 (0.0%) |
| 75 Years and over | 1 (7.1%) | 1 (5.3%) |
Disability Class by Sex by Age in Swall Meadows
Disability Class: Hearing Difficulty
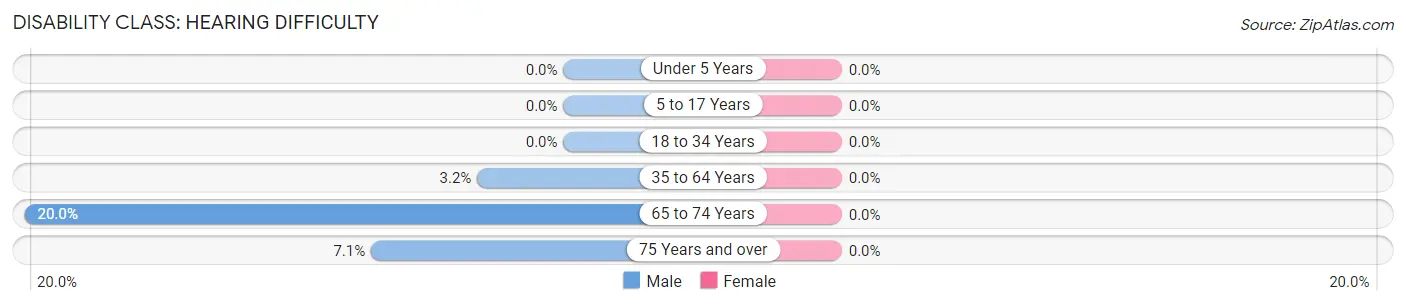
| Age Bracket | Male | Female |
| Under 5 Years | 0 (0.0%) | 0 (0.0%) |
| 5 to 17 Years | 0 (0.0%) | 0 (0.0%) |
| 18 to 34 Years | 0 (0.0%) | 0 (0.0%) |
| 35 to 64 Years | 4 (3.2%) | 0 (0.0%) |
| 65 to 74 Years | 7 (20.0%) | 0 (0.0%) |
| 75 Years and over | 1 (7.1%) | 0 (0.0%) |
Disability Class: Vision Difficulty
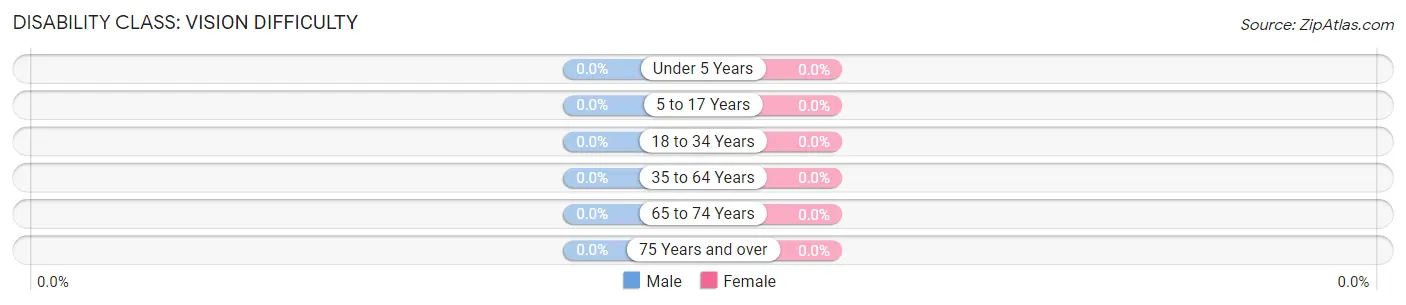
| Age Bracket | Male | Female |
| Under 5 Years | 0 (0.0%) | 0 (0.0%) |
| 5 to 17 Years | 0 (0.0%) | 0 (0.0%) |
| 18 to 34 Years | 0 (0.0%) | 0 (0.0%) |
| 35 to 64 Years | 0 (0.0%) | 0 (0.0%) |
| 65 to 74 Years | 0 (0.0%) | 0 (0.0%) |
| 75 Years and over | 0 (0.0%) | 0 (0.0%) |
Disability Class: Cognitive Difficulty
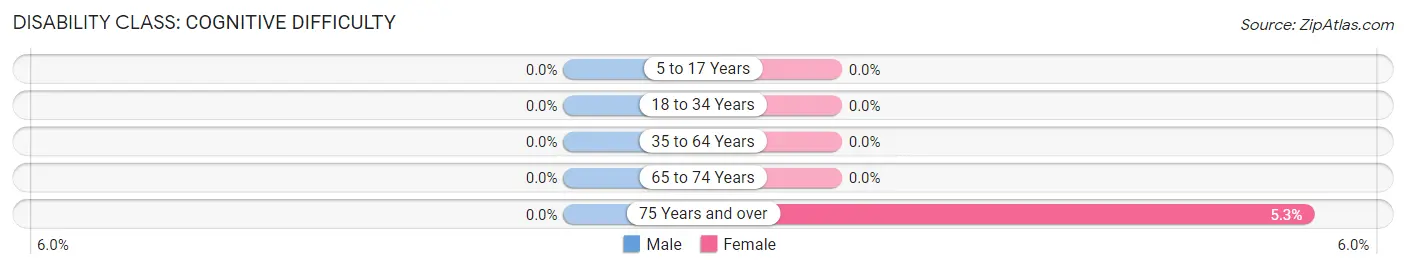
| Age Bracket | Male | Female |
| 5 to 17 Years | 0 (0.0%) | 0 (0.0%) |
| 18 to 34 Years | 0 (0.0%) | 0 (0.0%) |
| 35 to 64 Years | 0 (0.0%) | 0 (0.0%) |
| 65 to 74 Years | 0 (0.0%) | 0 (0.0%) |
| 75 Years and over | 0 (0.0%) | 1 (5.3%) |
Disability Class: Ambulatory Difficulty
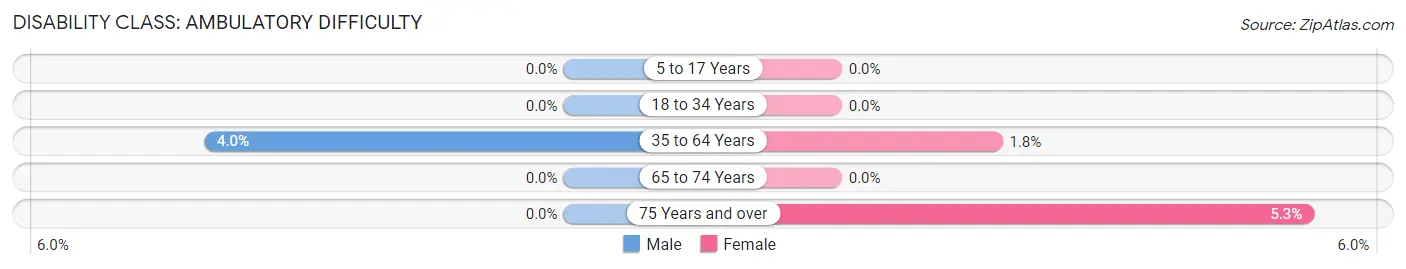
| Age Bracket | Male | Female |
| 5 to 17 Years | 0 (0.0%) | 0 (0.0%) |
| 18 to 34 Years | 0 (0.0%) | 0 (0.0%) |
| 35 to 64 Years | 5 (4.0%) | 1 (1.8%) |
| 65 to 74 Years | 0 (0.0%) | 0 (0.0%) |
| 75 Years and over | 0 (0.0%) | 1 (5.3%) |
Disability Class: Self-Care Difficulty
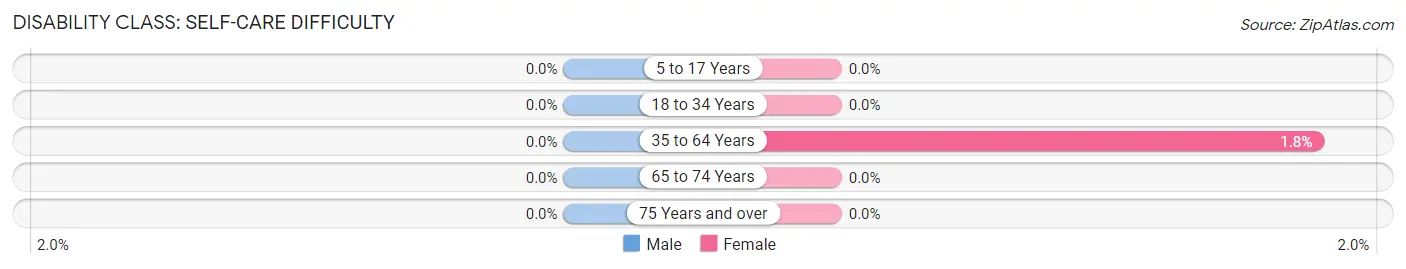
| Age Bracket | Male | Female |
| 5 to 17 Years | 0 (0.0%) | 0 (0.0%) |
| 18 to 34 Years | 0 (0.0%) | 0 (0.0%) |
| 35 to 64 Years | 0 (0.0%) | 1 (1.8%) |
| 65 to 74 Years | 0 (0.0%) | 0 (0.0%) |
| 75 Years and over | 0 (0.0%) | 0 (0.0%) |
Technology Access in Swall Meadows
Computing Device Access in Swall Meadows
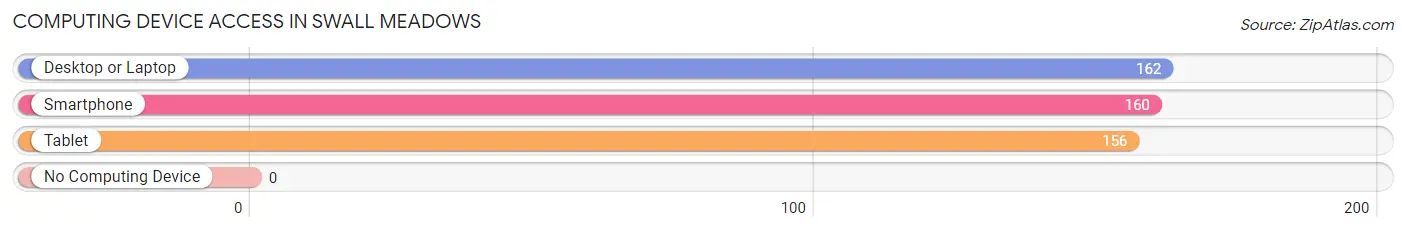
| Device Type | # Households | % Households |
| Desktop or Laptop | 162 | 100.0% |
| Smartphone | 160 | 98.8% |
| Tablet | 156 | 96.3% |
| No Computing Device | 0 | 0.0% |
| Total | 162 | 100.0% |
Internet Access in Swall Meadows
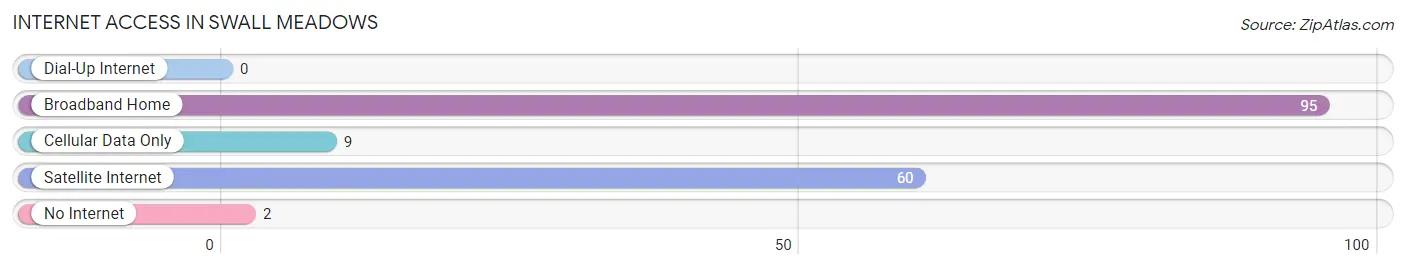
| Internet Type | # Households | % Households |
| Dial-Up Internet | 0 | 0.0% |
| Broadband Home | 95 | 58.6% |
| Cellular Data Only | 9 | 5.6% |
| Satellite Internet | 60 | 37.0% |
| No Internet | 2 | 1.2% |
| Total | 162 | 100.0% |
Swall Meadows Summary
Swall Meadows is a small unincorporated community located in Mono County, California, United States. It is situated in the Eastern Sierra Nevada Mountains, approximately 8 miles (13 km) northeast of the town of Bishop. The community is located at an elevation of 6,845 feet (2,089 m).
History
Swall Meadows was first settled in the late 1800s by ranchers and farmers. The area was originally known as “Swallow Meadows”, named after the swallows that nested in the area. The name was eventually changed to “Swall Meadows”.
In the early 1900s, the area was home to a number of small ranches and farms. The community was also home to a post office, which opened in 1908 and closed in 1940.
In the 1950s, the area began to experience a population boom as people moved to the area to take advantage of the area’s natural beauty and recreational opportunities. The population of Swall Meadows peaked in the 1970s, with a population of around 500 people.
Geography
Swall Meadows is located in the Eastern Sierra Nevada Mountains, approximately 8 miles (13 km) northeast of the town of Bishop. The community is located at an elevation of 6,845 feet (2,089 m).
The area is characterized by rolling hills, meadows, and forests. The area is home to a variety of wildlife, including deer, coyotes, and mountain lions.
The climate in Swall Meadows is characterized by hot, dry summers and cold, snowy winters. The average annual temperature is around 45°F (7°C).
Economy
The economy of Swall Meadows is largely based on tourism and recreation. The area is home to a number of recreational activities, including camping, fishing, hiking, and skiing.
The area is also home to a number of small businesses including restaurants stores and lodges
Demographics
As of the 2010 census, the population of Swall Meadows was 545. The racial makeup of the community was 95.2% White, 0.2% African American, 0.7% Native American, 0.7% Asian, 0.2% Pacific Islander, 0.7% from other races, and 2.1% from two or more races. Hispanic or Latino of any race were 3.3% of the population.
The median household income in Swall Meadows was $45,833, and the median family income was $50,000. The per capita income for the community was $21,945. About 8.3% of families and 10.3% of the population were below the poverty line, including 14.3% of those under age 18 and none of those age 65 or over.
Common Questions
What is Per Capita Income in Swall Meadows?
Per Capita income in Swall Meadows is $78,525.
What is the Median Family Income in Swall Meadows?
Median Family Income in Swall Meadows is $129,300.
What is the Median Household income in Swall Meadows?
Median Household Income in Swall Meadows is $179,792.
What is Inequality or Gini Index in Swall Meadows?
Inequality or Gini Index in Swall Meadows is 0.30.
What is the Total Population of Swall Meadows?
Total Population of Swall Meadows is 365.
What is the Total Male Population of Swall Meadows?
Total Male Population of Swall Meadows is 243.
What is the Total Female Population of Swall Meadows?
Total Female Population of Swall Meadows is 122.
What is the Ratio of Males per 100 Females in Swall Meadows?
There are 199.18 Males per 100 Females in Swall Meadows.
What is the Ratio of Females per 100 Males in Swall Meadows?
There are 50.21 Females per 100 Males in Swall Meadows.
What is the Median Population Age in Swall Meadows?
Median Population Age in Swall Meadows is 59.2 Years.
What is the Average Family Size in Swall Meadows
Average Family Size in Swall Meadows is 2.3 People.
What is the Average Household Size in Swall Meadows
Average Household Size in Swall Meadows is 2.2 People.
How Large is the Labor Force in Swall Meadows?
There are 241 People in the Labor Forcein in Swall Meadows.
What is the Percentage of People in the Labor Force in Swall Meadows?
70.5% of People are in the Labor Force in Swall Meadows.
What is the Unemployment Rate in Swall Meadows?
Unemployment Rate in Swall Meadows is 2.1%.