Cities with the Highest Percentage of Population Employed in Computer, Engineering & Science in Alabama
RELATED REPORTS & OPTIONS
Computer, Engineering & Science
Alabama
Compare Cities
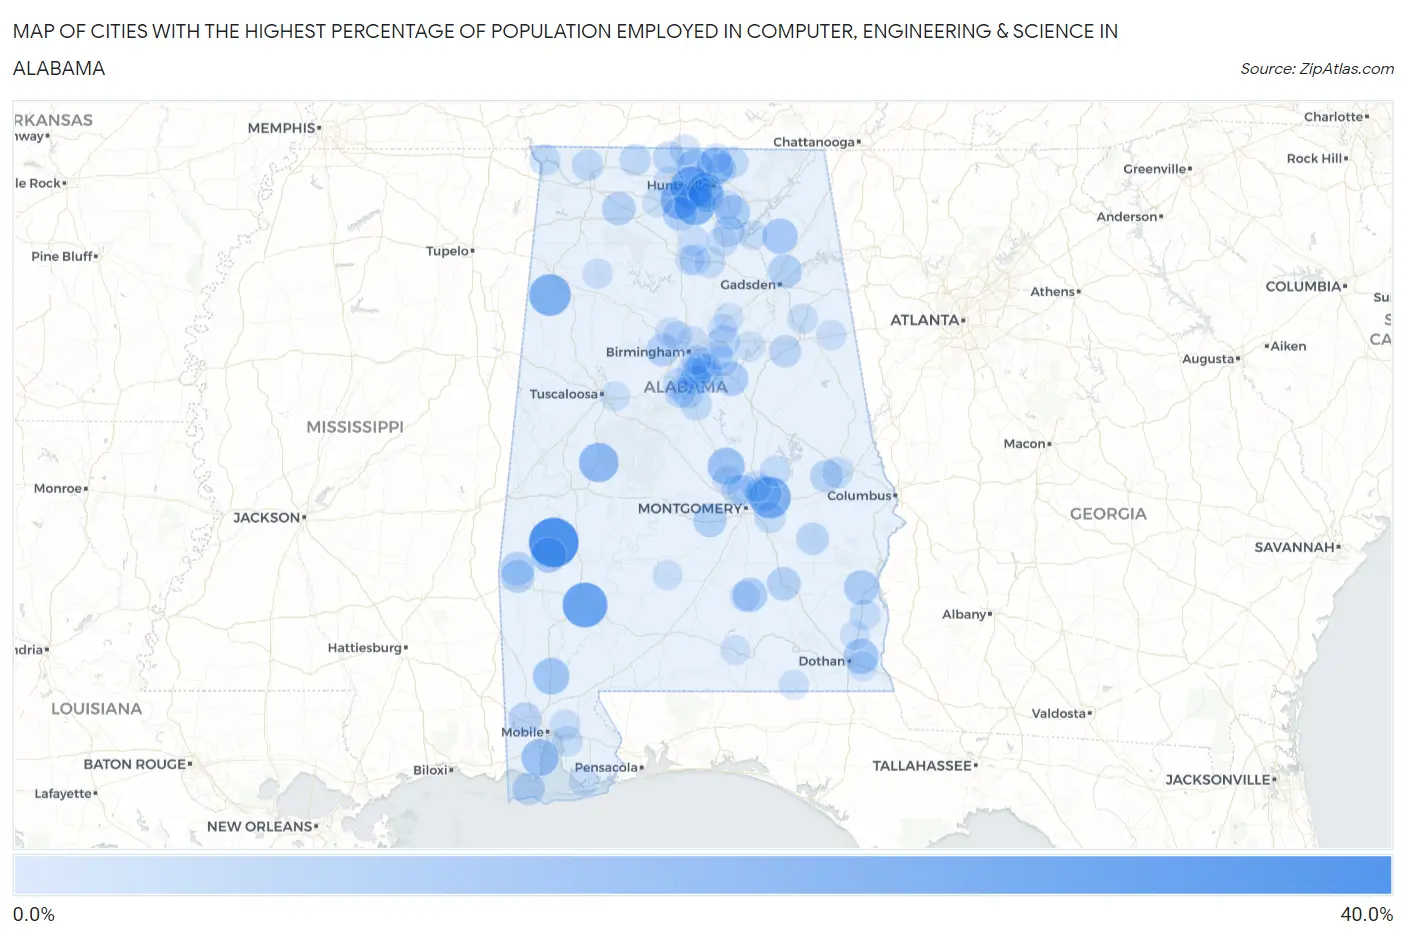
Map of Cities with the Highest Percentage of Population Employed in Computer, Engineering & Science in Alabama
0.0%
40.0%
Cities with the Highest Percentage of Population Employed in Computer, Engineering & Science in Alabama
| City | % Employed | vs State | vs National | |
| 1. | Nanafalia | 38.5% | 5.7%(+32.8)#1 | 6.8%(+31.7)#125 |
| 2. | Whatley | 30.3% | 5.7%(+24.6)#2 | 6.8%(+23.5)#215 |
| 3. | Beaverton | 25.0% | 5.7%(+19.3)#3 | 6.8%(+18.2)#331 |
| 4. | Emerald Mountain | 24.9% | 5.7%(+19.2)#4 | 6.8%(+18.2)#336 |
| 5. | Madison | 24.8% | 5.7%(+19.1)#5 | 6.8%(+18.0)#339 |
| 6. | Triana | 23.1% | 5.7%(+17.4)#6 | 6.8%(+16.3)#391 |
| 7. | Greensboro | 21.4% | 5.7%(+15.7)#7 | 6.8%(+14.6)#479 |
| 8. | Mooresville | 20.0% | 5.7%(+14.3)#8 | 6.8%(+13.2)#553 |
| 9. | Belle Fontaine | 17.5% | 5.7%(+11.8)#9 | 6.8%(+10.7)#772 |
| 10. | Marbury | 17.4% | 5.7%(+11.8)#10 | 6.8%(+10.7)#781 |
| 11. | Meridianville | 16.9% | 5.7%(+11.2)#11 | 6.8%(+10.2)#840 |
| 12. | Mount Vernon | 16.5% | 5.7%(+10.8)#12 | 6.8%(+9.76)#889 |
| 13. | Harvest | 15.9% | 5.7%(+10.2)#13 | 6.8%(+9.14)#975 |
| 14. | Huntsville | 15.9% | 5.7%(+10.2)#14 | 6.8%(+9.11)#977 |
| 15. | Redland | 15.0% | 5.7%(+9.28)#15 | 6.8%(+8.21)#1,142 |
| 16. | Putnam | 14.7% | 5.7%(+9.01)#16 | 6.8%(+7.94)#1,197 |
| 17. | Equality | 14.6% | 5.7%(+8.94)#17 | 6.8%(+7.87)#1,211 |
| 18. | Geraldine | 14.6% | 5.7%(+8.86)#18 | 6.8%(+7.79)#1,225 |
| 19. | Redstone Arsenal | 14.4% | 5.7%(+8.66)#19 | 6.8%(+7.59)#1,256 |
| 20. | Webb | 14.2% | 5.7%(+8.49)#20 | 6.8%(+7.42)#1,292 |
| 21. | New Hope | 13.8% | 5.7%(+8.11)#21 | 6.8%(+7.04)#1,393 |
| 22. | Bakerhill | 13.5% | 5.7%(+7.82)#22 | 6.8%(+6.75)#1,476 |
| 23. | Luverne | 13.0% | 5.7%(+7.27)#23 | 6.8%(+6.20)#1,639 |
| 24. | Priceville | 12.8% | 5.7%(+7.09)#24 | 6.8%(+6.02)#1,701 |
| 25. | Harpersville | 12.7% | 5.7%(+6.99)#25 | 6.8%(+5.91)#1,731 |
| 26. | Lookout Mountain | 12.2% | 5.7%(+6.49)#26 | 6.8%(+5.42)#1,899 |
| 27. | Toxey | 12.1% | 5.7%(+6.43)#27 | 6.8%(+5.36)#1,911 |
| 28. | Lowndesboro | 11.8% | 5.7%(+6.07)#28 | 6.8%(+5.00)#2,022 |
| 29. | Troy | 11.7% | 5.7%(+6.03)#29 | 6.8%(+4.96)#2,033 |
| 30. | Hatton | 11.5% | 5.7%(+5.79)#30 | 6.8%(+4.72)#2,128 |
| 31. | Gilbertown | 11.3% | 5.7%(+5.57)#31 | 6.8%(+4.50)#2,230 |
| 32. | Eagle Point | 11.2% | 5.7%(+5.55)#32 | 6.8%(+4.47)#2,251 |
| 33. | Sylvan Springs | 10.7% | 5.7%(+4.98)#33 | 6.8%(+3.91)#2,538 |
| 34. | Semmes | 10.6% | 5.7%(+4.94)#34 | 6.8%(+3.87)#2,563 |
| 35. | Loachapoka | 10.2% | 5.7%(+4.54)#35 | 6.8%(+3.47)#2,793 |
| 36. | Dauphin Island | 10.2% | 5.7%(+4.52)#36 | 6.8%(+3.45)#2,804 |
| 37. | Union Springs | 10.0% | 5.7%(+4.28)#37 | 6.8%(+3.20)#2,969 |
| 38. | Moody | 9.7% | 5.7%(+4.00)#38 | 6.8%(+2.93)#3,157 |
| 39. | Munford | 9.7% | 5.7%(+3.99)#39 | 6.8%(+2.92)#3,167 |
| 40. | Chelsea | 9.3% | 5.7%(+3.56)#40 | 6.8%(+2.49)#3,511 |
| 41. | Alabaster | 9.2% | 5.7%(+3.47)#41 | 6.8%(+2.40)#3,573 |
| 42. | Elkmont | 9.0% | 5.7%(+3.34)#42 | 6.8%(+2.27)#3,677 |
| 43. | Hoover | 8.9% | 5.7%(+3.20)#43 | 6.8%(+2.13)#3,810 |
| 44. | Anderson | 8.7% | 5.7%(+3.00)#44 | 6.8%(+1.93)#3,983 |
| 45. | Union Grove | 8.7% | 5.7%(+3.00)#45 | 6.8%(+1.93)#3,986 |
| 46. | Underwood Petersville | 8.6% | 5.7%(+2.90)#46 | 6.8%(+1.83)#4,067 |
| 47. | New Market | 8.6% | 5.7%(+2.89)#47 | 6.8%(+1.82)#4,081 |
| 48. | Helena | 8.5% | 5.7%(+2.83)#48 | 6.8%(+1.76)#4,154 |
| 49. | Calera | 8.4% | 5.7%(+2.72)#49 | 6.8%(+1.65)#4,248 |
| 50. | Pike Road | 8.4% | 5.7%(+2.72)#50 | 6.8%(+1.65)#4,259 |
| 51. | Meadowbrook | 8.2% | 5.7%(+2.51)#51 | 6.8%(+1.44)#4,471 |
| 52. | Indian Springs Village | 8.2% | 5.7%(+2.51)#52 | 6.8%(+1.44)#4,472 |
| 53. | Millbrook | 8.2% | 5.7%(+2.50)#53 | 6.8%(+1.43)#4,484 |
| 54. | Pea Ridge | 8.1% | 5.7%(+2.45)#54 | 6.8%(+1.38)#4,537 |
| 55. | Auburn | 8.0% | 5.7%(+2.35)#55 | 6.8%(+1.28)#4,636 |
| 56. | Waterloo | 8.0% | 5.7%(+2.31)#56 | 6.8%(+1.24)#4,702 |
| 57. | Coosada | 8.0% | 5.7%(+2.29)#57 | 6.8%(+1.22)#4,721 |
| 58. | Brook Highland | 8.0% | 5.7%(+2.29)#58 | 6.8%(+1.22)#4,727 |
| 59. | Abbeville | 7.9% | 5.7%(+2.16)#59 | 6.8%(+1.09)#4,877 |
| 60. | Pelham | 7.8% | 5.7%(+2.10)#60 | 6.8%(+1.03)#4,942 |
| 61. | Mccalla | 7.8% | 5.7%(+2.10)#61 | 6.8%(+1.02)#4,948 |
| 62. | Wetumpka | 7.8% | 5.7%(+2.07)#62 | 6.8%(+1.000)#4,986 |
| 63. | Moores Mill | 7.7% | 5.7%(+2.03)#63 | 6.8%(+0.962)#5,037 |
| 64. | Ardmore | 7.7% | 5.7%(+1.97)#64 | 6.8%(+0.901)#5,116 |
| 65. | Brantleyville | 7.6% | 5.7%(+1.89)#65 | 6.8%(+0.817)#5,209 |
| 66. | Berlin | 7.5% | 5.7%(+1.79)#66 | 6.8%(+0.716)#5,319 |
| 67. | Eclectic | 7.5% | 5.7%(+1.76)#67 | 6.8%(+0.689)#5,345 |
| 68. | Spanish Fort | 7.4% | 5.7%(+1.67)#68 | 6.8%(+0.600)#5,456 |
| 69. | Holly Pond | 7.3% | 5.7%(+1.66)#69 | 6.8%(+0.584)#5,482 |
| 70. | Arab | 7.3% | 5.7%(+1.64)#70 | 6.8%(+0.567)#5,503 |
| 71. | Highland Lakes | 7.3% | 5.7%(+1.63)#71 | 6.8%(+0.555)#5,515 |
| 72. | Daphne | 7.3% | 5.7%(+1.58)#72 | 6.8%(+0.510)#5,568 |
| 73. | Vandiver | 7.3% | 5.7%(+1.58)#73 | 6.8%(+0.503)#5,579 |
| 74. | Weaver | 7.1% | 5.7%(+1.44)#74 | 6.8%(+0.368)#5,780 |
| 75. | Eva | 7.1% | 5.7%(+1.39)#75 | 6.8%(+0.320)#5,835 |
| 76. | Dunnavant | 7.0% | 5.7%(+1.26)#76 | 6.8%(+0.192)#6,015 |
| 77. | Rutledge | 6.9% | 5.7%(+1.24)#77 | 6.8%(+0.166)#6,058 |
| 78. | Trinity | 6.9% | 5.7%(+1.17)#78 | 6.8%(+0.094)#6,162 |
| 79. | Graysville | 6.9% | 5.7%(+1.17)#79 | 6.8%(+0.093)#6,163 |
| 80. | Hazel Green | 6.8% | 5.7%(+1.15)#80 | 6.8%(+0.075)#6,196 |
| 81. | Tarrant | 6.8% | 5.7%(+1.14)#81 | 6.8%(+0.068)#6,208 |
| 82. | Heflin | 6.8% | 5.7%(+1.11)#82 | 6.8%(+0.033)#6,267 |
| 83. | Bon Secour | 6.8% | 5.7%(+1.09)#83 | 6.8%(+0.018)#6,291 |
| 84. | Guntersville | 6.7% | 5.7%(+1.02)#84 | 6.8%(-0.049)#6,375 |
| 85. | Natural Bridge | 6.7% | 5.7%(+0.974)#85 | 6.8%(-0.098)#6,464 |
| 86. | Owens Cross Roads | 6.6% | 5.7%(+0.946)#86 | 6.8%(-0.126)#6,489 |
| 87. | Vestavia Hills | 6.6% | 5.7%(+0.930)#87 | 6.8%(-0.142)#6,510 |
| 88. | Athens | 6.5% | 5.7%(+0.844)#88 | 6.8%(-0.228)#6,639 |
| 89. | Pine Level | 6.5% | 5.7%(+0.797)#89 | 6.8%(-0.275)#6,727 |
| 90. | Avon | 6.5% | 5.7%(+0.775)#90 | 6.8%(-0.297)#6,756 |
| 91. | Brookside | 6.3% | 5.7%(+0.656)#91 | 6.8%(-0.416)#6,945 |
| 92. | Springville | 6.3% | 5.7%(+0.622)#92 | 6.8%(-0.449)#7,020 |
| 93. | Geneva | 6.3% | 5.7%(+0.612)#93 | 6.8%(-0.460)#7,034 |
| 94. | Pell City | 6.3% | 5.7%(+0.586)#94 | 6.8%(-0.486)#7,084 |
| 95. | Pine Apple | 6.2% | 5.7%(+0.557)#95 | 6.8%(-0.515)#7,132 |
| 96. | Cottondale | 6.2% | 5.7%(+0.522)#96 | 6.8%(-0.550)#7,177 |
| 97. | Sanford | 6.2% | 5.7%(+0.480)#97 | 6.8%(-0.592)#7,259 |
| 98. | Newville | 6.2% | 5.7%(+0.472)#98 | 6.8%(-0.600)#7,278 |
| 99. | Argo | 6.1% | 5.7%(+0.411)#99 | 6.8%(-0.661)#7,384 |
| 100. | East Point | 6.1% | 5.7%(+0.368)#100 | 6.8%(-0.704)#7,466 |
Common Questions
What are the Top 10 Cities with the Highest Percentage of Population Employed in Computer, Engineering & Science in Alabama?
Top 10 Cities with the Highest Percentage of Population Employed in Computer, Engineering & Science in Alabama are:
#1
38.5%
#2
30.3%
#3
25.0%
#4
24.9%
#5
24.8%
#6
23.1%
#7
21.4%
#8
20.0%
#9
17.5%
#10
17.4%
What city has the Highest Percentage of Population Employed in Computer, Engineering & Science in Alabama?
Nanafalia has the Highest Percentage of Population Employed in Computer, Engineering & Science in Alabama with 38.5%.
What is the Percentage of Population Employed in Computer, Engineering & Science in the State of Alabama?
Percentage of Population Employed in Computer, Engineering & Science in Alabama is 5.7%.
What is the Percentage of Population Employed in Computer, Engineering & Science in the United States?
Percentage of Population Employed in Computer, Engineering & Science in the United States is 6.8%.