Zip Codes with the Highest Percentage of Population Employed in Computer, Engineering & Science in La Puente, CA
RELATED REPORTS & OPTIONS
Computer, Engineering & Science
La Puente
Compare Zip Codes
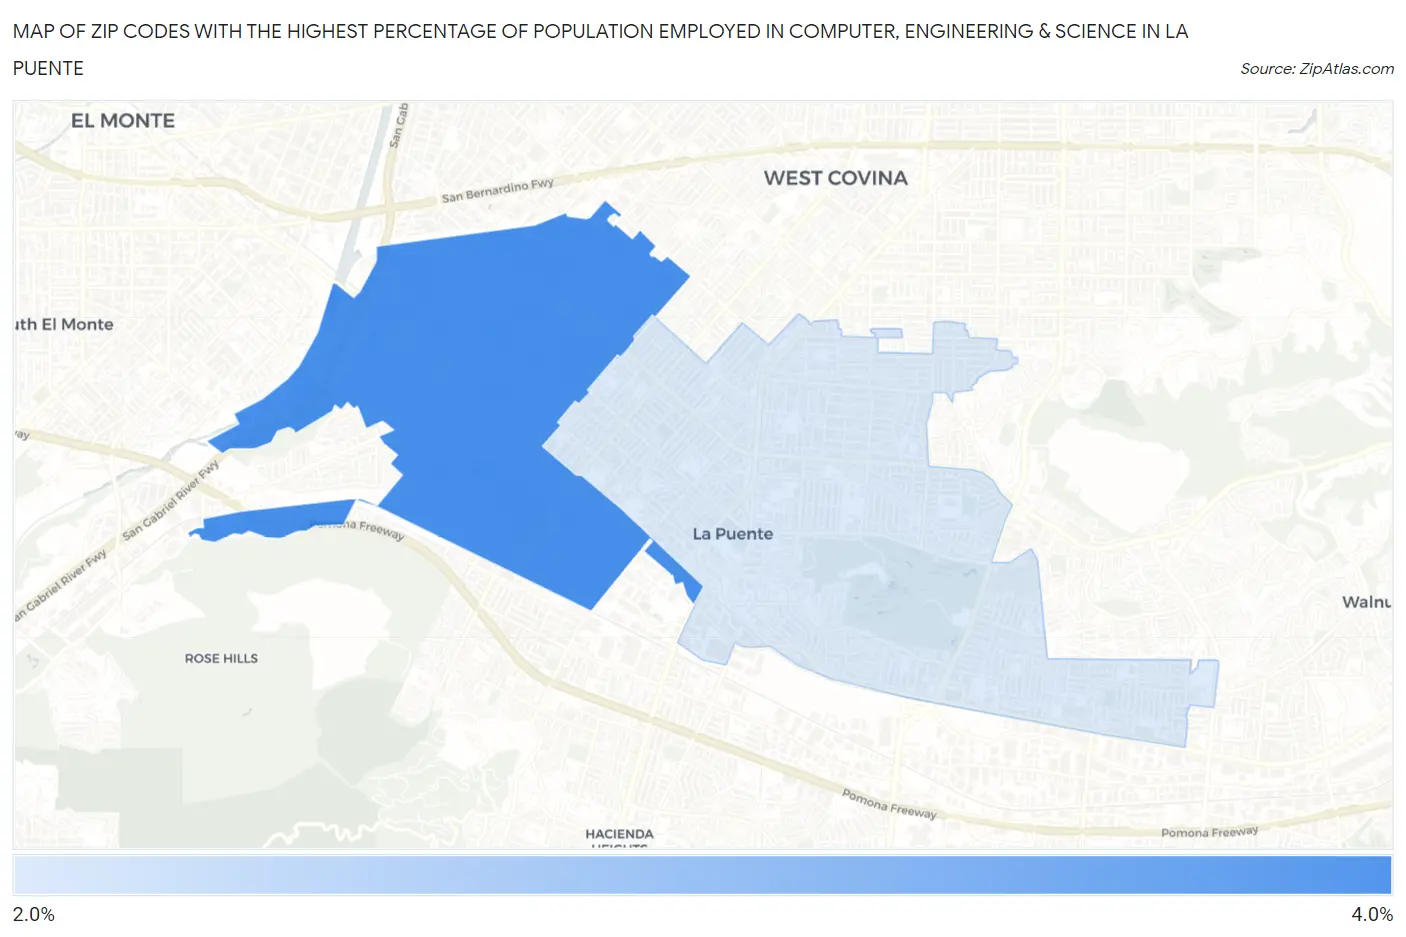
Map of Zip Codes with the Highest Percentage of Population Employed in Computer, Engineering & Science in La Puente
2.1%
3.2%
Zip Codes with the Highest Percentage of Population Employed in Computer, Engineering & Science in La Puente, CA
| Zip Code | % Employed | vs State | vs National | |
| 1. | 91746 | 3.2% | 8.0%(-4.73)#1,146 | 6.8%(-3.53)#17,279 |
| 2. | 91744 | 2.1% | 8.0%(-5.83)#1,314 | 6.8%(-4.64)#21,359 |
1
Common Questions
What are the Top Zip Codes with the Highest Percentage of Population Employed in Computer, Engineering & Science in La Puente, CA?
Top Zip Codes with the Highest Percentage of Population Employed in Computer, Engineering & Science in La Puente, CA are:
What zip code has the Highest Percentage of Population Employed in Computer, Engineering & Science in La Puente, CA?
91746 has the Highest Percentage of Population Employed in Computer, Engineering & Science in La Puente, CA with 3.2%.
What is the Percentage of Population Employed in Computer, Engineering & Science in La Puente, CA?
Percentage of Population Employed in Computer, Engineering & Science in La Puente is 2.1%.
What is the Percentage of Population Employed in Computer, Engineering & Science in California?
Percentage of Population Employed in Computer, Engineering & Science in California is 8.0%.
What is the Percentage of Population Employed in Computer, Engineering & Science in the United States?
Percentage of Population Employed in Computer, Engineering & Science in the United States is 6.8%.