Zip Codes with the Highest Percentage of Population Employed in Computer, Engineering & Science in San Diego, CA
RELATED REPORTS & OPTIONS
Computer, Engineering & Science
San Diego
Compare Zip Codes
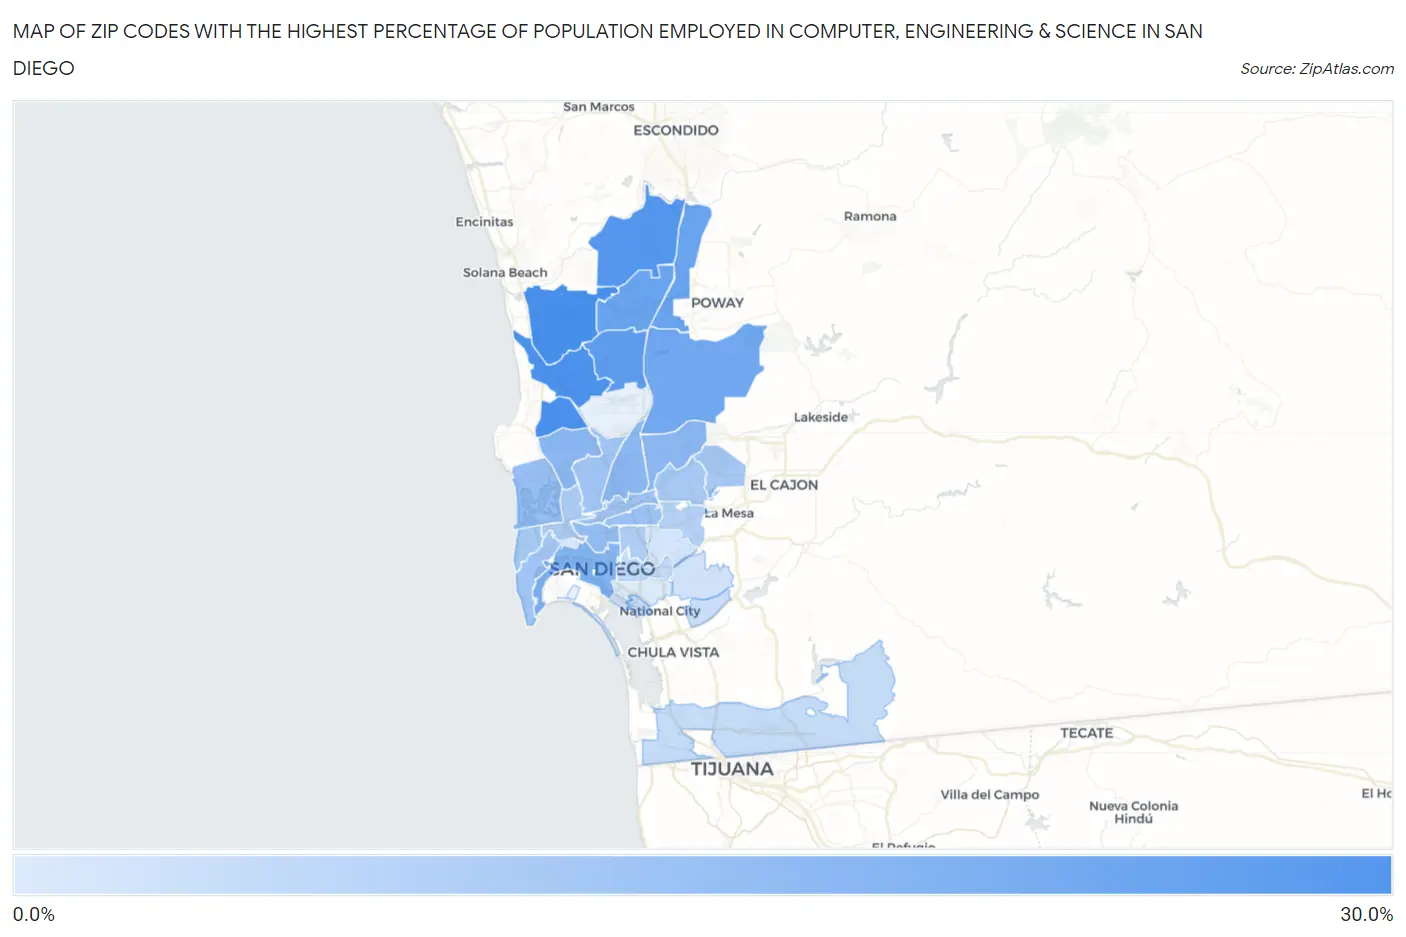
Map of Zip Codes with the Highest Percentage of Population Employed in Computer, Engineering & Science in San Diego
2.3%
27.7%
Zip Codes with the Highest Percentage of Population Employed in Computer, Engineering & Science in San Diego, CA
| Zip Code | % Employed | vs State | vs National | |
| 1. | 92130 | 27.7% | 8.0%(+19.7)#45 | 6.8%(+20.9)#220 |
| 2. | 92122 | 27.0% | 8.0%(+19.0)#48 | 6.8%(+20.2)#228 |
| 3. | 92121 | 26.7% | 8.0%(+18.7)#50 | 6.8%(+19.9)#237 |
| 4. | 92127 | 25.3% | 8.0%(+17.3)#56 | 6.8%(+18.5)#270 |
| 5. | 92126 | 23.3% | 8.0%(+15.3)#69 | 6.8%(+16.5)#331 |
| 6. | 92129 | 21.5% | 8.0%(+13.5)#76 | 6.8%(+14.7)#405 |
| 7. | 92128 | 21.3% | 8.0%(+13.4)#77 | 6.8%(+14.6)#419 |
| 8. | 92131 | 20.0% | 8.0%(+12.0)#88 | 6.8%(+13.2)#514 |
| 9. | 92101 | 15.9% | 8.0%(+7.97)#147 | 6.8%(+9.17)#967 |
| 10. | 92117 | 15.6% | 8.0%(+7.67)#153 | 6.8%(+8.87)#1,012 |
| 11. | 92123 | 15.5% | 8.0%(+7.52)#157 | 6.8%(+8.72)#1,031 |
| 12. | 92124 | 15.5% | 8.0%(+7.49)#158 | 6.8%(+8.69)#1,036 |
| 13. | 92103 | 13.9% | 8.0%(+5.95)#194 | 6.8%(+7.15)#1,366 |
| 14. | 92109 | 13.4% | 8.0%(+5.40)#207 | 6.8%(+6.60)#1,513 |
| 15. | 92116 | 12.6% | 8.0%(+4.67)#233 | 6.8%(+5.87)#1,774 |
| 16. | 92106 | 11.9% | 8.0%(+3.90)#256 | 6.8%(+5.10)#2,103 |
| 17. | 92111 | 11.8% | 8.0%(+3.80)#264 | 6.8%(+5.00)#2,149 |
| 18. | 92108 | 11.6% | 8.0%(+3.68)#271 | 6.8%(+4.88)#2,214 |
| 19. | 92119 | 11.1% | 8.0%(+3.12)#294 | 6.8%(+4.32)#2,524 |
| 20. | 92120 | 10.7% | 8.0%(+2.74)#312 | 6.8%(+3.94)#2,725 |
| 21. | 92107 | 10.5% | 8.0%(+2.51)#323 | 6.8%(+3.71)#2,881 |
| 22. | 92110 | 10.1% | 8.0%(+2.11)#345 | 6.8%(+3.31)#3,167 |
| 23. | 92104 | 9.4% | 8.0%(+1.40)#388 | 6.8%(+2.60)#3,720 |
| 24. | 92115 | 8.6% | 8.0%(+0.664)#439 | 6.8%(+1.86)#4,448 |
| 25. | 92102 | 6.2% | 8.0%(-1.76)#703 | 6.8%(-0.564)#8,340 |
| 26. | 92136 | 5.8% | 8.0%(-2.21)#764 | 6.8%(-1.01)#9,425 |
| 27. | 92154 | 5.7% | 8.0%(-2.24)#768 | 6.8%(-1.04)#9,499 |
| 28. | 92139 | 5.1% | 8.0%(-2.85)#856 | 6.8%(-1.65)#11,057 |
| 29. | 92114 | 4.2% | 8.0%(-3.76)#1,006 | 6.8%(-2.56)#13,839 |
| 30. | 92105 | 3.8% | 8.0%(-4.17)#1,051 | 6.8%(-2.97)#15,171 |
| 31. | 92140 | 2.9% | 8.0%(-5.07)#1,203 | 6.8%(-3.87)#18,494 |
| 32. | 92113 | 2.3% | 8.0%(-5.64)#1,290 | 6.8%(-4.44)#20,663 |
1
Common Questions
What are the Top 10 Zip Codes with the Highest Percentage of Population Employed in Computer, Engineering & Science in San Diego, CA?
Top 10 Zip Codes with the Highest Percentage of Population Employed in Computer, Engineering & Science in San Diego, CA are:
What zip code has the Highest Percentage of Population Employed in Computer, Engineering & Science in San Diego, CA?
92130 has the Highest Percentage of Population Employed in Computer, Engineering & Science in San Diego, CA with 27.7%.
What is the Percentage of Population Employed in Computer, Engineering & Science in San Diego, CA?
Percentage of Population Employed in Computer, Engineering & Science in San Diego is 13.4%.
What is the Percentage of Population Employed in Computer, Engineering & Science in California?
Percentage of Population Employed in Computer, Engineering & Science in California is 8.0%.
What is the Percentage of Population Employed in Computer, Engineering & Science in the United States?
Percentage of Population Employed in Computer, Engineering & Science in the United States is 6.8%.