Cities with the Highest Percentage of Population Employed in Computer, Engineering & Science in Wyoming
RELATED REPORTS & OPTIONS
Computer, Engineering & Science
Wyoming
Compare Cities
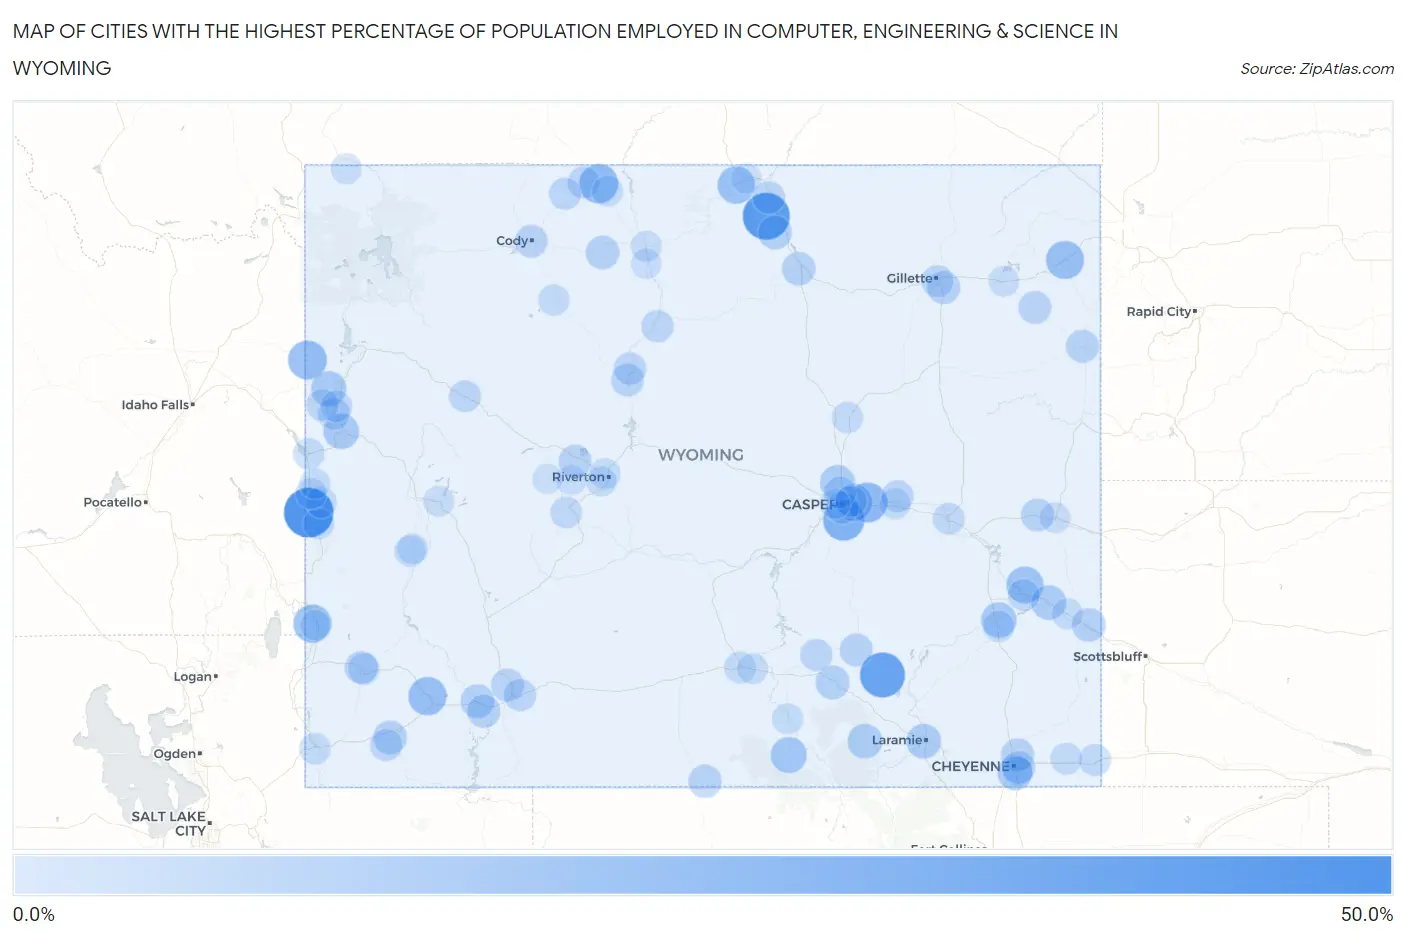
Map of Cities with the Highest Percentage of Population Employed in Computer, Engineering & Science in Wyoming
0.0%
50.0%
Cities with the Highest Percentage of Population Employed in Computer, Engineering & Science in Wyoming
| City | % Employed | vs State | vs National | |
| 1. | Auburn | 40.7% | 4.7%(+36.0)#1 | 6.8%(+33.9)#111 |
| 2. | Big Horn | 35.4% | 4.7%(+30.7)#2 | 6.8%(+28.7)#153 |
| 3. | Rock River | 30.9% | 4.7%(+26.2)#3 | 6.8%(+24.2)#208 |
| 4. | Casper Mountain | 23.1% | 4.7%(+18.4)#4 | 6.8%(+16.4)#390 |
| 5. | Meadow Acres | 19.7% | 4.7%(+15.0)#5 | 6.8%(+13.0)#569 |
| 6. | Cowley | 18.7% | 4.7%(+14.0)#6 | 6.8%(+11.9)#665 |
| 7. | Alta | 17.8% | 4.7%(+13.1)#7 | 6.8%(+11.1)#744 |
| 8. | Taylor | 16.9% | 4.7%(+12.1)#8 | 6.8%(+10.1)#851 |
| 9. | Granger | 16.3% | 4.7%(+11.6)#9 | 6.8%(+9.54)#917 |
| 10. | Sundance | 16.2% | 4.7%(+11.4)#10 | 6.8%(+9.40)#941 |
| 11. | Dayton | 15.0% | 4.7%(+10.3)#11 | 6.8%(+8.24)#1,137 |
| 12. | Brookhurst | 14.6% | 4.7%(+9.90)#12 | 6.8%(+7.87)#1,212 |
| 13. | Hartville | 14.3% | 4.7%(+9.55)#13 | 6.8%(+7.52)#1,275 |
| 14. | Encampment | 12.0% | 4.7%(+7.27)#14 | 6.8%(+5.24)#1,938 |
| 15. | Hoback | 11.1% | 4.7%(+6.33)#15 | 6.8%(+4.29)#2,348 |
| 16. | Lakeview North | 10.9% | 4.7%(+6.18)#16 | 6.8%(+4.14)#2,413 |
| 17. | Teton Village | 10.4% | 4.7%(+5.65)#17 | 6.8%(+3.62)#2,708 |
| 18. | South Greeley | 10.3% | 4.7%(+5.52)#18 | 6.8%(+3.49)#2,787 |
| 19. | Homa Hills | 9.8% | 4.7%(+5.12)#19 | 6.8%(+3.08)#3,041 |
| 20. | Laramie | 9.3% | 4.7%(+4.60)#20 | 6.8%(+2.57)#3,439 |
| 21. | Fort Laramie | 9.3% | 4.7%(+4.60)#21 | 6.8%(+2.57)#3,442 |
| 22. | Centennial | 9.2% | 4.7%(+4.45)#22 | 6.8%(+2.42)#3,560 |
| 23. | Elk Mountain | 7.7% | 4.7%(+2.96)#23 | 6.8%(+0.928)#5,086 |
| 24. | James Town | 7.5% | 4.7%(+2.76)#24 | 6.8%(+0.726)#5,308 |
| 25. | Story | 7.5% | 4.7%(+2.74)#25 | 6.8%(+0.707)#5,325 |
| 26. | Lyman | 7.1% | 4.7%(+2.41)#26 | 6.8%(+0.378)#5,735 |
| 27. | Torrington | 7.1% | 4.7%(+2.41)#27 | 6.8%(+0.373)#5,770 |
| 28. | Burlington | 7.0% | 4.7%(+2.29)#28 | 6.8%(+0.253)#5,932 |
| 29. | Buffalo | 6.6% | 4.7%(+1.91)#29 | 6.8%(-0.119)#6,484 |
| 30. | Green River | 6.4% | 4.7%(+1.69)#30 | 6.8%(-0.346)#6,834 |
| 31. | Dixon | 6.4% | 4.7%(+1.63)#31 | 6.8%(-0.401)#6,919 |
| 32. | Ranchettes | 6.4% | 4.7%(+1.63)#32 | 6.8%(-0.402)#6,922 |
| 33. | Sleepy Hollow | 6.3% | 4.7%(+1.59)#33 | 6.8%(-0.440)#6,999 |
| 34. | Johnstown | 6.0% | 4.7%(+1.25)#34 | 6.8%(-0.782)#7,623 |
| 35. | Manville | 6.0% | 4.7%(+1.24)#35 | 6.8%(-0.795)#7,650 |
| 36. | Kemmerer | 5.9% | 4.7%(+1.20)#36 | 6.8%(-0.833)#7,719 |
| 37. | Newcastle | 5.9% | 4.7%(+1.19)#37 | 6.8%(-0.842)#7,741 |
| 38. | Medicine Bow | 5.9% | 4.7%(+1.19)#38 | 6.8%(-0.844)#7,744 |
| 39. | North Rock Springs | 5.8% | 4.7%(+1.03)#39 | 6.8%(-1.00)#8,060 |
| 40. | Upton | 5.7% | 4.7%(+1.000)#40 | 6.8%(-1.03)#8,124 |
| 41. | Cody | 5.6% | 4.7%(+0.823)#41 | 6.8%(-1.21)#8,426 |
| 42. | Cheyenne | 5.5% | 4.7%(+0.811)#42 | 6.8%(-1.22)#8,446 |
| 43. | Thermopolis | 5.5% | 4.7%(+0.749)#43 | 6.8%(-1.28)#8,560 |
| 44. | Casper | 5.4% | 4.7%(+0.622)#44 | 6.8%(-1.41)#8,849 |
| 45. | Lucerne | 4.8% | 4.7%(+0.031)#45 | 6.8%(-2.00)#10,103 |
| 46. | Sheridan | 4.7% | 4.7%(-0.028)#46 | 6.8%(-2.06)#10,226 |
| 47. | Rock Springs | 4.7% | 4.7%(-0.074)#47 | 6.8%(-2.11)#10,337 |
| 48. | La Grange | 4.7% | 4.7%(-0.080)#48 | 6.8%(-2.11)#10,354 |
| 49. | Hanna | 4.3% | 4.7%(-0.415)#49 | 6.8%(-2.45)#11,133 |
| 50. | Worland | 4.3% | 4.7%(-0.428)#50 | 6.8%(-2.46)#11,168 |
| 51. | South Park | 4.3% | 4.7%(-0.466)#51 | 6.8%(-2.50)#11,272 |
| 52. | Deaver | 4.2% | 4.7%(-0.506)#52 | 6.8%(-2.54)#11,383 |
| 53. | Rolling Hills | 4.2% | 4.7%(-0.521)#53 | 6.8%(-2.55)#11,420 |
| 54. | Gillette | 4.1% | 4.7%(-0.597)#54 | 6.8%(-2.63)#11,624 |
| 55. | Wilson | 4.1% | 4.7%(-0.614)#55 | 6.8%(-2.65)#11,665 |
| 56. | Mountain View | 4.1% | 4.7%(-0.654)#56 | 6.8%(-2.69)#11,772 |
| 57. | Bar Nunn | 4.0% | 4.7%(-0.728)#57 | 6.8%(-2.76)#11,952 |
| 58. | Powell | 3.9% | 4.7%(-0.802)#58 | 6.8%(-2.84)#12,167 |
| 59. | Dubois | 3.9% | 4.7%(-0.842)#59 | 6.8%(-2.88)#12,279 |
| 60. | Pine Bluffs | 3.6% | 4.7%(-1.09)#60 | 6.8%(-3.12)#12,962 |
| 61. | Jackson | 3.6% | 4.7%(-1.18)#61 | 6.8%(-3.21)#13,236 |
| 62. | Douglas | 3.5% | 4.7%(-1.21)#62 | 6.8%(-3.24)#13,326 |
| 63. | Guernsey | 3.5% | 4.7%(-1.27)#63 | 6.8%(-3.31)#13,518 |
| 64. | Lander | 3.2% | 4.7%(-1.51)#64 | 6.8%(-3.54)#14,239 |
| 65. | Rawlins | 3.1% | 4.7%(-1.65)#65 | 6.8%(-3.68)#14,683 |
| 66. | Diamondville | 3.0% | 4.7%(-1.69)#66 | 6.8%(-3.73)#14,819 |
| 67. | Burns | 2.9% | 4.7%(-1.86)#67 | 6.8%(-3.89)#15,284 |
| 68. | Evanston | 2.9% | 4.7%(-1.88)#68 | 6.8%(-3.91)#15,347 |
| 69. | Meeteetse | 2.8% | 4.7%(-1.94)#69 | 6.8%(-3.97)#15,534 |
| 70. | Wheatland | 2.7% | 4.7%(-2.05)#70 | 6.8%(-4.08)#15,910 |
| 71. | Midwest | 2.6% | 4.7%(-2.15)#71 | 6.8%(-4.18)#16,211 |
| 72. | Evansville | 2.5% | 4.7%(-2.19)#72 | 6.8%(-4.22)#16,353 |
| 73. | Alpine | 2.5% | 4.7%(-2.19)#73 | 6.8%(-4.23)#16,365 |
| 74. | Big Piney | 2.4% | 4.7%(-2.30)#74 | 6.8%(-4.34)#16,697 |
| 75. | Afton | 2.4% | 4.7%(-2.33)#75 | 6.8%(-4.36)#16,781 |
| 76. | Glenrock | 2.3% | 4.7%(-2.47)#76 | 6.8%(-4.51)#17,219 |
| 77. | Riverton | 2.1% | 4.7%(-2.60)#77 | 6.8%(-4.63)#17,615 |
| 78. | Turnerville | 2.0% | 4.7%(-2.73)#78 | 6.8%(-4.76)#18,040 |
| 79. | Thayne | 2.0% | 4.7%(-2.74)#79 | 6.8%(-4.78)#18,079 |
| 80. | Lovell | 1.9% | 4.7%(-2.81)#80 | 6.8%(-4.84)#18,262 |
| 81. | Lingle | 1.9% | 4.7%(-2.84)#81 | 6.8%(-4.88)#18,339 |
| 82. | Saratoga | 1.9% | 4.7%(-2.85)#82 | 6.8%(-4.89)#18,369 |
| 83. | Greybull | 1.7% | 4.7%(-3.05)#83 | 6.8%(-5.08)#18,956 |
| 84. | Sinclair | 1.6% | 4.7%(-3.12)#84 | 6.8%(-5.16)#19,171 |
| 85. | Star Valley Ranch | 1.6% | 4.7%(-3.14)#85 | 6.8%(-5.18)#19,210 |
| 86. | Pinedale | 1.5% | 4.7%(-3.28)#86 | 6.8%(-5.31)#19,650 |
| 87. | Mammoth | 1.4% | 4.7%(-3.28)#87 | 6.8%(-5.32)#19,668 |
| 88. | Moorcroft | 1.4% | 4.7%(-3.29)#88 | 6.8%(-5.32)#19,677 |
| 89. | Marbleton | 1.3% | 4.7%(-3.41)#89 | 6.8%(-5.44)#20,007 |
| 90. | Arapahoe | 1.2% | 4.7%(-3.53)#90 | 6.8%(-5.56)#20,369 |
| 91. | Lusk | 1.2% | 4.7%(-3.58)#91 | 6.8%(-5.61)#20,504 |
| 92. | Mills | 0.77% | 4.7%(-3.96)#92 | 6.8%(-5.99)#21,466 |
| 93. | Basin | 0.74% | 4.7%(-3.99)#93 | 6.8%(-6.02)#21,535 |
| 94. | Ethete | 0.66% | 4.7%(-4.07)#94 | 6.8%(-6.11)#21,733 |
| 95. | Cokeville | 0.56% | 4.7%(-4.17)#95 | 6.8%(-6.20)#21,941 |
| 96. | Ranchester | 0.40% | 4.7%(-4.33)#96 | 6.8%(-6.37)#22,204 |
| 97. | Fort Washakie | 0.21% | 4.7%(-4.52)#97 | 6.8%(-6.55)#22,394 |
| 98. | Fox Farm College | 0.10% | 4.7%(-4.63)#98 | 6.8%(-6.66)#22,417 |
1
2Common Questions
What are the Top 10 Cities with the Highest Percentage of Population Employed in Computer, Engineering & Science in Wyoming?
Top 10 Cities with the Highest Percentage of Population Employed in Computer, Engineering & Science in Wyoming are:
#1
40.7%
#2
35.4%
#3
30.9%
#4
23.1%
#5
19.7%
#6
18.7%
#7
17.8%
#8
16.9%
#9
16.3%
#10
16.2%
What city has the Highest Percentage of Population Employed in Computer, Engineering & Science in Wyoming?
Auburn has the Highest Percentage of Population Employed in Computer, Engineering & Science in Wyoming with 40.7%.
What is the Percentage of Population Employed in Computer, Engineering & Science in the State of Wyoming?
Percentage of Population Employed in Computer, Engineering & Science in Wyoming is 4.7%.
What is the Percentage of Population Employed in Computer, Engineering & Science in the United States?
Percentage of Population Employed in Computer, Engineering & Science in the United States is 6.8%.