Cities with the Highest Percentage of Population Employed in Computer, Engineering & Science in Iowa
RELATED REPORTS & OPTIONS
Computer, Engineering & Science
Iowa
Compare Cities
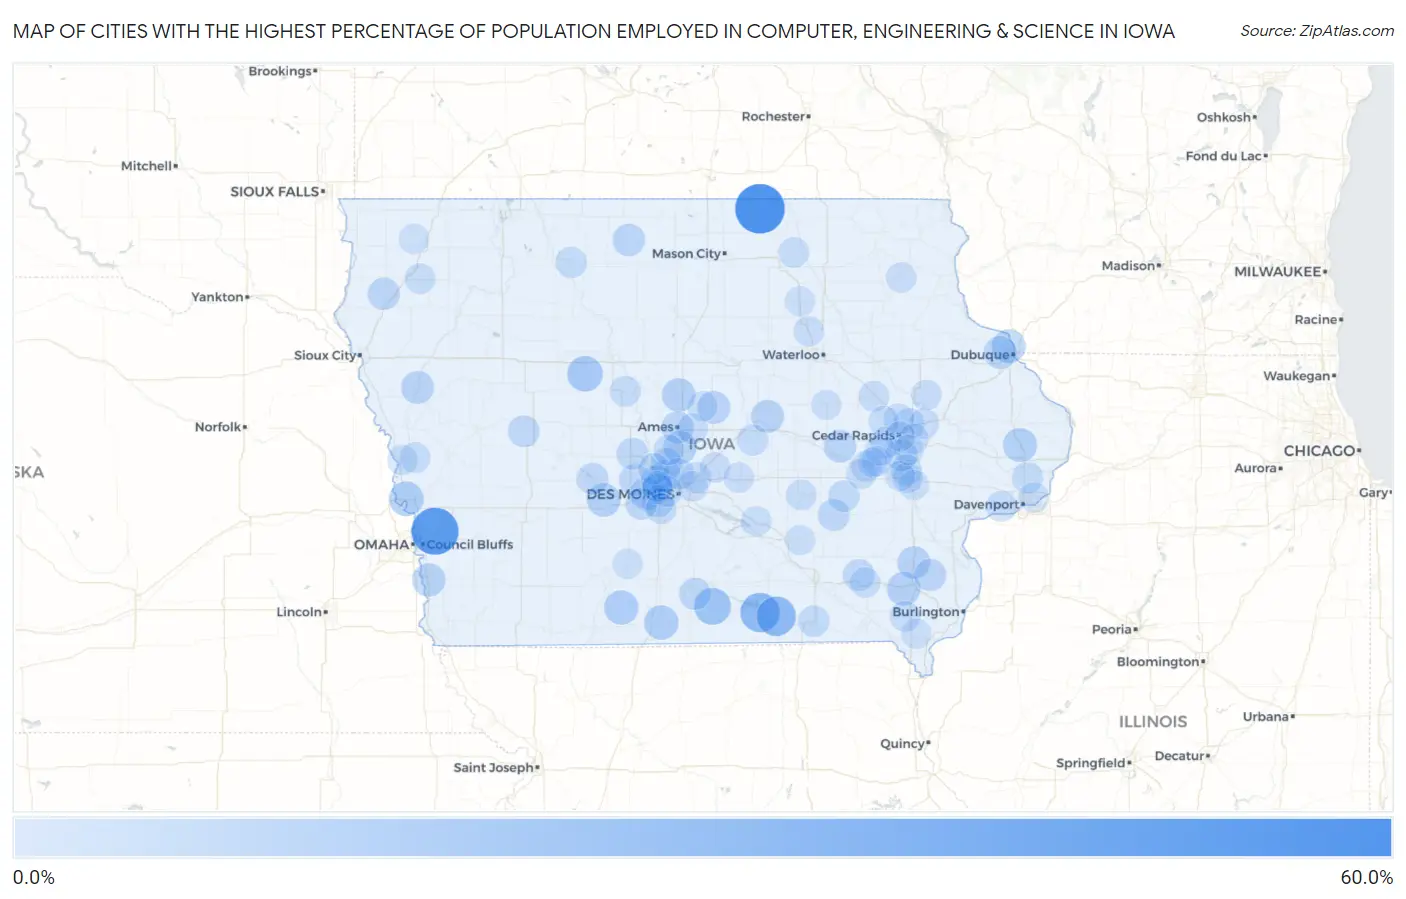
Map of Cities with the Highest Percentage of Population Employed in Computer, Engineering & Science in Iowa
0.0%
60.0%
Cities with the Highest Percentage of Population Employed in Computer, Engineering & Science in Iowa
| City | % Employed | vs State | vs National | |
| 1. | Toeterville | 53.3% | 5.4%(+47.9)#1 | 6.8%(+46.6)#62 |
| 2. | Weston | 47.4% | 5.4%(+41.9)#2 | 6.8%(+40.6)#82 |
| 3. | Rathbun | 28.6% | 5.4%(+23.1)#3 | 6.8%(+21.8)#248 |
| 4. | Udell | 28.6% | 5.4%(+23.1)#4 | 6.8%(+21.8)#250 |
| 5. | Swedesburg | 26.9% | 5.4%(+21.5)#5 | 6.8%(+20.2)#289 |
| 6. | Millerton | 22.7% | 5.4%(+17.3)#6 | 6.8%(+16.0)#416 |
| 7. | Somers | 19.6% | 5.4%(+14.2)#7 | 6.8%(+12.9)#579 |
| 8. | Augusta | 18.5% | 5.4%(+13.1)#8 | 6.8%(+11.8)#675 |
| 9. | California Junction | 17.4% | 5.4%(+12.0)#9 | 6.8%(+10.6)#787 |
| 10. | Leon | 16.9% | 5.4%(+11.5)#10 | 6.8%(+10.1)#848 |
| 11. | Ellston | 16.7% | 5.4%(+11.2)#11 | 6.8%(+9.90)#877 |
| 12. | Welton | 16.0% | 5.4%(+10.6)#12 | 6.8%(+9.28)#954 |
| 13. | Westwood | 15.4% | 5.4%(+9.95)#13 | 6.8%(+8.62)#1,063 |
| 14. | Sageville | 15.4% | 5.4%(+9.95)#14 | 6.8%(+8.62)#1,065 |
| 15. | Diamondhead Lake | 14.9% | 5.4%(+9.48)#15 | 6.8%(+8.15)#1,156 |
| 16. | Randall | 14.9% | 5.4%(+9.43)#16 | 6.8%(+8.10)#1,163 |
| 17. | Montpelier | 14.6% | 5.4%(+9.20)#17 | 6.8%(+7.87)#1,210 |
| 18. | Huxley | 14.4% | 5.4%(+8.92)#18 | 6.8%(+7.60)#1,253 |
| 19. | Pacific Junction | 14.3% | 5.4%(+8.85)#19 | 6.8%(+7.52)#1,269 |
| 20. | Zearing | 13.7% | 5.4%(+8.27)#20 | 6.8%(+6.94)#1,421 |
| 21. | Green Mountain | 13.7% | 5.4%(+8.25)#21 | 6.8%(+6.92)#1,427 |
| 22. | Oto | 13.3% | 5.4%(+7.90)#22 | 6.8%(+6.57)#1,539 |
| 23. | Olds | 13.2% | 5.4%(+7.75)#23 | 6.8%(+6.42)#1,578 |
| 24. | Asbury | 13.0% | 5.4%(+7.59)#24 | 6.8%(+6.26)#1,623 |
| 25. | Luzerne | 12.9% | 5.4%(+7.42)#25 | 6.8%(+6.09)#1,675 |
| 26. | Johnston | 12.5% | 5.4%(+7.06)#26 | 6.8%(+5.73)#1,776 |
| 27. | Titonka | 12.4% | 5.4%(+7.01)#27 | 6.8%(+5.68)#1,796 |
| 28. | Waukee | 12.4% | 5.4%(+6.98)#28 | 6.8%(+5.65)#1,808 |
| 29. | Mount Union | 12.0% | 5.4%(+6.56)#29 | 6.8%(+5.24)#1,941 |
| 30. | Ames | 11.9% | 5.4%(+6.51)#30 | 6.8%(+5.18)#1,958 |
| 31. | Struble | 11.8% | 5.4%(+6.33)#31 | 6.8%(+5.00)#2,023 |
| 32. | Shueyville | 11.6% | 5.4%(+6.14)#32 | 6.8%(+4.82)#2,076 |
| 33. | Dallas Center | 11.5% | 5.4%(+6.10)#33 | 6.8%(+4.77)#2,104 |
| 34. | Bouton | 11.4% | 5.4%(+5.99)#34 | 6.8%(+4.66)#2,153 |
| 35. | West Des Moines | 11.4% | 5.4%(+5.93)#35 | 6.8%(+4.60)#2,187 |
| 36. | Derby | 11.4% | 5.4%(+5.93)#36 | 6.8%(+4.60)#2,193 |
| 37. | Panora | 11.3% | 5.4%(+5.83)#37 | 6.8%(+4.50)#2,235 |
| 38. | Keswick | 11.2% | 5.4%(+5.77)#38 | 6.8%(+4.44)#2,266 |
| 39. | Van Meter | 11.1% | 5.4%(+5.63)#39 | 6.8%(+4.30)#2,342 |
| 40. | Halbur | 10.9% | 5.4%(+5.51)#40 | 6.8%(+4.18)#2,398 |
| 41. | Maharishi Vedic City | 10.9% | 5.4%(+5.45)#41 | 6.8%(+4.13)#2,423 |
| 42. | Millersburg | 10.3% | 5.4%(+4.86)#42 | 6.8%(+3.53)#2,762 |
| 43. | Polk City | 10.3% | 5.4%(+4.84)#43 | 6.8%(+3.51)#2,771 |
| 44. | Grimes | 10.2% | 5.4%(+4.75)#44 | 6.8%(+3.42)#2,824 |
| 45. | Bloomfield | 10.1% | 5.4%(+4.62)#45 | 6.8%(+3.29)#2,911 |
| 46. | Park View | 10.0% | 5.4%(+4.56)#46 | 6.8%(+3.23)#2,960 |
| 47. | Fairfax | 9.8% | 5.4%(+4.40)#47 | 6.8%(+3.08)#3,047 |
| 48. | Haverhill | 9.8% | 5.4%(+4.35)#48 | 6.8%(+3.02)#3,089 |
| 49. | Cylinder | 9.6% | 5.4%(+4.18)#49 | 6.8%(+2.85)#3,225 |
| 50. | Windsor Heights | 9.5% | 5.4%(+4.09)#50 | 6.8%(+2.77)#3,287 |
| 51. | North Liberty | 9.5% | 5.4%(+4.06)#51 | 6.8%(+2.73)#3,312 |
| 52. | Granger | 9.5% | 5.4%(+4.05)#52 | 6.8%(+2.72)#3,321 |
| 53. | Ankeny | 9.4% | 5.4%(+3.98)#53 | 6.8%(+2.66)#3,373 |
| 54. | Marion | 9.3% | 5.4%(+3.86)#54 | 6.8%(+2.53)#3,470 |
| 55. | Dayton | 9.2% | 5.4%(+3.72)#55 | 6.8%(+2.39)#3,581 |
| 56. | Clive | 9.0% | 5.4%(+3.58)#56 | 6.8%(+2.25)#3,697 |
| 57. | Kent Estates | 8.9% | 5.4%(+3.45)#57 | 6.8%(+2.13)#3,818 |
| 58. | Blue Grass | 8.9% | 5.4%(+3.41)#58 | 6.8%(+2.09)#3,856 |
| 59. | Nevada | 8.8% | 5.4%(+3.39)#59 | 6.8%(+2.07)#3,878 |
| 60. | South Amana | 8.8% | 5.4%(+3.39)#60 | 6.8%(+2.06)#3,886 |
| 61. | Urbandale | 8.8% | 5.4%(+3.33)#61 | 6.8%(+2.00)#3,928 |
| 62. | Pisgah | 8.7% | 5.4%(+3.26)#62 | 6.8%(+1.93)#3,982 |
| 63. | Urbana | 8.7% | 5.4%(+3.23)#63 | 6.8%(+1.91)#4,004 |
| 64. | Montezuma | 8.6% | 5.4%(+3.18)#64 | 6.8%(+1.86)#4,048 |
| 65. | Cumming | 8.6% | 5.4%(+3.16)#65 | 6.8%(+1.83)#4,066 |
| 66. | Granville | 8.6% | 5.4%(+3.13)#66 | 6.8%(+1.81)#4,101 |
| 67. | Houghton | 8.6% | 5.4%(+3.13)#67 | 6.8%(+1.81)#4,103 |
| 68. | Colwell | 8.6% | 5.4%(+3.13)#68 | 6.8%(+1.81)#4,106 |
| 69. | Fairfield | 8.4% | 5.4%(+2.92)#69 | 6.8%(+1.60)#4,303 |
| 70. | Slater | 8.3% | 5.4%(+2.90)#70 | 6.8%(+1.57)#4,327 |
| 71. | Bondurant | 8.3% | 5.4%(+2.85)#71 | 6.8%(+1.52)#4,381 |
| 72. | Janesville | 8.3% | 5.4%(+2.82)#72 | 6.8%(+1.50)#4,402 |
| 73. | Robins | 8.3% | 5.4%(+2.82)#73 | 6.8%(+1.49)#4,407 |
| 74. | Palo | 8.2% | 5.4%(+2.81)#74 | 6.8%(+1.48)#4,423 |
| 75. | Walford | 8.2% | 5.4%(+2.78)#75 | 6.8%(+1.46)#4,448 |
| 76. | Springville | 8.1% | 5.4%(+2.67)#76 | 6.8%(+1.34)#4,571 |
| 77. | Coralville | 8.1% | 5.4%(+2.67)#77 | 6.8%(+1.34)#4,577 |
| 78. | Mingo | 8.1% | 5.4%(+2.66)#78 | 6.8%(+1.33)#4,592 |
| 79. | Prairieburg | 8.0% | 5.4%(+2.61)#79 | 6.8%(+1.28)#4,642 |
| 80. | Bettendorf | 8.0% | 5.4%(+2.57)#80 | 6.8%(+1.24)#4,691 |
| 81. | Pella | 7.9% | 5.4%(+2.46)#81 | 6.8%(+1.13)#4,825 |
| 82. | Clermont | 7.9% | 5.4%(+2.46)#82 | 6.8%(+1.13)#4,828 |
| 83. | Conroy | 7.9% | 5.4%(+2.46)#83 | 6.8%(+1.13)#4,834 |
| 84. | Altoona | 7.9% | 5.4%(+2.43)#84 | 6.8%(+1.11)#4,858 |
| 85. | Little Sioux | 7.8% | 5.4%(+2.41)#85 | 6.8%(+1.08)#4,891 |
| 86. | Bertram | 7.8% | 5.4%(+2.32)#86 | 6.8%(+0.987)#5,002 |
| 87. | Lambs Grove | 7.7% | 5.4%(+2.31)#87 | 6.8%(+0.977)#5,019 |
| 88. | Dysart | 7.7% | 5.4%(+2.29)#88 | 6.8%(+0.958)#5,043 |
| 89. | Amana | 7.7% | 5.4%(+2.28)#89 | 6.8%(+0.948)#5,051 |
| 90. | Plainfield | 7.7% | 5.4%(+2.26)#90 | 6.8%(+0.928)#5,076 |
| 91. | Matlock | 7.7% | 5.4%(+2.26)#91 | 6.8%(+0.928)#5,081 |
| 92. | Franklin | 7.7% | 5.4%(+2.26)#92 | 6.8%(+0.928)#5,083 |
| 93. | Keomah Village | 7.7% | 5.4%(+2.26)#93 | 6.8%(+0.928)#5,084 |
| 94. | Mccallsburg | 7.6% | 5.4%(+2.20)#94 | 6.8%(+0.872)#5,154 |
| 95. | Iowa City | 7.6% | 5.4%(+2.19)#95 | 6.8%(+0.858)#5,167 |
| 96. | Tiffin | 7.6% | 5.4%(+2.17)#96 | 6.8%(+0.847)#5,182 |
| 97. | Cedar Rapids | 7.6% | 5.4%(+2.14)#97 | 6.8%(+0.808)#5,217 |
| 98. | Lorimor | 7.5% | 5.4%(+2.06)#98 | 6.8%(+0.735)#5,294 |
| 99. | Ely | 7.5% | 5.4%(+2.03)#99 | 6.8%(+0.706)#5,327 |
| 100. | Middle Amana | 7.4% | 5.4%(+1.92)#100 | 6.8%(+0.588)#5,475 |
Common Questions
What are the Top 10 Cities with the Highest Percentage of Population Employed in Computer, Engineering & Science in Iowa?
Top 10 Cities with the Highest Percentage of Population Employed in Computer, Engineering & Science in Iowa are:
#1
53.3%
#2
47.4%
#3
28.6%
#4
28.6%
#5
22.7%
#6
19.6%
#7
17.4%
#8
16.9%
#9
16.7%
#10
16.0%
What city has the Highest Percentage of Population Employed in Computer, Engineering & Science in Iowa?
Toeterville has the Highest Percentage of Population Employed in Computer, Engineering & Science in Iowa with 53.3%.
What is the Percentage of Population Employed in Computer, Engineering & Science in the State of Iowa?
Percentage of Population Employed in Computer, Engineering & Science in Iowa is 5.4%.
What is the Percentage of Population Employed in Computer, Engineering & Science in the United States?
Percentage of Population Employed in Computer, Engineering & Science in the United States is 6.8%.