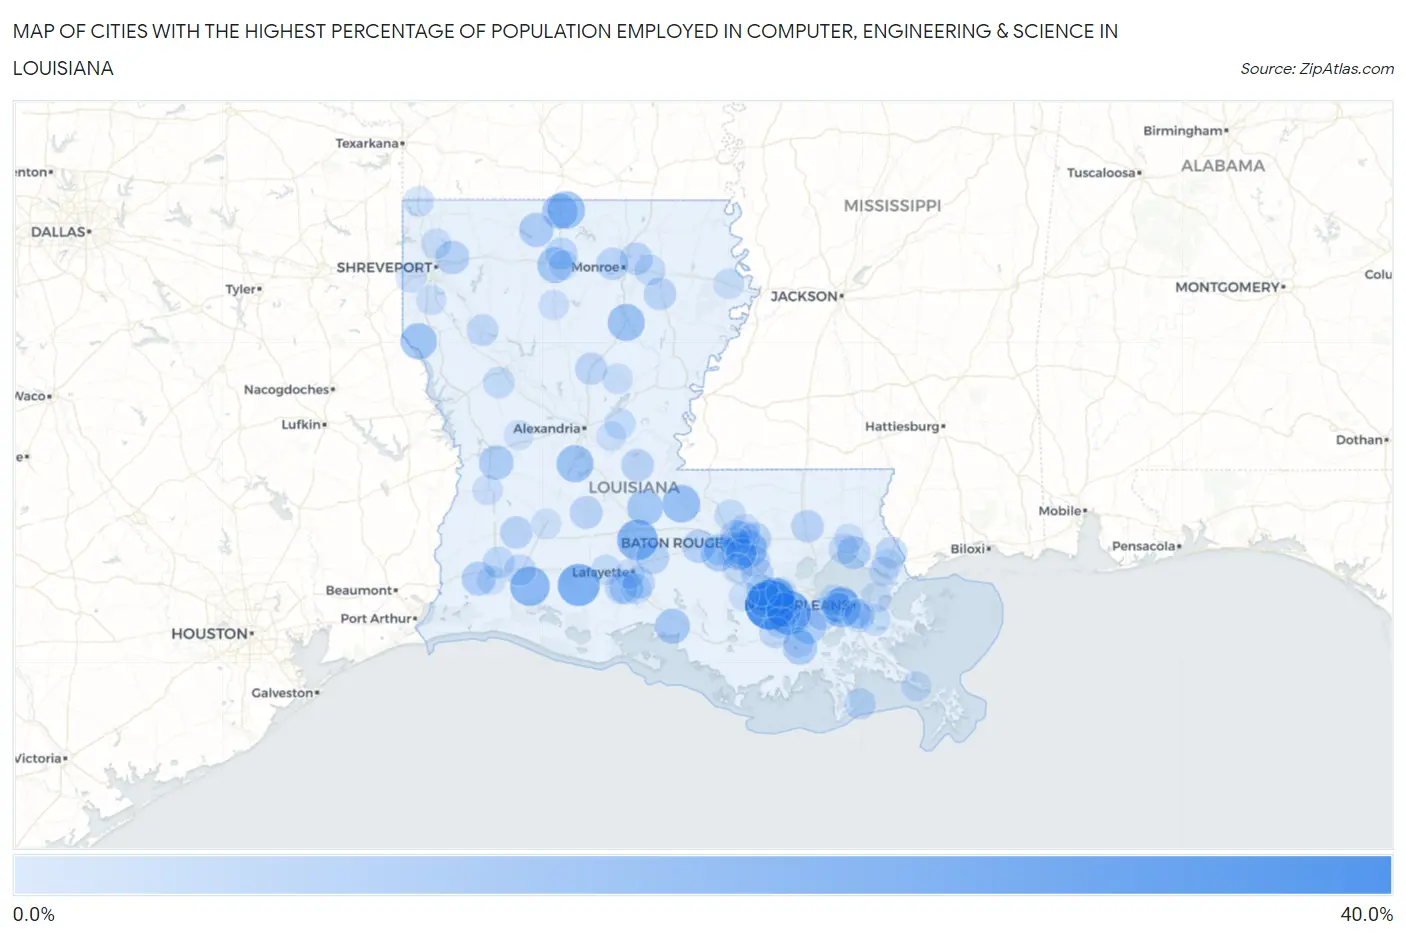
Cities with the Highest Percentage of Population Employed in Computer, Engineering & Science in Louisiana
RELATED REPORTS & OPTIONS
Computer, Engineering & Science
Louisiana
Compare Cities
Map of Cities with the Highest Percentage of Population Employed in Computer, Engineering & Science in Louisiana
0.0%
40.0%
Cities with the Highest Percentage of Population Employed in Computer, Engineering & Science in Louisiana
| City | % Employed | vs State | vs National | |
| 1. | Moonshine | 30.6% | 4.6%(+26.0)#1 | 6.8%(+23.8)#211 |
| 2. | Pleasure Bend | 23.0% | 4.6%(+18.4)#2 | 6.8%(+16.2)#400 |
| 3. | Morse | 20.5% | 4.6%(+15.9)#3 | 6.8%(+13.7)#534 |
| 4. | Leonville | 18.7% | 4.6%(+14.1)#4 | 6.8%(+12.0)#662 |
| 5. | Hester | 17.3% | 4.6%(+12.7)#5 | 6.8%(+10.5)#798 |
| 6. | Elmwood | 17.3% | 4.6%(+12.7)#6 | 6.8%(+10.5)#799 |
| 7. | Hayes | 17.2% | 4.6%(+12.6)#7 | 6.8%(+10.4)#808 |
| 8. | Morganza | 14.8% | 4.6%(+10.1)#8 | 6.8%(+7.99)#1,184 |
| 9. | Spearsville | 14.6% | 4.6%(+9.96)#9 | 6.8%(+7.80)#1,224 |
| 10. | Forest Hill | 13.8% | 4.6%(+9.22)#10 | 6.8%(+7.07)#1,387 |
| 11. | Columbia | 13.8% | 4.6%(+9.19)#11 | 6.8%(+7.03)#1,396 |
| 12. | Shenandoah | 13.4% | 4.6%(+8.77)#12 | 6.8%(+6.61)#1,523 |
| 13. | Stanley | 13.0% | 4.6%(+8.44)#13 | 6.8%(+6.28)#1,620 |
| 14. | Palmetto | 12.3% | 4.6%(+7.70)#14 | 6.8%(+5.54)#1,839 |
| 15. | Oak Hills Place | 12.3% | 4.6%(+7.69)#15 | 6.8%(+5.53)#1,844 |
| 16. | Grambling | 12.2% | 4.6%(+7.56)#16 | 6.8%(+5.40)#1,904 |
| 17. | Lillie | 11.9% | 4.6%(+7.33)#17 | 6.8%(+5.18)#1,961 |
| 18. | Addis | 11.5% | 4.6%(+6.88)#18 | 6.8%(+4.72)#2,129 |
| 19. | St James | 11.5% | 4.6%(+6.86)#19 | 6.8%(+4.70)#2,140 |
| 20. | Glencoe | 11.2% | 4.6%(+6.63)#20 | 6.8%(+4.47)#2,255 |
| 21. | Des Allemands | 11.1% | 4.6%(+6.45)#21 | 6.8%(+4.29)#2,347 |
| 22. | Fort Polk South | 10.8% | 4.6%(+6.18)#22 | 6.8%(+4.02)#2,473 |
| 23. | Lockport Heights | 10.6% | 4.6%(+5.97)#23 | 6.8%(+3.81)#2,593 |
| 24. | South Vacherie | 10.4% | 4.6%(+5.84)#24 | 6.8%(+3.68)#2,663 |
| 25. | Lisbon | 10.4% | 4.6%(+5.81)#25 | 6.8%(+3.65)#2,685 |
| 26. | Carlyss | 10.0% | 4.6%(+5.38)#26 | 6.8%(+3.22)#2,963 |
| 27. | Mandeville | 9.6% | 4.6%(+5.00)#27 | 6.8%(+2.84)#3,229 |
| 28. | Red Chute | 9.5% | 4.6%(+4.86)#28 | 6.8%(+2.70)#3,332 |
| 29. | Milton | 9.4% | 4.6%(+4.82)#29 | 6.8%(+2.66)#3,368 |
| 30. | Grosse Tete | 9.2% | 4.6%(+4.63)#30 | 6.8%(+2.47)#3,520 |
| 31. | Cecilia | 9.1% | 4.6%(+4.45)#31 | 6.8%(+2.29)#3,665 |
| 32. | Luling | 8.7% | 4.6%(+4.05)#32 | 6.8%(+1.89)#4,021 |
| 33. | Reddell | 8.6% | 4.6%(+4.01)#33 | 6.8%(+1.85)#4,052 |
| 34. | Inniswold | 8.5% | 4.6%(+3.89)#34 | 6.8%(+1.73)#4,184 |
| 35. | Swartz | 8.4% | 4.6%(+3.77)#35 | 6.8%(+1.62)#4,288 |
| 36. | Monticello | 8.4% | 4.6%(+3.75)#36 | 6.8%(+1.59)#4,311 |
| 37. | Reeves | 8.3% | 4.6%(+3.73)#37 | 6.8%(+1.57)#4,333 |
| 38. | Denham Springs | 8.3% | 4.6%(+3.71)#38 | 6.8%(+1.55)#4,358 |
| 39. | Merrydale | 8.3% | 4.6%(+3.65)#39 | 6.8%(+1.50)#4,403 |
| 40. | Moreauville | 8.3% | 4.6%(+3.65)#40 | 6.8%(+1.49)#4,405 |
| 41. | Mangham | 8.3% | 4.6%(+3.65)#41 | 6.8%(+1.49)#4,416 |
| 42. | Tickfaw | 8.3% | 4.6%(+3.64)#42 | 6.8%(+1.49)#4,418 |
| 43. | Maurice | 8.2% | 4.6%(+3.62)#43 | 6.8%(+1.46)#4,440 |
| 44. | Claiborne | 8.0% | 4.6%(+3.39)#44 | 6.8%(+1.23)#4,712 |
| 45. | Vienna | 8.0% | 4.6%(+3.37)#45 | 6.8%(+1.21)#4,741 |
| 46. | Gonzales | 7.9% | 4.6%(+3.25)#46 | 6.8%(+1.09)#4,869 |
| 47. | Georgetown | 7.8% | 4.6%(+3.17)#47 | 6.8%(+1.01)#4,967 |
| 48. | Prairieville | 7.8% | 4.6%(+3.15)#48 | 6.8%(+0.996)#4,989 |
| 49. | Brusly | 7.7% | 4.6%(+3.11)#49 | 6.8%(+0.956)#5,046 |
| 50. | Broussard | 7.6% | 4.6%(+3.04)#50 | 6.8%(+0.882)#5,136 |
| 51. | Centerville | 7.6% | 4.6%(+2.95)#51 | 6.8%(+0.793)#5,234 |
| 52. | Moss Bluff | 7.3% | 4.6%(+2.68)#52 | 6.8%(+0.526)#5,547 |
| 53. | Iowa | 7.2% | 4.6%(+2.58)#53 | 6.8%(+0.421)#5,672 |
| 54. | Edgefield | 7.2% | 4.6%(+2.58)#54 | 6.8%(+0.418)#5,677 |
| 55. | Pearl River | 7.2% | 4.6%(+2.57)#55 | 6.8%(+0.415)#5,683 |
| 56. | Lafourche Crossing | 7.0% | 4.6%(+2.44)#56 | 6.8%(+0.278)#5,898 |
| 57. | Grand Isle | 6.9% | 4.6%(+2.33)#57 | 6.8%(+0.169)#6,048 |
| 58. | Provencal | 6.9% | 4.6%(+2.29)#58 | 6.8%(+0.132)#6,107 |
| 59. | Poydras | 6.9% | 4.6%(+2.28)#59 | 6.8%(+0.118)#6,138 |
| 60. | Union | 6.9% | 4.6%(+2.26)#60 | 6.8%(+0.098)#6,158 |
| 61. | Choctaw | 6.8% | 4.6%(+2.22)#61 | 6.8%(+0.061)#6,217 |
| 62. | Harahan | 6.6% | 4.6%(+2.02)#62 | 6.8%(-0.137)#6,501 |
| 63. | Kenner | 6.5% | 4.6%(+1.92)#63 | 6.8%(-0.236)#6,659 |
| 64. | Deville | 6.5% | 4.6%(+1.92)#64 | 6.8%(-0.243)#6,667 |
| 65. | Baton Rouge | 6.4% | 4.6%(+1.83)#65 | 6.8%(-0.330)#6,807 |
| 66. | Zachary | 6.3% | 4.6%(+1.69)#66 | 6.8%(-0.469)#7,049 |
| 67. | Start | 6.3% | 4.6%(+1.68)#67 | 6.8%(-0.483)#7,078 |
| 68. | Rayne | 6.1% | 4.6%(+1.54)#68 | 6.8%(-0.621)#7,318 |
| 69. | New Orleans | 6.0% | 4.6%(+1.44)#69 | 6.8%(-0.717)#7,502 |
| 70. | Lutcher | 6.0% | 4.6%(+1.44)#70 | 6.8%(-0.721)#7,512 |
| 71. | Richmond | 6.0% | 4.6%(+1.43)#71 | 6.8%(-0.724)#7,517 |
| 72. | Youngsville | 6.0% | 4.6%(+1.42)#72 | 6.8%(-0.738)#7,540 |
| 73. | Mathews | 6.0% | 4.6%(+1.40)#73 | 6.8%(-0.759)#7,577 |
| 74. | Madisonville | 6.0% | 4.6%(+1.39)#74 | 6.8%(-0.773)#7,607 |
| 75. | Village St George | 6.0% | 4.6%(+1.36)#75 | 6.8%(-0.796)#7,653 |
| 76. | Metairie | 5.9% | 4.6%(+1.29)#76 | 6.8%(-0.872)#7,791 |
| 77. | St Gabriel | 5.8% | 4.6%(+1.23)#77 | 6.8%(-0.933)#7,935 |
| 78. | Benton | 5.8% | 4.6%(+1.19)#78 | 6.8%(-0.964)#7,990 |
| 79. | Midway | 5.7% | 4.6%(+1.13)#79 | 6.8%(-1.03)#8,110 |
| 80. | Ida | 5.7% | 4.6%(+1.11)#80 | 6.8%(-1.05)#8,151 |
| 81. | Greenwood | 5.7% | 4.6%(+1.07)#81 | 6.8%(-1.08)#8,204 |
| 82. | Deridder | 5.6% | 4.6%(+1.04)#82 | 6.8%(-1.12)#8,269 |
| 83. | Slidell | 5.5% | 4.6%(+0.933)#83 | 6.8%(-1.23)#8,451 |
| 84. | Stonewall | 5.5% | 4.6%(+0.888)#84 | 6.8%(-1.27)#8,535 |
| 85. | Lafayette | 5.5% | 4.6%(+0.845)#85 | 6.8%(-1.31)#8,634 |
| 86. | Central | 5.4% | 4.6%(+0.814)#86 | 6.8%(-1.34)#8,687 |
| 87. | Buras | 5.4% | 4.6%(+0.799)#87 | 6.8%(-1.36)#8,725 |
| 88. | Jonesboro | 5.3% | 4.6%(+0.726)#88 | 6.8%(-1.43)#8,876 |
| 89. | Timberlane | 5.3% | 4.6%(+0.660)#89 | 6.8%(-1.50)#8,993 |
| 90. | Simpson | 5.2% | 4.6%(+0.626)#90 | 6.8%(-1.53)#9,068 |
| 91. | Eden Isle | 5.2% | 4.6%(+0.614)#91 | 6.8%(-1.54)#9,088 |
| 92. | Oberlin | 5.2% | 4.6%(+0.611)#92 | 6.8%(-1.55)#9,096 |
| 93. | Ruston | 5.2% | 4.6%(+0.611)#93 | 6.8%(-1.55)#9,100 |
| 94. | Terrytown | 5.2% | 4.6%(+0.592)#94 | 6.8%(-1.57)#9,137 |
| 95. | River Ridge | 5.2% | 4.6%(+0.563)#95 | 6.8%(-1.60)#9,195 |
| 96. | Belle Rose | 5.2% | 4.6%(+0.554)#96 | 6.8%(-1.60)#9,213 |
| 97. | Covington | 5.1% | 4.6%(+0.514)#97 | 6.8%(-1.64)#9,298 |
| 98. | Center Point | 5.1% | 4.6%(+0.503)#98 | 6.8%(-1.66)#9,319 |
| 99. | Prien | 5.1% | 4.6%(+0.484)#99 | 6.8%(-1.67)#9,365 |
| 100. | Gretna | 5.0% | 4.6%(+0.442)#100 | 6.8%(-1.72)#9,466 |
Common Questions
What are the Top 10 Cities with the Highest Percentage of Population Employed in Computer, Engineering & Science in Louisiana?
Top 10 Cities with the Highest Percentage of Population Employed in Computer, Engineering & Science in Louisiana are:
#1
30.6%
#2
23.0%
#3
20.5%
#4
18.7%
#5
17.3%
#6
17.3%
#7
17.2%
#8
14.8%
#9
14.6%
#10
13.8%
What city has the Highest Percentage of Population Employed in Computer, Engineering & Science in Louisiana?
Moonshine has the Highest Percentage of Population Employed in Computer, Engineering & Science in Louisiana with 30.6%.
What is the Percentage of Population Employed in Computer, Engineering & Science in the State of Louisiana?
Percentage of Population Employed in Computer, Engineering & Science in Louisiana is 4.6%.
What is the Percentage of Population Employed in Computer, Engineering & Science in the United States?
Percentage of Population Employed in Computer, Engineering & Science in the United States is 6.8%.