San Mateo, CA Map & Demographics
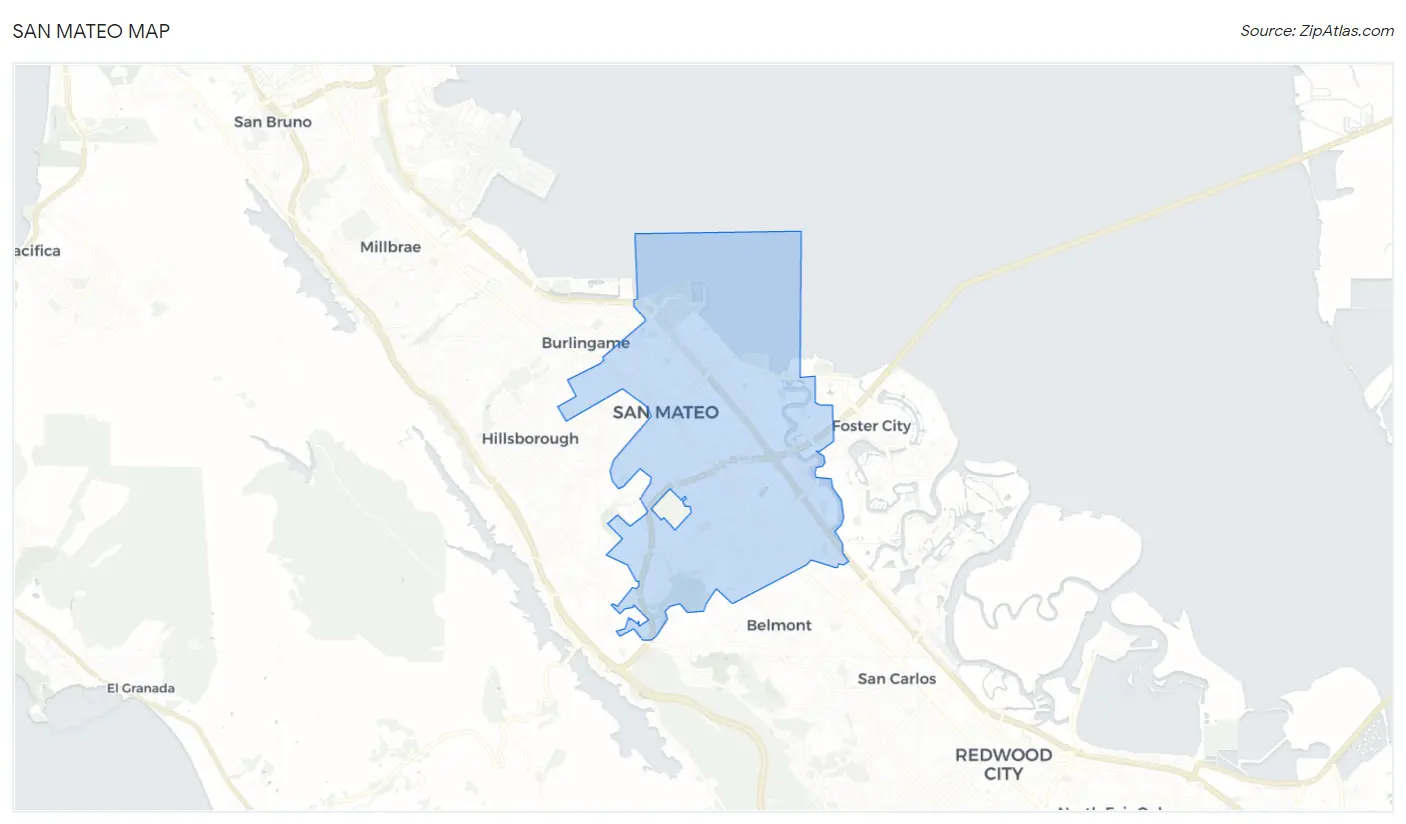
San Mateo Map
San Mateo Overview
$78,990
PER CAPITA INCOME
$182,227
AVG FAMILY INCOME
$149,152
AVG HOUSEHOLD INCOME
20.2%
WAGE / INCOME GAP [ % ]
79.8¢/ $1
WAGE / INCOME GAP [ $ ]
$11,079
FAMILY INCOME DEFICIT
0.47
INEQUALITY / GINI INDEX
104,165
TOTAL POPULATION
51,998
MALE POPULATION
52,167
FEMALE POPULATION
99.68
MALES / 100 FEMALES
100.33
FEMALES / 100 MALES
38.1
MEDIAN AGE
3.2
AVG FAMILY SIZE
2.6
AVG HOUSEHOLD SIZE
60,081
LABOR FORCE [ PEOPLE ]
70.1%
PERCENT IN LABOR FORCE
4.7%
UNEMPLOYMENT RATE
San Mateo Area Codes
Income in San Mateo
Income Overview in San Mateo
Per Capita Income in San Mateo is $78,990, while median incomes of families and households are $182,227 and $149,152 respectively.
| Characteristic | Number | Measure |
| Per Capita Income | 104,165 | $78,990 |
| Median Family Income | 25,005 | $182,227 |
| Mean Family Income | 25,005 | $236,395 |
| Median Household Income | 39,916 | $149,152 |
| Mean Household Income | 39,916 | $201,146 |
| Income Deficit | 25,005 | $11,079 |
| Wage / Income Gap (%) | 104,165 | 20.17% |
| Wage / Income Gap ($) | 104,165 | 79.83¢ per $1 |
| Gini / Inequality Index | 104,165 | 0.47 |
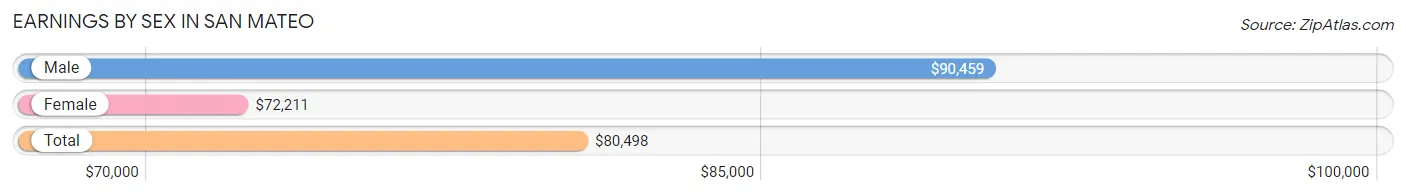
Earnings by Sex in San Mateo
Average Earnings in San Mateo are $80,498, $90,459 for men and $72,211 for women, a difference of 20.2%.
| Sex | Number | Average Earnings |
| Male | 33,955 (54.7%) | $90,459 |
| Female | 28,153 (45.3%) | $72,211 |
| Total | 62,108 (100.0%) | $80,498 |
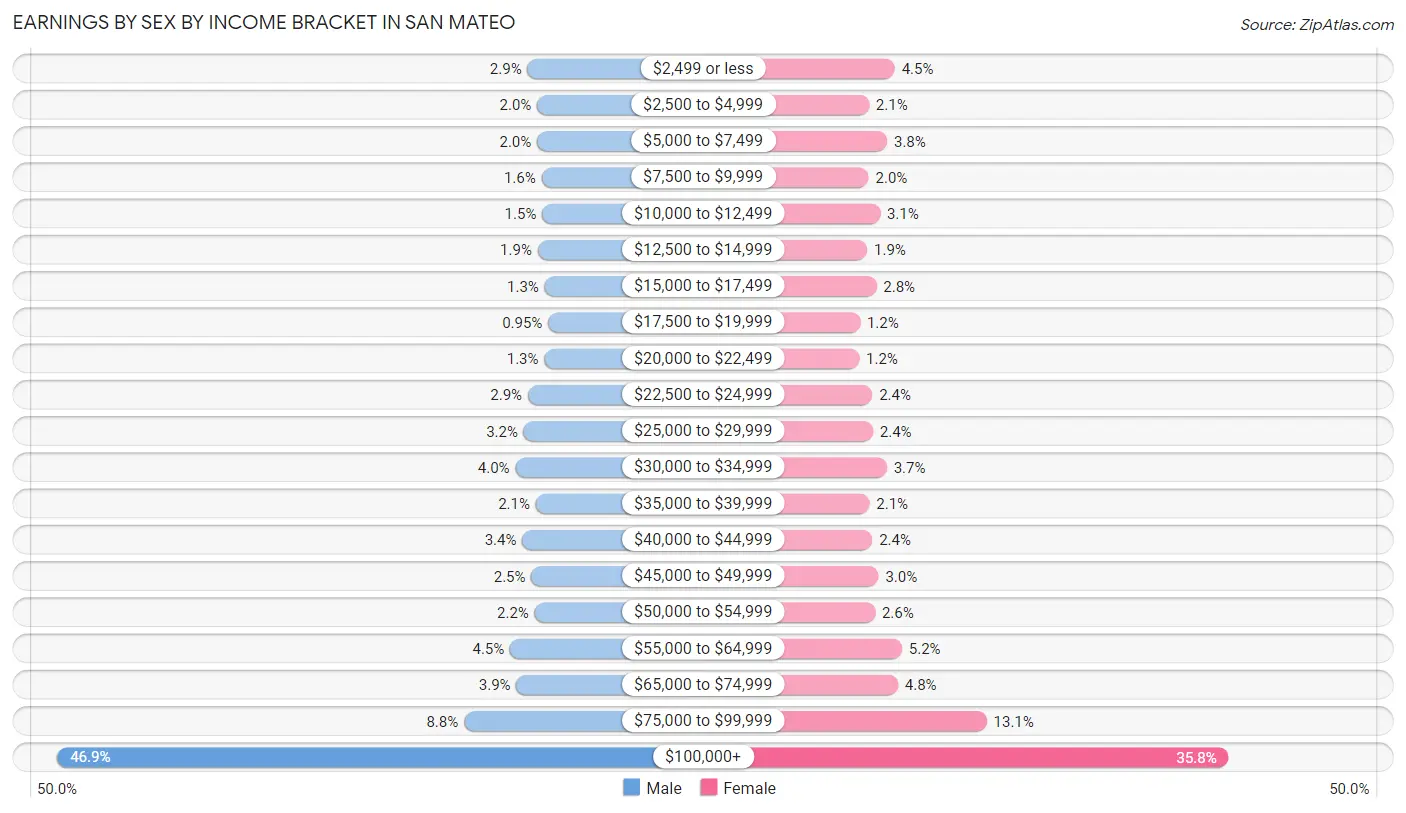
Earnings by Sex by Income Bracket in San Mateo
The most common earnings brackets in San Mateo are $100,000+ for men (15,937 | 46.9%) and $100,000+ for women (10,067 | 35.8%).
| Income | Male | Female |
| $2,499 or less | 982 (2.9%) | 1,263 (4.5%) |
| $2,500 to $4,999 | 672 (2.0%) | 582 (2.1%) |
| $5,000 to $7,499 | 676 (2.0%) | 1,060 (3.8%) |
| $7,500 to $9,999 | 534 (1.6%) | 574 (2.0%) |
| $10,000 to $12,499 | 512 (1.5%) | 876 (3.1%) |
| $12,500 to $14,999 | 657 (1.9%) | 535 (1.9%) |
| $15,000 to $17,499 | 436 (1.3%) | 780 (2.8%) |
| $17,500 to $19,999 | 323 (0.9%) | 346 (1.2%) |
| $20,000 to $22,499 | 445 (1.3%) | 323 (1.1%) |
| $22,500 to $24,999 | 969 (2.9%) | 671 (2.4%) |
| $25,000 to $29,999 | 1,101 (3.2%) | 687 (2.4%) |
| $30,000 to $34,999 | 1,366 (4.0%) | 1,054 (3.7%) |
| $35,000 to $39,999 | 718 (2.1%) | 595 (2.1%) |
| $40,000 to $44,999 | 1,148 (3.4%) | 671 (2.4%) |
| $45,000 to $49,999 | 860 (2.5%) | 837 (3.0%) |
| $50,000 to $54,999 | 754 (2.2%) | 743 (2.6%) |
| $55,000 to $64,999 | 1,534 (4.5%) | 1,453 (5.2%) |
| $65,000 to $74,999 | 1,334 (3.9%) | 1,347 (4.8%) |
| $75,000 to $99,999 | 2,997 (8.8%) | 3,689 (13.1%) |
| $100,000+ | 15,937 (46.9%) | 10,067 (35.8%) |
| Total | 33,955 (100.0%) | 28,153 (100.0%) |
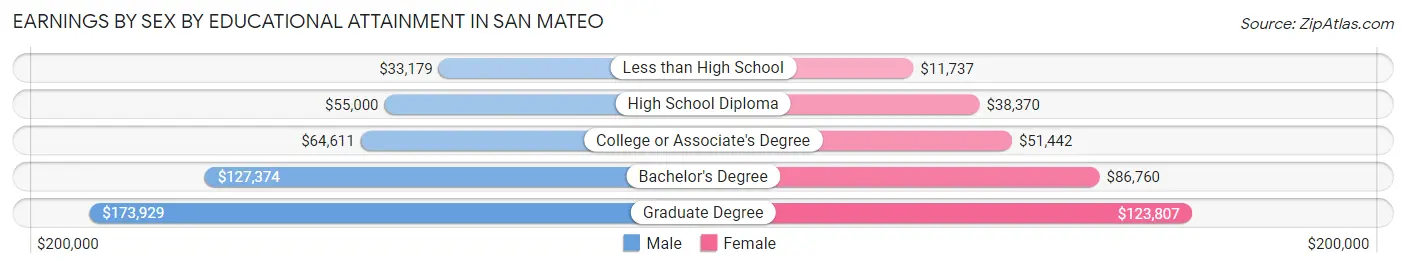
Earnings by Sex by Educational Attainment in San Mateo
Average earnings in San Mateo are $106,132 for men and $80,573 for women, a difference of 24.1%. Men with an educational attainment of graduate degree enjoy the highest average annual earnings of $173,929, while those with less than high school education earn the least with $33,179. Women with an educational attainment of graduate degree earn the most with the average annual earnings of $123,807, while those with less than high school education have the smallest earnings of $11,737.
| Educational Attainment | Male Income | Female Income |
| Less than High School | $33,179 | $11,737 |
| High School Diploma | $55,000 | $38,370 |
| College or Associate's Degree | $64,611 | $51,442 |
| Bachelor's Degree | $127,374 | $86,760 |
| Graduate Degree | $173,929 | $123,807 |
| Total | $106,132 | $80,573 |
Family Income in San Mateo
Family Income Brackets in San Mateo
According to the San Mateo family income data, there are 11,152 families falling into the $200,000+ income range, which is the most common income bracket and makes up 44.6% of all families. Conversely, the $10,000 to $14,999 income bracket is the least frequent group with only 150 families (0.6%) belonging to this category.
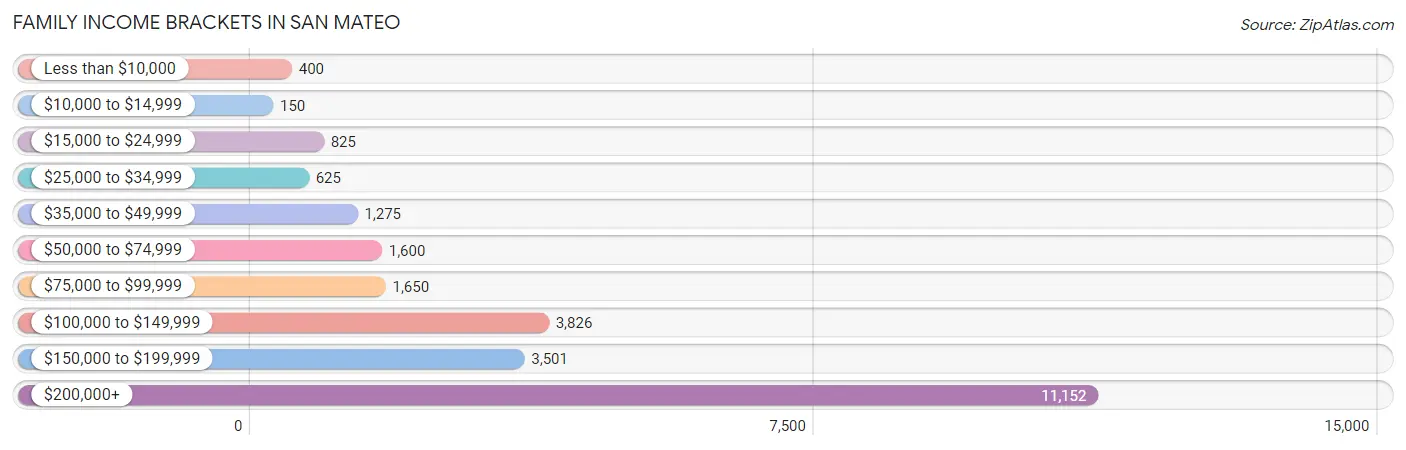
| Income Bracket | # Families | % Families |
| Less than $10,000 | 400 | 1.6% |
| $10,000 to $14,999 | 150 | 0.6% |
| $15,000 to $24,999 | 825 | 3.3% |
| $25,000 to $34,999 | 625 | 2.5% |
| $35,000 to $49,999 | 1,275 | 5.1% |
| $50,000 to $74,999 | 1,600 | 6.4% |
| $75,000 to $99,999 | 1,650 | 6.6% |
| $100,000 to $149,999 | 3,826 | 15.3% |
| $150,000 to $199,999 | 3,501 | 14.0% |
| $200,000+ | 11,152 | 44.6% |
Family Income by Famaliy Size in San Mateo
4-person families (5,508 | 22.0%) account for the highest median family income in San Mateo with $236,773 per family, while 2-person families (11,212 | 44.8%) have the highest median income of $73,296 per family member.
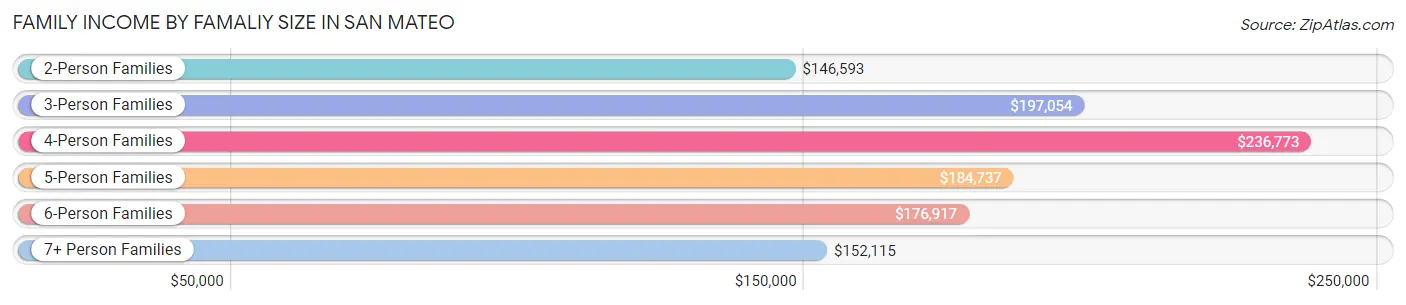
| Income Bracket | # Families | Median Income |
| 2-Person Families | 11,212 (44.8%) | $146,593 |
| 3-Person Families | 5,770 (23.1%) | $197,054 |
| 4-Person Families | 5,508 (22.0%) | $236,773 |
| 5-Person Families | 1,584 (6.3%) | $184,737 |
| 6-Person Families | 583 (2.3%) | $176,917 |
| 7+ Person Families | 348 (1.4%) | $152,115 |
| Total | 25,005 (100.0%) | $182,227 |
Family Income by Number of Earners in San Mateo
The median family income in San Mateo is $182,227, with families comprising 2 earners (12,249) having the highest median family income of $231,722, while families with no earners (2,467) have the lowest median family income of $79,158, accounting for 49.0% and 9.9% of families, respectively.
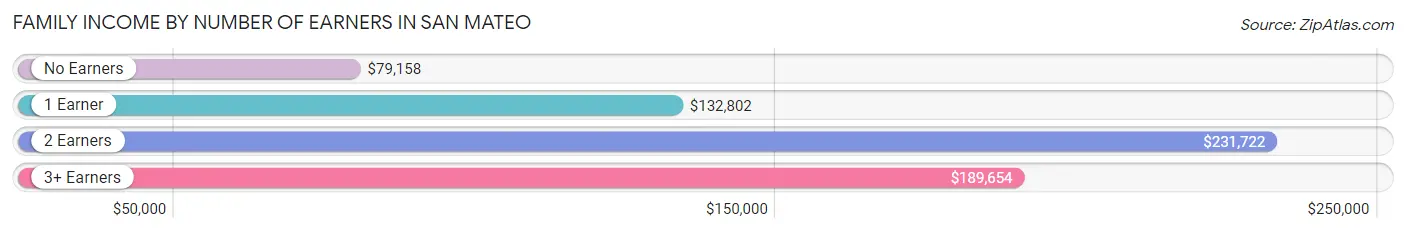
| Number of Earners | # Families | Median Income |
| No Earners | 2,467 (9.9%) | $79,158 |
| 1 Earner | 6,850 (27.4%) | $132,802 |
| 2 Earners | 12,249 (49.0%) | $231,722 |
| 3+ Earners | 3,439 (13.8%) | $189,654 |
| Total | 25,005 (100.0%) | $182,227 |
Household Income in San Mateo
Household Income Brackets in San Mateo
With 14,490 households falling in the category, the $200,000+ income range is the most frequent in San Mateo, accounting for 36.3% of all households. In contrast, only 599 households (1.5%) fall into the $10,000 to $14,999 income bracket, making it the least populous group.
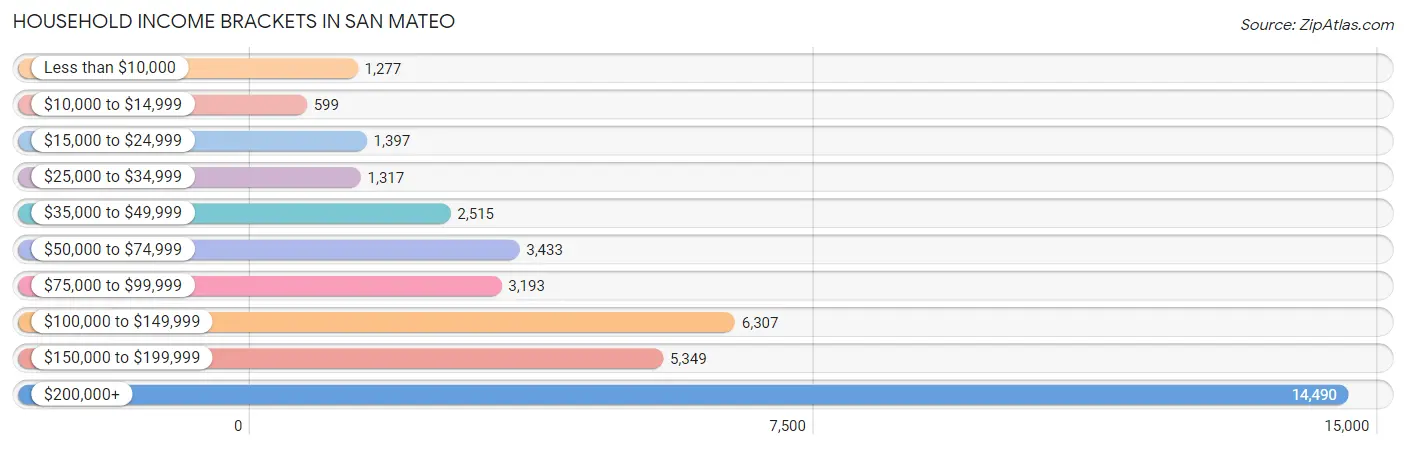
| Income Bracket | # Households | % Households |
| Less than $10,000 | 1,277 | 3.2% |
| $10,000 to $14,999 | 599 | 1.5% |
| $15,000 to $24,999 | 1,397 | 3.5% |
| $25,000 to $34,999 | 1,317 | 3.3% |
| $35,000 to $49,999 | 2,515 | 6.3% |
| $50,000 to $74,999 | 3,433 | 8.6% |
| $75,000 to $99,999 | 3,193 | 8.0% |
| $100,000 to $149,999 | 6,307 | 15.8% |
| $150,000 to $199,999 | 5,349 | 13.4% |
| $200,000+ | 14,490 | 36.3% |
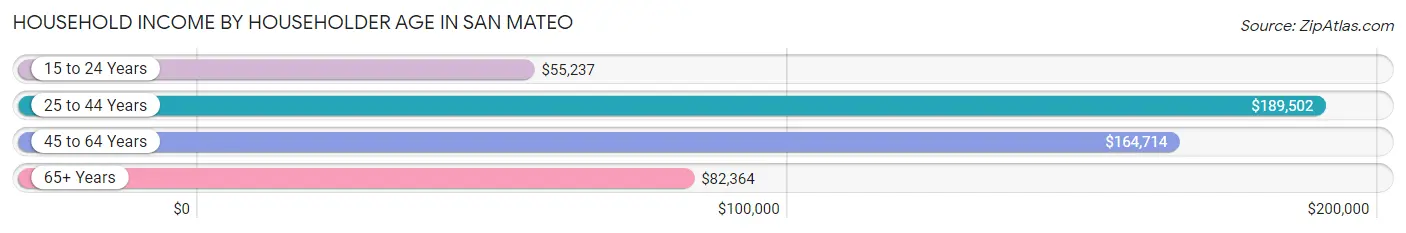
Household Income by Householder Age in San Mateo
The median household income in San Mateo is $149,152, with the highest median household income of $189,502 found in the 25 to 44 years age bracket for the primary householder. A total of 15,633 households (39.2%) fall into this category. Meanwhile, the 15 to 24 years age bracket for the primary householder has the lowest median household income of $55,237, with 857 households (2.1%) in this group.
| Income Bracket | # Households | Median Income |
| 15 to 24 Years | 857 (2.1%) | $55,237 |
| 25 to 44 Years | 15,633 (39.2%) | $189,502 |
| 45 to 64 Years | 13,297 (33.3%) | $164,714 |
| 65+ Years | 10,129 (25.4%) | $82,364 |
| Total | 39,916 (100.0%) | $149,152 |
Poverty in San Mateo
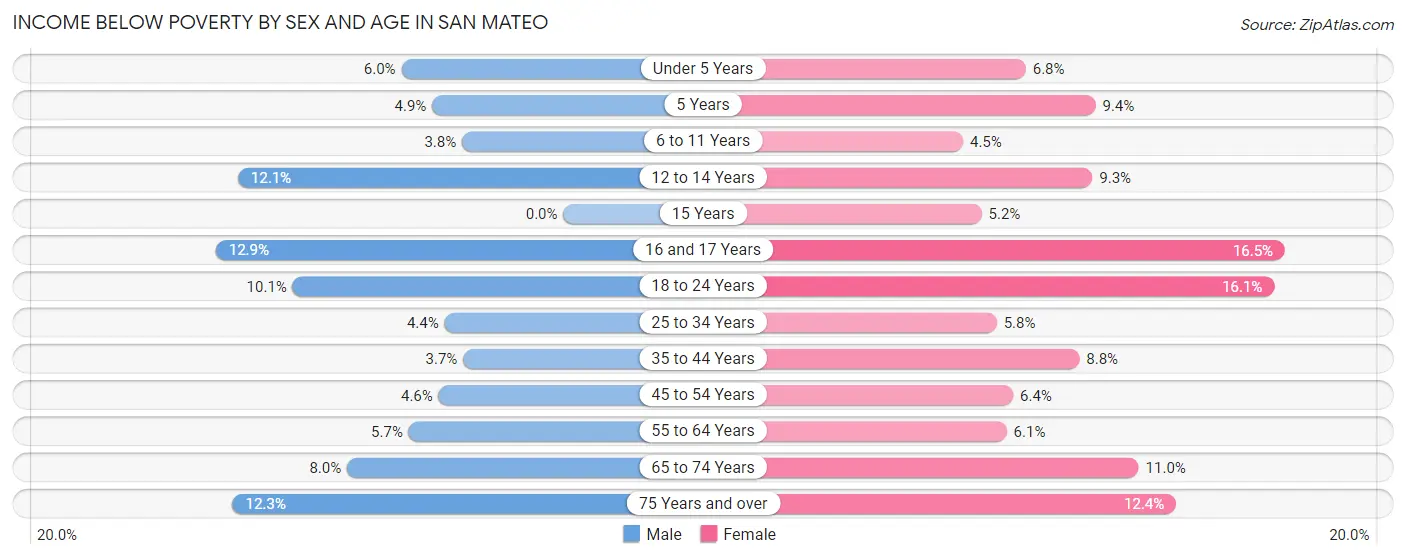
Income Below Poverty by Sex and Age in San Mateo
With 6.1% poverty level for males and 8.5% for females among the residents of San Mateo, 16 and 17 year old males and 16 and 17 year old females are the most vulnerable to poverty, with 137 males (12.9%) and 154 females (16.5%) in their respective age groups living below the poverty level.
| Age Bracket | Male | Female |
| Under 5 Years | 201 (6.0%) | 192 (6.8%) |
| 5 Years | 19 (4.9%) | 50 (9.4%) |
| 6 to 11 Years | 133 (3.8%) | 144 (4.5%) |
| 12 to 14 Years | 194 (12.1%) | 165 (9.3%) |
| 15 Years | 0 (0.0%) | 25 (5.2%) |
| 16 and 17 Years | 137 (12.9%) | 154 (16.5%) |
| 18 to 24 Years | 387 (10.1%) | 546 (16.1%) |
| 25 to 34 Years | 433 (4.4%) | 493 (5.8%) |
| 35 to 44 Years | 297 (3.7%) | 696 (8.8%) |
| 45 to 54 Years | 304 (4.6%) | 398 (6.4%) |
| 55 to 64 Years | 345 (5.7%) | 382 (6.1%) |
| 65 to 74 Years | 329 (8.0%) | 515 (11.0%) |
| 75 Years and over | 361 (12.3%) | 633 (12.4%) |
| Total | 3,140 (6.1%) | 4,393 (8.5%) |
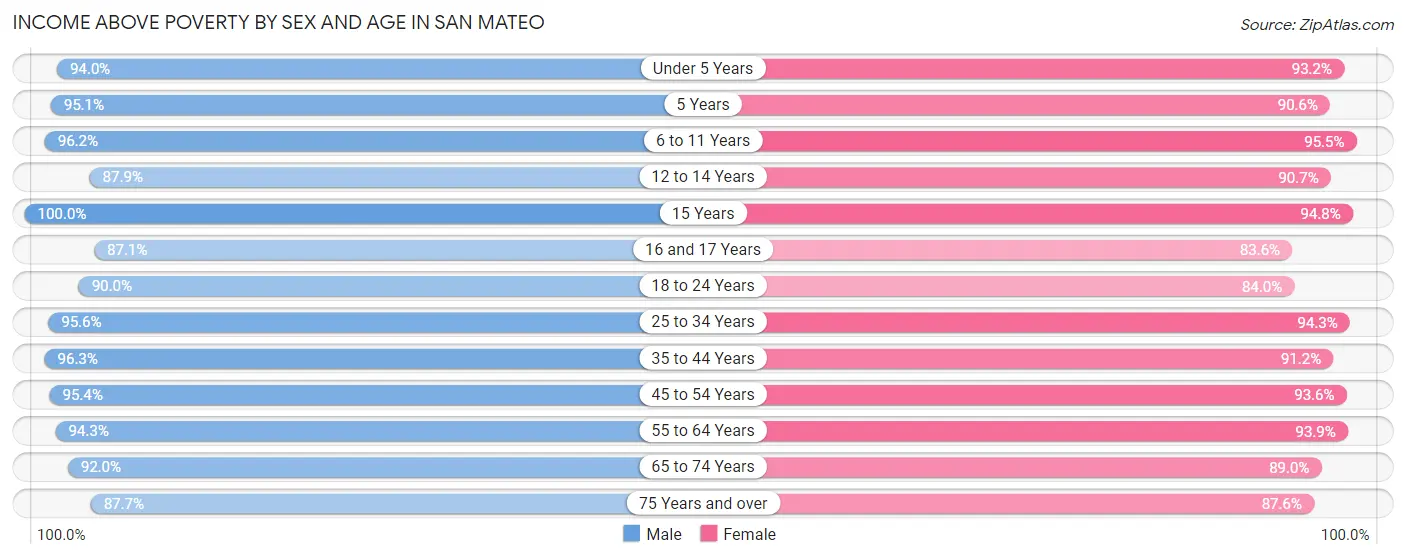
Income Above Poverty by Sex and Age in San Mateo
According to the poverty statistics in San Mateo, males aged 15 years and females aged 6 to 11 years are the age groups that are most secure financially, with 100.0% of males and 95.5% of females in these age groups living above the poverty line.
| Age Bracket | Male | Female |
| Under 5 Years | 3,145 (94.0%) | 2,618 (93.2%) |
| 5 Years | 371 (95.1%) | 481 (90.6%) |
| 6 to 11 Years | 3,403 (96.2%) | 3,054 (95.5%) |
| 12 to 14 Years | 1,412 (87.9%) | 1,609 (90.7%) |
| 15 Years | 448 (100.0%) | 457 (94.8%) |
| 16 and 17 Years | 925 (87.1%) | 782 (83.6%) |
| 18 to 24 Years | 3,464 (89.9%) | 2,855 (84.0%) |
| 25 to 34 Years | 9,385 (95.6%) | 8,081 (94.3%) |
| 35 to 44 Years | 7,693 (96.3%) | 7,192 (91.2%) |
| 45 to 54 Years | 6,264 (95.4%) | 5,860 (93.6%) |
| 55 to 64 Years | 5,665 (94.3%) | 5,856 (93.9%) |
| 65 to 74 Years | 3,770 (92.0%) | 4,157 (89.0%) |
| 75 Years and over | 2,578 (87.7%) | 4,469 (87.6%) |
| Total | 48,523 (93.9%) | 47,471 (91.5%) |
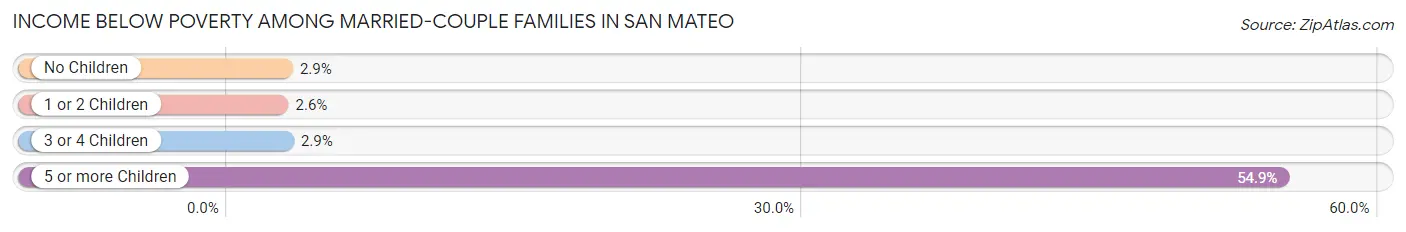
Income Below Poverty Among Married-Couple Families in San Mateo
The poverty statistics for married-couple families in San Mateo show that 2.9% or 575 of the total 19,706 families live below the poverty line. Families with 5 or more children have the highest poverty rate of 54.9%, comprising of 28 families. On the other hand, families with 1 or 2 children have the lowest poverty rate of 2.6%, which includes 209 families.
| Children | Above Poverty | Below Poverty |
| No Children | 10,747 (97.1%) | 318 (2.9%) |
| 1 or 2 Children | 7,695 (97.4%) | 209 (2.6%) |
| 3 or 4 Children | 666 (97.1%) | 20 (2.9%) |
| 5 or more Children | 23 (45.1%) | 28 (54.9%) |
| Total | 19,131 (97.1%) | 575 (2.9%) |
Income Below Poverty Among Single-Parent Households in San Mateo
According to the poverty data in San Mateo, 9.0% or 163 single-father households and 10.2% or 354 single-mother households are living below the poverty line. Among single-father households, those with 3 or 4 children have the highest poverty rate, with 43 households (46.2%) experiencing poverty. Likewise, among single-mother households, those with 3 or 4 children have the highest poverty rate, with 126 households (48.3%) falling below the poverty line.
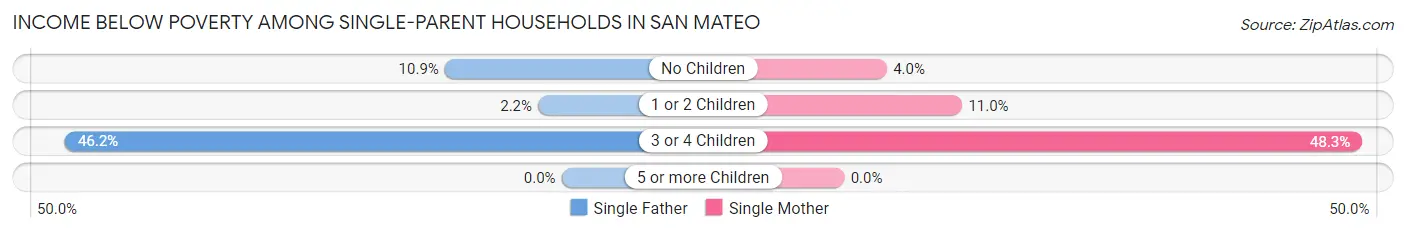
| Children | Single Father | Single Mother |
| No Children | 103 (10.9%) | 71 (4.0%) |
| 1 or 2 Children | 17 (2.2%) | 157 (11.0%) |
| 3 or 4 Children | 43 (46.2%) | 126 (48.3%) |
| 5 or more Children | 0 (0.0%) | 0 (0.0%) |
| Total | 163 (9.0%) | 354 (10.2%) |
Income Below Poverty Among Married-Couple vs Single-Parent Households in San Mateo
The poverty data for San Mateo shows that 575 of the married-couple family households (2.9%) and 517 of the single-parent households (9.8%) are living below the poverty level. Within the married-couple family households, those with 5 or more children have the highest poverty rate, with 28 households (54.9%) falling below the poverty line. Among the single-parent households, those with 3 or 4 children have the highest poverty rate, with 169 household (47.7%) living below poverty.
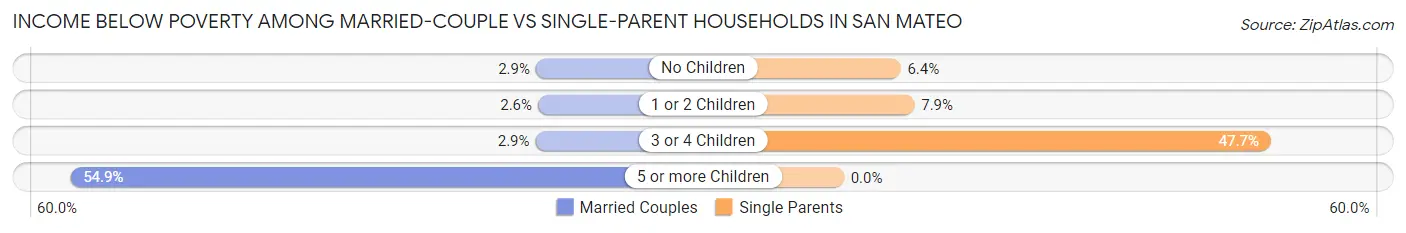
| Children | Married-Couple Families | Single-Parent Households |
| No Children | 318 (2.9%) | 174 (6.4%) |
| 1 or 2 Children | 209 (2.6%) | 174 (7.9%) |
| 3 or 4 Children | 20 (2.9%) | 169 (47.7%) |
| 5 or more Children | 28 (54.9%) | 0 (0.0%) |
| Total | 575 (2.9%) | 517 (9.8%) |
Race in San Mateo
The most populous races in San Mateo are White / Caucasian (46,128 | 44.3%), Asian (28,109 | 27.0%), and Hispanic or Latino (25,743 | 24.7%).
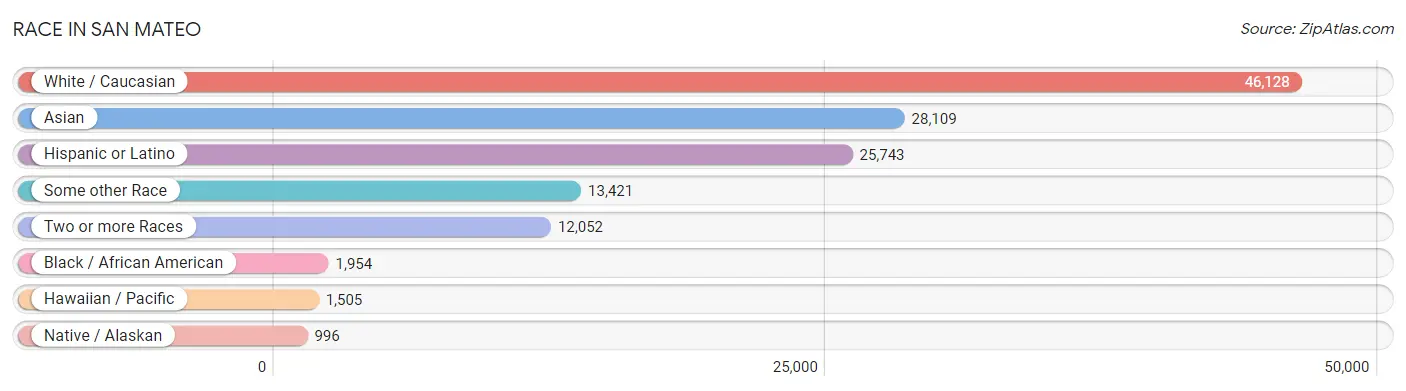
| Race | # Population | % Population |
| Asian | 28,109 | 27.0% |
| Black / African American | 1,954 | 1.9% |
| Hawaiian / Pacific | 1,505 | 1.4% |
| Hispanic or Latino | 25,743 | 24.7% |
| Native / Alaskan | 996 | 1.0% |
| White / Caucasian | 46,128 | 44.3% |
| Two or more Races | 12,052 | 11.6% |
| Some other Race | 13,421 | 12.9% |
| Total | 104,165 | 100.0% |
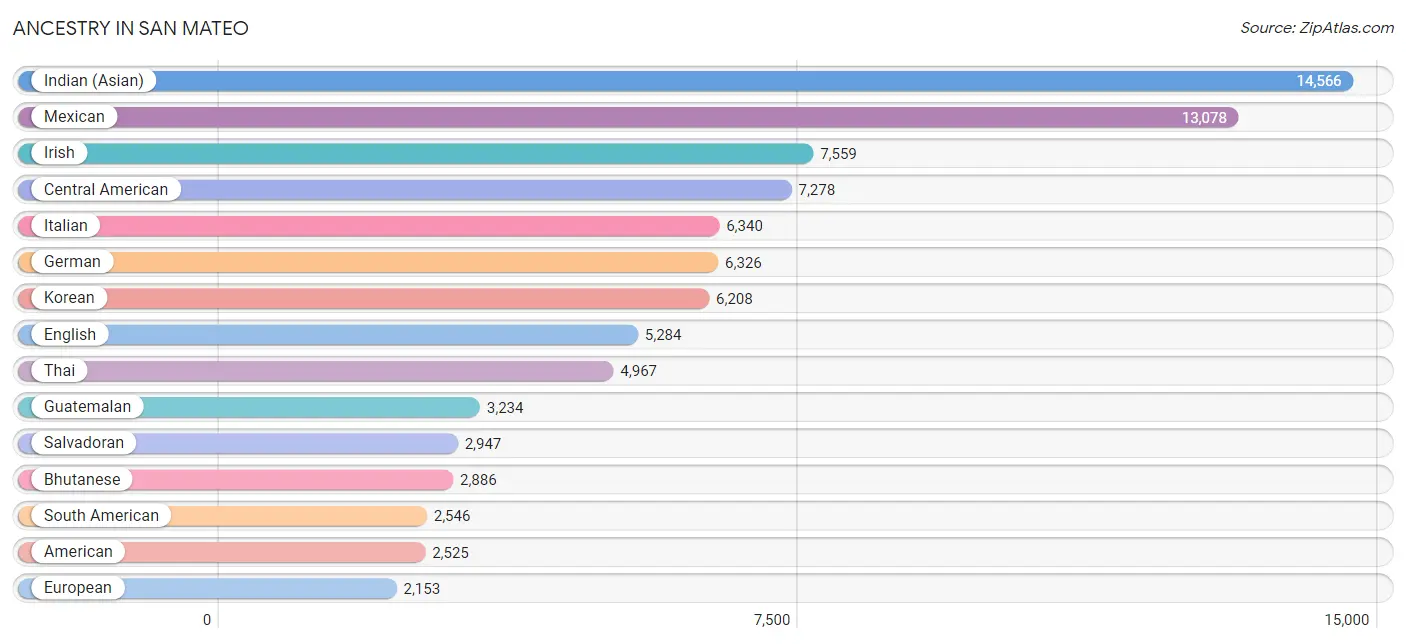
Ancestry in San Mateo
The most populous ancestries reported in San Mateo are Indian (Asian) (14,566 | 14.0%), Mexican (13,078 | 12.6%), Irish (7,559 | 7.3%), Central American (7,278 | 7.0%), and Italian (6,340 | 6.1%), together accounting for 46.9% of all San Mateo residents.
| Ancestry | # Population | % Population |
| Afghan | 143 | 0.1% |
| African | 55 | 0.1% |
| Albanian | 7 | 0.0% |
| American | 2,525 | 2.4% |
| Apache | 37 | 0.0% |
| Arab | 1,537 | 1.5% |
| Argentinean | 165 | 0.2% |
| Armenian | 391 | 0.4% |
| Assyrian / Chaldean / Syriac | 29 | 0.0% |
| Australian | 77 | 0.1% |
| Austrian | 400 | 0.4% |
| Basque | 25 | 0.0% |
| Belgian | 16 | 0.0% |
| Belizean | 92 | 0.1% |
| Bhutanese | 2,886 | 2.8% |
| Blackfeet | 105 | 0.1% |
| Bolivian | 105 | 0.1% |
| Brazilian | 320 | 0.3% |
| British | 614 | 0.6% |
| Bulgarian | 35 | 0.0% |
| Burmese | 2,149 | 2.1% |
| Canadian | 251 | 0.2% |
| Central American | 7,278 | 7.0% |
| Central American Indian | 256 | 0.3% |
| Cherokee | 262 | 0.3% |
| Chickasaw | 11 | 0.0% |
| Chilean | 304 | 0.3% |
| Chinese | 10 | 0.0% |
| Chippewa | 4 | 0.0% |
| Choctaw | 10 | 0.0% |
| Colombian | 337 | 0.3% |
| Costa Rican | 42 | 0.0% |
| Cree | 14 | 0.0% |
| Croatian | 246 | 0.2% |
| Cuban | 355 | 0.3% |
| Czech | 226 | 0.2% |
| Czechoslovakian | 34 | 0.0% |
| Danish | 369 | 0.4% |
| Delaware | 8 | 0.0% |
| Dominican | 70 | 0.1% |
| Dutch | 694 | 0.7% |
| Eastern European | 567 | 0.5% |
| Ecuadorian | 51 | 0.1% |
| Egyptian | 194 | 0.2% |
| English | 5,284 | 5.1% |
| Estonian | 18 | 0.0% |
| European | 2,153 | 2.1% |
| Filipino | 826 | 0.8% |
| Finnish | 65 | 0.1% |
| French | 2,094 | 2.0% |
| French American Indian | 8 | 0.0% |
| French Canadian | 251 | 0.2% |
| German | 6,326 | 6.1% |
| German Russian | 10 | 0.0% |
| Greek | 977 | 0.9% |
| Guamanian / Chamorro | 58 | 0.1% |
| Guatemalan | 3,234 | 3.1% |
| Guyanese | 22 | 0.0% |
| Haitian | 29 | 0.0% |
| Honduran | 83 | 0.1% |
| Hungarian | 336 | 0.3% |
| Icelander | 9 | 0.0% |
| Indian (Asian) | 14,566 | 14.0% |
| Indonesian | 160 | 0.2% |
| Inupiat | 20 | 0.0% |
| Iranian | 670 | 0.6% |
| Iraqi | 26 | 0.0% |
| Irish | 7,559 | 7.3% |
| Israeli | 72 | 0.1% |
| Italian | 6,340 | 6.1% |
| Jamaican | 137 | 0.1% |
| Japanese | 110 | 0.1% |
| Jordanian | 112 | 0.1% |
| Korean | 6,208 | 6.0% |
| Laotian | 146 | 0.1% |
| Latvian | 24 | 0.0% |
| Lebanese | 364 | 0.4% |
| Lithuanian | 104 | 0.1% |
| Macedonian | 16 | 0.0% |
| Malaysian | 13 | 0.0% |
| Maltese | 182 | 0.2% |
| Mexican | 13,078 | 12.6% |
| Mexican American Indian | 669 | 0.6% |
| Moroccan | 64 | 0.1% |
| Native Hawaiian | 199 | 0.2% |
| Navajo | 32 | 0.0% |
| New Zealander | 13 | 0.0% |
| Nicaraguan | 847 | 0.8% |
| Nigerian | 285 | 0.3% |
| Northern European | 496 | 0.5% |
| Norwegian | 1,334 | 1.3% |
| Okinawan | 82 | 0.1% |
| Ottawa | 3 | 0.0% |
| Pakistani | 118 | 0.1% |
| Palestinian | 121 | 0.1% |
| Panamanian | 102 | 0.1% |
| Pennsylvania German | 11 | 0.0% |
| Peruvian | 1,444 | 1.4% |
| Polish | 1,574 | 1.5% |
| Portuguese | 897 | 0.9% |
| Pueblo | 18 | 0.0% |
| Puerto Rican | 496 | 0.5% |
| Romanian | 234 | 0.2% |
| Russian | 1,561 | 1.5% |
| Salvadoran | 2,947 | 2.8% |
| Samoan | 180 | 0.2% |
| Scandinavian | 325 | 0.3% |
| Scotch-Irish | 523 | 0.5% |
| Scottish | 1,787 | 1.7% |
| Seminole | 52 | 0.1% |
| Serbian | 114 | 0.1% |
| Sioux | 13 | 0.0% |
| Slavic | 56 | 0.1% |
| Slovak | 52 | 0.1% |
| Slovene | 23 | 0.0% |
| South American | 2,546 | 2.4% |
| South American Indian | 18 | 0.0% |
| Spaniard | 700 | 0.7% |
| Spanish | 196 | 0.2% |
| Spanish American | 32 | 0.0% |
| Sri Lankan | 1,080 | 1.0% |
| Subsaharan African | 522 | 0.5% |
| Sudanese | 121 | 0.1% |
| Swedish | 780 | 0.7% |
| Swiss | 371 | 0.4% |
| Syrian | 23 | 0.0% |
| Thai | 4,967 | 4.8% |
| Tlingit-Haida | 14 | 0.0% |
| Tohono O'Odham | 14 | 0.0% |
| Tongan | 1,197 | 1.1% |
| Turkish | 128 | 0.1% |
| Ukrainian | 404 | 0.4% |
| Uruguayan | 65 | 0.1% |
| Venezuelan | 61 | 0.1% |
| Welsh | 418 | 0.4% |
| West Indian | 41 | 0.0% |
| Yugoslavian | 62 | 0.1% |
| Zimbabwean | 15 | 0.0% | View All 138 Rows |
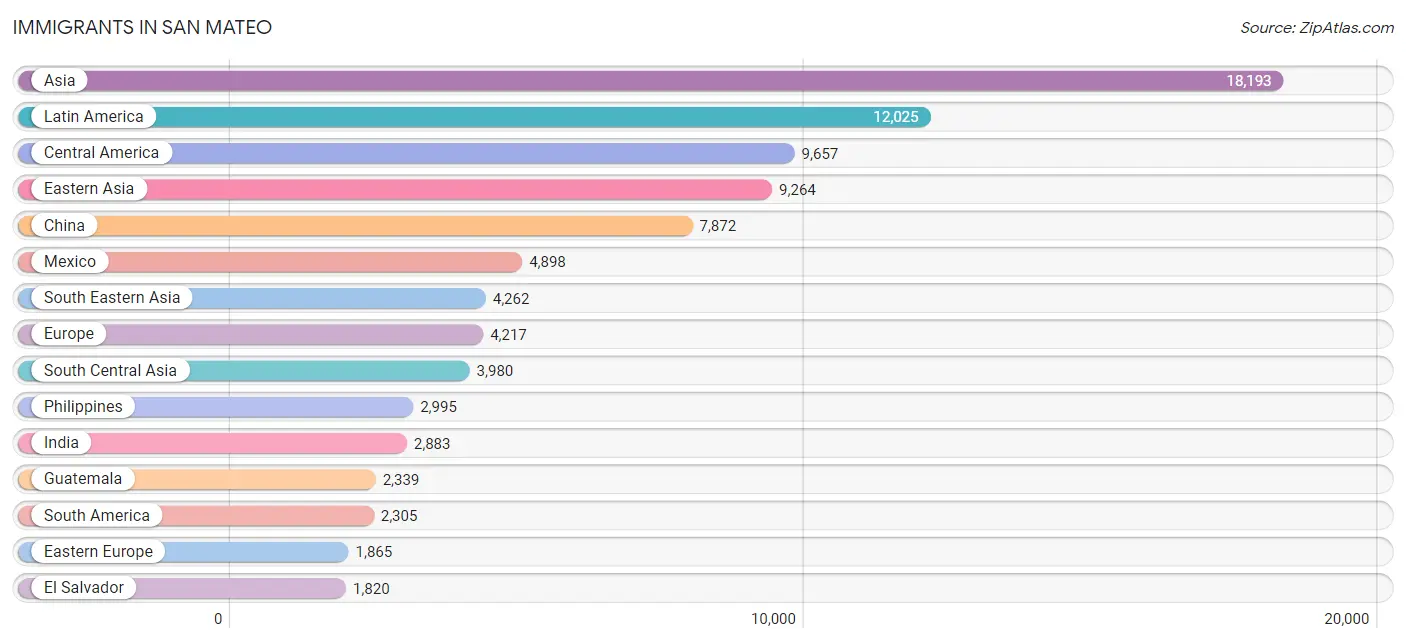
Immigrants in San Mateo
The most numerous immigrant groups reported in San Mateo came from Asia (18,193 | 17.5%), Latin America (12,025 | 11.5%), Central America (9,657 | 9.3%), Eastern Asia (9,264 | 8.9%), and China (7,872 | 7.6%), together accounting for 54.7% of all San Mateo residents.
| Immigration Origin | # Population | % Population |
| Afghanistan | 155 | 0.2% |
| Africa | 868 | 0.8% |
| Albania | 184 | 0.2% |
| Argentina | 241 | 0.2% |
| Asia | 18,193 | 17.5% |
| Australia | 163 | 0.2% |
| Austria | 39 | 0.0% |
| Azores | 14 | 0.0% |
| Bangladesh | 18 | 0.0% |
| Belarus | 278 | 0.3% |
| Belgium | 35 | 0.0% |
| Bolivia | 59 | 0.1% |
| Bosnia and Herzegovina | 30 | 0.0% |
| Brazil | 501 | 0.5% |
| Bulgaria | 93 | 0.1% |
| Cambodia | 17 | 0.0% |
| Canada | 833 | 0.8% |
| Caribbean | 63 | 0.1% |
| Central America | 9,657 | 9.3% |
| Chile | 148 | 0.1% |
| China | 7,872 | 7.6% |
| Colombia | 147 | 0.1% |
| Costa Rica | 32 | 0.0% |
| Croatia | 29 | 0.0% |
| Cuba | 43 | 0.0% |
| Denmark | 36 | 0.0% |
| Eastern Africa | 73 | 0.1% |
| Eastern Asia | 9,264 | 8.9% |
| Eastern Europe | 1,865 | 1.8% |
| Ecuador | 39 | 0.0% |
| Egypt | 164 | 0.2% |
| El Salvador | 1,820 | 1.8% |
| England | 138 | 0.1% |
| Eritrea | 20 | 0.0% |
| Europe | 4,217 | 4.1% |
| Fiji | 445 | 0.4% |
| France | 267 | 0.3% |
| Germany | 303 | 0.3% |
| Ghana | 5 | 0.0% |
| Greece | 105 | 0.1% |
| Guatemala | 2,339 | 2.2% |
| Honduras | 60 | 0.1% |
| Hong Kong | 1,084 | 1.0% |
| India | 2,883 | 2.8% |
| Indonesia | 160 | 0.2% |
| Iran | 570 | 0.5% |
| Iraq | 37 | 0.0% |
| Ireland | 224 | 0.2% |
| Israel | 147 | 0.1% |
| Italy | 184 | 0.2% |
| Jamaica | 20 | 0.0% |
| Japan | 629 | 0.6% |
| Jordan | 60 | 0.1% |
| Kazakhstan | 16 | 0.0% |
| Kenya | 20 | 0.0% |
| Korea | 763 | 0.7% |
| Kuwait | 24 | 0.0% |
| Laos | 17 | 0.0% |
| Latin America | 12,025 | 11.5% |
| Latvia | 33 | 0.0% |
| Lebanon | 214 | 0.2% |
| Lithuania | 35 | 0.0% |
| Malaysia | 128 | 0.1% |
| Mexico | 4,898 | 4.7% |
| Moldova | 33 | 0.0% |
| Morocco | 73 | 0.1% |
| Nepal | 208 | 0.2% |
| Netherlands | 109 | 0.1% |
| Nicaragua | 482 | 0.5% |
| Northern Africa | 698 | 0.7% |
| Northern Europe | 957 | 0.9% |
| Oceania | 1,207 | 1.2% |
| Pakistan | 79 | 0.1% |
| Panama | 26 | 0.0% |
| Peru | 1,019 | 1.0% |
| Philippines | 2,995 | 2.9% |
| Poland | 169 | 0.2% |
| Portugal | 115 | 0.1% |
| Romania | 148 | 0.1% |
| Russia | 481 | 0.5% |
| Saudi Arabia | 40 | 0.0% |
| Scotland | 32 | 0.0% |
| Singapore | 140 | 0.1% |
| South Africa | 43 | 0.0% |
| South America | 2,305 | 2.2% |
| South Central Asia | 3,980 | 3.8% |
| South Eastern Asia | 4,262 | 4.1% |
| Southern Europe | 584 | 0.6% |
| Spain | 152 | 0.2% |
| Sudan | 45 | 0.0% |
| Sweden | 81 | 0.1% |
| Switzerland | 27 | 0.0% |
| Syria | 15 | 0.0% |
| Taiwan | 1,299 | 1.3% |
| Thailand | 59 | 0.1% |
| Turkey | 95 | 0.1% |
| Ukraine | 198 | 0.2% |
| Uruguay | 59 | 0.1% |
| Venezuela | 62 | 0.1% |
| Vietnam | 449 | 0.4% |
| Western Africa | 54 | 0.1% |
| Western Asia | 677 | 0.6% |
| Western Europe | 780 | 0.7% |
| Zimbabwe | 10 | 0.0% | View All 104 Rows |
Sex and Age in San Mateo
Sex and Age in San Mateo
The most populous age groups in San Mateo are 30 to 34 Years (5,619 | 10.8%) for men and 30 to 34 Years (4,616 | 8.8%) for women.
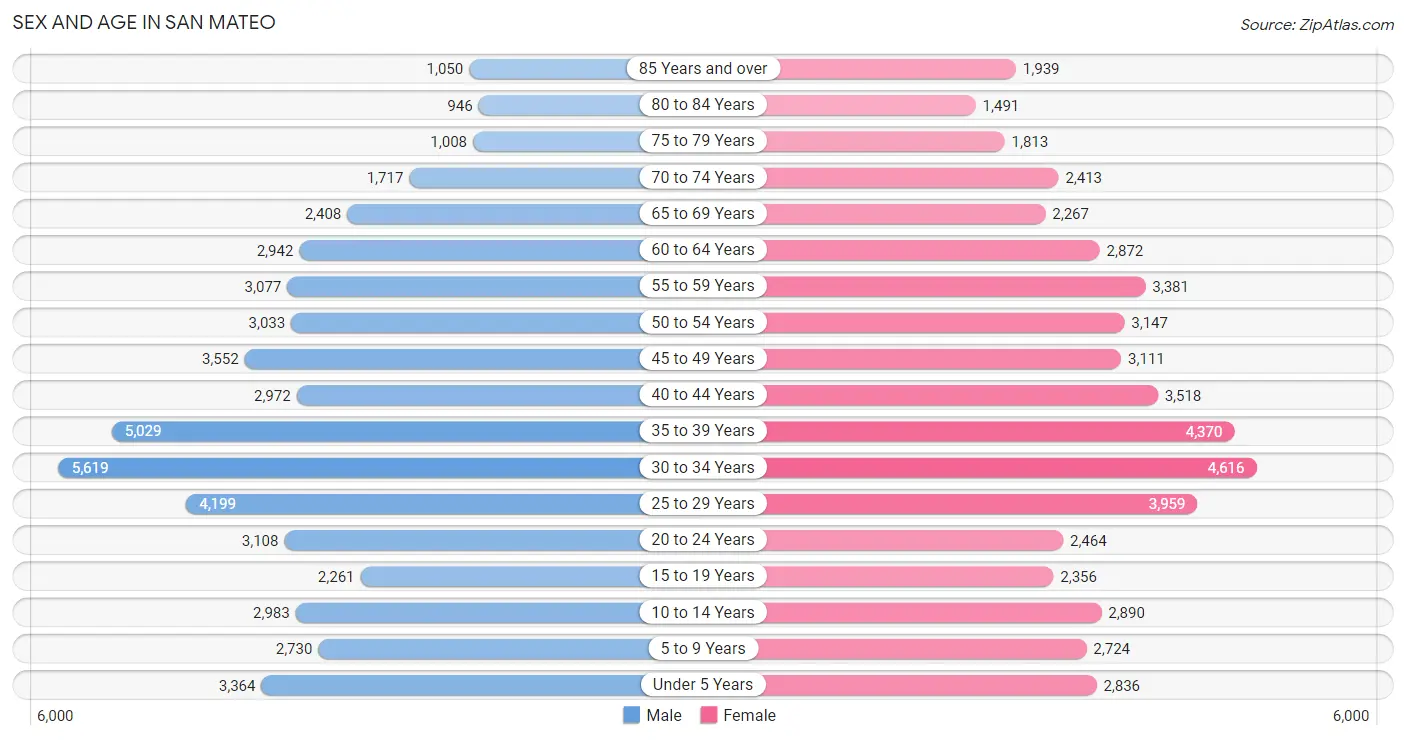
| Age Bracket | Male | Female |
| Under 5 Years | 3,364 (6.5%) | 2,836 (5.4%) |
| 5 to 9 Years | 2,730 (5.2%) | 2,724 (5.2%) |
| 10 to 14 Years | 2,983 (5.7%) | 2,890 (5.5%) |
| 15 to 19 Years | 2,261 (4.3%) | 2,356 (4.5%) |
| 20 to 24 Years | 3,108 (6.0%) | 2,464 (4.7%) |
| 25 to 29 Years | 4,199 (8.1%) | 3,959 (7.6%) |
| 30 to 34 Years | 5,619 (10.8%) | 4,616 (8.8%) |
| 35 to 39 Years | 5,029 (9.7%) | 4,370 (8.4%) |
| 40 to 44 Years | 2,972 (5.7%) | 3,518 (6.7%) |
| 45 to 49 Years | 3,552 (6.8%) | 3,111 (6.0%) |
| 50 to 54 Years | 3,033 (5.8%) | 3,147 (6.0%) |
| 55 to 59 Years | 3,077 (5.9%) | 3,381 (6.5%) |
| 60 to 64 Years | 2,942 (5.7%) | 2,872 (5.5%) |
| 65 to 69 Years | 2,408 (4.6%) | 2,267 (4.3%) |
| 70 to 74 Years | 1,717 (3.3%) | 2,413 (4.6%) |
| 75 to 79 Years | 1,008 (1.9%) | 1,813 (3.5%) |
| 80 to 84 Years | 946 (1.8%) | 1,491 (2.9%) |
| 85 Years and over | 1,050 (2.0%) | 1,939 (3.7%) |
| Total | 51,998 (100.0%) | 52,167 (100.0%) |
Families and Households in San Mateo
Median Family Size in San Mateo
The median family size in San Mateo is 3.19 persons per family, with single female/mother families (3,485 | 13.9%) accounting for the largest median family size of 3.28 persons per family. On the other hand, single male/father families (1,814 | 7.2%) represent the smallest median family size with 2.81 persons per family.
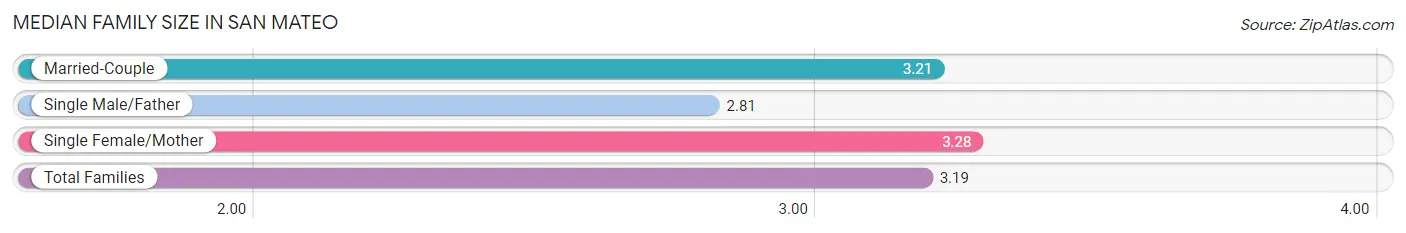
| Family Type | # Families | Family Size |
| Married-Couple | 19,706 (78.8%) | 3.21 |
| Single Male/Father | 1,814 (7.2%) | 2.81 |
| Single Female/Mother | 3,485 (13.9%) | 3.28 |
| Total Families | 25,005 (100.0%) | 3.19 |
Median Household Size in San Mateo
The median household size in San Mateo is 2.56 persons per household, with single female/mother households (3,485 | 8.7%) accounting for the largest median household size of 3.61 persons per household. non-family households (14,911 | 37.4%) represent the smallest median household size with 1.33 persons per household.
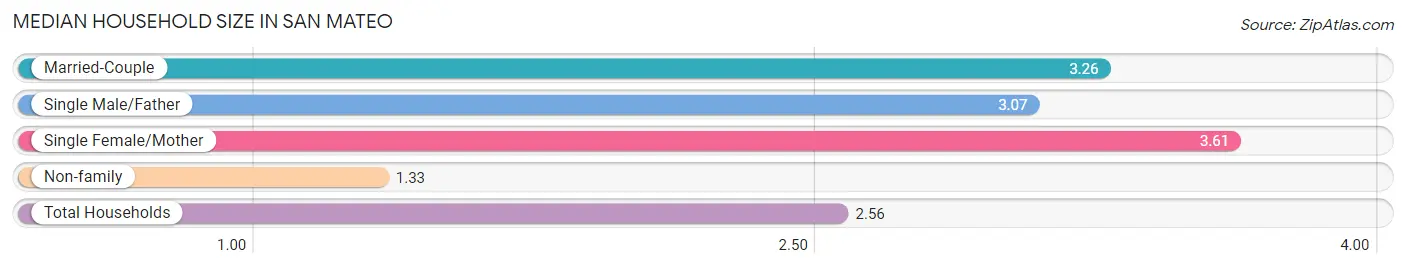
| Household Type | # Households | Household Size |
| Married-Couple | 19,706 (49.4%) | 3.26 |
| Single Male/Father | 1,814 (4.5%) | 3.07 |
| Single Female/Mother | 3,485 (8.7%) | 3.61 |
| Non-family | 14,911 (37.4%) | 1.33 |
| Total Households | 39,916 (100.0%) | 2.56 |
Household Size by Marriage Status in San Mateo
Out of a total of 39,916 households in San Mateo, 25,005 (62.6%) are family households, while 14,911 (37.4%) are nonfamily households. The most numerous type of family households are 2-person households, comprising 10,378, and the most common type of nonfamily households are 1-person households, comprising 11,633.
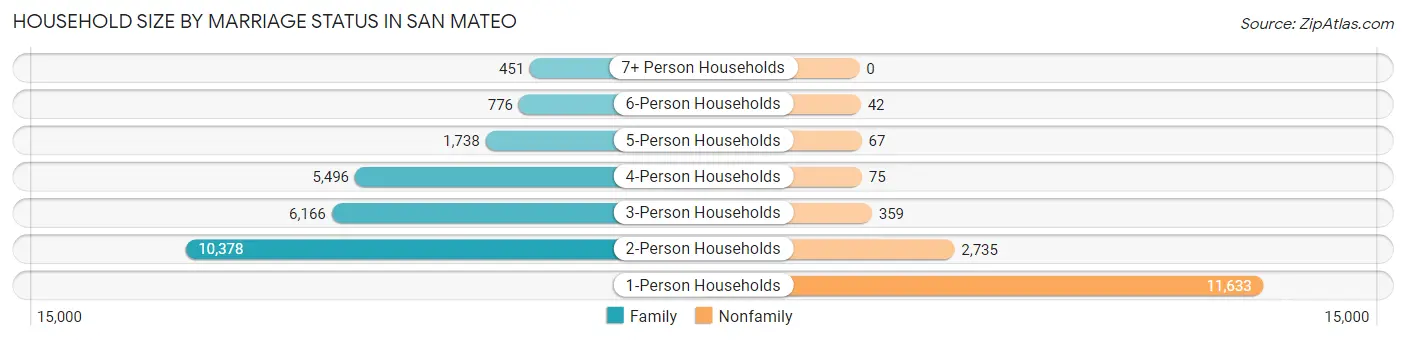
| Household Size | Family Households | Nonfamily Households |
| 1-Person Households | - | 11,633 (29.1%) |
| 2-Person Households | 10,378 (26.0%) | 2,735 (6.9%) |
| 3-Person Households | 6,166 (15.4%) | 359 (0.9%) |
| 4-Person Households | 5,496 (13.8%) | 75 (0.2%) |
| 5-Person Households | 1,738 (4.3%) | 67 (0.2%) |
| 6-Person Households | 776 (1.9%) | 42 (0.1%) |
| 7+ Person Households | 451 (1.1%) | 0 (0.0%) |
| Total | 25,005 (62.6%) | 14,911 (37.4%) |
Female Fertility in San Mateo
Fertility by Age in San Mateo
Average fertility rate in San Mateo is 63.0 births per 1,000 women. Women in the age bracket of 20 to 34 years have the highest fertility rate with 85.0 births per 1,000 women. Women in the age bracket of 20 to 34 years acount for 59.6% of all women with births.
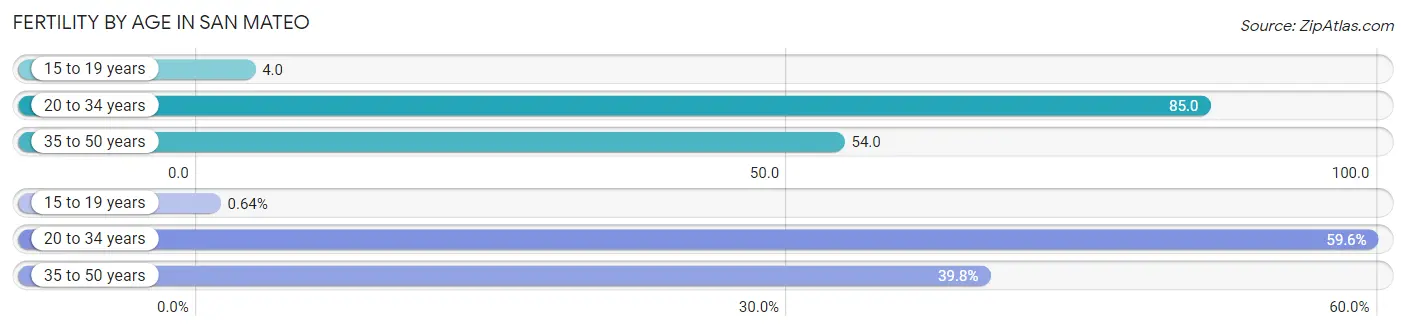
| Age Bracket | Women with Births | Births / 1,000 Women |
| 15 to 19 years | 10 (0.6%) | 4.0 |
| 20 to 34 years | 934 (59.6%) | 85.0 |
| 35 to 50 years | 624 (39.8%) | 54.0 |
| Total | 1,568 (100.0%) | 63.0 |
Fertility by Age by Marriage Status in San Mateo
90.6% of women with births (1,568) in San Mateo are married. The highest percentage of unmarried women with births falls into 15 to 19 years age bracket with 100.0% of them unmarried at the time of birth, while the lowest percentage of unmarried women with births belong to 20 to 34 years age bracket with 7.1% of them unmarried.
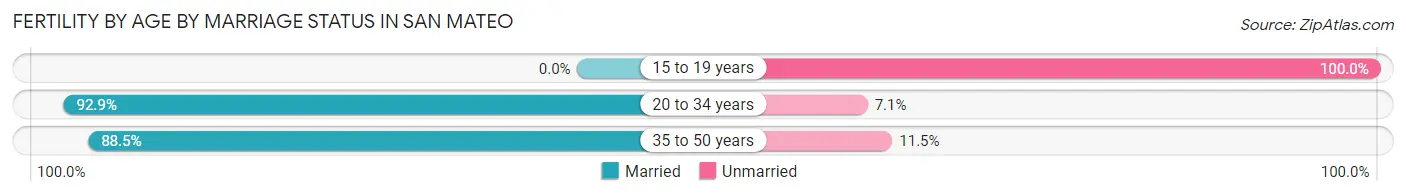
| Age Bracket | Married | Unmarried |
| 15 to 19 years | 0 (0.0%) | 10 (100.0%) |
| 20 to 34 years | 868 (92.9%) | 66 (7.1%) |
| 35 to 50 years | 552 (88.5%) | 72 (11.5%) |
| Total | 1,421 (90.6%) | 147 (9.4%) |
Fertility by Education in San Mateo
Average fertility rate in San Mateo is 63.0 births per 1,000 women. Women with the education attainment of graduate degree have the highest fertility rate of 113.0 births per 1,000 women, while women with the education attainment of college or associate's degree have the lowest fertility at 27.0 births per 1,000 women. Women with the education attainment of graduate degree represent 50.6% of all women with births.
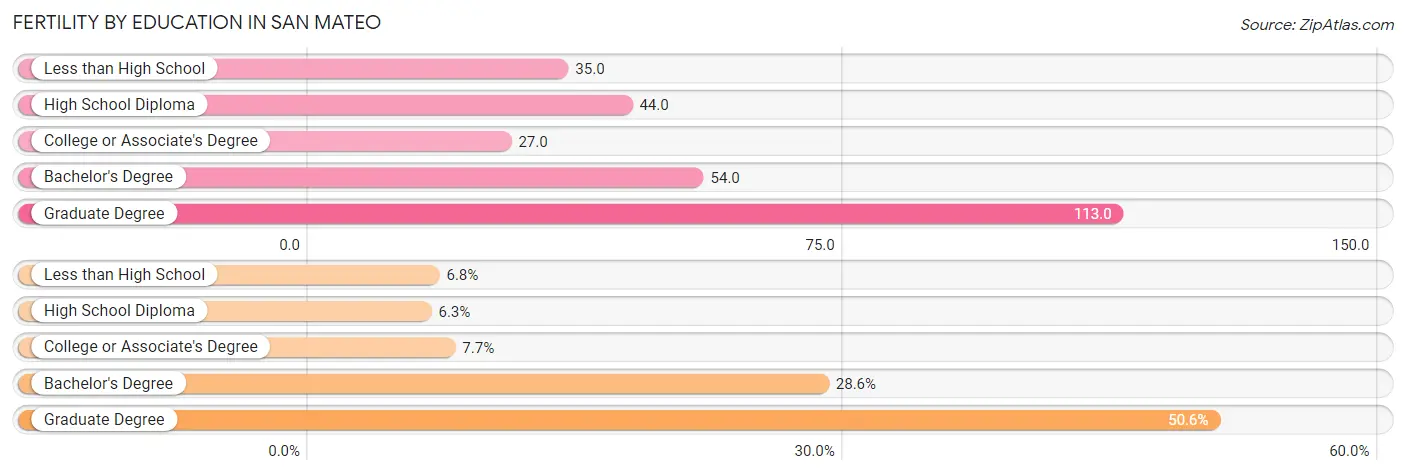
| Educational Attainment | Women with Births | Births / 1,000 Women |
| Less than High School | 106 (6.8%) | 35.0 |
| High School Diploma | 99 (6.3%) | 44.0 |
| College or Associate's Degree | 120 (7.6%) | 27.0 |
| Bachelor's Degree | 449 (28.6%) | 54.0 |
| Graduate Degree | 794 (50.6%) | 113.0 |
| Total | 1,568 (100.0%) | 63.0 |
Fertility by Education by Marriage Status in San Mateo
9.4% of women with births in San Mateo are unmarried. Women with the educational attainment of bachelor's degree are most likely to be married with 97.3% of them married at childbirth, while women with the educational attainment of high school diploma are least likely to be married with 51.5% of them unmarried at childbirth.
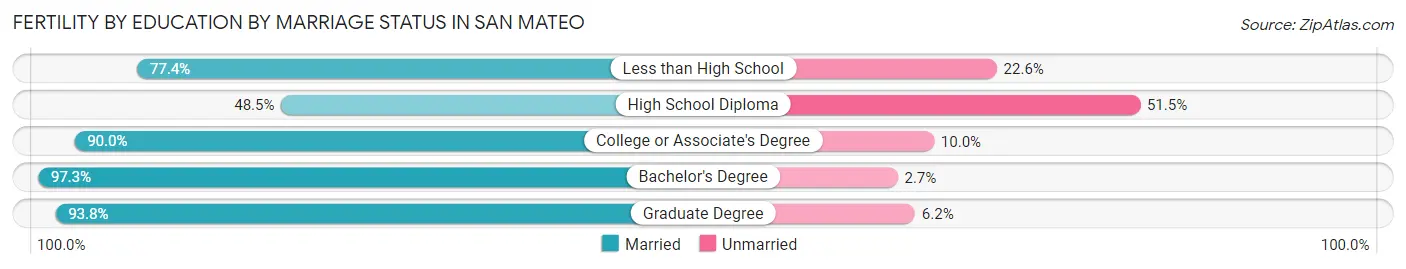
| Educational Attainment | Married | Unmarried |
| Less than High School | 82 (77.4%) | 24 (22.6%) |
| High School Diploma | 48 (48.5%) | 51 (51.5%) |
| College or Associate's Degree | 108 (90.0%) | 12 (10.0%) |
| Bachelor's Degree | 437 (97.3%) | 12 (2.7%) |
| Graduate Degree | 745 (93.8%) | 49 (6.2%) |
| Total | 1,421 (90.6%) | 147 (9.4%) |
Employment Characteristics in San Mateo
Employment by Class of Employer in San Mateo
Among the 56,127 employed individuals in San Mateo, private company employees (41,031 | 73.1%), not-for-profit organizations (4,097 | 7.3%), and local government employees (3,816 | 6.8%) make up the most common classes of employment.
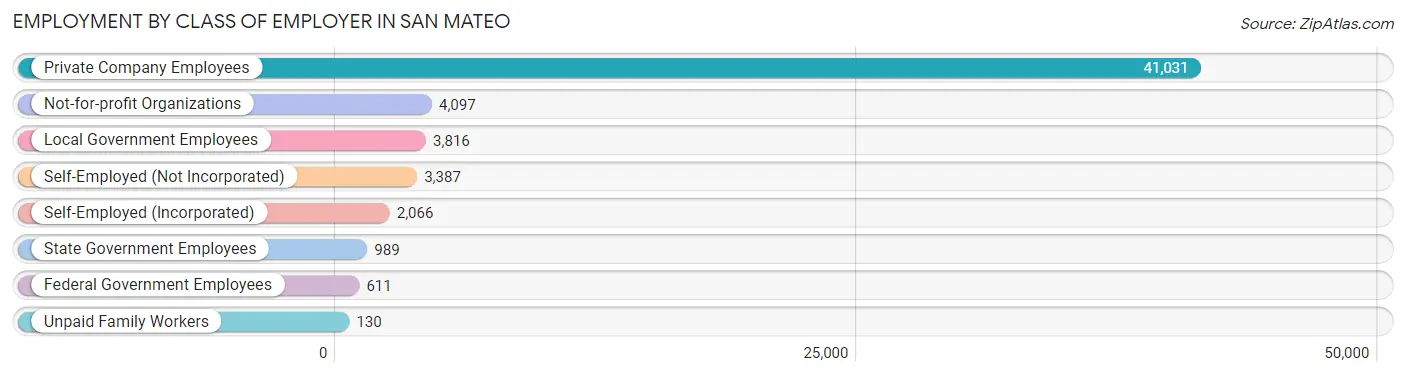
| Employer Class | # Employees | % Employees |
| Private Company Employees | 41,031 | 73.1% |
| Self-Employed (Incorporated) | 2,066 | 3.7% |
| Self-Employed (Not Incorporated) | 3,387 | 6.0% |
| Not-for-profit Organizations | 4,097 | 7.3% |
| Local Government Employees | 3,816 | 6.8% |
| State Government Employees | 989 | 1.8% |
| Federal Government Employees | 611 | 1.1% |
| Unpaid Family Workers | 130 | 0.2% |
| Total | 56,127 | 100.0% |
Employment Status by Age in San Mateo
According to the labor force statistics for San Mateo, out of the total population over 16 years of age (85,707), 70.1% or 60,081 individuals are in the labor force, with 4.7% or 2,824 of them unemployed. The age group with the highest labor force participation rate is 25 to 29 years, with 91.3% or 7,448 individuals in the labor force. Within the labor force, the 16 to 19 years age range has the highest percentage of unemployed individuals, with 16.4% or 212 of them being unemployed.
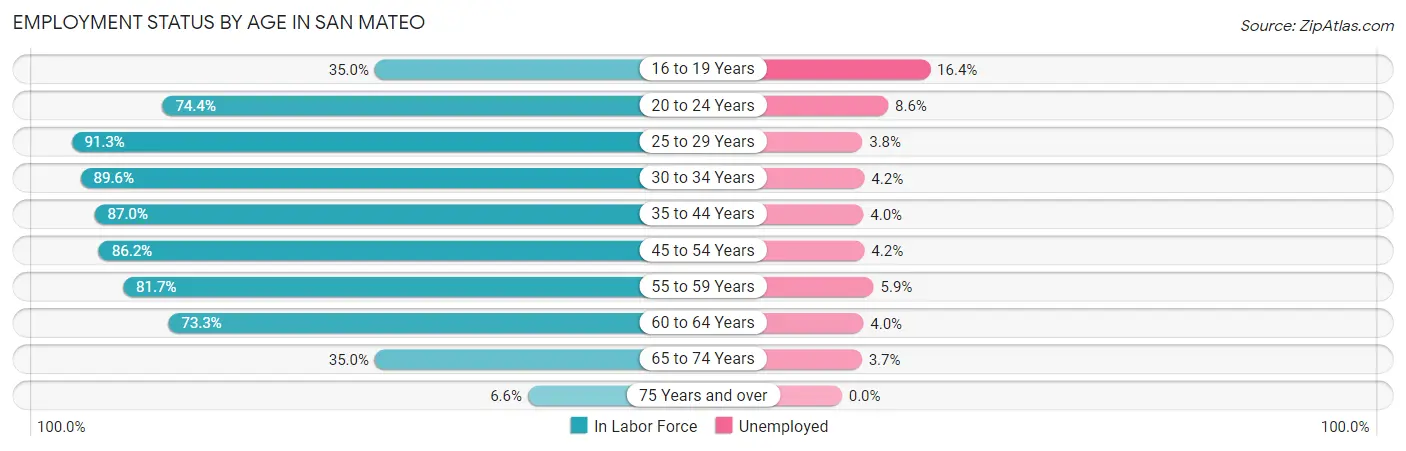
| Age Bracket | In Labor Force | Unemployed |
| 16 to 19 Years | 1,290 (35.0%) | 212 (16.4%) |
| 20 to 24 Years | 4,146 (74.4%) | 357 (8.6%) |
| 25 to 29 Years | 7,448 (91.3%) | 283 (3.8%) |
| 30 to 34 Years | 9,171 (89.6%) | 385 (4.2%) |
| 35 to 44 Years | 13,823 (87.0%) | 553 (4.0%) |
| 45 to 54 Years | 11,071 (86.2%) | 465 (4.2%) |
| 55 to 59 Years | 5,276 (81.7%) | 311 (5.9%) |
| 60 to 64 Years | 4,262 (73.3%) | 170 (4.0%) |
| 65 to 74 Years | 3,082 (35.0%) | 114 (3.7%) |
| 75 Years and over | 544 (6.6%) | 0 (0.0%) |
| Total | 60,081 (70.1%) | 2,824 (4.7%) |
Employment Status by Educational Attainment in San Mateo
According to labor force statistics for San Mateo, 86.0% of individuals (51,081) out of the total population between 25 and 64 years of age (59,397) are in the labor force, with 4.3% or 2,196 of them being unemployed. The group with the highest labor force participation rate are those with the educational attainment of bachelor's degree or higher, with 88.4% or 32,727 individuals in the labor force. Within the labor force, individuals with high school diploma education have the highest percentage of unemployment, with 6.6% or 327 of them being unemployed.
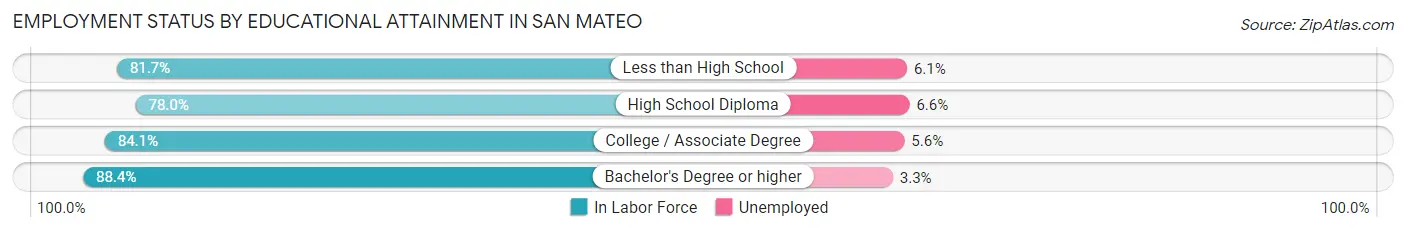
| Educational Attainment | In Labor Force | Unemployed |
| Less than High School | 3,592 (81.7%) | 268 (6.1%) |
| High School Diploma | 4,956 (78.0%) | 419 (6.6%) |
| College / Associate Degree | 9,777 (84.1%) | 651 (5.6%) |
| Bachelor's Degree or higher | 32,727 (88.4%) | 1,222 (3.3%) |
| Total | 51,081 (86.0%) | 2,554 (4.3%) |
Employment Occupations by Sex in San Mateo
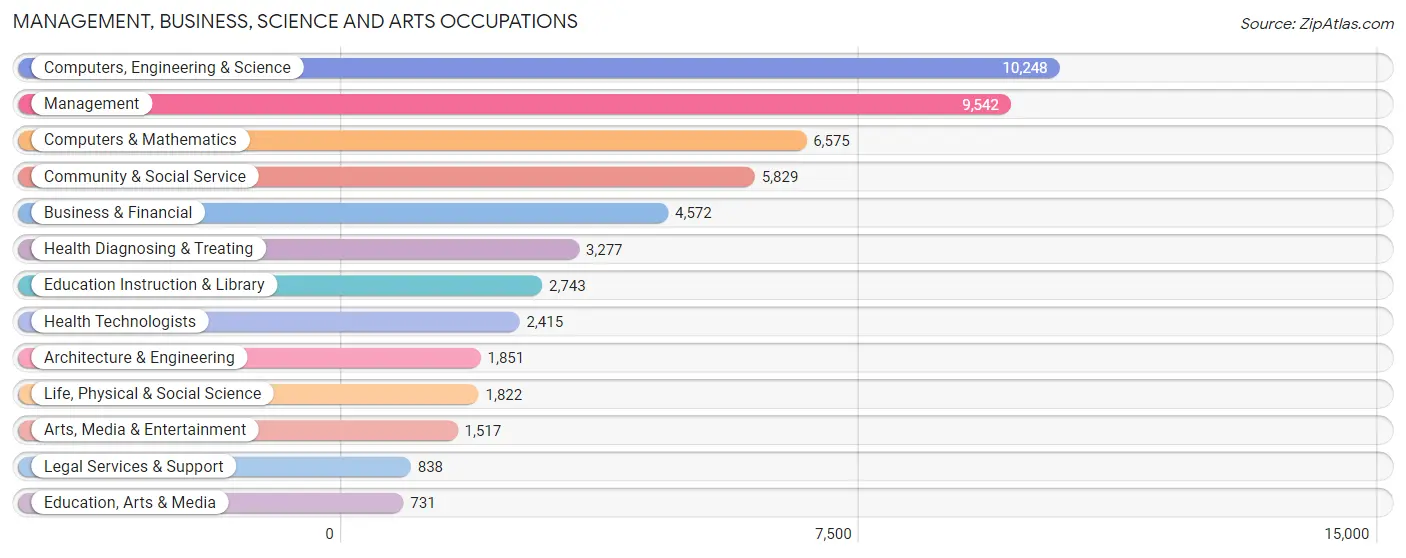
Management, Business, Science and Arts Occupations
The most common Management, Business, Science and Arts occupations in San Mateo are Computers, Engineering & Science (10,248 | 17.9%), Management (9,542 | 16.7%), Computers & Mathematics (6,575 | 11.5%), Community & Social Service (5,829 | 10.2%), and Business & Financial (4,572 | 8.0%).
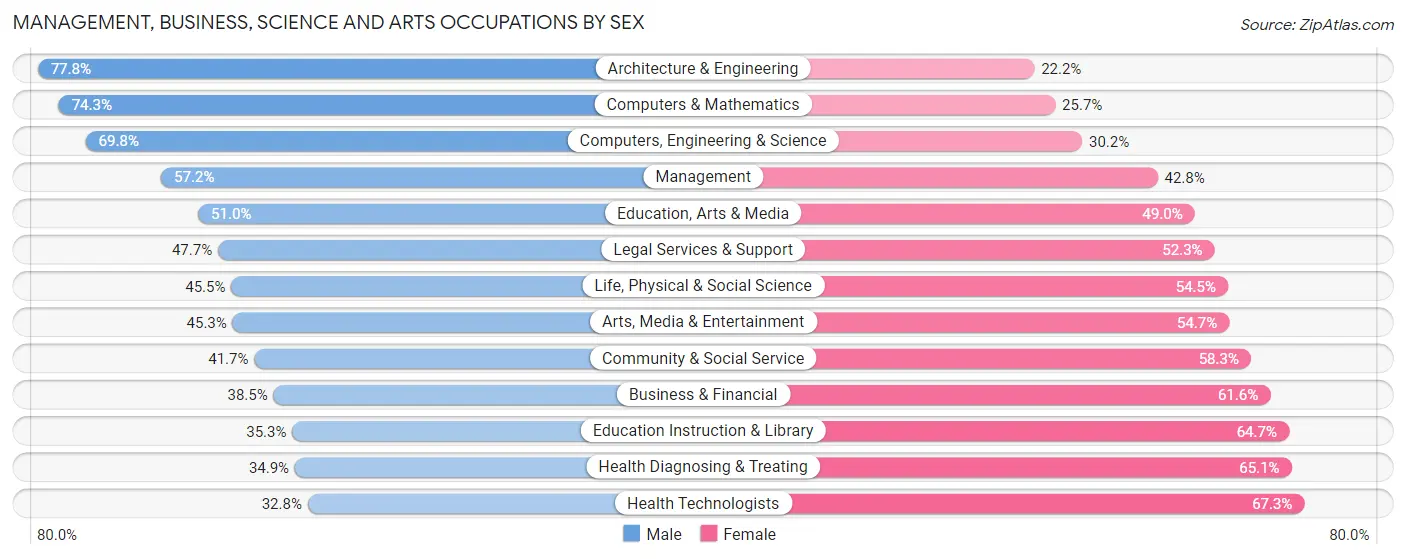
Management, Business, Science and Arts Occupations by Sex
Within the Management, Business, Science and Arts occupations in San Mateo, the most male-oriented occupations are Architecture & Engineering (77.8%), Computers & Mathematics (74.3%), and Computers, Engineering & Science (69.8%), while the most female-oriented occupations are Health Technologists (67.2%), Health Diagnosing & Treating (65.1%), and Education Instruction & Library (64.7%).
| Occupation | Male | Female |
| Management | 5,459 (57.2%) | 4,083 (42.8%) |
| Business & Financial | 1,758 (38.5%) | 2,814 (61.6%) |
| Computers, Engineering & Science | 7,154 (69.8%) | 3,094 (30.2%) |
| Computers & Mathematics | 4,885 (74.3%) | 1,690 (25.7%) |
| Architecture & Engineering | 1,440 (77.8%) | 411 (22.2%) |
| Life, Physical & Social Science | 829 (45.5%) | 993 (54.5%) |
| Community & Social Service | 2,429 (41.7%) | 3,400 (58.3%) |
| Education, Arts & Media | 373 (51.0%) | 358 (49.0%) |
| Legal Services & Support | 400 (47.7%) | 438 (52.3%) |
| Education Instruction & Library | 969 (35.3%) | 1,774 (64.7%) |
| Arts, Media & Entertainment | 687 (45.3%) | 830 (54.7%) |
| Health Diagnosing & Treating | 1,143 (34.9%) | 2,134 (65.1%) |
| Health Technologists | 791 (32.8%) | 1,624 (67.2%) |
| Total (Category) | 17,943 (53.6%) | 15,525 (46.4%) |
| Total (Overall) | 31,561 (55.1%) | 25,698 (44.9%) |
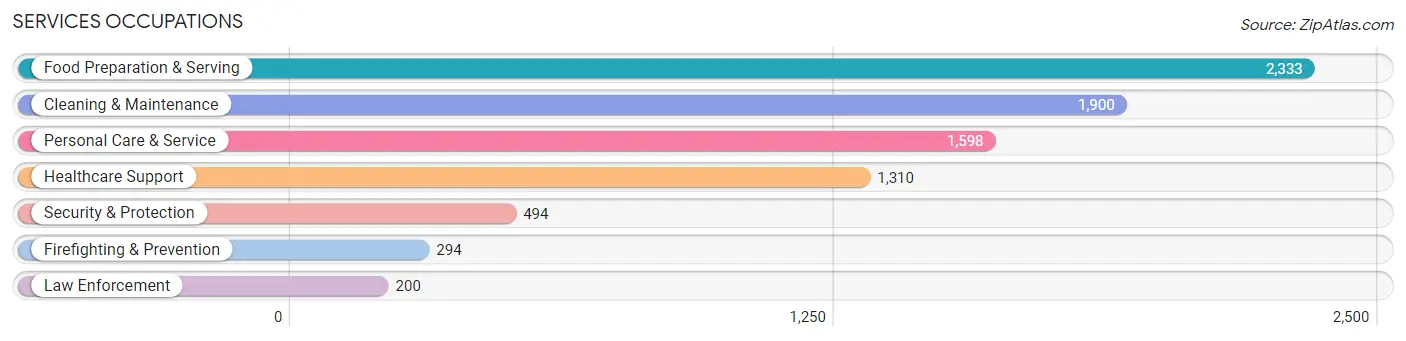
Services Occupations
The most common Services occupations in San Mateo are Food Preparation & Serving (2,333 | 4.1%), Cleaning & Maintenance (1,900 | 3.3%), Personal Care & Service (1,598 | 2.8%), Healthcare Support (1,310 | 2.3%), and Security & Protection (494 | 0.9%).
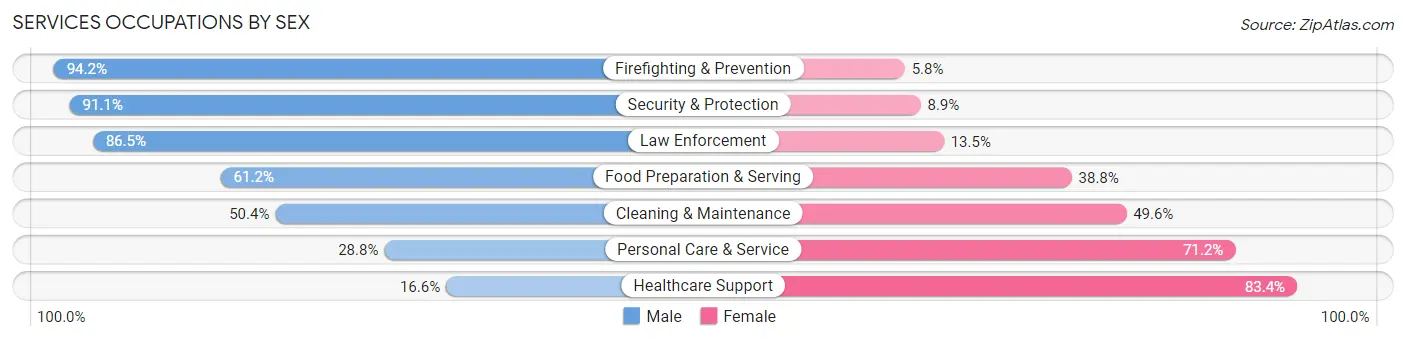
Services Occupations by Sex
Within the Services occupations in San Mateo, the most male-oriented occupations are Firefighting & Prevention (94.2%), Security & Protection (91.1%), and Law Enforcement (86.5%), while the most female-oriented occupations are Healthcare Support (83.4%), Personal Care & Service (71.2%), and Cleaning & Maintenance (49.6%).
| Occupation | Male | Female |
| Healthcare Support | 217 (16.6%) | 1,093 (83.4%) |
| Security & Protection | 450 (91.1%) | 44 (8.9%) |
| Firefighting & Prevention | 277 (94.2%) | 17 (5.8%) |
| Law Enforcement | 173 (86.5%) | 27 (13.5%) |
| Food Preparation & Serving | 1,427 (61.2%) | 906 (38.8%) |
| Cleaning & Maintenance | 957 (50.4%) | 943 (49.6%) |
| Personal Care & Service | 460 (28.8%) | 1,138 (71.2%) |
| Total (Category) | 3,511 (46.0%) | 4,124 (54.0%) |
| Total (Overall) | 31,561 (55.1%) | 25,698 (44.9%) |
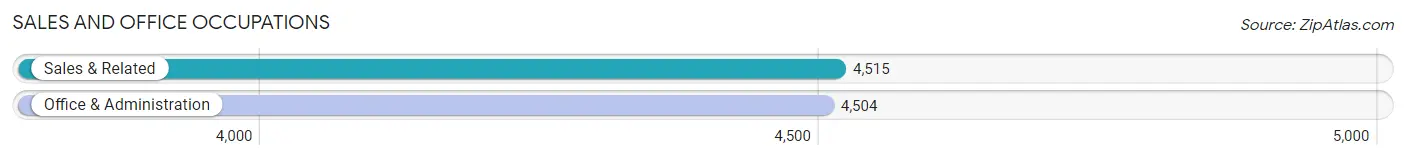
Sales and Office Occupations
The most common Sales and Office occupations in San Mateo are Sales & Related (4,515 | 7.9%), and Office & Administration (4,504 | 7.9%).
Sales and Office Occupations by Sex
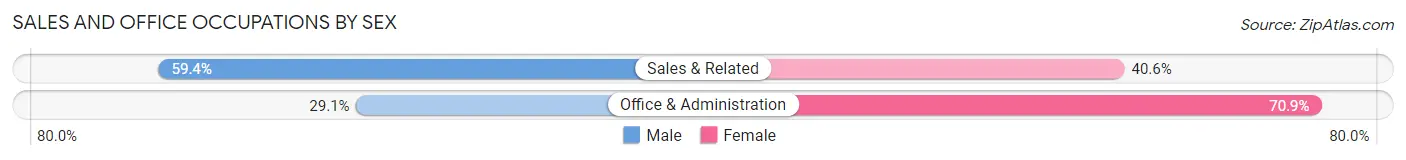
| Occupation | Male | Female |
| Sales & Related | 2,681 (59.4%) | 1,834 (40.6%) |
| Office & Administration | 1,311 (29.1%) | 3,193 (70.9%) |
| Total (Category) | 3,992 (44.3%) | 5,027 (55.7%) |
| Total (Overall) | 31,561 (55.1%) | 25,698 (44.9%) |
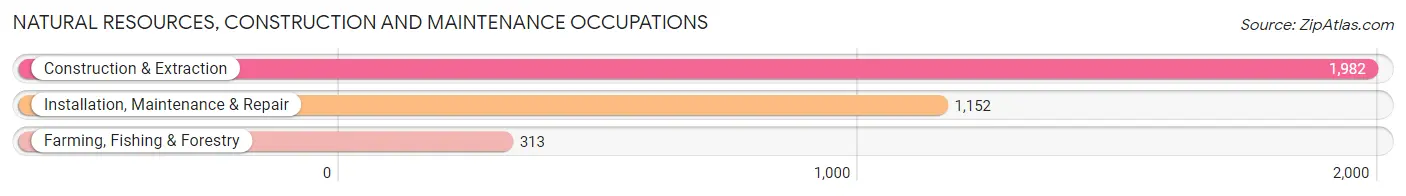
Natural Resources, Construction and Maintenance Occupations
The most common Natural Resources, Construction and Maintenance occupations in San Mateo are Construction & Extraction (1,982 | 3.5%), Installation, Maintenance & Repair (1,152 | 2.0%), and Farming, Fishing & Forestry (313 | 0.5%).
Natural Resources, Construction and Maintenance Occupations by Sex
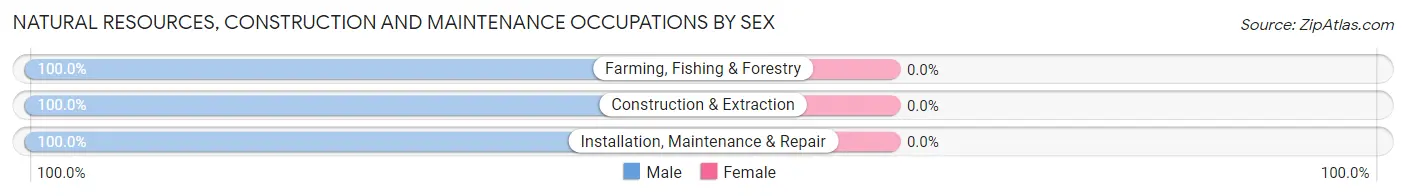
| Occupation | Male | Female |
| Farming, Fishing & Forestry | 313 (100.0%) | 0 (0.0%) |
| Construction & Extraction | 1,982 (100.0%) | 0 (0.0%) |
| Installation, Maintenance & Repair | 1,152 (100.0%) | 0 (0.0%) |
| Total (Category) | 3,447 (100.0%) | 0 (0.0%) |
| Total (Overall) | 31,561 (55.1%) | 25,698 (44.9%) |
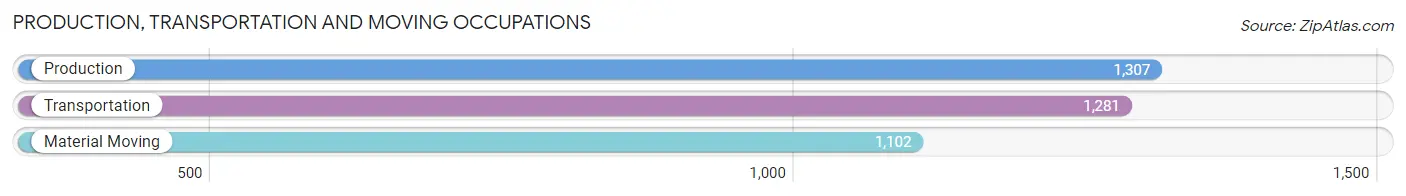
Production, Transportation and Moving Occupations
The most common Production, Transportation and Moving occupations in San Mateo are Production (1,307 | 2.3%), Transportation (1,281 | 2.2%), and Material Moving (1,102 | 1.9%).
Production, Transportation and Moving Occupations by Sex
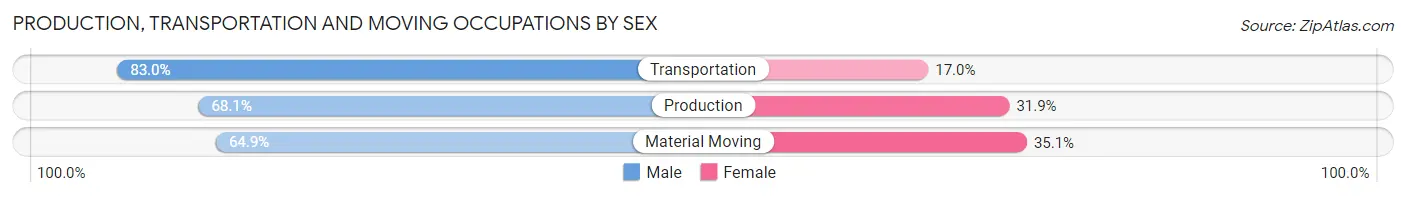
| Occupation | Male | Female |
| Production | 890 (68.1%) | 417 (31.9%) |
| Transportation | 1,063 (83.0%) | 218 (17.0%) |
| Material Moving | 715 (64.9%) | 387 (35.1%) |
| Total (Category) | 2,668 (72.3%) | 1,022 (27.7%) |
| Total (Overall) | 31,561 (55.1%) | 25,698 (44.9%) |
Employment Industries by Sex in San Mateo
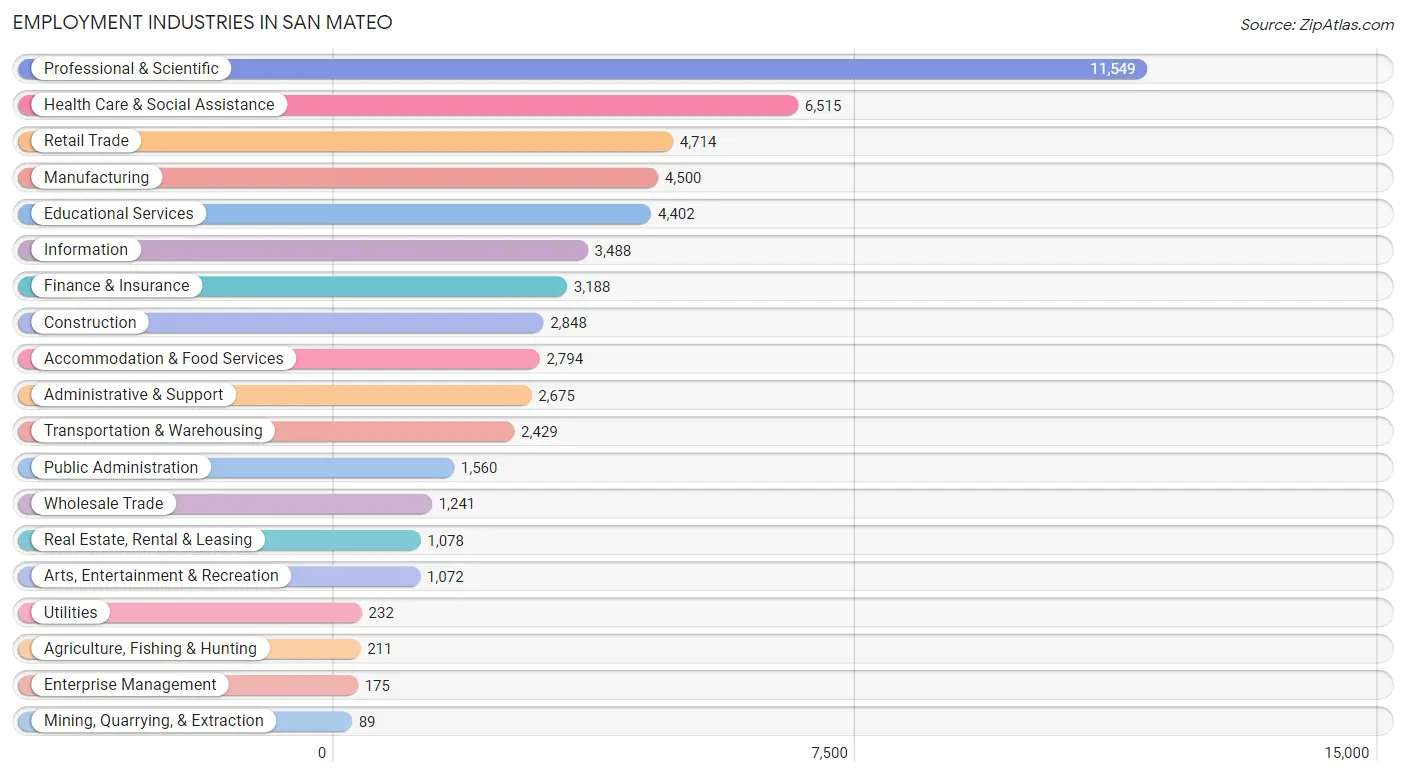
Employment Industries in San Mateo
The major employment industries in San Mateo include Professional & Scientific (11,549 | 20.2%), Health Care & Social Assistance (6,515 | 11.4%), Retail Trade (4,714 | 8.2%), Manufacturing (4,500 | 7.9%), and Educational Services (4,402 | 7.7%).
Employment Industries by Sex in San Mateo
The San Mateo industries that see more men than women are Mining, Quarrying, & Extraction (100.0%), Construction (90.3%), and Agriculture, Fishing & Hunting (90.0%), whereas the industries that tend to have a higher number of women are Health Care & Social Assistance (71.0%), Educational Services (61.1%), and Public Administration (56.5%).
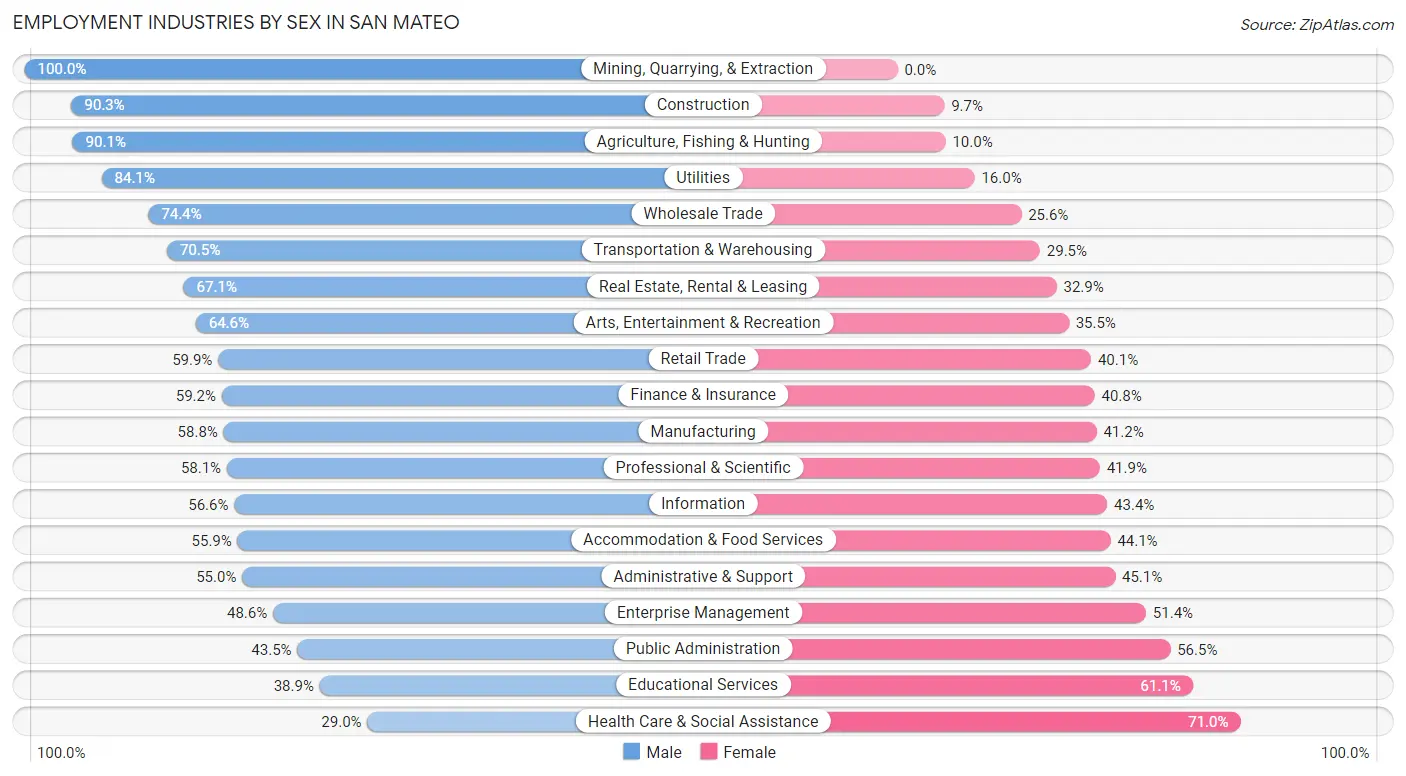
| Industry | Male | Female |
| Agriculture, Fishing & Hunting | 190 (90.0%) | 21 (10.0%) |
| Mining, Quarrying, & Extraction | 89 (100.0%) | 0 (0.0%) |
| Construction | 2,572 (90.3%) | 276 (9.7%) |
| Manufacturing | 2,646 (58.8%) | 1,854 (41.2%) |
| Wholesale Trade | 923 (74.4%) | 318 (25.6%) |
| Retail Trade | 2,825 (59.9%) | 1,889 (40.1%) |
| Transportation & Warehousing | 1,713 (70.5%) | 716 (29.5%) |
| Utilities | 195 (84.1%) | 37 (16.0%) |
| Information | 1,974 (56.6%) | 1,514 (43.4%) |
| Finance & Insurance | 1,887 (59.2%) | 1,301 (40.8%) |
| Real Estate, Rental & Leasing | 723 (67.1%) | 355 (32.9%) |
| Professional & Scientific | 6,712 (58.1%) | 4,837 (41.9%) |
| Enterprise Management | 85 (48.6%) | 90 (51.4%) |
| Administrative & Support | 1,470 (54.9%) | 1,205 (45.1%) |
| Educational Services | 1,713 (38.9%) | 2,689 (61.1%) |
| Health Care & Social Assistance | 1,892 (29.0%) | 4,623 (71.0%) |
| Arts, Entertainment & Recreation | 692 (64.5%) | 380 (35.4%) |
| Accommodation & Food Services | 1,562 (55.9%) | 1,232 (44.1%) |
| Public Administration | 679 (43.5%) | 881 (56.5%) |
| Total | 31,561 (55.1%) | 25,698 (44.9%) |
Education in San Mateo
School Enrollment in San Mateo
The most common levels of schooling among the 23,071 students in San Mateo are college / undergraduate (5,541 | 24.0%), elementary school (4,565 | 19.8%), and high school (4,451 | 19.3%).
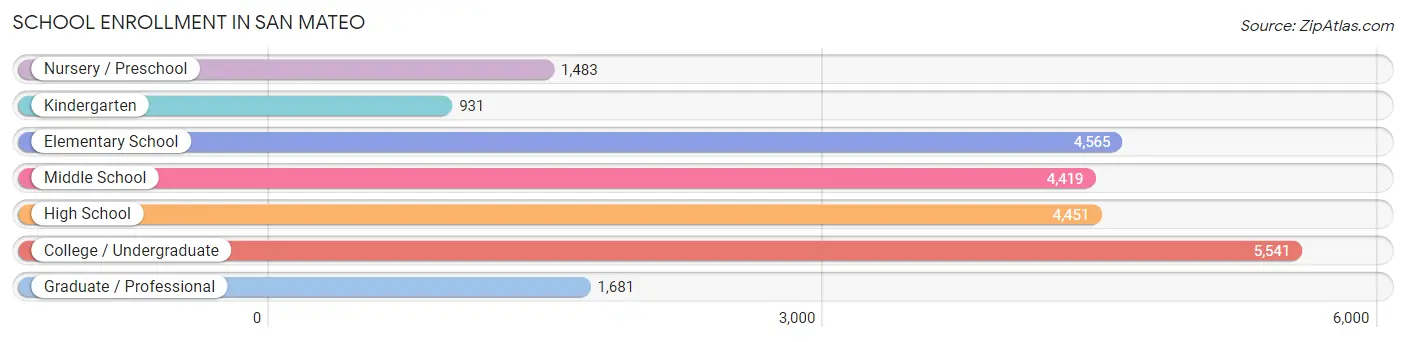
| School Level | # Students | % Students |
| Nursery / Preschool | 1,483 | 6.4% |
| Kindergarten | 931 | 4.0% |
| Elementary School | 4,565 | 19.8% |
| Middle School | 4,419 | 19.2% |
| High School | 4,451 | 19.3% |
| College / Undergraduate | 5,541 | 24.0% |
| Graduate / Professional | 1,681 | 7.3% |
| Total | 23,071 | 100.0% |
School Enrollment by Age by Funding Source in San Mateo
Out of a total of 23,071 students who are enrolled in schools in San Mateo, 4,983 (21.6%) attend a private institution, while the remaining 18,088 (78.4%) are enrolled in public schools. The age group of 3 to 4 year olds has the highest likelihood of being enrolled in private schools, with 790 (61.6% in the age bracket) enrolled. Conversely, the age group of 15 to 17 year olds has the lowest likelihood of being enrolled in a private school, with 2,543 (87.2% in the age bracket) attending a public institution.
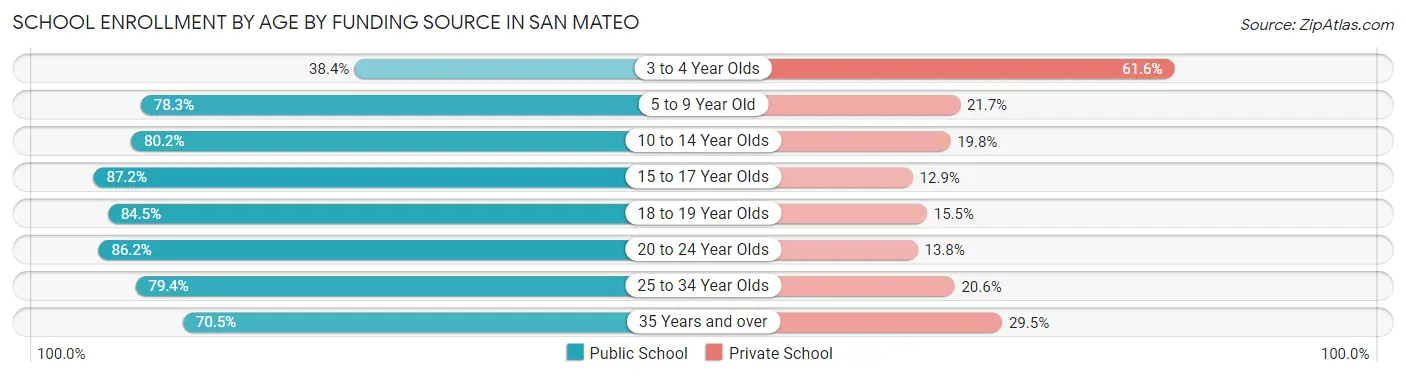
| Age Bracket | Public School | Private School |
| 3 to 4 Year Olds | 493 (38.4%) | 790 (61.6%) |
| 5 to 9 Year Old | 4,076 (78.3%) | 1,127 (21.7%) |
| 10 to 14 Year Olds | 4,550 (80.2%) | 1,126 (19.8%) |
| 15 to 17 Year Olds | 2,543 (87.2%) | 375 (12.9%) |
| 18 to 19 Year Olds | 1,053 (84.5%) | 193 (15.5%) |
| 20 to 24 Year Olds | 2,237 (86.2%) | 357 (13.8%) |
| 25 to 34 Year Olds | 1,919 (79.4%) | 499 (20.6%) |
| 35 Years and over | 1,222 (70.5%) | 511 (29.5%) |
| Total | 18,088 (78.4%) | 4,983 (21.6%) |
Educational Attainment by Field of Study in San Mateo
Business (8,335 | 17.3%), engineering (6,601 | 13.7%), social sciences (5,610 | 11.7%), computers & mathematics (4,647 | 9.7%), and bio, nature & agricultural (3,693 | 7.7%) are the most common fields of study among 48,141 individuals in San Mateo who have obtained a bachelor's degree or higher.
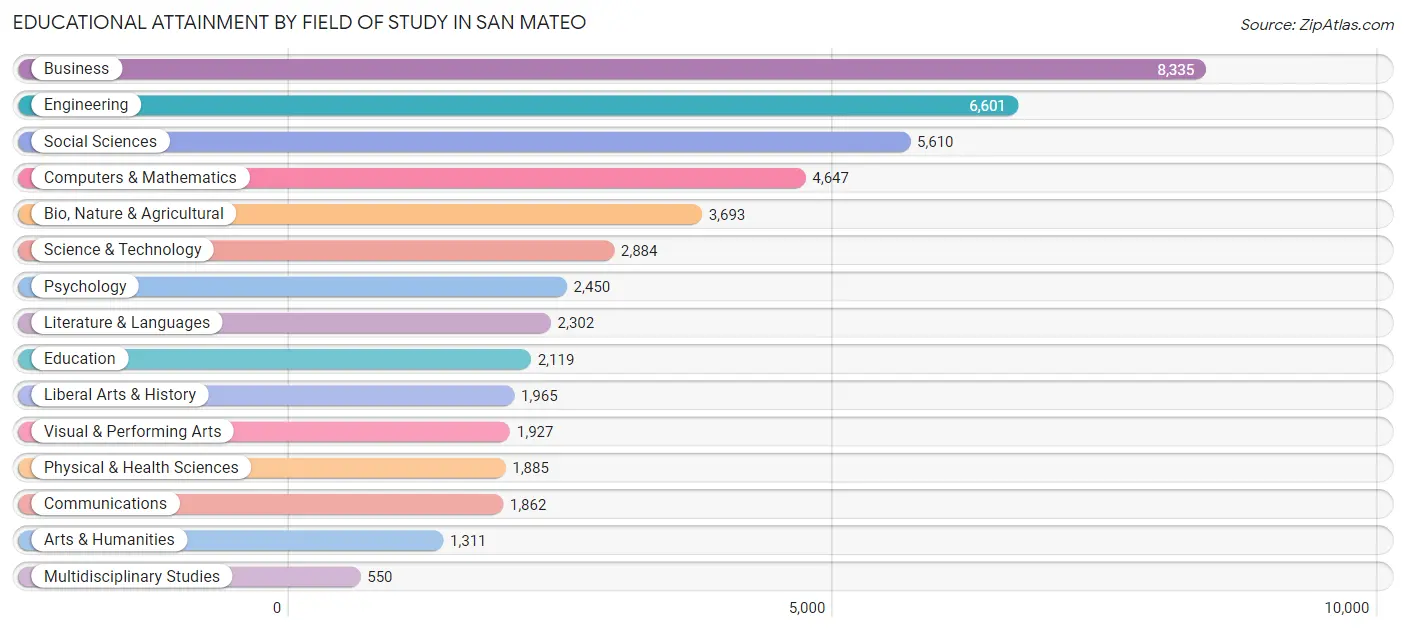
| Field of Study | # Graduates | % Graduates |
| Computers & Mathematics | 4,647 | 9.7% |
| Bio, Nature & Agricultural | 3,693 | 7.7% |
| Physical & Health Sciences | 1,885 | 3.9% |
| Psychology | 2,450 | 5.1% |
| Social Sciences | 5,610 | 11.7% |
| Engineering | 6,601 | 13.7% |
| Multidisciplinary Studies | 550 | 1.1% |
| Science & Technology | 2,884 | 6.0% |
| Business | 8,335 | 17.3% |
| Education | 2,119 | 4.4% |
| Literature & Languages | 2,302 | 4.8% |
| Liberal Arts & History | 1,965 | 4.1% |
| Visual & Performing Arts | 1,927 | 4.0% |
| Communications | 1,862 | 3.9% |
| Arts & Humanities | 1,311 | 2.7% |
| Total | 48,141 | 100.0% |
Transportation & Commute in San Mateo
Vehicle Availability by Sex in San Mateo
The most prevalent vehicle ownership categories in San Mateo are males with 2 vehicles (13,376, accounting for 43.3%) and females with 2 vehicles (10,233, making up 53.8%).
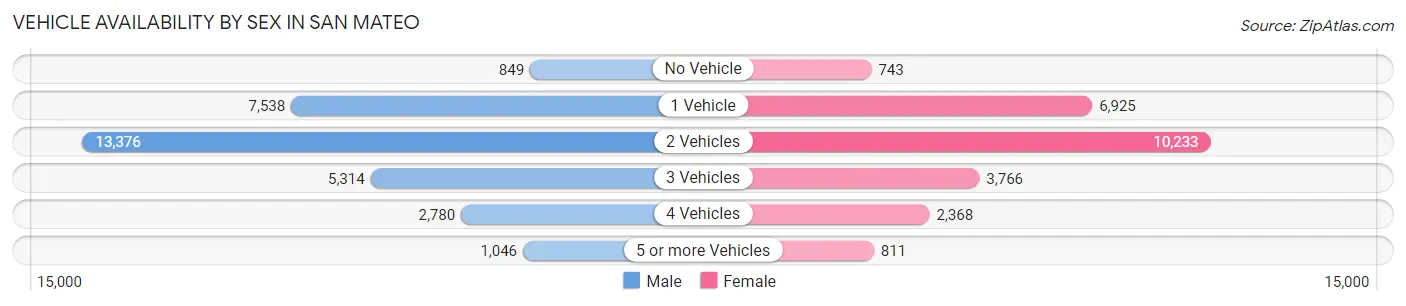
| Vehicles Available | Male | Female |
| No Vehicle | 849 (2.8%) | 743 (3.0%) |
| 1 Vehicle | 7,538 (24.4%) | 6,925 (27.9%) |
| 2 Vehicles | 13,376 (43.3%) | 10,233 (41.2%) |
| 3 Vehicles | 5,314 (17.2%) | 3,766 (15.2%) |
| 4 Vehicles | 2,780 (9.0%) | 2,368 (9.5%) |
| 5 or more Vehicles | 1,046 (3.4%) | 811 (3.3%) |
| Total | 30,903 (100.0%) | 24,846 (100.0%) |
Commute Time in San Mateo
The most frequently occuring commute durations in San Mateo are 15 to 19 minutes (6,420 commuters, 14.3%), 20 to 24 minutes (6,191 commuters, 13.8%), and 30 to 34 minutes (6,012 commuters, 13.4%).
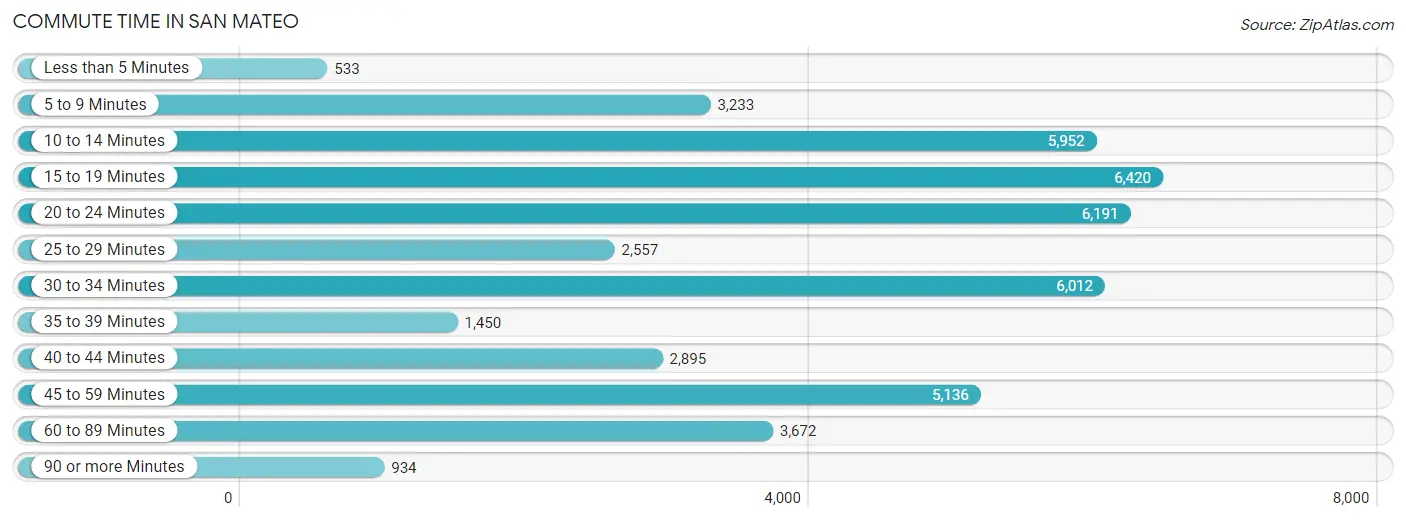
| Commute Time | # Commuters | % Commuters |
| Less than 5 Minutes | 533 | 1.2% |
| 5 to 9 Minutes | 3,233 | 7.2% |
| 10 to 14 Minutes | 5,952 | 13.2% |
| 15 to 19 Minutes | 6,420 | 14.3% |
| 20 to 24 Minutes | 6,191 | 13.8% |
| 25 to 29 Minutes | 2,557 | 5.7% |
| 30 to 34 Minutes | 6,012 | 13.4% |
| 35 to 39 Minutes | 1,450 | 3.2% |
| 40 to 44 Minutes | 2,895 | 6.4% |
| 45 to 59 Minutes | 5,136 | 11.4% |
| 60 to 89 Minutes | 3,672 | 8.2% |
| 90 or more Minutes | 934 | 2.1% |
Commute Time by Sex in San Mateo
The most common commute times in San Mateo are 20 to 24 minutes (3,863 commuters, 15.1%) for males and 10 to 14 minutes (3,113 commuters, 16.0%) for females.
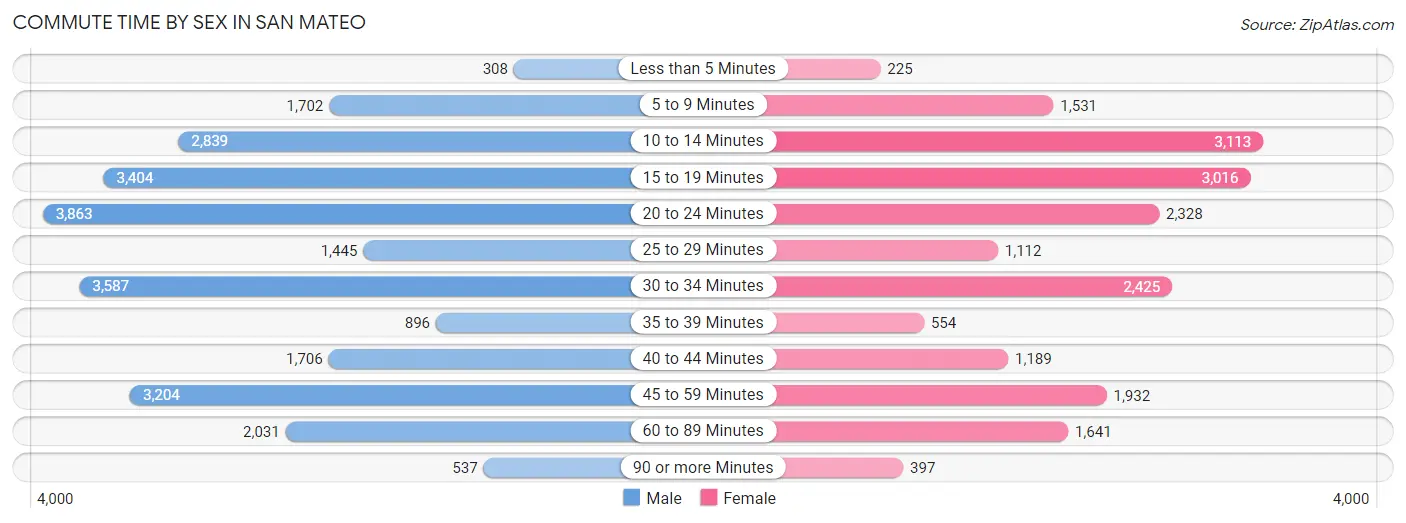
| Commute Time | Male | Female |
| Less than 5 Minutes | 308 (1.2%) | 225 (1.2%) |
| 5 to 9 Minutes | 1,702 (6.7%) | 1,531 (7.9%) |
| 10 to 14 Minutes | 2,839 (11.1%) | 3,113 (16.0%) |
| 15 to 19 Minutes | 3,404 (13.3%) | 3,016 (15.5%) |
| 20 to 24 Minutes | 3,863 (15.1%) | 2,328 (12.0%) |
| 25 to 29 Minutes | 1,445 (5.7%) | 1,112 (5.7%) |
| 30 to 34 Minutes | 3,587 (14.1%) | 2,425 (12.5%) |
| 35 to 39 Minutes | 896 (3.5%) | 554 (2.9%) |
| 40 to 44 Minutes | 1,706 (6.7%) | 1,189 (6.1%) |
| 45 to 59 Minutes | 3,204 (12.6%) | 1,932 (9.9%) |
| 60 to 89 Minutes | 2,031 (8.0%) | 1,641 (8.4%) |
| 90 or more Minutes | 537 (2.1%) | 397 (2.0%) |
Time of Departure to Work by Sex in San Mateo
The most frequent times of departure to work in San Mateo are 8:00 AM to 8:29 AM (4,460, 17.5%) for males and 8:00 AM to 8:29 AM (3,839, 19.7%) for females.
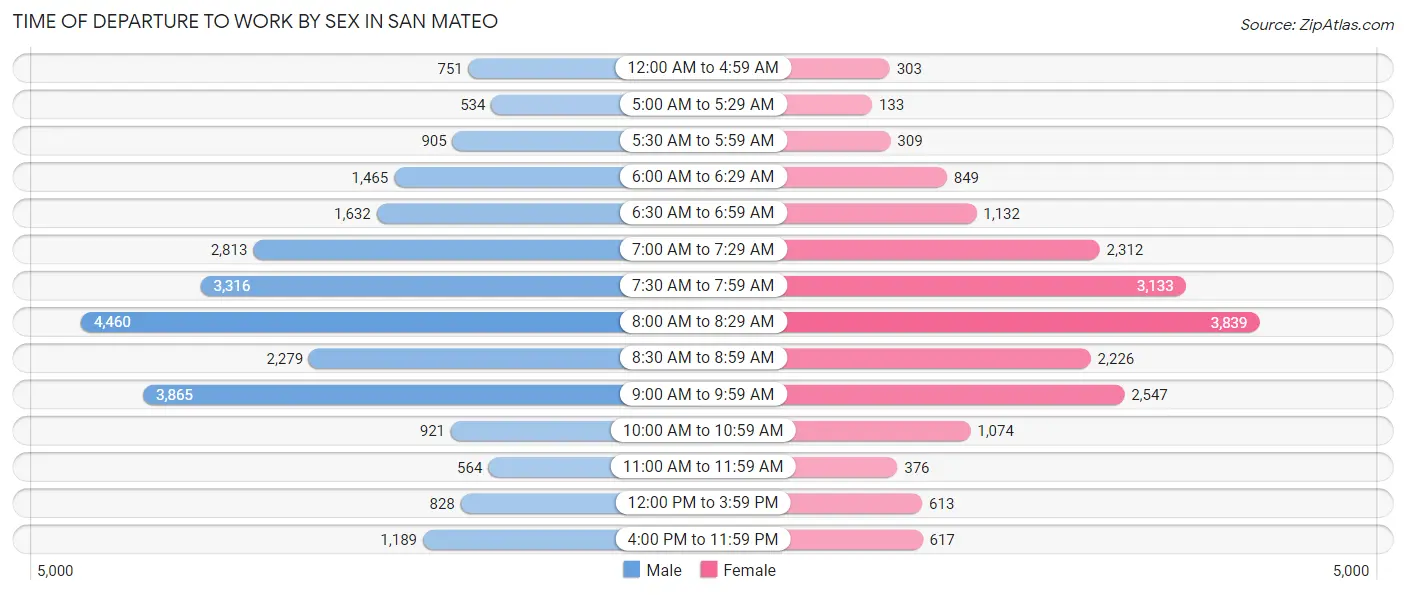
| Time of Departure | Male | Female |
| 12:00 AM to 4:59 AM | 751 (2.9%) | 303 (1.6%) |
| 5:00 AM to 5:29 AM | 534 (2.1%) | 133 (0.7%) |
| 5:30 AM to 5:59 AM | 905 (3.5%) | 309 (1.6%) |
| 6:00 AM to 6:29 AM | 1,465 (5.7%) | 849 (4.4%) |
| 6:30 AM to 6:59 AM | 1,632 (6.4%) | 1,132 (5.8%) |
| 7:00 AM to 7:29 AM | 2,813 (11.0%) | 2,312 (11.9%) |
| 7:30 AM to 7:59 AM | 3,316 (13.0%) | 3,133 (16.1%) |
| 8:00 AM to 8:29 AM | 4,460 (17.5%) | 3,839 (19.7%) |
| 8:30 AM to 8:59 AM | 2,279 (8.9%) | 2,226 (11.4%) |
| 9:00 AM to 9:59 AM | 3,865 (15.1%) | 2,547 (13.1%) |
| 10:00 AM to 10:59 AM | 921 (3.6%) | 1,074 (5.5%) |
| 11:00 AM to 11:59 AM | 564 (2.2%) | 376 (1.9%) |
| 12:00 PM to 3:59 PM | 828 (3.2%) | 613 (3.2%) |
| 4:00 PM to 11:59 PM | 1,189 (4.7%) | 617 (3.2%) |
| Total | 25,522 (100.0%) | 19,463 (100.0%) |
Housing Occupancy in San Mateo
Occupancy by Ownership in San Mateo
Of the total 39,916 dwellings in San Mateo, owner-occupied units account for 20,579 (51.6%), while renter-occupied units make up 19,337 (48.4%).
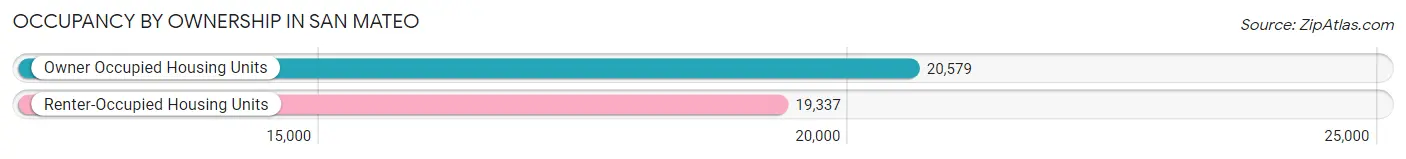
| Occupancy | # Housing Units | % Housing Units |
| Owner Occupied Housing Units | 20,579 | 51.6% |
| Renter-Occupied Housing Units | 19,337 | 48.4% |
| Total Occupied Housing Units | 39,916 | 100.0% |
Occupancy by Household Size in San Mateo
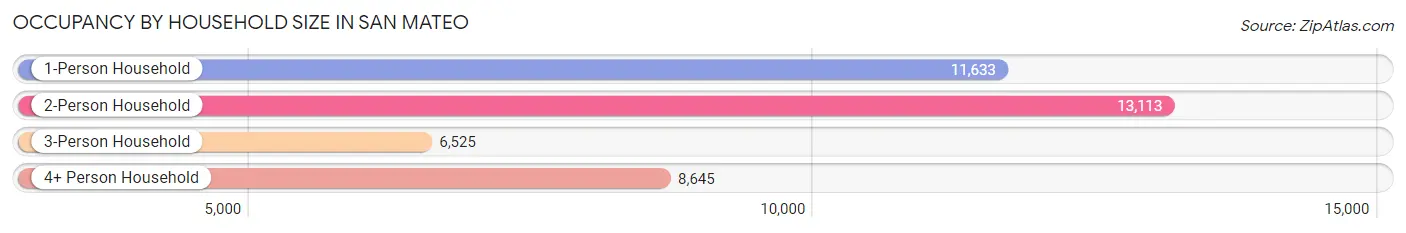
| Household Size | # Housing Units | % Housing Units |
| 1-Person Household | 11,633 | 29.1% |
| 2-Person Household | 13,113 | 32.9% |
| 3-Person Household | 6,525 | 16.4% |
| 4+ Person Household | 8,645 | 21.7% |
| Total Housing Units | 39,916 | 100.0% |
Occupancy by Ownership by Household Size in San Mateo
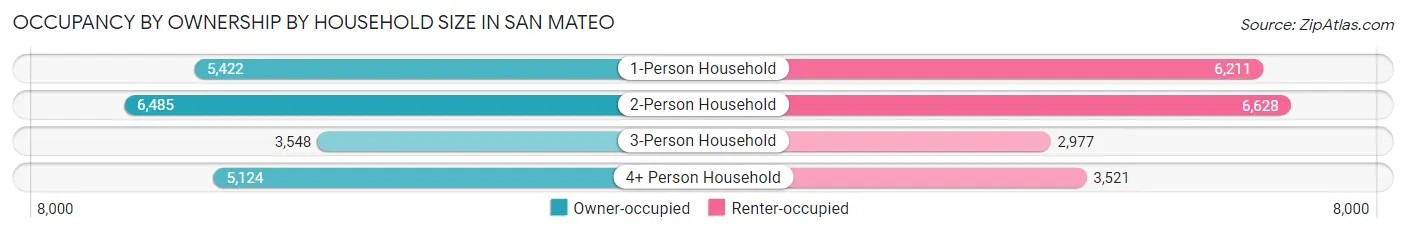
| Household Size | Owner-occupied | Renter-occupied |
| 1-Person Household | 5,422 (46.6%) | 6,211 (53.4%) |
| 2-Person Household | 6,485 (49.4%) | 6,628 (50.5%) |
| 3-Person Household | 3,548 (54.4%) | 2,977 (45.6%) |
| 4+ Person Household | 5,124 (59.3%) | 3,521 (40.7%) |
| Total Housing Units | 20,579 (51.6%) | 19,337 (48.4%) |
Occupancy by Educational Attainment in San Mateo
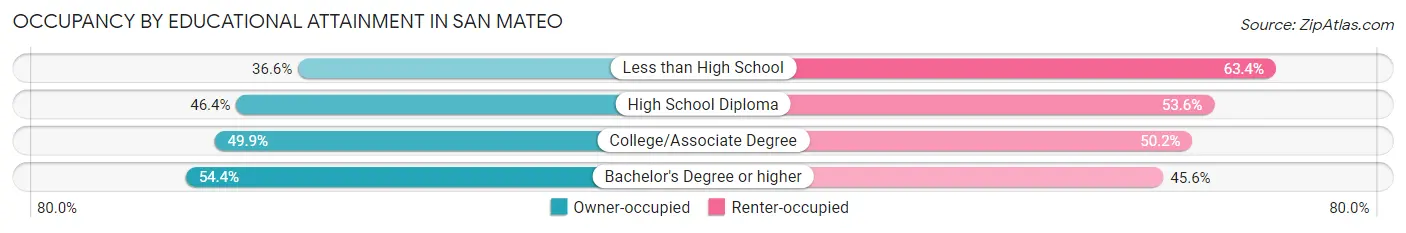
| Household Size | Owner-occupied | Renter-occupied |
| Less than High School | 905 (36.6%) | 1,566 (63.4%) |
| High School Diploma | 1,946 (46.4%) | 2,246 (53.6%) |
| College/Associate Degree | 4,069 (49.8%) | 4,094 (50.1%) |
| Bachelor's Degree or higher | 13,659 (54.4%) | 11,431 (45.6%) |
Occupancy by Age of Householder in San Mateo
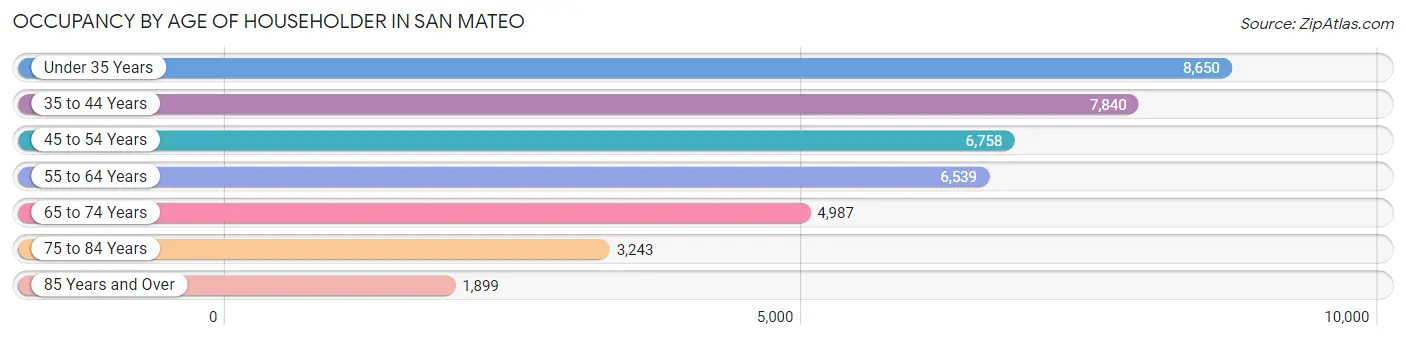
| Age Bracket | # Households | % Households |
| Under 35 Years | 8,650 | 21.7% |
| 35 to 44 Years | 7,840 | 19.6% |
| 45 to 54 Years | 6,758 | 16.9% |
| 55 to 64 Years | 6,539 | 16.4% |
| 65 to 74 Years | 4,987 | 12.5% |
| 75 to 84 Years | 3,243 | 8.1% |
| 85 Years and Over | 1,899 | 4.8% |
| Total | 39,916 | 100.0% |
Housing Finances in San Mateo
Median Income by Occupancy in San Mateo
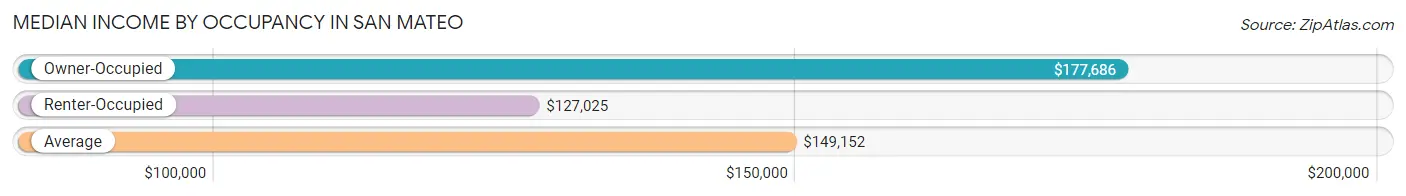
| Occupancy Type | # Households | Median Income |
| Owner-Occupied | 20,579 (51.6%) | $177,686 |
| Renter-Occupied | 19,337 (48.4%) | $127,025 |
| Average | 39,916 (100.0%) | $149,152 |
Occupancy by Householder Income Bracket in San Mateo
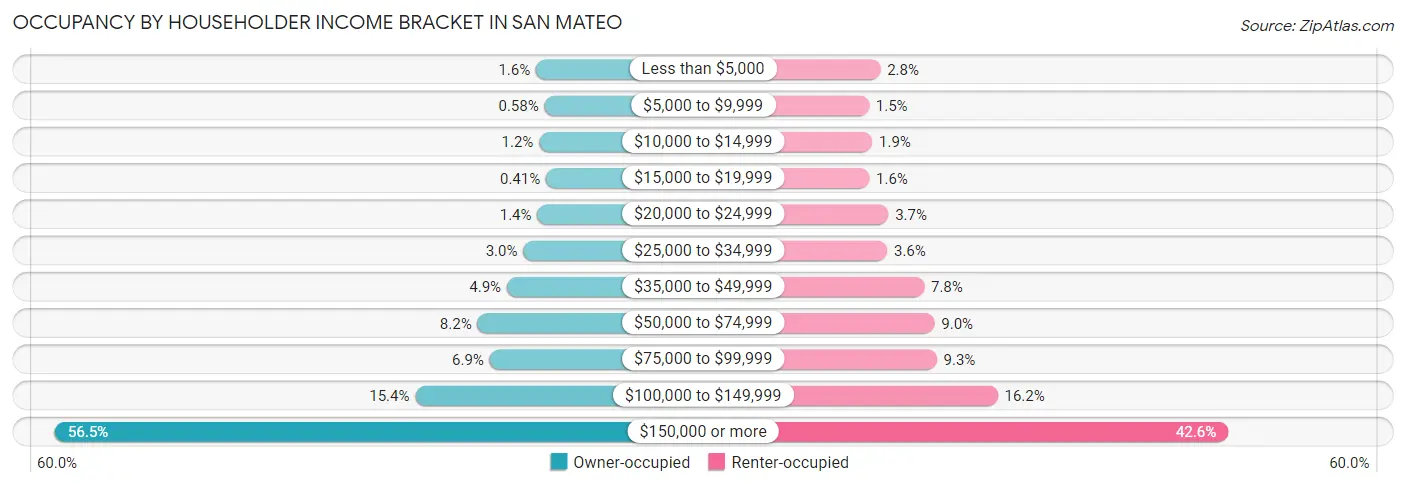
| Income Bracket | Owner-occupied | Renter-occupied |
| Less than $5,000 | 320 (1.5%) | 545 (2.8%) |
| $5,000 to $9,999 | 120 (0.6%) | 294 (1.5%) |
| $10,000 to $14,999 | 244 (1.2%) | 365 (1.9%) |
| $15,000 to $19,999 | 85 (0.4%) | 299 (1.5%) |
| $20,000 to $24,999 | 289 (1.4%) | 722 (3.7%) |
| $25,000 to $34,999 | 620 (3.0%) | 696 (3.6%) |
| $35,000 to $49,999 | 1,004 (4.9%) | 1,514 (7.8%) |
| $50,000 to $74,999 | 1,695 (8.2%) | 1,743 (9.0%) |
| $75,000 to $99,999 | 1,410 (6.9%) | 1,791 (9.3%) |
| $100,000 to $149,999 | 3,158 (15.3%) | 3,139 (16.2%) |
| $150,000 or more | 11,634 (56.5%) | 8,229 (42.6%) |
| Total | 20,579 (100.0%) | 19,337 (100.0%) |
Monthly Housing Cost Tiers in San Mateo
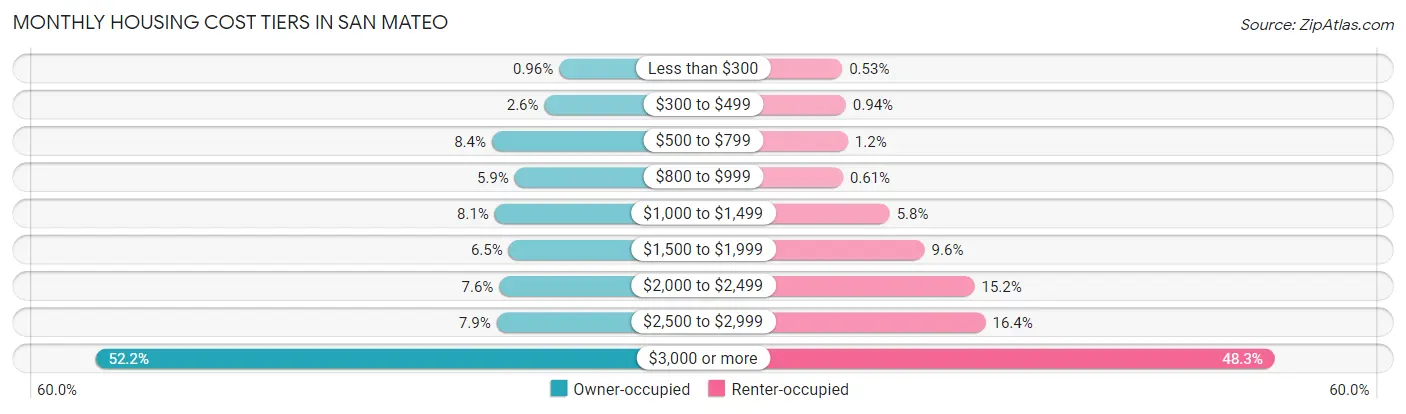
| Monthly Cost | Owner-occupied | Renter-occupied |
| Less than $300 | 198 (1.0%) | 102 (0.5%) |
| $300 to $499 | 531 (2.6%) | 182 (0.9%) |
| $500 to $799 | 1,726 (8.4%) | 225 (1.2%) |
| $800 to $999 | 1,207 (5.9%) | 117 (0.6%) |
| $1,000 to $1,499 | 1,661 (8.1%) | 1,118 (5.8%) |
| $1,500 to $1,999 | 1,346 (6.5%) | 1,865 (9.6%) |
| $2,000 to $2,499 | 1,557 (7.6%) | 2,929 (15.1%) |
| $2,500 to $2,999 | 1,619 (7.9%) | 3,164 (16.4%) |
| $3,000 or more | 10,734 (52.2%) | 9,339 (48.3%) |
| Total | 20,579 (100.0%) | 19,337 (100.0%) |
Physical Housing Characteristics in San Mateo
Housing Structures in San Mateo
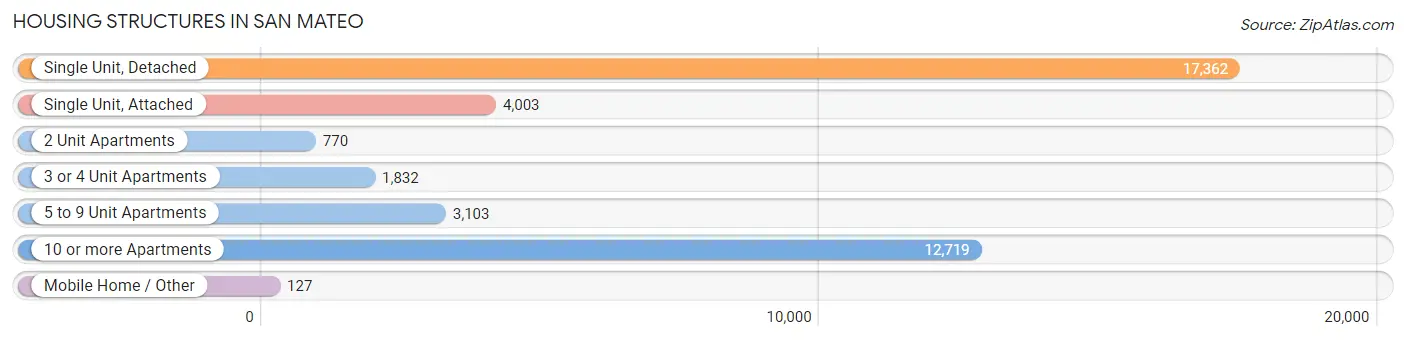
| Structure Type | # Housing Units | % Housing Units |
| Single Unit, Detached | 17,362 | 43.5% |
| Single Unit, Attached | 4,003 | 10.0% |
| 2 Unit Apartments | 770 | 1.9% |
| 3 or 4 Unit Apartments | 1,832 | 4.6% |
| 5 to 9 Unit Apartments | 3,103 | 7.8% |
| 10 or more Apartments | 12,719 | 31.9% |
| Mobile Home / Other | 127 | 0.3% |
| Total | 39,916 | 100.0% |
Housing Structures by Occupancy in San Mateo
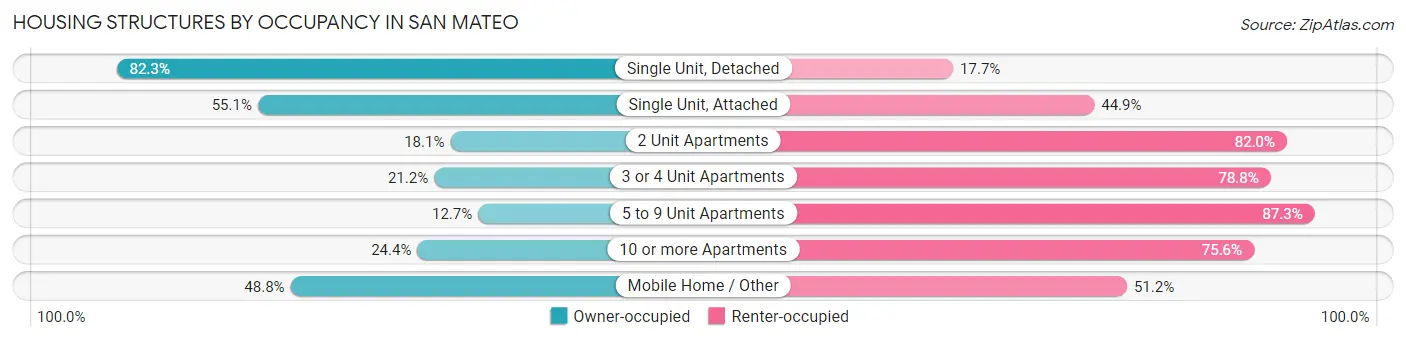
| Structure Type | Owner-occupied | Renter-occupied |
| Single Unit, Detached | 14,287 (82.3%) | 3,075 (17.7%) |
| Single Unit, Attached | 2,206 (55.1%) | 1,797 (44.9%) |
| 2 Unit Apartments | 139 (18.0%) | 631 (82.0%) |
| 3 or 4 Unit Apartments | 388 (21.2%) | 1,444 (78.8%) |
| 5 to 9 Unit Apartments | 394 (12.7%) | 2,709 (87.3%) |
| 10 or more Apartments | 3,103 (24.4%) | 9,616 (75.6%) |
| Mobile Home / Other | 62 (48.8%) | 65 (51.2%) |
| Total | 20,579 (51.6%) | 19,337 (48.4%) |
Housing Structures by Number of Rooms in San Mateo
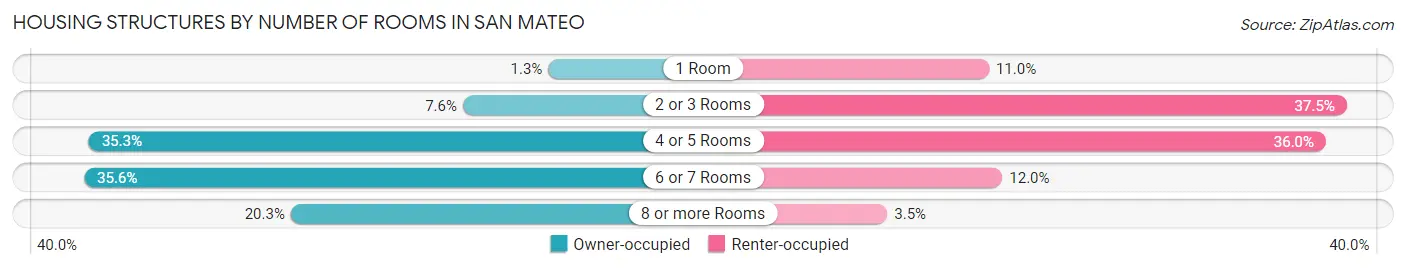
| Number of Rooms | Owner-occupied | Renter-occupied |
| 1 Room | 259 (1.3%) | 2,133 (11.0%) |
| 2 or 3 Rooms | 1,560 (7.6%) | 7,249 (37.5%) |
| 4 or 5 Rooms | 7,254 (35.2%) | 6,952 (35.9%) |
| 6 or 7 Rooms | 7,326 (35.6%) | 2,324 (12.0%) |
| 8 or more Rooms | 4,180 (20.3%) | 679 (3.5%) |
| Total | 20,579 (100.0%) | 19,337 (100.0%) |
Housing Structure by Heating Type in San Mateo
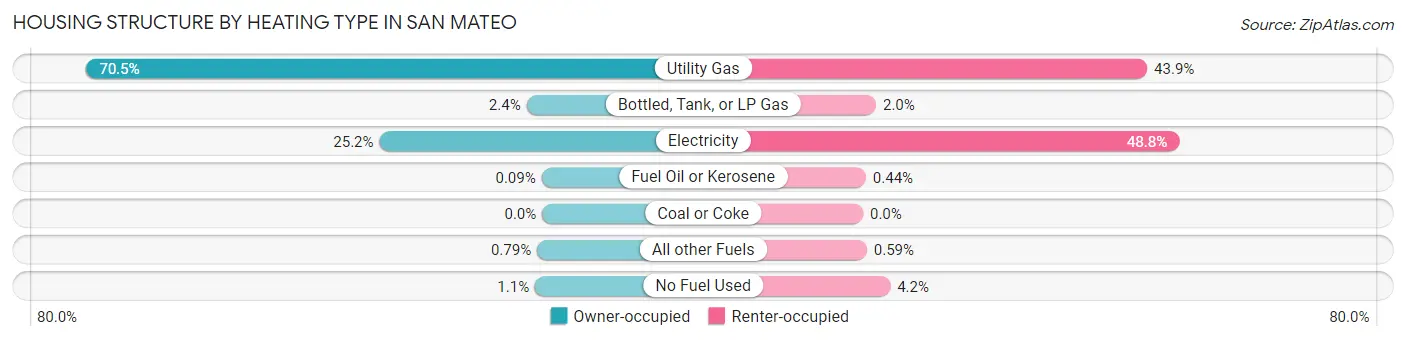
| Heating Type | Owner-occupied | Renter-occupied |
| Utility Gas | 14,497 (70.5%) | 8,492 (43.9%) |
| Bottled, Tank, or LP Gas | 496 (2.4%) | 388 (2.0%) |
| Electricity | 5,178 (25.2%) | 9,445 (48.8%) |
| Fuel Oil or Kerosene | 19 (0.1%) | 86 (0.4%) |
| Coal or Coke | 0 (0.0%) | 0 (0.0%) |
| All other Fuels | 163 (0.8%) | 114 (0.6%) |
| No Fuel Used | 226 (1.1%) | 812 (4.2%) |
| Total | 20,579 (100.0%) | 19,337 (100.0%) |
Household Vehicle Usage in San Mateo
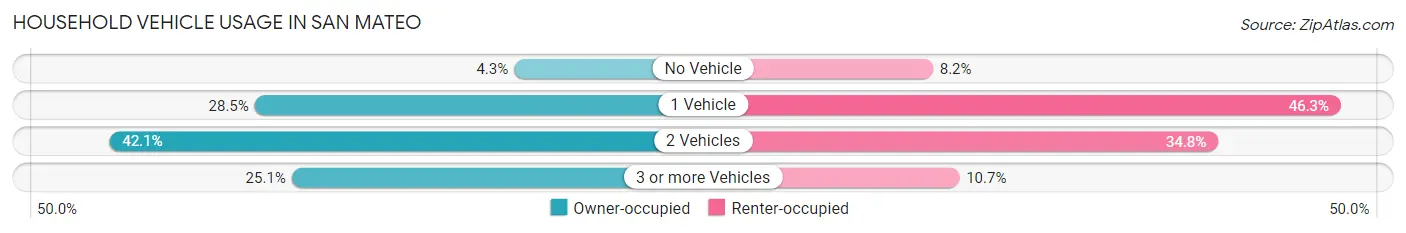
| Vehicles per Household | Owner-occupied | Renter-occupied |
| No Vehicle | 887 (4.3%) | 1,586 (8.2%) |
| 1 Vehicle | 5,871 (28.5%) | 8,952 (46.3%) |
| 2 Vehicles | 8,661 (42.1%) | 6,735 (34.8%) |
| 3 or more Vehicles | 5,160 (25.1%) | 2,064 (10.7%) |
| Total | 20,579 (100.0%) | 19,337 (100.0%) |
Real Estate & Mortgages in San Mateo
Real Estate and Mortgage Overview in San Mateo
| Characteristic | Without Mortgage | With Mortgage |
| Housing Units | 6,373 | 14,206 |
| Median Property Value | $1,419,900 | $1,546,300 |
| Median Household Income | $112,219 | $9,273 |
| Monthly Housing Costs | $945 | $10,607 |
| Real Estate Taxes | $5,806 | $84 |
Property Value by Mortgage Status in San Mateo
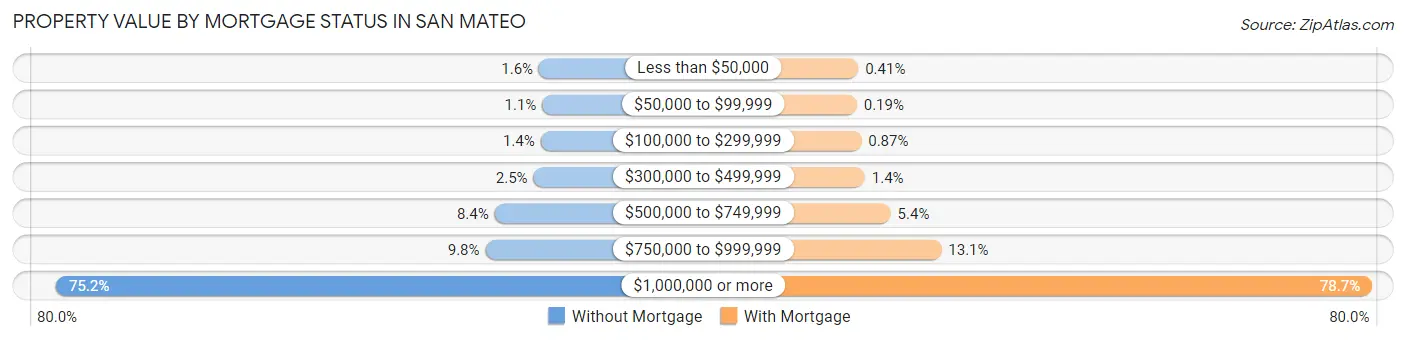
| Property Value | Without Mortgage | With Mortgage |
| Less than $50,000 | 104 (1.6%) | 58 (0.4%) |
| $50,000 to $99,999 | 72 (1.1%) | 27 (0.2%) |
| $100,000 to $299,999 | 88 (1.4%) | 123 (0.9%) |
| $300,000 to $499,999 | 157 (2.5%) | 202 (1.4%) |
| $500,000 to $749,999 | 535 (8.4%) | 760 (5.3%) |
| $750,000 to $999,999 | 624 (9.8%) | 1,858 (13.1%) |
| $1,000,000 or more | 4,793 (75.2%) | 11,178 (78.7%) |
| Total | 6,373 (100.0%) | 14,206 (100.0%) |
Household Income by Mortgage Status in San Mateo
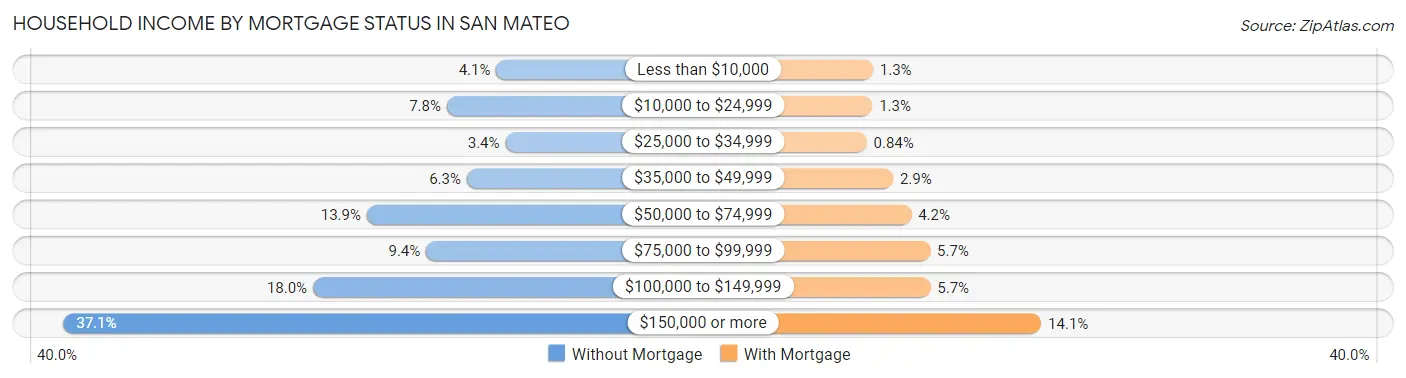
| Household Income | Without Mortgage | With Mortgage |
| Less than $10,000 | 259 (4.1%) | 187 (1.3%) |
| $10,000 to $24,999 | 499 (7.8%) | 181 (1.3%) |
| $25,000 to $34,999 | 215 (3.4%) | 119 (0.8%) |
| $35,000 to $49,999 | 402 (6.3%) | 405 (2.9%) |
| $50,000 to $74,999 | 888 (13.9%) | 602 (4.2%) |
| $75,000 to $99,999 | 600 (9.4%) | 807 (5.7%) |
| $100,000 to $149,999 | 1,149 (18.0%) | 810 (5.7%) |
| $150,000 or more | 2,361 (37.0%) | 2,009 (14.1%) |
| Total | 6,373 (100.0%) | 14,206 (100.0%) |
Property Value to Household Income Ratio in San Mateo
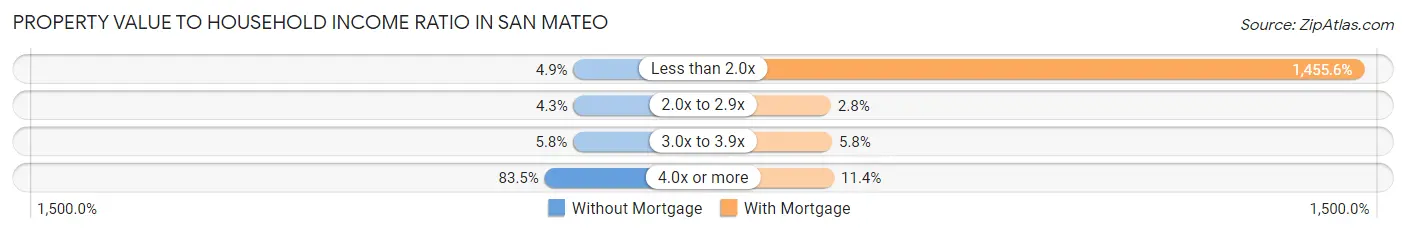
| Value-to-Income Ratio | Without Mortgage | With Mortgage |
| Less than 2.0x | 314 (4.9%) | 206,782 (1,455.6%) |
| 2.0x to 2.9x | 275 (4.3%) | 392 (2.8%) |
| 3.0x to 3.9x | 368 (5.8%) | 828 (5.8%) |
| 4.0x or more | 5,320 (83.5%) | 1,621 (11.4%) |
| Total | 6,373 (100.0%) | 14,206 (100.0%) |
Real Estate Taxes by Mortgage Status in San Mateo
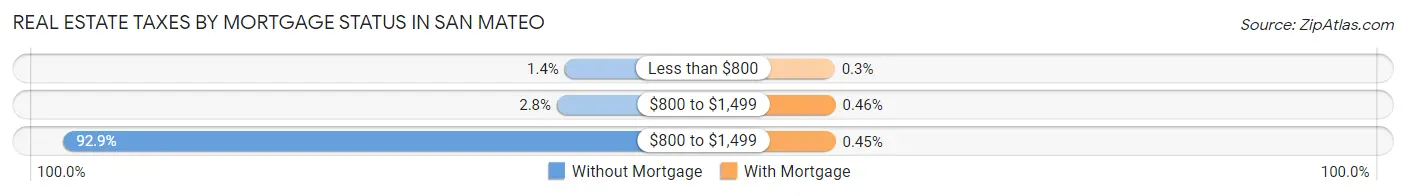
| Property Taxes | Without Mortgage | With Mortgage |
| Less than $800 | 86 (1.3%) | 43 (0.3%) |
| $800 to $1,499 | 177 (2.8%) | 65 (0.5%) |
| $800 to $1,499 | 5,922 (92.9%) | 64 (0.4%) |
| Total | 6,373 (100.0%) | 14,206 (100.0%) |
Health & Disability in San Mateo
Health Insurance Coverage by Age in San Mateo
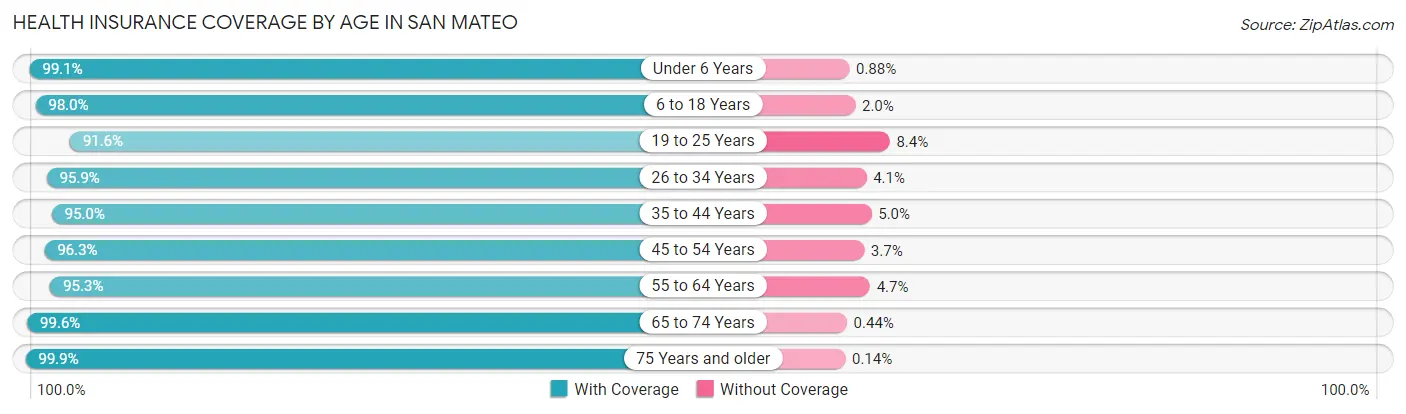
| Age Bracket | With Coverage | Without Coverage |
| Under 6 Years | 7,058 (99.1%) | 63 (0.9%) |
| 6 to 18 Years | 14,165 (98.0%) | 289 (2.0%) |
| 19 to 25 Years | 6,709 (91.6%) | 617 (8.4%) |
| 26 to 34 Years | 16,496 (95.9%) | 701 (4.1%) |
| 35 to 44 Years | 15,079 (95.0%) | 799 (5.0%) |
| 45 to 54 Years | 12,356 (96.3%) | 470 (3.7%) |
| 55 to 64 Years | 11,667 (95.3%) | 581 (4.7%) |
| 65 to 74 Years | 8,732 (99.6%) | 39 (0.4%) |
| 75 Years and older | 8,030 (99.9%) | 11 (0.1%) |
| Total | 100,292 (96.6%) | 3,570 (3.4%) |
Health Insurance Coverage by Citizenship Status in San Mateo
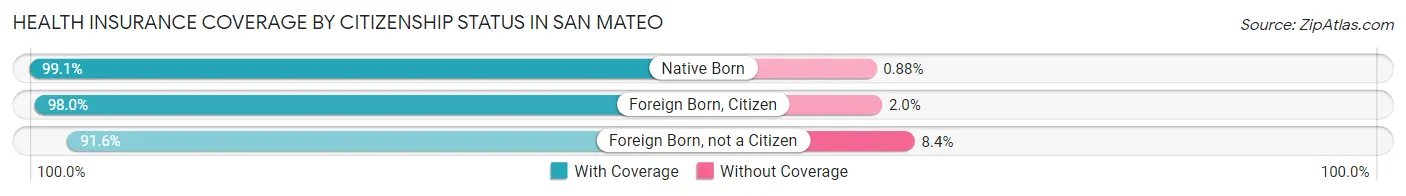
| Citizenship Status | With Coverage | Without Coverage |
| Native Born | 7,058 (99.1%) | 63 (0.9%) |
| Foreign Born, Citizen | 14,165 (98.0%) | 289 (2.0%) |
| Foreign Born, not a Citizen | 6,709 (91.6%) | 617 (8.4%) |
Health Insurance Coverage by Household Income in San Mateo
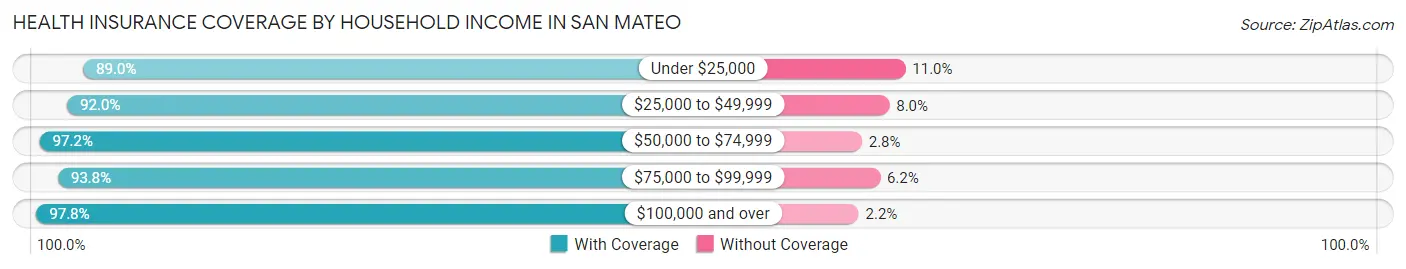
| Household Income | With Coverage | Without Coverage |
| Under $25,000 | 4,794 (89.0%) | 591 (11.0%) |
| $25,000 to $49,999 | 7,488 (92.0%) | 648 (8.0%) |
| $50,000 to $74,999 | 6,852 (97.2%) | 198 (2.8%) |
| $75,000 to $99,999 | 6,561 (93.8%) | 435 (6.2%) |
| $100,000 and over | 72,986 (97.8%) | 1,653 (2.2%) |
Public vs Private Health Insurance Coverage by Age in San Mateo
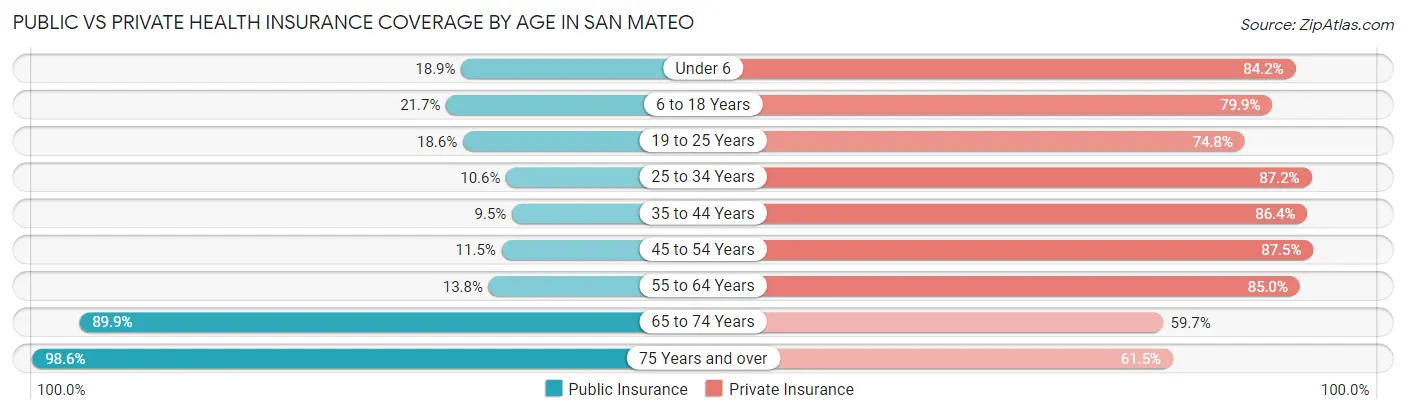
| Age Bracket | Public Insurance | Private Insurance |
| Under 6 | 1,348 (18.9%) | 5,995 (84.2%) |
| 6 to 18 Years | 3,142 (21.7%) | 11,549 (79.9%) |
| 19 to 25 Years | 1,364 (18.6%) | 5,479 (74.8%) |
| 25 to 34 Years | 1,821 (10.6%) | 14,991 (87.2%) |
| 35 to 44 Years | 1,508 (9.5%) | 13,722 (86.4%) |
| 45 to 54 Years | 1,469 (11.5%) | 11,224 (87.5%) |
| 55 to 64 Years | 1,695 (13.8%) | 10,413 (85.0%) |
| 65 to 74 Years | 7,882 (89.9%) | 5,239 (59.7%) |
| 75 Years and over | 7,927 (98.6%) | 4,941 (61.5%) |
| Total | 28,156 (27.1%) | 83,553 (80.4%) |
Disability Status by Sex by Age in San Mateo
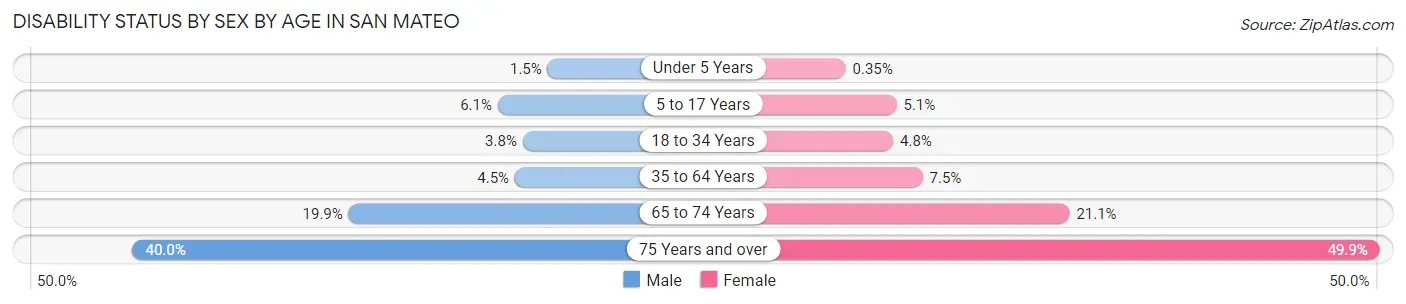
| Age Bracket | Male | Female |
| Under 5 Years | 49 (1.5%) | 10 (0.4%) |
| 5 to 17 Years | 439 (6.1%) | 357 (5.1%) |
| 18 to 34 Years | 516 (3.8%) | 570 (4.8%) |
| 35 to 64 Years | 924 (4.5%) | 1,528 (7.5%) |
| 65 to 74 Years | 817 (19.9%) | 987 (21.1%) |
| 75 Years and over | 1,175 (40.0%) | 2,547 (49.9%) |
Disability Class by Sex by Age in San Mateo
Disability Class: Hearing Difficulty
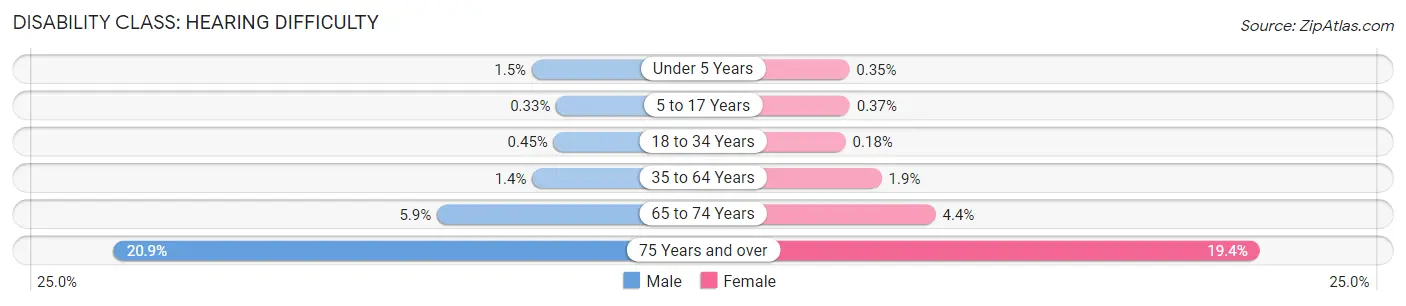
| Age Bracket | Male | Female |
| Under 5 Years | 49 (1.5%) | 10 (0.4%) |
| 5 to 17 Years | 24 (0.3%) | 26 (0.4%) |
| 18 to 34 Years | 61 (0.4%) | 21 (0.2%) |
| 35 to 64 Years | 297 (1.4%) | 377 (1.8%) |
| 65 to 74 Years | 240 (5.9%) | 203 (4.3%) |
| 75 Years and over | 613 (20.9%) | 989 (19.4%) |
Disability Class: Vision Difficulty
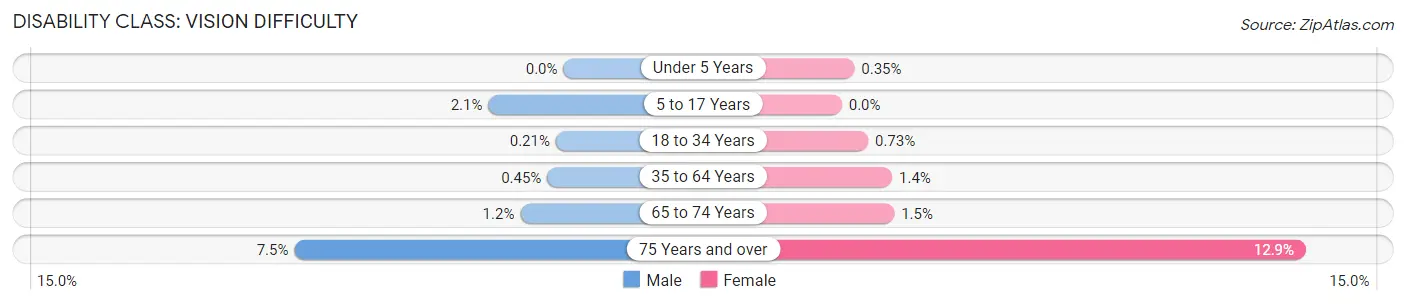
| Age Bracket | Male | Female |
| Under 5 Years | 0 (0.0%) | 10 (0.4%) |
| 5 to 17 Years | 151 (2.1%) | 0 (0.0%) |
| 18 to 34 Years | 29 (0.2%) | 87 (0.7%) |
| 35 to 64 Years | 92 (0.4%) | 286 (1.4%) |
| 65 to 74 Years | 49 (1.2%) | 68 (1.5%) |
| 75 Years and over | 220 (7.5%) | 659 (12.9%) |
Disability Class: Cognitive Difficulty
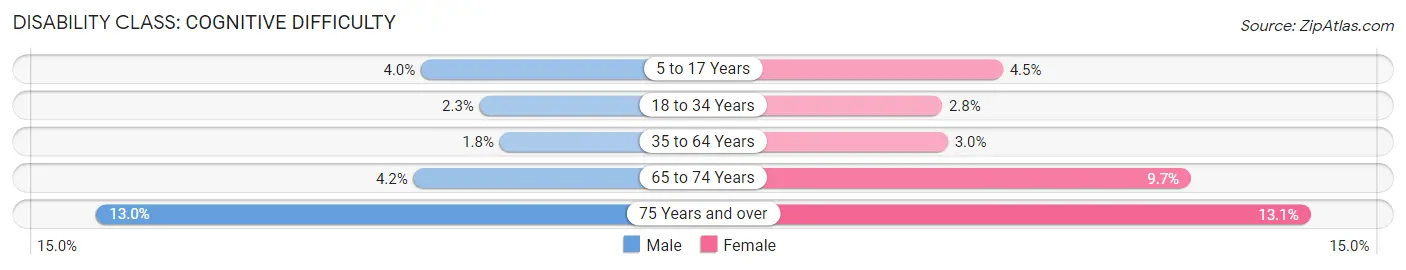
| Age Bracket | Male | Female |
| 5 to 17 Years | 286 (4.0%) | 315 (4.5%) |
| 18 to 34 Years | 319 (2.3%) | 334 (2.8%) |
| 35 to 64 Years | 364 (1.8%) | 602 (2.9%) |
| 65 to 74 Years | 171 (4.2%) | 454 (9.7%) |
| 75 Years and over | 382 (13.0%) | 666 (13.1%) |
Disability Class: Ambulatory Difficulty
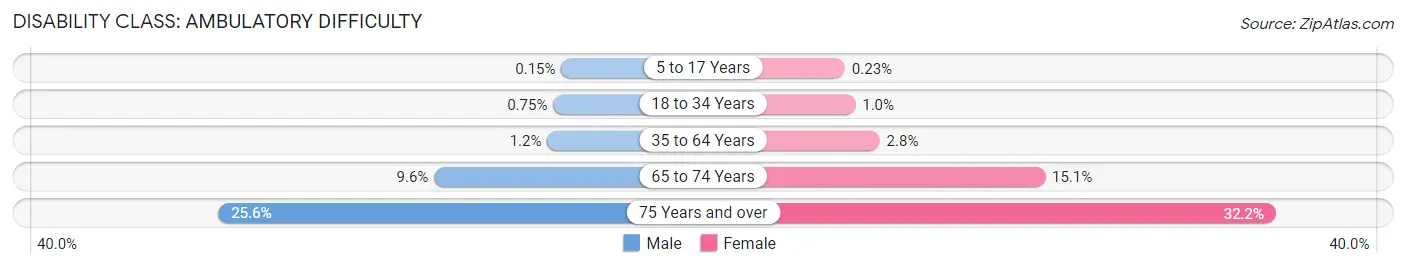
| Age Bracket | Male | Female |
| 5 to 17 Years | 11 (0.2%) | 16 (0.2%) |
| 18 to 34 Years | 103 (0.7%) | 120 (1.0%) |
| 35 to 64 Years | 245 (1.2%) | 573 (2.8%) |
| 65 to 74 Years | 393 (9.6%) | 705 (15.1%) |
| 75 Years and over | 753 (25.6%) | 1,644 (32.2%) |
Disability Class: Self-Care Difficulty
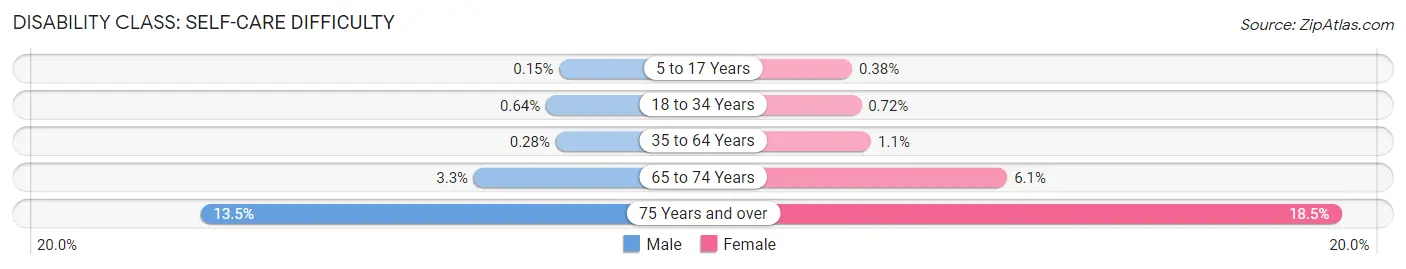
| Age Bracket | Male | Female |
| 5 to 17 Years | 11 (0.2%) | 27 (0.4%) |
| 18 to 34 Years | 88 (0.6%) | 86 (0.7%) |
| 35 to 64 Years | 58 (0.3%) | 222 (1.1%) |
| 65 to 74 Years | 136 (3.3%) | 287 (6.1%) |
| 75 Years and over | 396 (13.5%) | 946 (18.5%) |
Technology Access in San Mateo
Computing Device Access in San Mateo
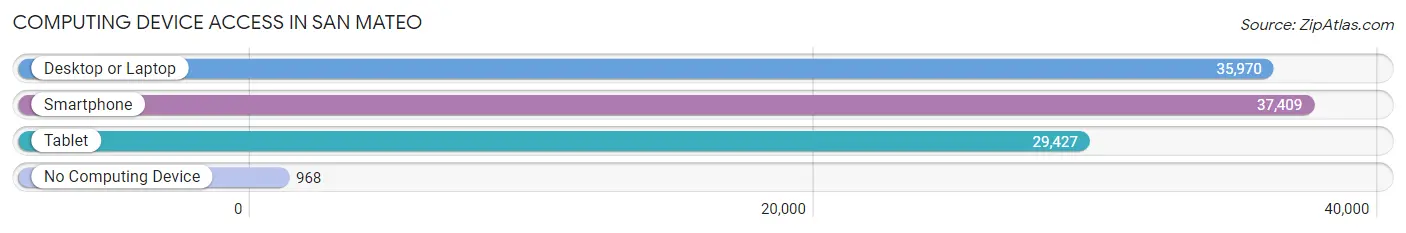
| Device Type | # Households | % Households |
| Desktop or Laptop | 35,970 | 90.1% |
| Smartphone | 37,409 | 93.7% |
| Tablet | 29,427 | 73.7% |
| No Computing Device | 968 | 2.4% |
| Total | 39,916 | 100.0% |
Internet Access in San Mateo
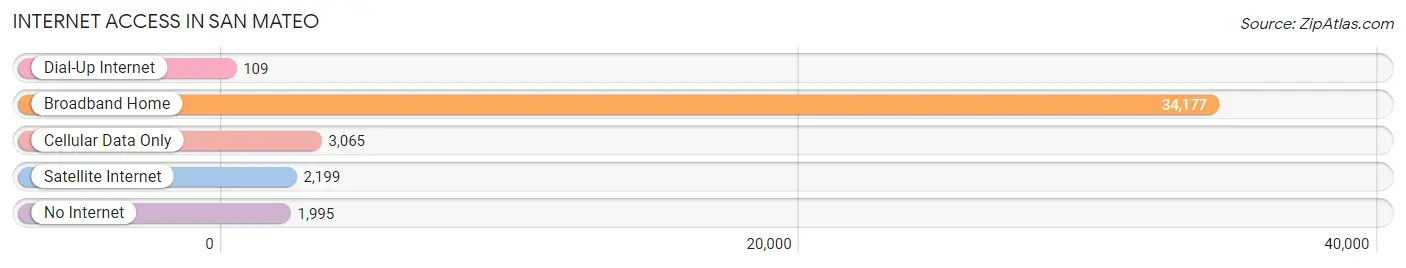
| Internet Type | # Households | % Households |
| Dial-Up Internet | 109 | 0.3% |
| Broadband Home | 34,177 | 85.6% |
| Cellular Data Only | 3,065 | 7.7% |
| Satellite Internet | 2,199 | 5.5% |
| No Internet | 1,995 | 5.0% |
| Total | 39,916 | 100.0% |
San Mateo Summary
San Mateo is a city located in the San Francisco Bay Area of California. It is the county seat of San Mateo County and is situated between the cities of San Francisco and San Jose. The city has a population of approximately 103,000 people and is part of the larger San Francisco-Oakland-Fremont metropolitan area.
History
The area that is now San Mateo was originally inhabited by the Ohlone people, who were the first inhabitants of the San Francisco Bay Area. The first European settlers arrived in the area in 1776, when the Spanish established a mission in the area. The mission was named after Saint Matthew, and the area became known as San Mateo.
In 1856, the county of San Mateo was established, and the city of San Mateo was incorporated in 1894. The city grew rapidly in the late 19th and early 20th centuries, and by the 1950s it had become a major suburban center.
Geography
San Mateo is located in the San Francisco Bay Area of California, about 20 miles south of San Francisco and 30 miles north of San Jose. The city is situated on the San Francisco Peninsula, between the San Francisco Bay and the Pacific Ocean.
The city has a total area of 22.2 square miles, of which 21.2 square miles is land and 1.0 square mile is water. The city is located at an elevation of 52 feet above sea level.
Economy
San Mateo is a major economic center in the San Francisco Bay Area. The city is home to a number of major corporations, including Oracle, Visa, and Sony. The city is also home to a number of smaller businesses, including tech startups, restaurants, and retail stores.
The city’s economy is also supported by its proximity to San Francisco and Silicon Valley. Many people who work in San Francisco and Silicon Valley live in San Mateo, and the city is home to a number of commuters who travel to and from the two cities for work.
Demographics
As of the 2010 census, the population of San Mateo was 103,536. The racial makeup of the city was 57.2% White, 11.2% African American, 0.7% Native American, 24.3% Asian, 0.2% Pacific Islander, 3.3% from other races, and 3.1% from two or more races. Hispanic or Latino of any race were 11.2% of the population.
The median household income in San Mateo was $90,837 in 2019, and the median home value was $1,092,000. The city has a high cost of living, with the median rent for a two-bedroom apartment being $3,400 in 2019.
San Mateo is a diverse city, with a variety of cultures and backgrounds represented. The city is home to a large Asian population, with the largest ethnic groups being Chinese, Filipino, and Indian. The city also has a large Hispanic population, with the largest ethnic groups being Mexican, Salvadoran, and Guatemalan.
Common Questions
What is Per Capita Income in San Mateo?
Per Capita income in San Mateo is $78,990.
What is the Median Family Income in San Mateo?
Median Family Income in San Mateo is $182,227.
What is the Median Household income in San Mateo?
Median Household Income in San Mateo is $149,152.
What is Income or Wage Gap in San Mateo?
Income or Wage Gap in San Mateo is 20.2%.
Women in San Mateo earn 79.8 cents for every dollar earned by a man.
What is Family Income Deficit in San Mateo?
Family Income Deficit in San Mateo is $11,079.
Families that are below poverty line in San Mateo earn $11,079 less on average than the poverty threshold level.
What is Inequality or Gini Index in San Mateo?
Inequality or Gini Index in San Mateo is 0.47.
What is the Total Population of San Mateo?
Total Population of San Mateo is 104,165.
What is the Total Male Population of San Mateo?
Total Male Population of San Mateo is 51,998.
What is the Total Female Population of San Mateo?
Total Female Population of San Mateo is 52,167.
What is the Ratio of Males per 100 Females in San Mateo?
There are 99.68 Males per 100 Females in San Mateo.
What is the Ratio of Females per 100 Males in San Mateo?
There are 100.33 Females per 100 Males in San Mateo.
What is the Median Population Age in San Mateo?
Median Population Age in San Mateo is 38.1 Years.
What is the Average Family Size in San Mateo
Average Family Size in San Mateo is 3.2 People.
What is the Average Household Size in San Mateo
Average Household Size in San Mateo is 2.6 People.
How Large is the Labor Force in San Mateo?
There are 60,081 People in the Labor Forcein in San Mateo.
What is the Percentage of People in the Labor Force in San Mateo?
70.1% of People are in the Labor Force in San Mateo.
What is the Unemployment Rate in San Mateo?
Unemployment Rate in San Mateo is 4.7%.