Cities with the Highest Percentage of Population Employed in Computer, Engineering & Science in Connecticut
RELATED REPORTS & OPTIONS
Computer, Engineering & Science
Connecticut
Compare Cities
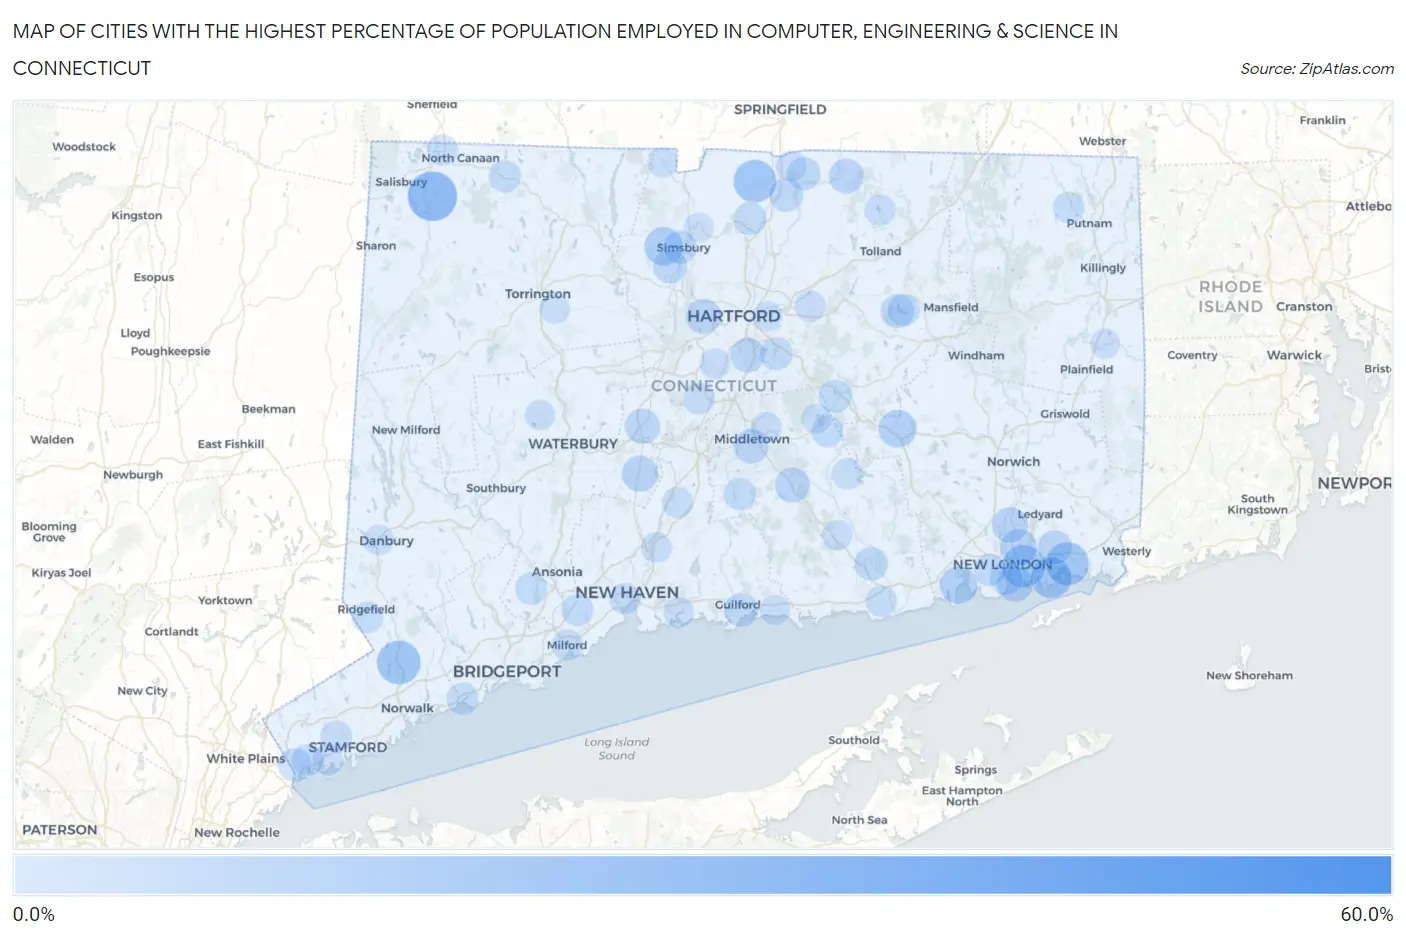
Map of Cities with the Highest Percentage of Population Employed in Computer, Engineering & Science in Connecticut
0.0%
60.0%
Cities with the Highest Percentage of Population Employed in Computer, Engineering & Science in Connecticut
| City | % Employed | vs State | vs National | |
| 1. | Chimney Point | 51.1% | 7.2%(+43.9)#1 | 6.8%(+44.4)#67 |
| 2. | Topstone | 43.1% | 7.2%(+35.8)#2 | 6.8%(+36.3)#97 |
| 3. | Falls Village | 26.5% | 7.2%(+19.3)#3 | 6.8%(+19.7)#300 |
| 4. | Wilton Center | 20.3% | 7.2%(+13.0)#4 | 6.8%(+13.5)#546 |
| 5. | Mystic | 19.5% | 7.2%(+12.3)#5 | 6.8%(+12.8)#586 |
| 6. | Suffield Depot | 19.3% | 7.2%(+12.1)#6 | 6.8%(+12.6)#603 |
| 7. | Long Hill | 18.9% | 7.2%(+11.7)#7 | 6.8%(+12.2)#646 |
| 8. | Noank | 17.7% | 7.2%(+10.5)#8 | 6.8%(+10.9)#758 |
| 9. | Ridgebury | 15.4% | 7.2%(+8.15)#9 | 6.8%(+8.61)#1,070 |
| 10. | West Simsbury | 14.7% | 7.2%(+7.48)#10 | 6.8%(+7.95)#1,192 |
| 11. | Weston | 14.3% | 7.2%(+7.12)#11 | 6.8%(+7.59)#1,260 |
| 12. | Niantic | 14.0% | 7.2%(+6.76)#12 | 6.8%(+7.23)#1,339 |
| 13. | Colchester | 14.0% | 7.2%(+6.72)#13 | 6.8%(+7.19)#1,344 |
| 14. | Route 7 Gateway | 13.7% | 7.2%(+6.50)#14 | 6.8%(+6.96)#1,413 |
| 15. | Lake Chaffee | 13.4% | 7.2%(+6.20)#15 | 6.8%(+6.67)#1,511 |
| 16. | New Canaan | 13.1% | 7.2%(+5.87)#16 | 6.8%(+6.34)#1,598 |
| 17. | Conning Towers Nautilus Park | 13.0% | 7.2%(+5.81)#17 | 6.8%(+6.27)#1,621 |
| 18. | Groton | 12.3% | 7.2%(+5.06)#18 | 6.8%(+5.52)#1,848 |
| 19. | Murray | 12.2% | 7.2%(+4.98)#19 | 6.8%(+5.45)#1,884 |
| 20. | Cheshire Village | 12.2% | 7.2%(+4.98)#20 | 6.8%(+5.44)#1,887 |
| 21. | Daniels Farm | 12.1% | 7.2%(+4.85)#21 | 6.8%(+5.31)#1,920 |
| 22. | Gales Ferry | 11.9% | 7.2%(+4.68)#22 | 6.8%(+5.14)#1,976 |
| 23. | Hawleyville | 11.8% | 7.2%(+4.61)#23 | 6.8%(+5.08)#1,993 |
| 24. | Dayville | 11.4% | 7.2%(+4.16)#24 | 6.8%(+4.63)#2,167 |
| 25. | Plantsville | 11.3% | 7.2%(+4.09)#25 | 6.8%(+4.56)#2,211 |
| 26. | Higganum | 11.2% | 7.2%(+3.93)#26 | 6.8%(+4.39)#2,291 |
| 27. | Trumbull Center | 11.1% | 7.2%(+3.89)#27 | 6.8%(+4.35)#2,305 |
| 28. | West Hartford | 11.1% | 7.2%(+3.86)#28 | 6.8%(+4.33)#2,333 |
| 29. | South Wilton | 11.0% | 7.2%(+3.74)#29 | 6.8%(+4.20)#2,385 |
| 30. | Somers | 10.9% | 7.2%(+3.69)#30 | 6.8%(+4.15)#2,406 |
| 31. | Middletown | 10.7% | 7.2%(+3.44)#31 | 6.8%(+3.90)#2,542 |
| 32. | Wethersfield | 10.6% | 7.2%(+3.42)#32 | 6.8%(+3.88)#2,550 |
| 33. | Old Mystic | 10.6% | 7.2%(+3.35)#33 | 6.8%(+3.82)#2,590 |
| 34. | Sandy Hook | 10.4% | 7.2%(+3.15)#34 | 6.8%(+3.62)#2,707 |
| 35. | Weatogue | 10.0% | 7.2%(+2.80)#35 | 6.8%(+3.26)#2,931 |
| 36. | Guilford Center | 9.9% | 7.2%(+2.70)#36 | 6.8%(+3.16)#2,988 |
| 37. | Southwood Acres | 9.9% | 7.2%(+2.64)#37 | 6.8%(+3.11)#3,028 |
| 38. | Essex Village | 9.9% | 7.2%(+2.63)#38 | 6.8%(+3.10)#3,030 |
| 39. | Plattsville | 9.8% | 7.2%(+2.53)#39 | 6.8%(+3.00)#3,102 |
| 40. | Coventry Lake | 9.7% | 7.2%(+2.49)#40 | 6.8%(+2.96)#3,136 |
| 41. | Bigelow Corners | 9.7% | 7.2%(+2.48)#41 | 6.8%(+2.94)#3,149 |
| 42. | Pemberwick | 9.7% | 7.2%(+2.45)#42 | 6.8%(+2.91)#3,170 |
| 43. | Stratford Downtown | 9.7% | 7.2%(+2.43)#43 | 6.8%(+2.90)#3,182 |
| 44. | Quasset Lake | 9.7% | 7.2%(+2.42)#44 | 6.8%(+2.89)#3,193 |
| 45. | Simsbury Center | 9.5% | 7.2%(+2.22)#45 | 6.8%(+2.69)#3,348 |
| 46. | Hazardville | 9.4% | 7.2%(+2.21)#46 | 6.8%(+2.67)#3,356 |
| 47. | Windsor Locks | 9.2% | 7.2%(+1.96)#47 | 6.8%(+2.42)#3,553 |
| 48. | Glastonbury Center | 9.1% | 7.2%(+1.90)#48 | 6.8%(+2.37)#3,595 |
| 49. | Terramuggus | 9.1% | 7.2%(+1.88)#49 | 6.8%(+2.35)#3,609 |
| 50. | New London | 9.0% | 7.2%(+1.73)#50 | 6.8%(+2.19)#3,748 |
| 51. | Candlewood Orchards | 8.6% | 7.2%(+1.41)#51 | 6.8%(+1.87)#4,031 |
| 52. | South Coventry | 8.4% | 7.2%(+1.16)#52 | 6.8%(+1.63)#4,280 |
| 53. | Durham | 8.4% | 7.2%(+1.15)#53 | 6.8%(+1.61)#4,289 |
| 54. | Stonington Borough | 8.4% | 7.2%(+1.12)#54 | 6.8%(+1.59)#4,312 |
| 55. | Shelton | 8.3% | 7.2%(+1.10)#55 | 6.8%(+1.57)#4,323 |
| 56. | Norfolk | 8.3% | 7.2%(+1.03)#56 | 6.8%(+1.50)#4,398 |
| 57. | Waterford | 8.2% | 7.2%(+0.992)#57 | 6.8%(+1.46)#4,447 |
| 58. | Cornwall Bridge | 8.2% | 7.2%(+0.933)#58 | 6.8%(+1.40)#4,517 |
| 59. | Southport | 8.1% | 7.2%(+0.881)#59 | 6.8%(+1.35)#4,567 |
| 60. | Orange | 8.1% | 7.2%(+0.825)#60 | 6.8%(+1.29)#4,624 |
| 61. | Poplar Plains | 8.0% | 7.2%(+0.770)#61 | 6.8%(+1.24)#4,697 |
| 62. | East Hampton | 7.9% | 7.2%(+0.715)#62 | 6.8%(+1.18)#4,766 |
| 63. | Lakeside Woods | 7.8% | 7.2%(+0.582)#63 | 6.8%(+1.05)#4,924 |
| 64. | Stepney | 7.7% | 7.2%(+0.507)#64 | 6.8%(+0.972)#5,025 |
| 65. | Greenwich | 7.7% | 7.2%(+0.499)#65 | 6.8%(+0.964)#5,036 |
| 66. | Woodmont Borough | 7.7% | 7.2%(+0.494)#66 | 6.8%(+0.960)#5,040 |
| 67. | Stamford | 7.7% | 7.2%(+0.459)#67 | 6.8%(+0.924)#5,095 |
| 68. | Kensington | 7.7% | 7.2%(+0.458)#68 | 6.8%(+0.923)#5,097 |
| 69. | Moodus | 7.4% | 7.2%(+0.170)#69 | 6.8%(+0.635)#5,412 |
| 70. | Old Saybrook Center | 7.2% | 7.2%(-0.013)#70 | 6.8%(+0.453)#5,631 |
| 71. | Crystal Lake | 7.2% | 7.2%(-0.063)#71 | 6.8%(+0.403)#5,705 |
| 72. | Wallingford Center | 7.2% | 7.2%(-0.074)#72 | 6.8%(+0.391)#5,720 |
| 73. | South Woodstock | 7.2% | 7.2%(-0.080)#73 | 6.8%(+0.385)#5,725 |
| 74. | Ridgefield | 7.1% | 7.2%(-0.125)#74 | 6.8%(+0.341)#5,808 |
| 75. | Milford City Balance | 7.1% | 7.2%(-0.134)#75 | 6.8%(+0.332)#5,817 |
| 76. | New Haven | 7.0% | 7.2%(-0.190)#76 | 6.8%(+0.275)#5,904 |
| 77. | Manchester | 7.0% | 7.2%(-0.220)#77 | 6.8%(+0.246)#5,941 |
| 78. | Portland | 7.0% | 7.2%(-0.235)#78 | 6.8%(+0.230)#5,961 |
| 79. | Riverside | 7.0% | 7.2%(-0.246)#79 | 6.8%(+0.220)#5,978 |
| 80. | Canaan | 7.0% | 7.2%(-0.253)#80 | 6.8%(+0.212)#5,985 |
| 81. | Candlewood Knolls | 6.9% | 7.2%(-0.286)#81 | 6.8%(+0.180)#6,030 |
| 82. | Darien Downtown | 6.9% | 7.2%(-0.299)#82 | 6.8%(+0.166)#6,053 |
| 83. | Knollcrest | 6.8% | 7.2%(-0.388)#83 | 6.8%(+0.077)#6,192 |
| 84. | Westport | 6.8% | 7.2%(-0.389)#84 | 6.8%(+0.077)#6,193 |
| 85. | Sherwood Manor | 6.8% | 7.2%(-0.433)#85 | 6.8%(+0.033)#6,268 |
| 86. | Newington | 6.8% | 7.2%(-0.458)#86 | 6.8%(+0.008)#6,303 |
| 87. | Branford Center | 6.6% | 7.2%(-0.604)#87 | 6.8%(-0.139)#6,505 |
| 88. | North Haven | 6.6% | 7.2%(-0.644)#88 | 6.8%(-0.178)#6,569 |
| 89. | Madison Center | 6.5% | 7.2%(-0.767)#89 | 6.8%(-0.301)#6,760 |
| 90. | Chester Center | 6.3% | 7.2%(-0.922)#90 | 6.8%(-0.456)#7,028 |
| 91. | Danbury | 6.3% | 7.2%(-0.938)#91 | 6.8%(-0.473)#7,054 |
| 92. | Watertown | 6.3% | 7.2%(-0.947)#92 | 6.8%(-0.482)#7,074 |
| 93. | Lake Pocotopaug | 6.3% | 7.2%(-0.961)#93 | 6.8%(-0.496)#7,091 |
| 94. | East Hartford | 6.1% | 7.2%(-1.09)#94 | 6.8%(-0.621)#7,317 |
| 95. | Northwest Harwinton | 6.1% | 7.2%(-1.09)#95 | 6.8%(-0.626)#7,327 |
| 96. | Moosup | 6.1% | 7.2%(-1.14)#96 | 6.8%(-0.676)#7,400 |
| 97. | Inglenook | 6.0% | 7.2%(-1.22)#97 | 6.8%(-0.757)#7,573 |
| 98. | Naugatuck Borough | 6.0% | 7.2%(-1.26)#98 | 6.8%(-0.794)#7,642 |
| 99. | North Granby | 5.9% | 7.2%(-1.30)#99 | 6.8%(-0.836)#7,728 |
| 100. | Tariffville | 5.9% | 7.2%(-1.33)#100 | 6.8%(-0.861)#7,768 |
Common Questions
What are the Top 10 Cities with the Highest Percentage of Population Employed in Computer, Engineering & Science in Connecticut?
Top 10 Cities with the Highest Percentage of Population Employed in Computer, Engineering & Science in Connecticut are:
#1
26.5%
#2
20.3%
#3
19.5%
#4
19.3%
#5
18.9%
#6
17.7%
#7
14.7%
#8
14.0%
#9
14.0%
#10
13.0%
What city has the Highest Percentage of Population Employed in Computer, Engineering & Science in Connecticut?
Falls Village has the Highest Percentage of Population Employed in Computer, Engineering & Science in Connecticut with 26.5%.
What is the Percentage of Population Employed in Computer, Engineering & Science in the State of Connecticut?
Percentage of Population Employed in Computer, Engineering & Science in Connecticut is 7.2%.
What is the Percentage of Population Employed in Computer, Engineering & Science in the United States?
Percentage of Population Employed in Computer, Engineering & Science in the United States is 6.8%.