Cities with the Highest Percentage of Population Employed in Computer, Engineering & Science in Massachusetts
RELATED REPORTS & OPTIONS
Computer, Engineering & Science
Massachusetts
Compare Cities
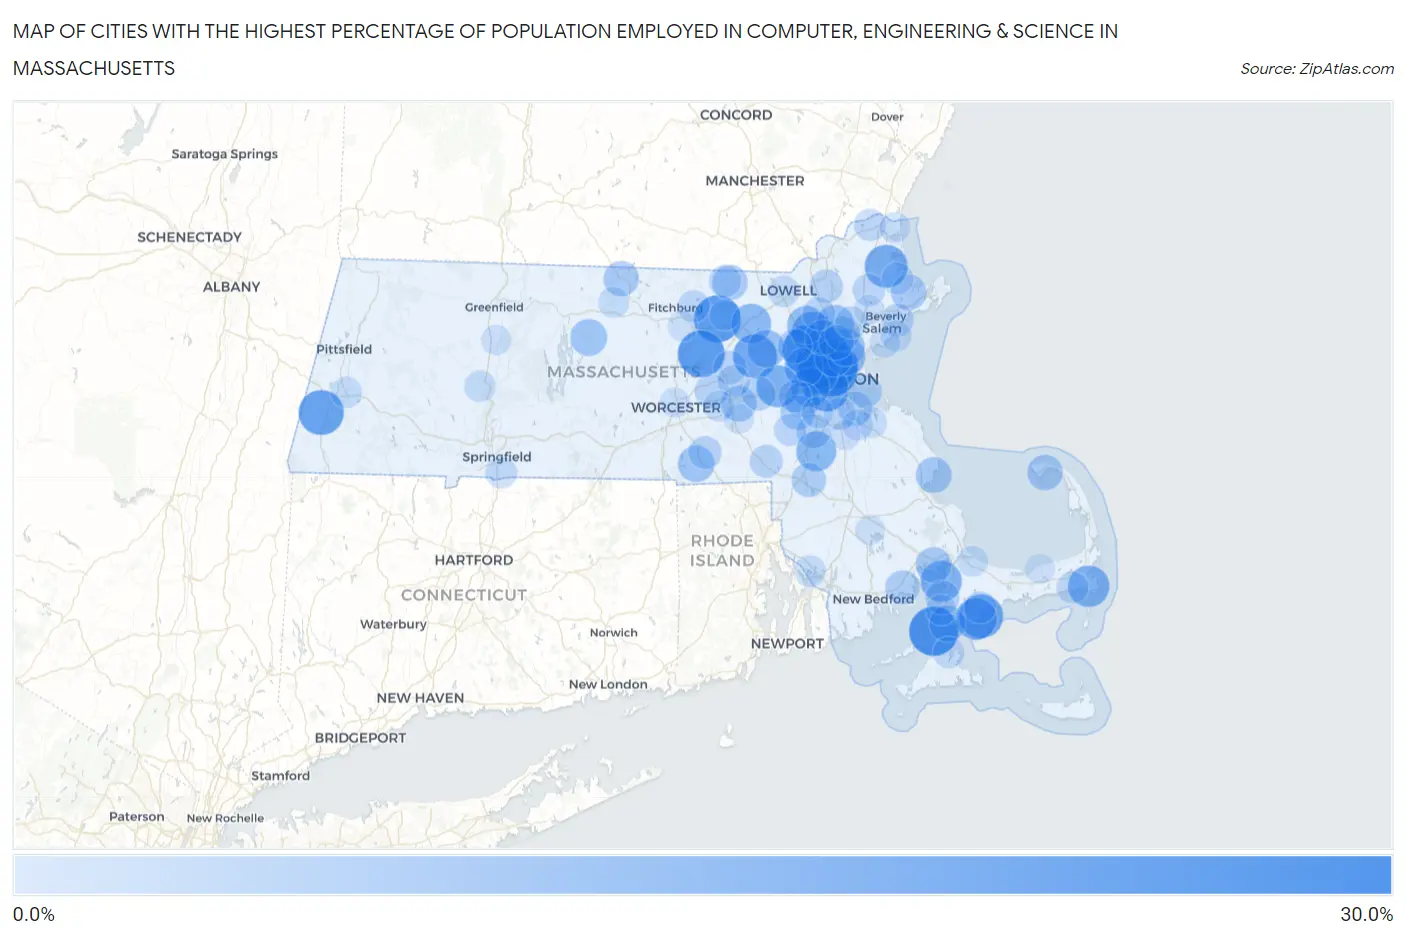
Map of Cities with the Highest Percentage of Population Employed in Computer, Engineering & Science in Massachusetts
0.0%
30.0%
Cities with the Highest Percentage of Population Employed in Computer, Engineering & Science in Massachusetts
| City | % Employed | vs State | vs National | |
| 1. | Cambridge | 25.8% | 9.8%(+16.0)#1 | 6.8%(+19.1)#312 |
| 2. | Lexington | 25.8% | 9.8%(+15.9)#2 | 6.8%(+19.0)#314 |
| 3. | Woods Hole | 25.5% | 9.8%(+15.7)#3 | 6.8%(+18.8)#319 |
| 4. | Devens | 23.6% | 9.8%(+13.7)#4 | 6.8%(+16.8)#375 |
| 5. | South Lancaster | 23.3% | 9.8%(+13.5)#5 | 6.8%(+16.6)#380 |
| 6. | Arlington | 23.3% | 9.8%(+13.5)#6 | 6.8%(+16.6)#382 |
| 7. | Somerville | 22.8% | 9.8%(+13.0)#7 | 6.8%(+16.1)#410 |
| 8. | Brookline | 21.8% | 9.8%(+12.0)#8 | 6.8%(+15.0)#458 |
| 9. | Housatonic | 21.6% | 9.8%(+11.8)#9 | 6.8%(+14.9)#466 |
| 10. | Belmont | 21.6% | 9.8%(+11.7)#10 | 6.8%(+14.8)#471 |
| 11. | Popponesset | 20.6% | 9.8%(+10.8)#11 | 6.8%(+13.9)#529 |
| 12. | Maynard | 20.6% | 9.8%(+10.7)#12 | 6.8%(+13.8)#530 |
| 13. | Rowley | 19.5% | 9.8%(+9.71)#13 | 6.8%(+12.8)#585 |
| 14. | Cochituate | 18.7% | 9.8%(+8.91)#14 | 6.8%(+12.0)#660 |
| 15. | New Seabury | 18.5% | 9.8%(+8.62)#15 | 6.8%(+11.7)#683 |
| 16. | Burlington | 18.2% | 9.8%(+8.33)#16 | 6.8%(+11.4)#713 |
| 17. | West Chatham | 18.2% | 9.8%(+8.32)#17 | 6.8%(+11.4)#715 |
| 18. | Winchester | 18.1% | 9.8%(+8.22)#18 | 6.8%(+11.3)#724 |
| 19. | Pocasset | 17.9% | 9.8%(+8.08)#19 | 6.8%(+11.2)#737 |
| 20. | Watertown Town | 17.6% | 9.8%(+7.81)#20 | 6.8%(+10.9)#760 |
| 21. | Sharon | 16.8% | 9.8%(+6.91)#21 | 6.8%(+9.99)#864 |
| 22. | Littleton Common | 16.7% | 9.8%(+6.87)#22 | 6.8%(+9.94)#869 |
| 23. | Newton | 15.8% | 9.8%(+5.99)#23 | 6.8%(+9.06)#986 |
| 24. | Waltham | 15.6% | 9.8%(+5.74)#24 | 6.8%(+8.81)#1,025 |
| 25. | Malden | 15.2% | 9.8%(+5.35)#25 | 6.8%(+8.43)#1,101 |
| 26. | Pinehurst | 15.1% | 9.8%(+5.30)#26 | 6.8%(+8.37)#1,115 |
| 27. | Medford | 15.1% | 9.8%(+5.24)#27 | 6.8%(+8.31)#1,122 |
| 28. | West Concord | 14.8% | 9.8%(+4.97)#28 | 6.8%(+8.04)#1,176 |
| 29. | Reading | 14.7% | 9.8%(+4.86)#29 | 6.8%(+7.93)#1,200 |
| 30. | Melrose | 14.4% | 9.8%(+4.53)#30 | 6.8%(+7.60)#1,250 |
| 31. | Petersham | 13.8% | 9.8%(+3.96)#31 | 6.8%(+7.03)#1,397 |
| 32. | East Douglas | 13.6% | 9.8%(+3.78)#32 | 6.8%(+6.85)#1,453 |
| 33. | Falmouth | 13.3% | 9.8%(+3.46)#33 | 6.8%(+6.53)#1,551 |
| 34. | Duxbury | 12.9% | 9.8%(+3.09)#34 | 6.8%(+6.16)#1,651 |
| 35. | Onset | 12.8% | 9.8%(+2.92)#35 | 6.8%(+5.99)#1,707 |
| 36. | Provincetown | 12.7% | 9.8%(+2.84)#36 | 6.8%(+5.91)#1,734 |
| 37. | Cordaville | 12.7% | 9.8%(+2.82)#37 | 6.8%(+5.89)#1,736 |
| 38. | Needham | 12.6% | 9.8%(+2.81)#38 | 6.8%(+5.88)#1,740 |
| 39. | Essex | 12.6% | 9.8%(+2.78)#39 | 6.8%(+5.85)#1,747 |
| 40. | East Pepperell | 12.5% | 9.8%(+2.62)#40 | 6.8%(+5.69)#1,793 |
| 41. | Winchendon | 12.4% | 9.8%(+2.58)#41 | 6.8%(+5.65)#1,805 |
| 42. | Woburn | 12.3% | 9.8%(+2.43)#42 | 6.8%(+5.50)#1,854 |
| 43. | Wakefield | 12.2% | 9.8%(+2.38)#43 | 6.8%(+5.45)#1,879 |
| 44. | Stoneham | 11.8% | 9.8%(+2.00)#44 | 6.8%(+5.07)#1,996 |
| 45. | Dover | 11.8% | 9.8%(+1.95)#45 | 6.8%(+5.02)#2,013 |
| 46. | Hanscom Afb | 11.6% | 9.8%(+1.74)#46 | 6.8%(+4.81)#2,078 |
| 47. | Mattapoisett Center | 11.6% | 9.8%(+1.73)#47 | 6.8%(+4.80)#2,085 |
| 48. | Mansfield Center | 11.5% | 9.8%(+1.64)#48 | 6.8%(+4.71)#2,135 |
| 49. | Quincy | 11.4% | 9.8%(+1.59)#49 | 6.8%(+4.66)#2,154 |
| 50. | Norwood | 11.4% | 9.8%(+1.58)#50 | 6.8%(+4.65)#2,160 |
| 51. | North Falmouth | 11.3% | 9.8%(+1.43)#51 | 6.8%(+4.50)#2,231 |
| 52. | Boston | 10.9% | 9.8%(+1.05)#52 | 6.8%(+4.12)#2,426 |
| 53. | Framingham | 10.8% | 9.8%(+0.996)#53 | 6.8%(+4.07)#2,454 |
| 54. | Andover | 10.8% | 9.8%(+0.926)#54 | 6.8%(+4.00)#2,484 |
| 55. | Hudson | 10.6% | 9.8%(+0.773)#55 | 6.8%(+3.84)#2,572 |
| 56. | Northborough | 10.5% | 9.8%(+0.644)#56 | 6.8%(+3.72)#2,649 |
| 57. | Whitinsville | 10.4% | 9.8%(+0.586)#57 | 6.8%(+3.66)#2,679 |
| 58. | Franklin Town | 10.2% | 9.8%(+0.388)#58 | 6.8%(+3.46)#2,799 |
| 59. | Wilmington | 10.2% | 9.8%(+0.325)#59 | 6.8%(+3.40)#2,843 |
| 60. | Beverly | 10.2% | 9.8%(+0.315)#60 | 6.8%(+3.39)#2,855 |
| 61. | Wellesley | 10.1% | 9.8%(+0.226)#61 | 6.8%(+3.30)#2,909 |
| 62. | Topsfield | 9.9% | 9.8%(+0.060)#62 | 6.8%(+3.13)#3,007 |
| 63. | Marlborough | 9.9% | 9.8%(+0.023)#63 | 6.8%(+3.09)#3,031 |
| 64. | Pepperell | 9.7% | 9.8%(-0.152)#64 | 6.8%(+2.92)#3,166 |
| 65. | Milton | 9.7% | 9.8%(-0.178)#65 | 6.8%(+2.89)#3,188 |
| 66. | Lynnfield | 9.6% | 9.8%(-0.249)#66 | 6.8%(+2.82)#3,245 |
| 67. | Lunenburg | 9.5% | 9.8%(-0.327)#67 | 6.8%(+2.74)#3,308 |
| 68. | Medfield | 9.4% | 9.8%(-0.423)#68 | 6.8%(+2.65)#3,380 |
| 69. | Harwich Port | 9.4% | 9.8%(-0.467)#69 | 6.8%(+2.60)#3,419 |
| 70. | Amesbury Town | 9.4% | 9.8%(-0.471)#70 | 6.8%(+2.60)#3,422 |
| 71. | Mashpee Neck | 9.3% | 9.8%(-0.498)#71 | 6.8%(+2.57)#3,438 |
| 72. | Ipswich | 9.3% | 9.8%(-0.548)#72 | 6.8%(+2.52)#3,477 |
| 73. | Lowell | 9.3% | 9.8%(-0.579)#73 | 6.8%(+2.49)#3,508 |
| 74. | Longmeadow | 9.2% | 9.8%(-0.639)#74 | 6.8%(+2.43)#3,548 |
| 75. | Amherst | 9.0% | 9.8%(-0.809)#75 | 6.8%(+2.26)#3,687 |
| 76. | Vineyard Haven | 9.0% | 9.8%(-0.823)#76 | 6.8%(+2.25)#3,695 |
| 77. | Ocean Grove | 9.0% | 9.8%(-0.884)#77 | 6.8%(+2.19)#3,757 |
| 78. | Dedham | 8.9% | 9.8%(-0.903)#78 | 6.8%(+2.17)#3,771 |
| 79. | Northampton | 8.9% | 9.8%(-0.943)#79 | 6.8%(+2.13)#3,816 |
| 80. | Lee | 8.8% | 9.8%(-1.01)#80 | 6.8%(+2.06)#3,880 |
| 81. | North Attleborough | 8.8% | 9.8%(-1.06)#81 | 6.8%(+2.01)#3,920 |
| 82. | Weymouth Town | 8.6% | 9.8%(-1.25)#82 | 6.8%(+1.82)#4,089 |
| 83. | Sandwich | 8.5% | 9.8%(-1.33)#83 | 6.8%(+1.74)#4,170 |
| 84. | Baldwinville | 8.5% | 9.8%(-1.35)#84 | 6.8%(+1.72)#4,190 |
| 85. | Marblehead | 8.5% | 9.8%(-1.37)#85 | 6.8%(+1.70)#4,208 |
| 86. | Westborough | 8.5% | 9.8%(-1.38)#86 | 6.8%(+1.69)#4,216 |
| 87. | Ayer | 8.4% | 9.8%(-1.44)#87 | 6.8%(+1.63)#4,271 |
| 88. | West Warren | 8.3% | 9.8%(-1.50)#88 | 6.8%(+1.57)#4,328 |
| 89. | Salisbury | 8.3% | 9.8%(-1.53)#89 | 6.8%(+1.54)#4,367 |
| 90. | Braintree Town | 8.3% | 9.8%(-1.54)#90 | 6.8%(+1.53)#4,380 |
| 91. | West Falmouth | 8.3% | 9.8%(-1.58)#91 | 6.8%(+1.50)#4,401 |
| 92. | Swampscott | 8.1% | 9.8%(-1.74)#92 | 6.8%(+1.33)#4,586 |
| 93. | Randolph Town | 7.8% | 9.8%(-2.02)#93 | 6.8%(+1.05)#4,922 |
| 94. | Worcester | 7.8% | 9.8%(-2.03)#94 | 6.8%(+1.04)#4,933 |
| 95. | South Deerfield | 7.8% | 9.8%(-2.03)#95 | 6.8%(+1.04)#4,935 |
| 96. | Dennis | 7.7% | 9.8%(-2.09)#96 | 6.8%(+0.976)#5,020 |
| 97. | Danvers | 7.7% | 9.8%(-2.10)#97 | 6.8%(+0.967)#5,033 |
| 98. | Hopkinton | 7.7% | 9.8%(-2.14)#98 | 6.8%(+0.928)#5,066 |
| 99. | Leominster | 7.6% | 9.8%(-2.19)#99 | 6.8%(+0.879)#5,139 |
| 100. | North Lakeville | 7.6% | 9.8%(-2.20)#100 | 6.8%(+0.870)#5,155 |
Common Questions
What are the Top 10 Cities with the Highest Percentage of Population Employed in Computer, Engineering & Science in Massachusetts?
Top 10 Cities with the Highest Percentage of Population Employed in Computer, Engineering & Science in Massachusetts are:
#1
25.8%
#2
25.8%
#3
25.5%
#4
23.6%
#5
23.3%
#6
23.3%
#7
22.8%
#8
21.8%
#9
21.6%
#10
21.6%
What city has the Highest Percentage of Population Employed in Computer, Engineering & Science in Massachusetts?
Cambridge has the Highest Percentage of Population Employed in Computer, Engineering & Science in Massachusetts with 25.8%.
What is the Percentage of Population Employed in Computer, Engineering & Science in the State of Massachusetts?
Percentage of Population Employed in Computer, Engineering & Science in Massachusetts is 9.8%.
What is the Percentage of Population Employed in Computer, Engineering & Science in the United States?
Percentage of Population Employed in Computer, Engineering & Science in the United States is 6.8%.