Grangeville, CA Map & Demographics
Grangeville Map
Grangeville Overview
$40,654
PER CAPITA INCOME
$113,375
AVG FAMILY INCOME
$89,044
AVG HOUSEHOLD INCOME
0.19
INEQUALITY / GINI INDEX
244
TOTAL POPULATION
136
MALE POPULATION
108
FEMALE POPULATION
125.93
MALES / 100 FEMALES
79.41
FEMALES / 100 MALES
54.0
MEDIAN AGE
3.1
AVG FAMILY SIZE
2.7
AVG HOUSEHOLD SIZE
85
LABOR FORCE [ PEOPLE ]
47.5%
PERCENT IN LABOR FORCE
Income in Grangeville
Income Overview in Grangeville
Per Capita Income in Grangeville is $40,654, while median incomes of families and households are $113,375 and $89,044 respectively.
| Characteristic | Number | Measure |
| Per Capita Income | 244 | $40,654 |
| Median Family Income | 71 | $113,375 |
| Mean Family Income | 71 | $114,068 |
| Median Household Income | 91 | $89,044 |
| Mean Household Income | 91 | $103,359 |
| Income Deficit | 71 | $0 |
| Wage / Income Gap (%) | 244 | 0.00% |
| Wage / Income Gap ($) | 244 | 100.00¢ per $1 |
| Gini / Inequality Index | 244 | 0.19 |
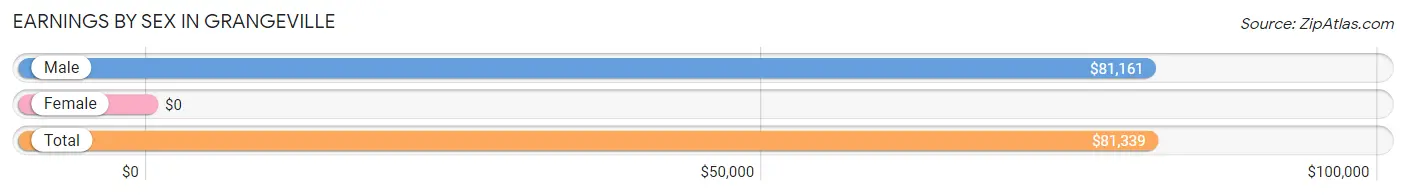
Earnings by Sex in Grangeville
| Sex | Number | Average Earnings |
| Male | 65 (76.5%) | $81,161 |
| Female | 20 (23.5%) | $0 |
| Total | 85 (100.0%) | $81,339 |
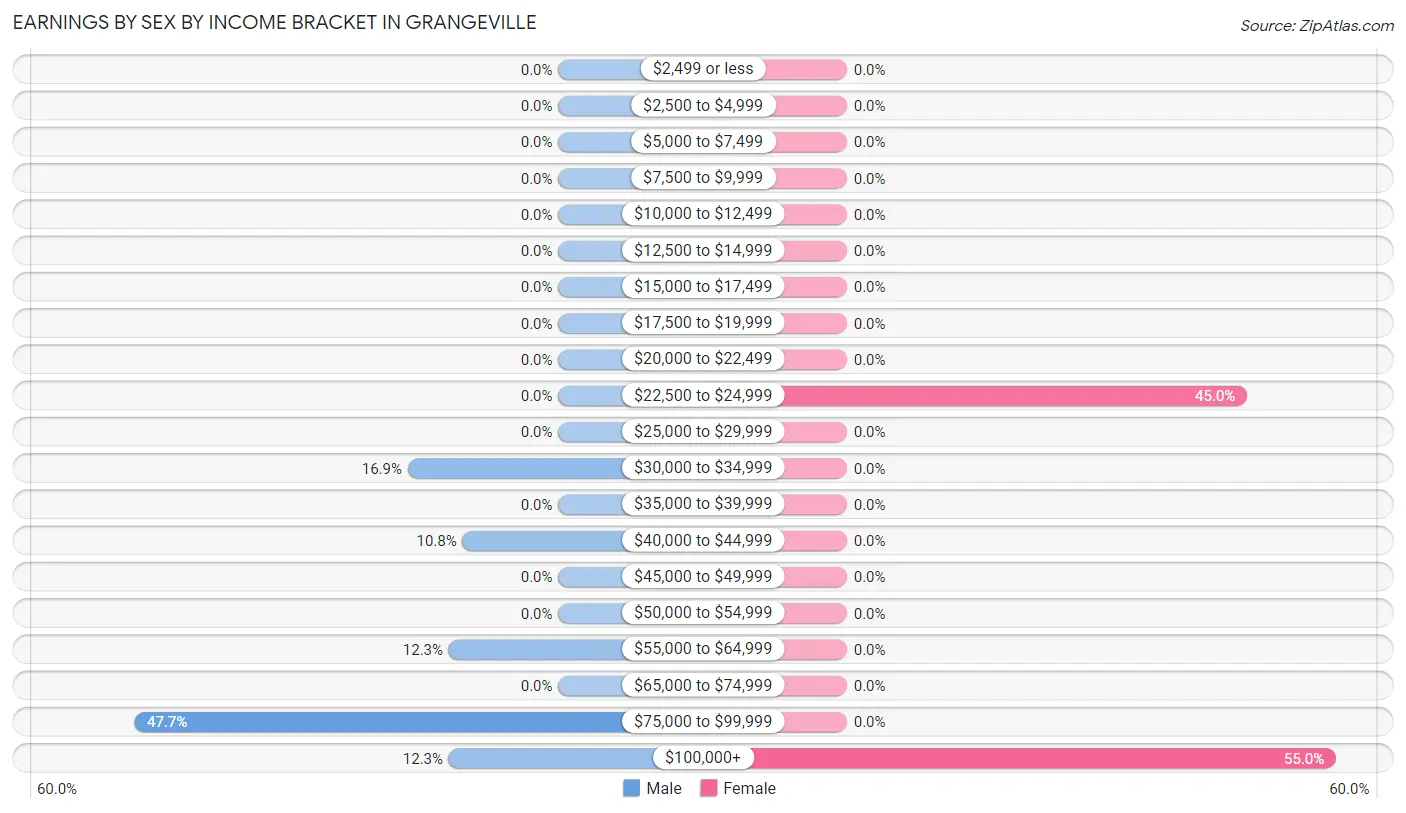
Earnings by Sex by Income Bracket in Grangeville
The most common earnings brackets in Grangeville are $75,000 to $99,999 for men (31 | 47.7%) and $100,000+ for women (11 | 55.0%).
| Income | Male | Female |
| $2,499 or less | 0 (0.0%) | 0 (0.0%) |
| $2,500 to $4,999 | 0 (0.0%) | 0 (0.0%) |
| $5,000 to $7,499 | 0 (0.0%) | 0 (0.0%) |
| $7,500 to $9,999 | 0 (0.0%) | 0 (0.0%) |
| $10,000 to $12,499 | 0 (0.0%) | 0 (0.0%) |
| $12,500 to $14,999 | 0 (0.0%) | 0 (0.0%) |
| $15,000 to $17,499 | 0 (0.0%) | 0 (0.0%) |
| $17,500 to $19,999 | 0 (0.0%) | 0 (0.0%) |
| $20,000 to $22,499 | 0 (0.0%) | 0 (0.0%) |
| $22,500 to $24,999 | 0 (0.0%) | 9 (45.0%) |
| $25,000 to $29,999 | 0 (0.0%) | 0 (0.0%) |
| $30,000 to $34,999 | 11 (16.9%) | 0 (0.0%) |
| $35,000 to $39,999 | 0 (0.0%) | 0 (0.0%) |
| $40,000 to $44,999 | 7 (10.8%) | 0 (0.0%) |
| $45,000 to $49,999 | 0 (0.0%) | 0 (0.0%) |
| $50,000 to $54,999 | 0 (0.0%) | 0 (0.0%) |
| $55,000 to $64,999 | 8 (12.3%) | 0 (0.0%) |
| $65,000 to $74,999 | 0 (0.0%) | 0 (0.0%) |
| $75,000 to $99,999 | 31 (47.7%) | 0 (0.0%) |
| $100,000+ | 8 (12.3%) | 11 (55.0%) |
| Total | 65 (100.0%) | 20 (100.0%) |
Earnings by Sex by Educational Attainment in Grangeville
| Educational Attainment | Male Income | Female Income |
| Less than High School | - | - |
| High School Diploma | - | - |
| College or Associate's Degree | - | - |
| Bachelor's Degree | - | - |
| Graduate Degree | - | - |
| Total | $81,161 | $0 |
Family Income in Grangeville
Family Income Brackets in Grangeville
According to the Grangeville family income data, there are 24 families falling into the $75,000 to $99,999 income range, which is the most common income bracket and makes up 33.8% of all families.
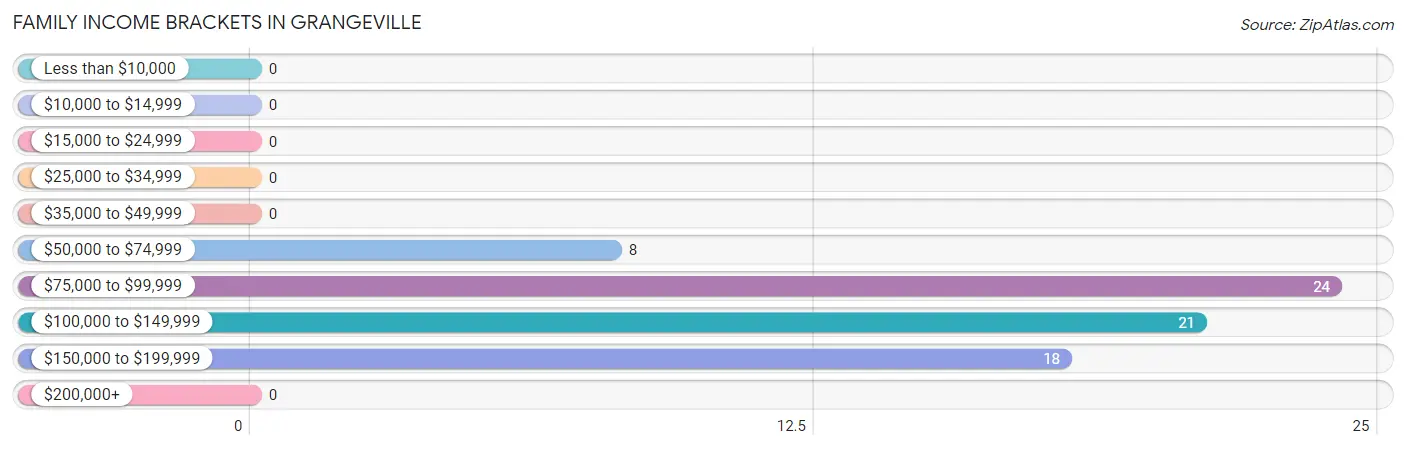
| Income Bracket | # Families | % Families |
| Less than $10,000 | 0 | 0.0% |
| $10,000 to $14,999 | 0 | 0.0% |
| $15,000 to $24,999 | 0 | 0.0% |
| $25,000 to $34,999 | 0 | 0.0% |
| $35,000 to $49,999 | 0 | 0.0% |
| $50,000 to $74,999 | 8 | 11.3% |
| $75,000 to $99,999 | 24 | 33.8% |
| $100,000 to $149,999 | 21 | 29.6% |
| $150,000 to $199,999 | 18 | 25.4% |
| $200,000+ | 0 | 0.0% |
Family Income by Famaliy Size in Grangeville
2-person families (53 | 74.7%) account for the highest median family income in Grangeville with $112,875 per family, while 2-person families (53 | 74.7%) have the highest median income of $56,438 per family member.
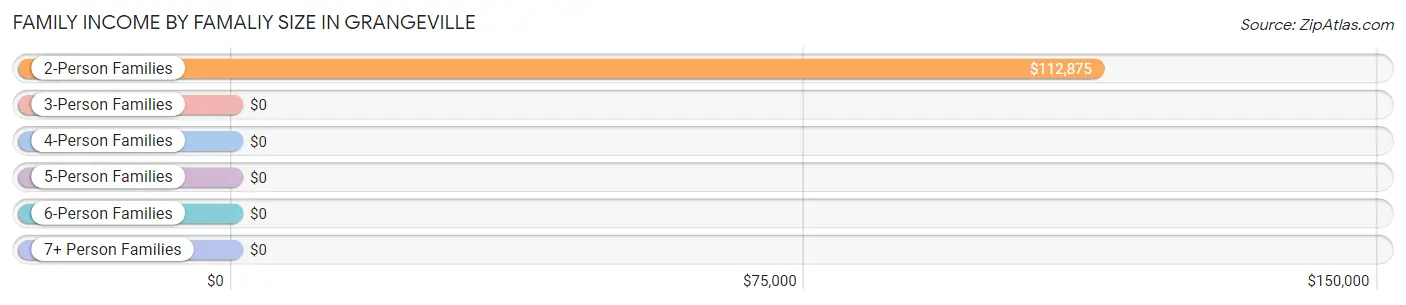
| Income Bracket | # Families | Median Income |
| 2-Person Families | 53 (74.7%) | $112,875 |
| 3-Person Families | 7 (9.9%) | $0 |
| 4-Person Families | 0 (0.0%) | $0 |
| 5-Person Families | 0 (0.0%) | $0 |
| 6-Person Families | 0 (0.0%) | $0 |
| 7+ Person Families | 11 (15.5%) | $0 |
| Total | 71 (100.0%) | $113,375 |
Family Income by Number of Earners in Grangeville
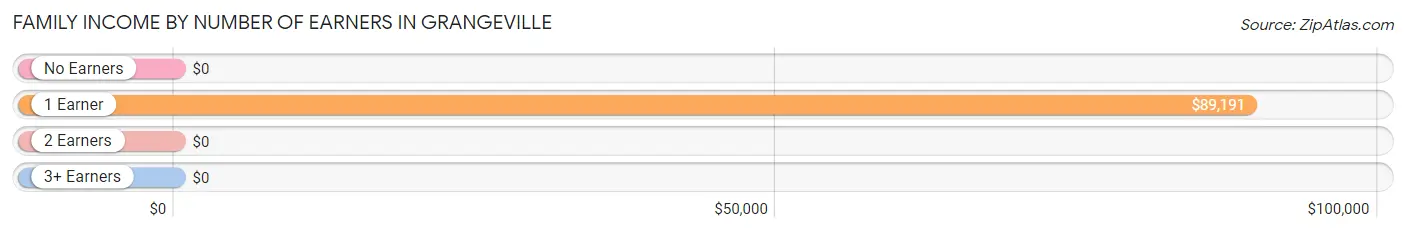
| Number of Earners | # Families | Median Income |
| No Earners | 10 (14.1%) | $0 |
| 1 Earner | 53 (74.7%) | $89,191 |
| 2 Earners | 8 (11.3%) | $0 |
| 3+ Earners | 0 (0.0%) | $0 |
| Total | 71 (100.0%) | $113,375 |
Household Income in Grangeville
Household Income Brackets in Grangeville
With 37 households falling in the category, the $75,000 to $99,999 income range is the most frequent in Grangeville, accounting for 40.7% of all households.
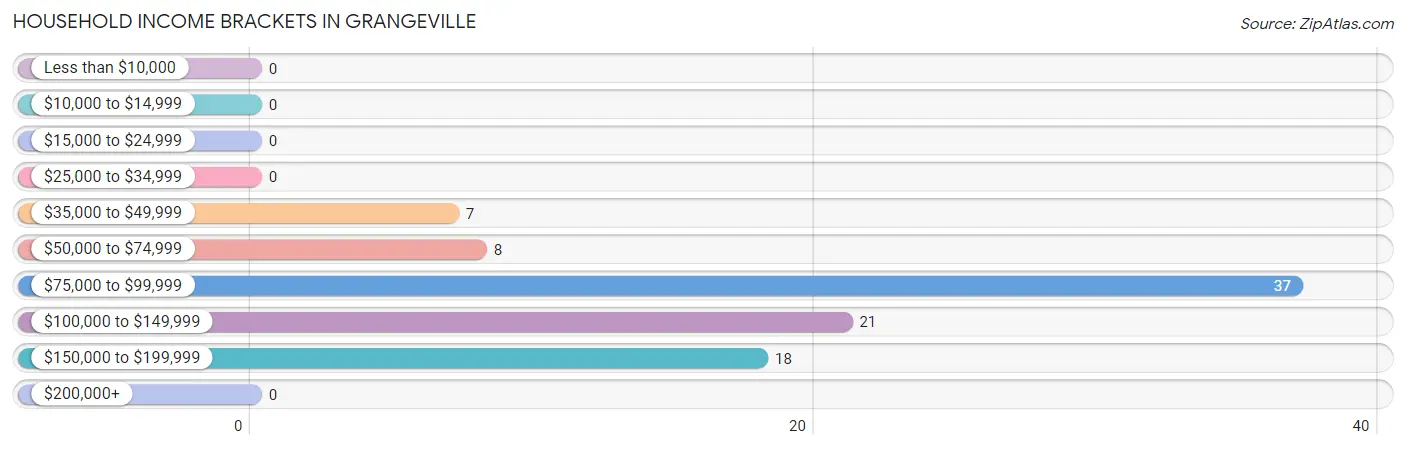
| Income Bracket | # Households | % Households |
| Less than $10,000 | 0 | 0.0% |
| $10,000 to $14,999 | 0 | 0.0% |
| $15,000 to $24,999 | 0 | 0.0% |
| $25,000 to $34,999 | 0 | 0.0% |
| $35,000 to $49,999 | 7 | 7.7% |
| $50,000 to $74,999 | 8 | 8.8% |
| $75,000 to $99,999 | 37 | 40.7% |
| $100,000 to $149,999 | 21 | 23.1% |
| $150,000 to $199,999 | 18 | 19.8% |
| $200,000+ | 0 | 0.0% |
Household Income by Householder Age in Grangeville
The median household income in Grangeville is $89,044, with the highest median household income of $88,162 found in the 65+ years age bracket for the primary householder. A total of 65 households (71.4%) fall into this category.
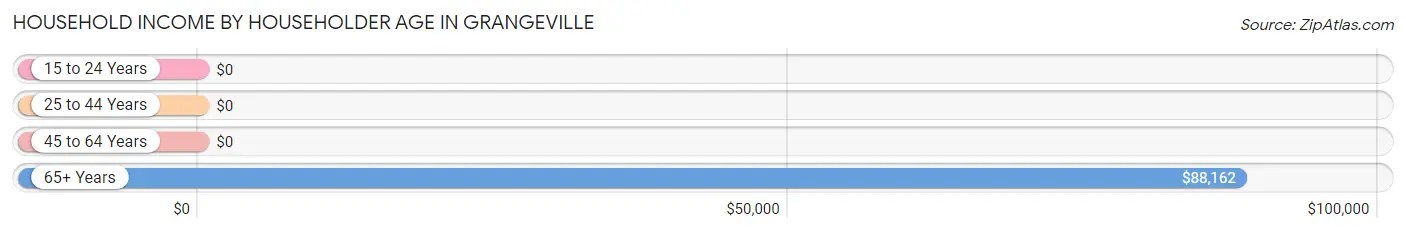
| Income Bracket | # Households | Median Income |
| 15 to 24 Years | 0 (0.0%) | $0 |
| 25 to 44 Years | 11 (12.1%) | $0 |
| 45 to 64 Years | 15 (16.5%) | $0 |
| 65+ Years | 65 (71.4%) | $88,162 |
| Total | 91 (100.0%) | $89,044 |
Poverty in Grangeville
Income Below Poverty by Sex and Age in Grangeville
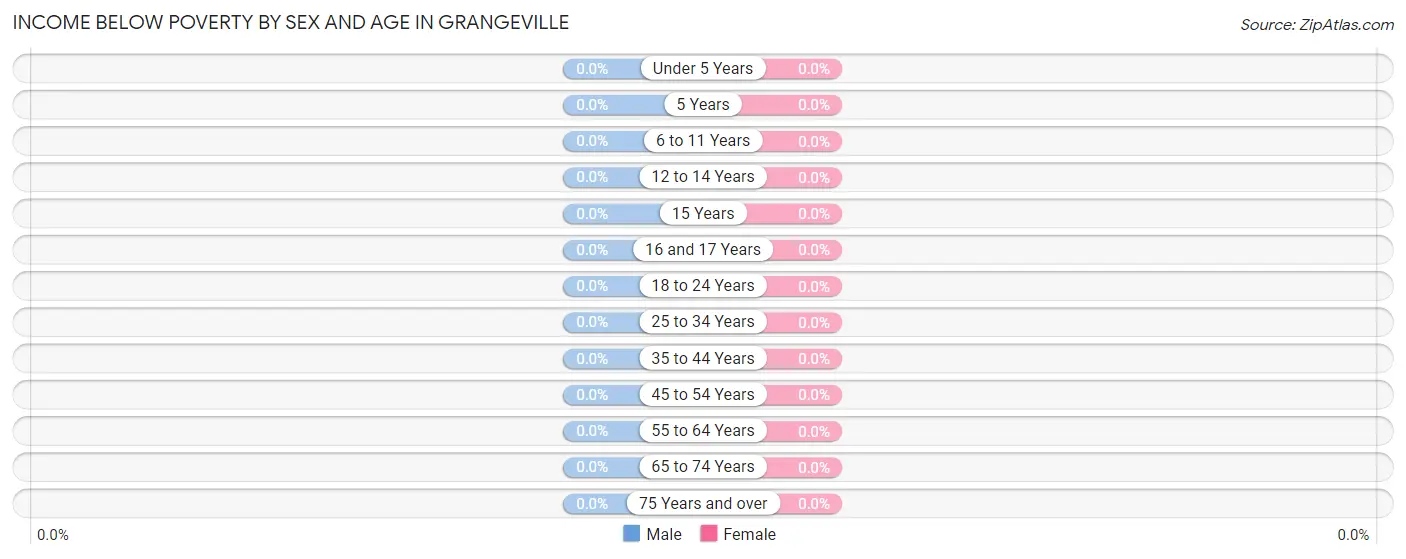
| Age Bracket | Male | Female |
| Under 5 Years | 0 (0.0%) | 0 (0.0%) |
| 5 Years | 0 (0.0%) | 0 (0.0%) |
| 6 to 11 Years | 0 (0.0%) | 0 (0.0%) |
| 12 to 14 Years | 0 (0.0%) | 0 (0.0%) |
| 15 Years | 0 (0.0%) | 0 (0.0%) |
| 16 and 17 Years | 0 (0.0%) | 0 (0.0%) |
| 18 to 24 Years | 0 (0.0%) | 0 (0.0%) |
| 25 to 34 Years | 0 (0.0%) | 0 (0.0%) |
| 35 to 44 Years | 0 (0.0%) | 0 (0.0%) |
| 45 to 54 Years | 0 (0.0%) | 0 (0.0%) |
| 55 to 64 Years | 0 (0.0%) | 0 (0.0%) |
| 65 to 74 Years | 0 (0.0%) | 0 (0.0%) |
| 75 Years and over | 0 (0.0%) | 0 (0.0%) |
| Total | 0 (0.0%) | 0 (0.0%) |
Income Above Poverty by Sex and Age in Grangeville
According to the poverty statistics in Grangeville, males aged 6 to 11 years and females aged under 5 years are the age groups that are most secure financially, with 100.0% of males and 100.0% of females in these age groups living above the poverty line.
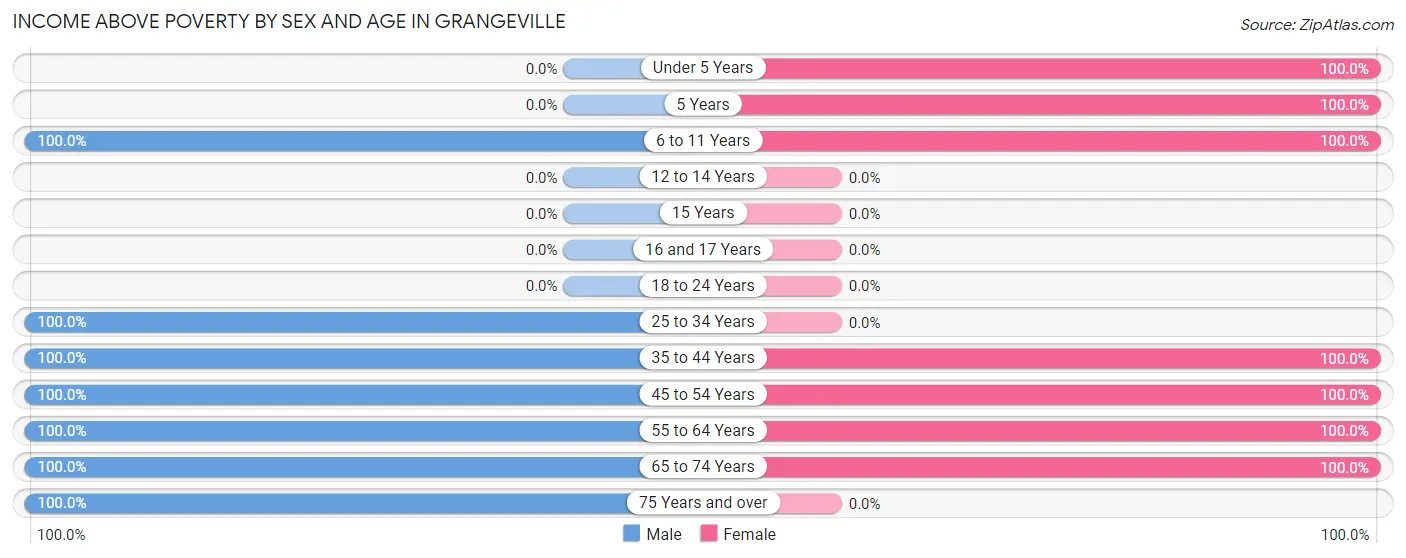
| Age Bracket | Male | Female |
| Under 5 Years | 0 (0.0%) | 16 (100.0%) |
| 5 Years | 0 (0.0%) | 14 (100.0%) |
| 6 to 11 Years | 15 (100.0%) | 20 (100.0%) |
| 12 to 14 Years | 0 (0.0%) | 0 (0.0%) |
| 15 Years | 0 (0.0%) | 0 (0.0%) |
| 16 and 17 Years | 0 (0.0%) | 0 (0.0%) |
| 18 to 24 Years | 0 (0.0%) | 0 (0.0%) |
| 25 to 34 Years | 11 (100.0%) | 0 (0.0%) |
| 35 to 44 Years | 15 (100.0%) | 11 (100.0%) |
| 45 to 54 Years | 19 (100.0%) | 9 (100.0%) |
| 55 to 64 Years | 15 (100.0%) | 15 (100.0%) |
| 65 to 74 Years | 38 (100.0%) | 23 (100.0%) |
| 75 Years and over | 23 (100.0%) | 0 (0.0%) |
| Total | 136 (100.0%) | 108 (100.0%) |
Income Below Poverty Among Married-Couple Families in Grangeville
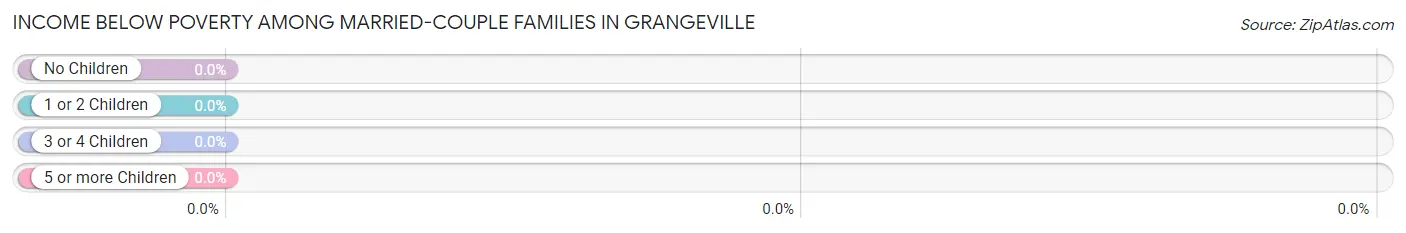
| Children | Above Poverty | Below Poverty |
| No Children | 50 (100.0%) | 0 (0.0%) |
| 1 or 2 Children | 0 (0.0%) | 0 (0.0%) |
| 3 or 4 Children | 0 (0.0%) | 0 (0.0%) |
| 5 or more Children | 11 (100.0%) | 0 (0.0%) |
| Total | 61 (100.0%) | 0 (0.0%) |
Income Below Poverty Among Single-Parent Households in Grangeville
| Children | Single Father | Single Mother |
| No Children | 0 (0.0%) | 0 (0.0%) |
| 1 or 2 Children | 0 (0.0%) | 0 (0.0%) |
| 3 or 4 Children | 0 (0.0%) | 0 (0.0%) |
| 5 or more Children | 0 (0.0%) | 0 (0.0%) |
| Total | 0 (0.0%) | 0 (0.0%) |
Income Below Poverty Among Married-Couple vs Single-Parent Households in Grangeville
| Children | Married-Couple Families | Single-Parent Households |
| No Children | 0 (0.0%) | 0 (0.0%) |
| 1 or 2 Children | 0 (0.0%) | 0 (0.0%) |
| 3 or 4 Children | 0 (0.0%) | 0 (0.0%) |
| 5 or more Children | 0 (0.0%) | 0 (0.0%) |
| Total | 0 (0.0%) | 0 (0.0%) |
Race in Grangeville
The most populous races in Grangeville are White / Caucasian (212 | 86.9%), Hispanic or Latino (44 | 18.0%), and Black / African American (16 | 6.6%).
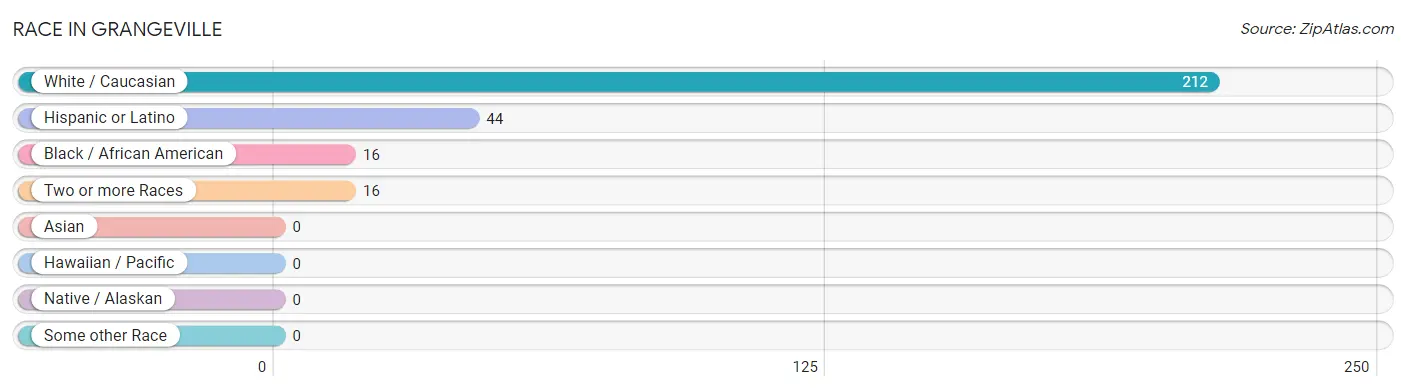
| Race | # Population | % Population |
| Asian | 0 | 0.0% |
| Black / African American | 16 | 6.6% |
| Hawaiian / Pacific | 0 | 0.0% |
| Hispanic or Latino | 44 | 18.0% |
| Native / Alaskan | 0 | 0.0% |
| White / Caucasian | 212 | 86.9% |
| Two or more Races | 16 | 6.6% |
| Some other Race | 0 | 0.0% |
| Total | 244 | 100.0% |
Ancestry in Grangeville
The most populous ancestries reported in Grangeville are Portuguese (63 | 25.8%), Mexican (44 | 18.0%), Danish (35 | 14.3%), German (27 | 11.1%), and Swedish (26 | 10.7%), together accounting for 79.9% of all Grangeville residents.
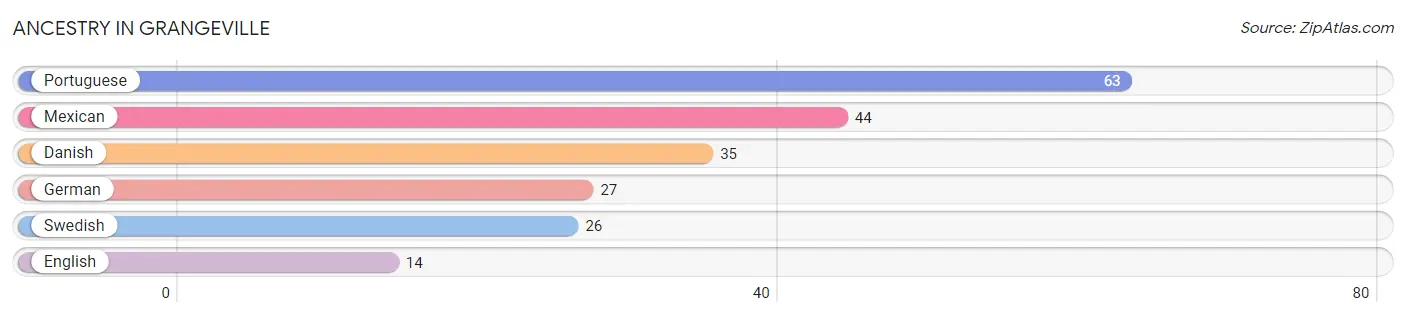
| Ancestry | # Population | % Population |
| Danish | 35 | 14.3% |
| English | 14 | 5.7% |
| German | 27 | 11.1% |
| Mexican | 44 | 18.0% |
| Portuguese | 63 | 25.8% |
| Swedish | 26 | 10.7% | View All 6 Rows |
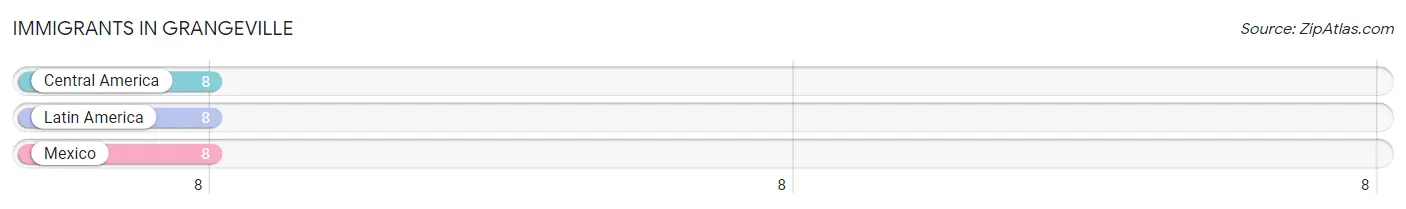
Immigrants in Grangeville
The most numerous immigrant groups reported in Grangeville came from Central America (8 | 3.3%), Latin America (8 | 3.3%), and Mexico (8 | 3.3%), together accounting for 9.8% of all Grangeville residents.
| Immigration Origin | # Population | % Population |
| Central America | 8 | 3.3% |
| Latin America | 8 | 3.3% |
| Mexico | 8 | 3.3% | View All 3 Rows |
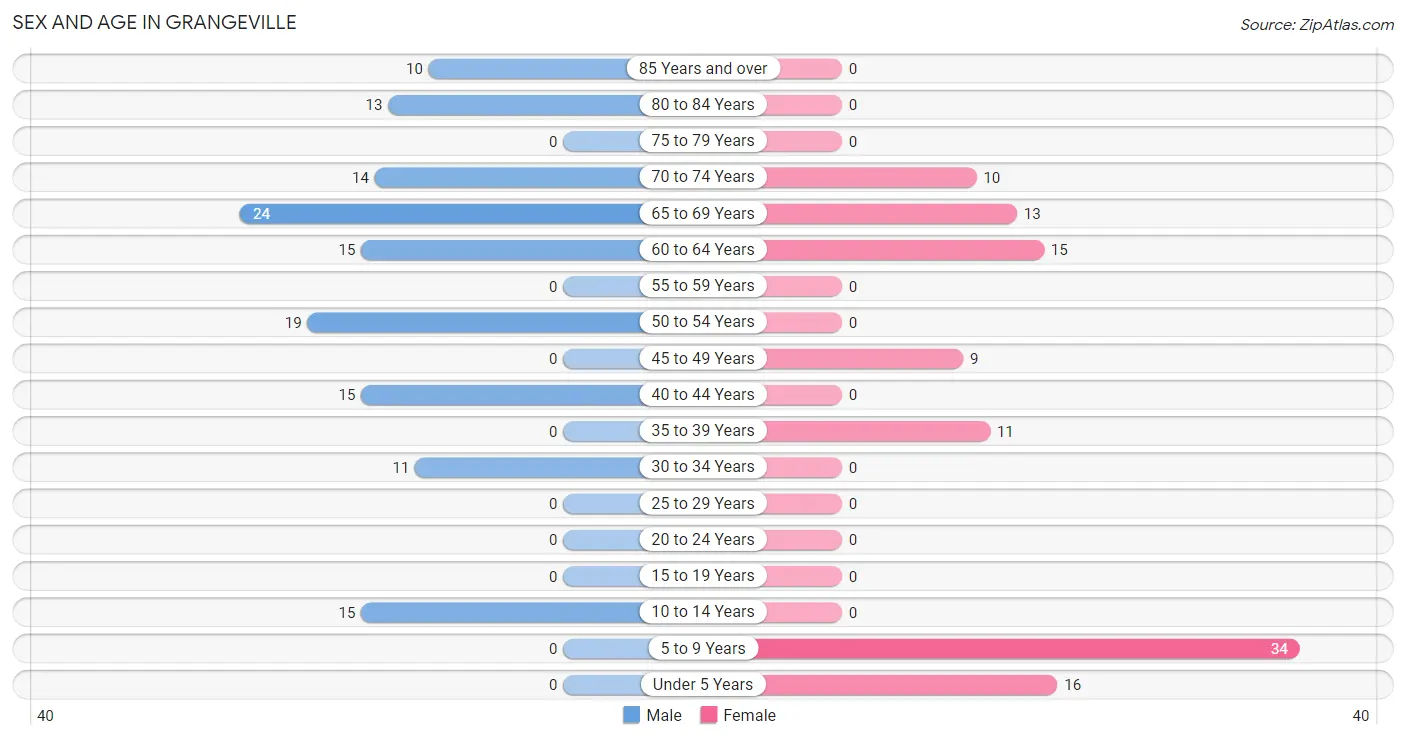
Sex and Age in Grangeville
Sex and Age in Grangeville
The most populous age groups in Grangeville are 65 to 69 Years (24 | 17.6%) for men and 5 to 9 Years (34 | 31.5%) for women.
| Age Bracket | Male | Female |
| Under 5 Years | 0 (0.0%) | 16 (14.8%) |
| 5 to 9 Years | 0 (0.0%) | 34 (31.5%) |
| 10 to 14 Years | 15 (11.0%) | 0 (0.0%) |
| 15 to 19 Years | 0 (0.0%) | 0 (0.0%) |
| 20 to 24 Years | 0 (0.0%) | 0 (0.0%) |
| 25 to 29 Years | 0 (0.0%) | 0 (0.0%) |
| 30 to 34 Years | 11 (8.1%) | 0 (0.0%) |
| 35 to 39 Years | 0 (0.0%) | 11 (10.2%) |
| 40 to 44 Years | 15 (11.0%) | 0 (0.0%) |
| 45 to 49 Years | 0 (0.0%) | 9 (8.3%) |
| 50 to 54 Years | 19 (14.0%) | 0 (0.0%) |
| 55 to 59 Years | 0 (0.0%) | 0 (0.0%) |
| 60 to 64 Years | 15 (11.0%) | 15 (13.9%) |
| 65 to 69 Years | 24 (17.6%) | 13 (12.0%) |
| 70 to 74 Years | 14 (10.3%) | 10 (9.3%) |
| 75 to 79 Years | 0 (0.0%) | 0 (0.0%) |
| 80 to 84 Years | 13 (9.6%) | 0 (0.0%) |
| 85 Years and over | 10 (7.3%) | 0 (0.0%) |
| Total | 136 (100.0%) | 108 (100.0%) |
Families and Households in Grangeville
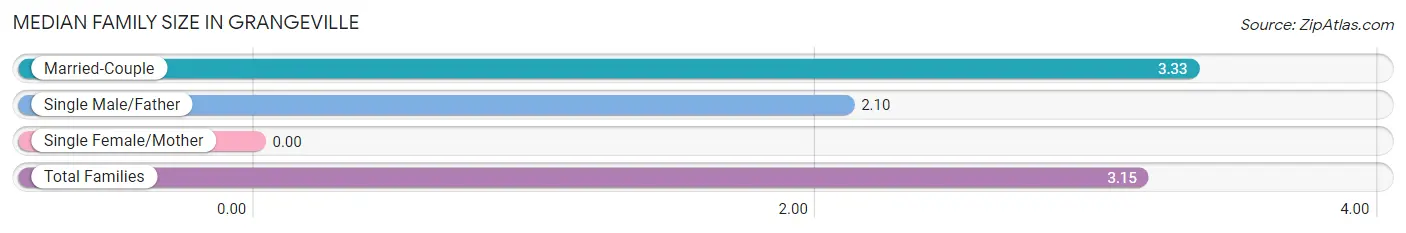
Median Family Size in Grangeville
| Family Type | # Families | Family Size |
| Married-Couple | 61 (85.9%) | 3.33 |
| Single Male/Father | 10 (14.1%) | 2.10 |
| Single Female/Mother | 0 (0.0%) | - |
| Total Families | 71 (100.0%) | 3.15 |
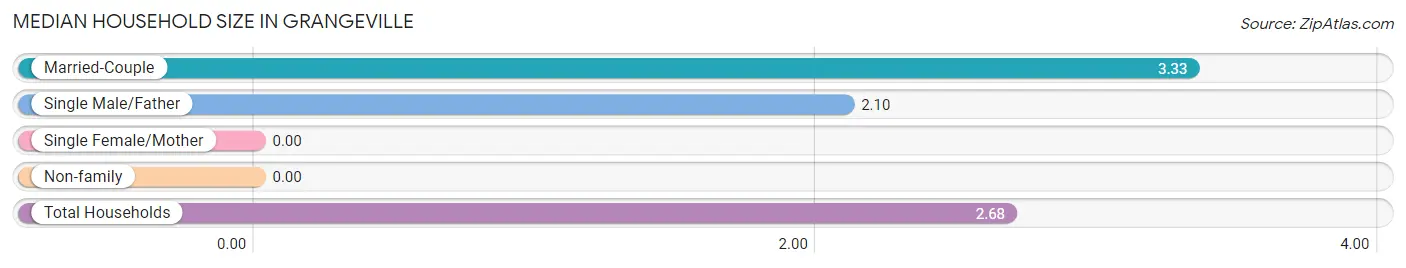
Median Household Size in Grangeville
| Household Type | # Households | Household Size |
| Married-Couple | 61 (67.0%) | 3.33 |
| Single Male/Father | 10 (11.0%) | 2.10 |
| Single Female/Mother | 0 (0.0%) | - |
| Non-family | 20 (22.0%) | - |
| Total Households | 91 (100.0%) | 2.68 |
Household Size by Marriage Status in Grangeville
Out of a total of 91 households in Grangeville, 71 (78.0%) are family households, while 20 (22.0%) are nonfamily households. The most numerous type of family households are 2-person households, comprising 53, and the most common type of nonfamily households are 1-person households, comprising 20.
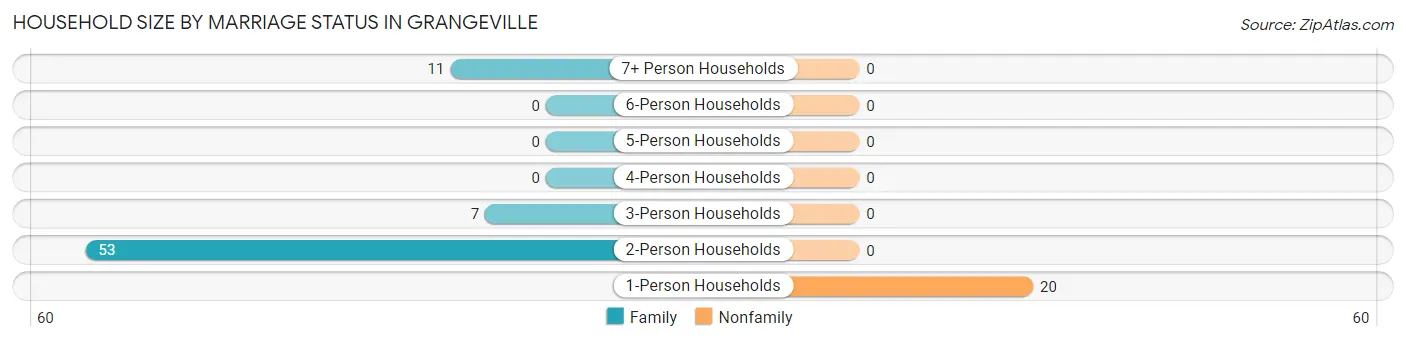
| Household Size | Family Households | Nonfamily Households |
| 1-Person Households | - | 20 (22.0%) |
| 2-Person Households | 53 (58.2%) | 0 (0.0%) |
| 3-Person Households | 7 (7.7%) | 0 (0.0%) |
| 4-Person Households | 0 (0.0%) | 0 (0.0%) |
| 5-Person Households | 0 (0.0%) | 0 (0.0%) |
| 6-Person Households | 0 (0.0%) | 0 (0.0%) |
| 7+ Person Households | 11 (12.1%) | 0 (0.0%) |
| Total | 71 (78.0%) | 20 (22.0%) |
Female Fertility in Grangeville
Fertility by Age in Grangeville
| Age Bracket | Women with Births | Births / 1,000 Women |
| 15 to 19 years | 0 (0.0%) | 0.0 |
| 20 to 34 years | 0 (0.0%) | 0.0 |
| 35 to 50 years | 0 (0.0%) | 0.0 |
| Total | 0 (0.0%) | 0.0 |
Fertility by Age by Marriage Status in Grangeville
| Age Bracket | Married | Unmarried |
| 15 to 19 years | 0 (0.0%) | 0 (0.0%) |
| 20 to 34 years | 0 (0.0%) | 0 (0.0%) |
| 35 to 50 years | 0 (0.0%) | 0 (0.0%) |
| Total | 0 (0.0%) | 0 (0.0%) |
Fertility by Education in Grangeville
| Educational Attainment | Women with Births | Births / 1,000 Women |
| Less than High School | 0 (0.0%) | 0.0 |
| High School Diploma | 0 (0.0%) | 0.0 |
| College or Associate's Degree | 0 (0.0%) | 0.0 |
| Bachelor's Degree | 0 (0.0%) | 0.0 |
| Graduate Degree | 0 (0.0%) | 0.0 |
| Total | 0 (0.0%) | 0.0 |
Fertility by Education by Marriage Status in Grangeville
| Educational Attainment | Married | Unmarried |
| Less than High School | 0 (0.0%) | 0 (0.0%) |
| High School Diploma | 0 (0.0%) | 0 (0.0%) |
| College or Associate's Degree | 0 (0.0%) | 0 (0.0%) |
| Bachelor's Degree | 0 (0.0%) | 0 (0.0%) |
| Graduate Degree | 0 (0.0%) | 0 (0.0%) |
| Total | 0 (0.0%) | 0 (0.0%) |
Employment Characteristics in Grangeville
Employment by Class of Employer in Grangeville
Among the 74 employed individuals in Grangeville, private company employees (32 | 43.2%), self-employed (not incorporated) (31 | 41.9%), and not-for-profit organizations (11 | 14.9%) make up the most common classes of employment.
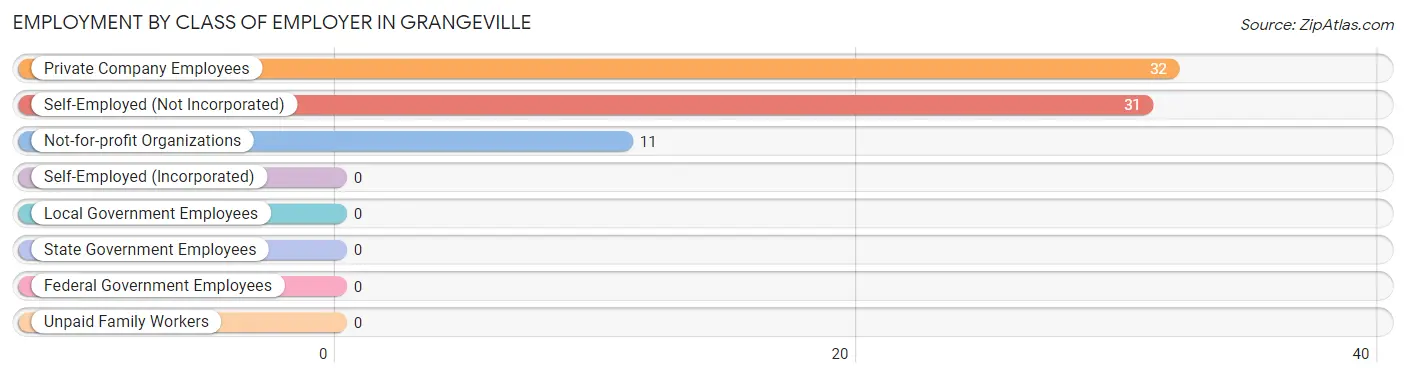
| Employer Class | # Employees | % Employees |
| Private Company Employees | 32 | 43.2% |
| Self-Employed (Incorporated) | 0 | 0.0% |
| Self-Employed (Not Incorporated) | 31 | 41.9% |
| Not-for-profit Organizations | 11 | 14.9% |
| Local Government Employees | 0 | 0.0% |
| State Government Employees | 0 | 0.0% |
| Federal Government Employees | 0 | 0.0% |
| Unpaid Family Workers | 0 | 0.0% |
| Total | 74 | 100.0% |
Employment Status by Age in Grangeville
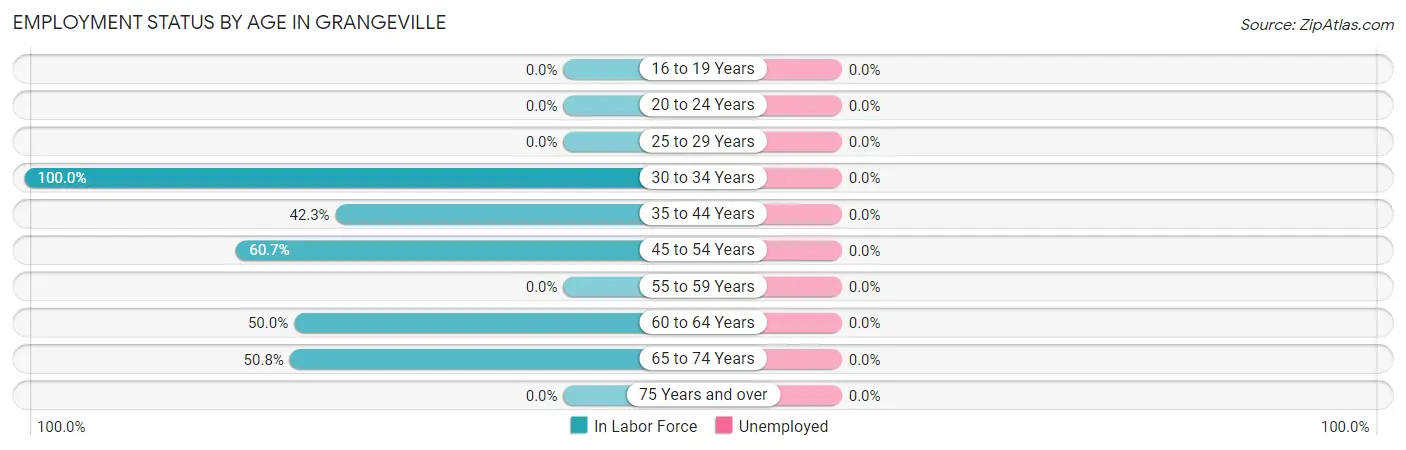
| Age Bracket | In Labor Force | Unemployed |
| 16 to 19 Years | 0 (0.0%) | 0 (0.0%) |
| 20 to 24 Years | 0 (0.0%) | 0 (0.0%) |
| 25 to 29 Years | 0 (0.0%) | 0 (0.0%) |
| 30 to 34 Years | 11 (100.0%) | 0 (0.0%) |
| 35 to 44 Years | 11 (42.3%) | 0 (0.0%) |
| 45 to 54 Years | 17 (60.7%) | 0 (0.0%) |
| 55 to 59 Years | 0 (0.0%) | 0 (0.0%) |
| 60 to 64 Years | 15 (50.0%) | 0 (0.0%) |
| 65 to 74 Years | 31 (50.8%) | 0 (0.0%) |
| 75 Years and over | 0 (0.0%) | 0 (0.0%) |
| Total | 85 (47.5%) | 0 (0.0%) |
Employment Status by Educational Attainment in Grangeville
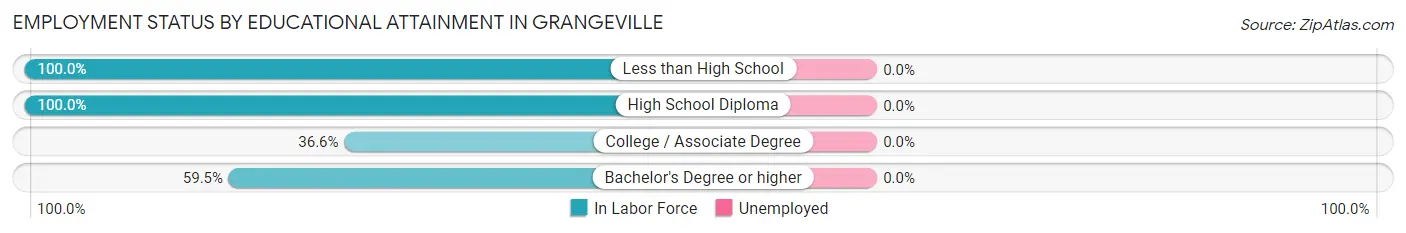
| Educational Attainment | In Labor Force | Unemployed |
| Less than High School | 8 (100.0%) | 0 (0.0%) |
| High School Diploma | 9 (100.0%) | 0 (0.0%) |
| College / Associate Degree | 15 (36.6%) | 0 (0.0%) |
| Bachelor's Degree or higher | 22 (59.5%) | 0 (0.0%) |
| Total | 54 (56.8%) | 0 (0.0%) |
Employment Occupations by Sex in Grangeville
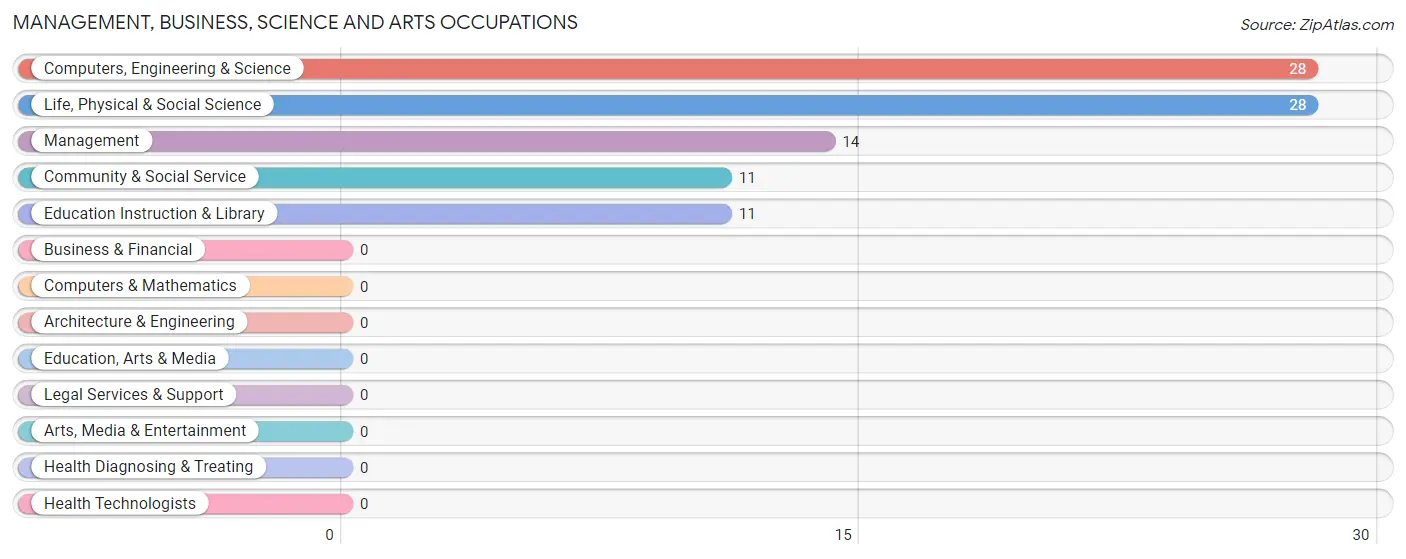
Management, Business, Science and Arts Occupations
The most common Management, Business, Science and Arts occupations in Grangeville are Computers, Engineering & Science (28 | 32.9%), Life, Physical & Social Science (28 | 32.9%), Management (14 | 16.5%), Community & Social Service (11 | 12.9%), and Education Instruction & Library (11 | 12.9%).
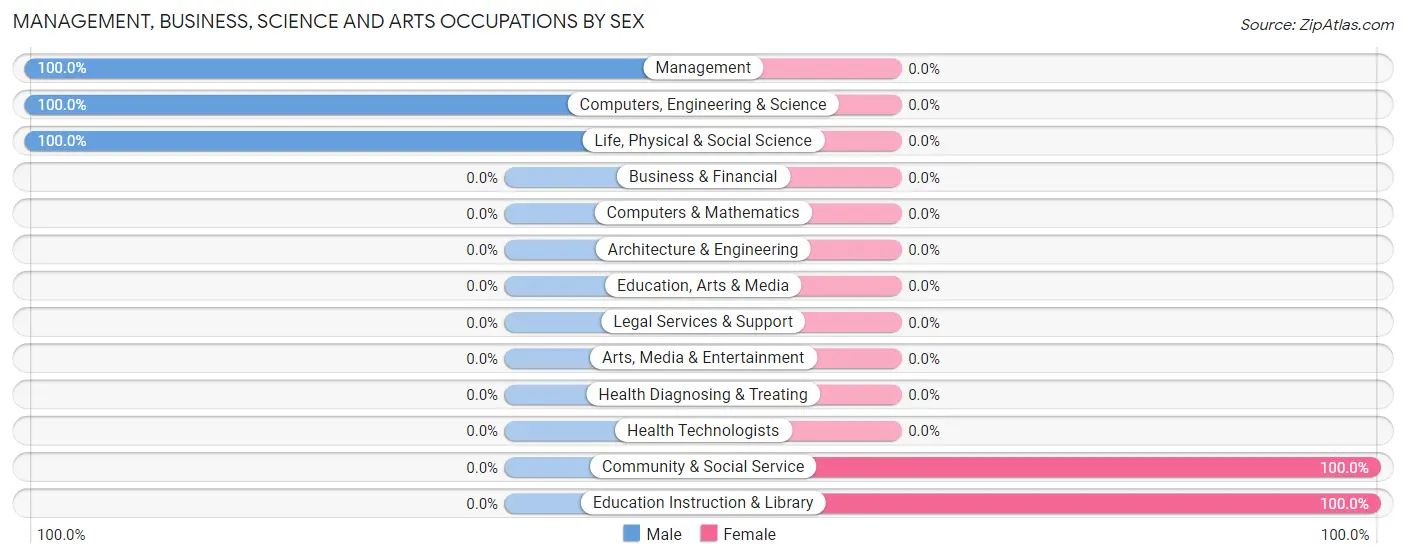
Management, Business, Science and Arts Occupations by Sex
Within the Management, Business, Science and Arts occupations in Grangeville, the most male-oriented occupations are Management (100.0%), Computers, Engineering & Science (100.0%), and Life, Physical & Social Science (100.0%), while the most female-oriented occupations are Community & Social Service (100.0%), and Education Instruction & Library (100.0%).
| Occupation | Male | Female |
| Management | 14 (100.0%) | 0 (0.0%) |
| Business & Financial | 0 (0.0%) | 0 (0.0%) |
| Computers, Engineering & Science | 28 (100.0%) | 0 (0.0%) |
| Computers & Mathematics | 0 (0.0%) | 0 (0.0%) |
| Architecture & Engineering | 0 (0.0%) | 0 (0.0%) |
| Life, Physical & Social Science | 28 (100.0%) | 0 (0.0%) |
| Community & Social Service | 0 (0.0%) | 11 (100.0%) |
| Education, Arts & Media | 0 (0.0%) | 0 (0.0%) |
| Legal Services & Support | 0 (0.0%) | 0 (0.0%) |
| Education Instruction & Library | 0 (0.0%) | 11 (100.0%) |
| Arts, Media & Entertainment | 0 (0.0%) | 0 (0.0%) |
| Health Diagnosing & Treating | 0 (0.0%) | 0 (0.0%) |
| Health Technologists | 0 (0.0%) | 0 (0.0%) |
| Total (Category) | 42 (79.2%) | 11 (20.7%) |
| Total (Overall) | 65 (76.5%) | 20 (23.5%) |
Services Occupations
Services Occupations by Sex
| Occupation | Male | Female |
| Healthcare Support | 0 (0.0%) | 0 (0.0%) |
| Security & Protection | 0 (0.0%) | 0 (0.0%) |
| Firefighting & Prevention | 0 (0.0%) | 0 (0.0%) |
| Law Enforcement | 0 (0.0%) | 0 (0.0%) |
| Food Preparation & Serving | 0 (0.0%) | 0 (0.0%) |
| Cleaning & Maintenance | 0 (0.0%) | 0 (0.0%) |
| Personal Care & Service | 0 (0.0%) | 0 (0.0%) |
| Total (Category) | 0 (0.0%) | 0 (0.0%) |
| Total (Overall) | 65 (76.5%) | 20 (23.5%) |
Sales and Office Occupations
The most common Sales and Office occupations in Grangeville are , and Office & Administration (16 | 18.8%).
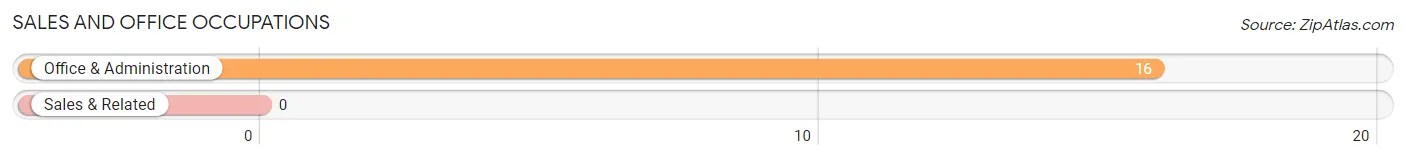
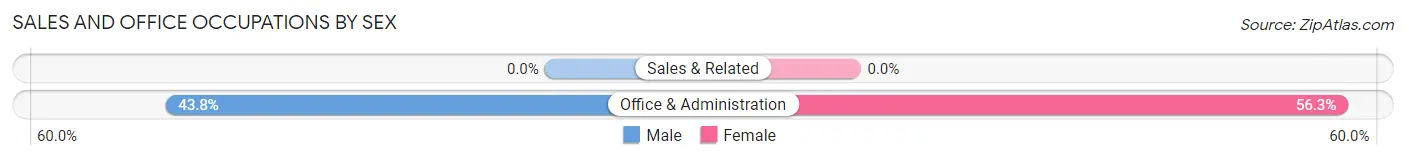
Sales and Office Occupations by Sex
| Occupation | Male | Female |
| Sales & Related | 0 (0.0%) | 0 (0.0%) |
| Office & Administration | 7 (43.8%) | 9 (56.2%) |
| Total (Category) | 7 (43.8%) | 9 (56.2%) |
| Total (Overall) | 65 (76.5%) | 20 (23.5%) |
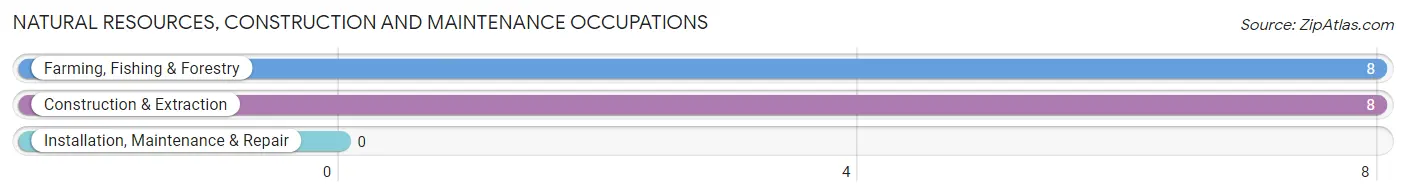
Natural Resources, Construction and Maintenance Occupations
The most common Natural Resources, Construction and Maintenance occupations in Grangeville are Farming, Fishing & Forestry (8 | 9.4%), and Construction & Extraction (8 | 9.4%).
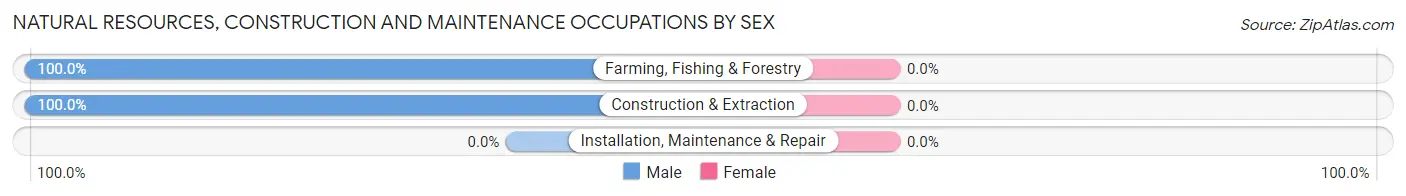
Natural Resources, Construction and Maintenance Occupations by Sex
| Occupation | Male | Female |
| Farming, Fishing & Forestry | 8 (100.0%) | 0 (0.0%) |
| Construction & Extraction | 8 (100.0%) | 0 (0.0%) |
| Installation, Maintenance & Repair | 0 (0.0%) | 0 (0.0%) |
| Total (Category) | 16 (100.0%) | 0 (0.0%) |
| Total (Overall) | 65 (76.5%) | 20 (23.5%) |
Production, Transportation and Moving Occupations
Production, Transportation and Moving Occupations by Sex
| Occupation | Male | Female |
| Production | 0 (0.0%) | 0 (0.0%) |
| Transportation | 0 (0.0%) | 0 (0.0%) |
| Material Moving | 0 (0.0%) | 0 (0.0%) |
| Total (Category) | 0 (0.0%) | 0 (0.0%) |
| Total (Overall) | 65 (76.5%) | 20 (23.5%) |
Employment Industries by Sex in Grangeville
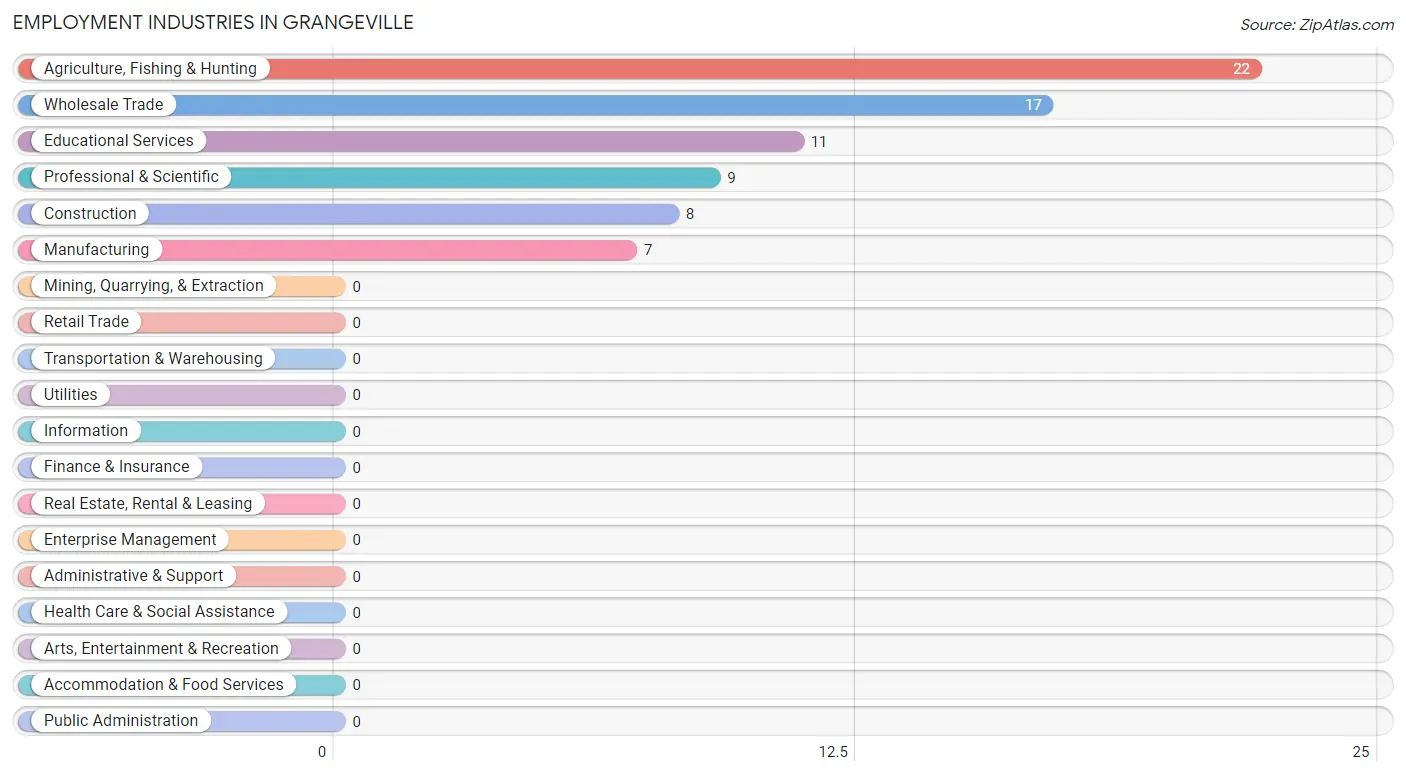
Employment Industries in Grangeville
The major employment industries in Grangeville include Agriculture, Fishing & Hunting (22 | 25.9%), Wholesale Trade (17 | 20.0%), Educational Services (11 | 12.9%), Professional & Scientific (9 | 10.6%), and Construction (8 | 9.4%).
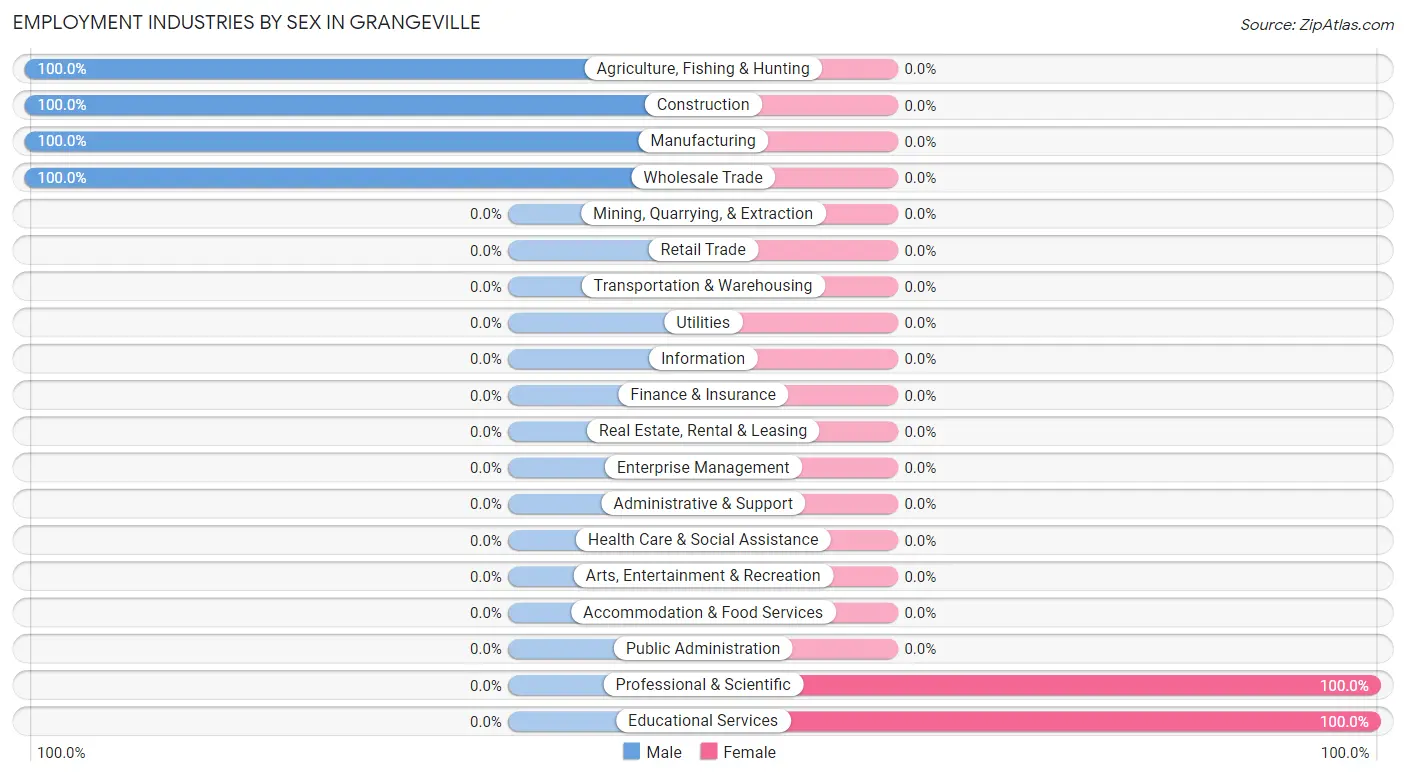
Employment Industries by Sex in Grangeville
The Grangeville industries that see more men than women are Agriculture, Fishing & Hunting (100.0%), Construction (100.0%), and Manufacturing (100.0%), whereas the industries that tend to have a higher number of women are Professional & Scientific (100.0%), and Educational Services (100.0%).
| Industry | Male | Female |
| Agriculture, Fishing & Hunting | 22 (100.0%) | 0 (0.0%) |
| Mining, Quarrying, & Extraction | 0 (0.0%) | 0 (0.0%) |
| Construction | 8 (100.0%) | 0 (0.0%) |
| Manufacturing | 7 (100.0%) | 0 (0.0%) |
| Wholesale Trade | 17 (100.0%) | 0 (0.0%) |
| Retail Trade | 0 (0.0%) | 0 (0.0%) |
| Transportation & Warehousing | 0 (0.0%) | 0 (0.0%) |
| Utilities | 0 (0.0%) | 0 (0.0%) |
| Information | 0 (0.0%) | 0 (0.0%) |
| Finance & Insurance | 0 (0.0%) | 0 (0.0%) |
| Real Estate, Rental & Leasing | 0 (0.0%) | 0 (0.0%) |
| Professional & Scientific | 0 (0.0%) | 9 (100.0%) |
| Enterprise Management | 0 (0.0%) | 0 (0.0%) |
| Administrative & Support | 0 (0.0%) | 0 (0.0%) |
| Educational Services | 0 (0.0%) | 11 (100.0%) |
| Health Care & Social Assistance | 0 (0.0%) | 0 (0.0%) |
| Arts, Entertainment & Recreation | 0 (0.0%) | 0 (0.0%) |
| Accommodation & Food Services | 0 (0.0%) | 0 (0.0%) |
| Public Administration | 0 (0.0%) | 0 (0.0%) |
| Total | 65 (76.5%) | 20 (23.5%) |
Education in Grangeville
School Enrollment in Grangeville
The most common levels of schooling among the 49 students in Grangeville are kindergarten (24 | 49.0%), middle school (15 | 30.6%), and elementary school (10 | 20.4%).
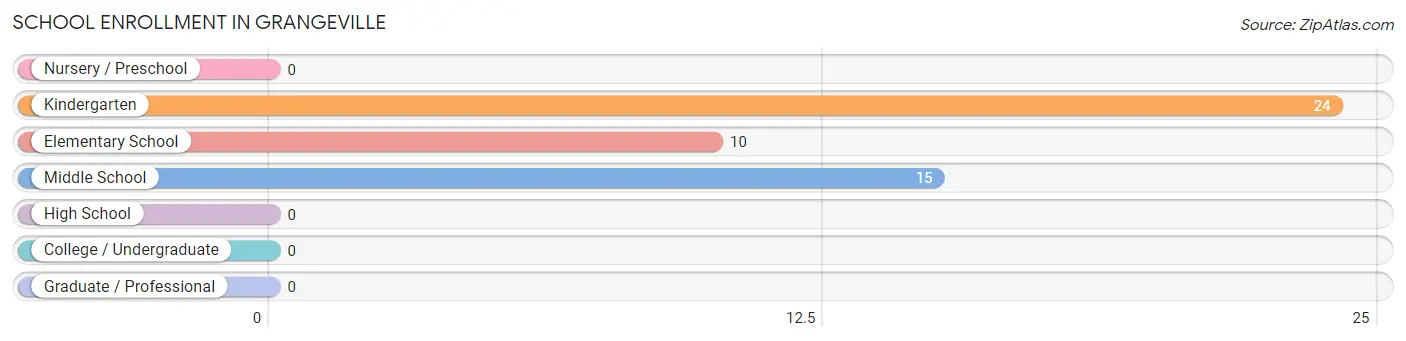
| School Level | # Students | % Students |
| Nursery / Preschool | 0 | 0.0% |
| Kindergarten | 24 | 49.0% |
| Elementary School | 10 | 20.4% |
| Middle School | 15 | 30.6% |
| High School | 0 | 0.0% |
| College / Undergraduate | 0 | 0.0% |
| Graduate / Professional | 0 | 0.0% |
| Total | 49 | 100.0% |
School Enrollment by Age by Funding Source in Grangeville
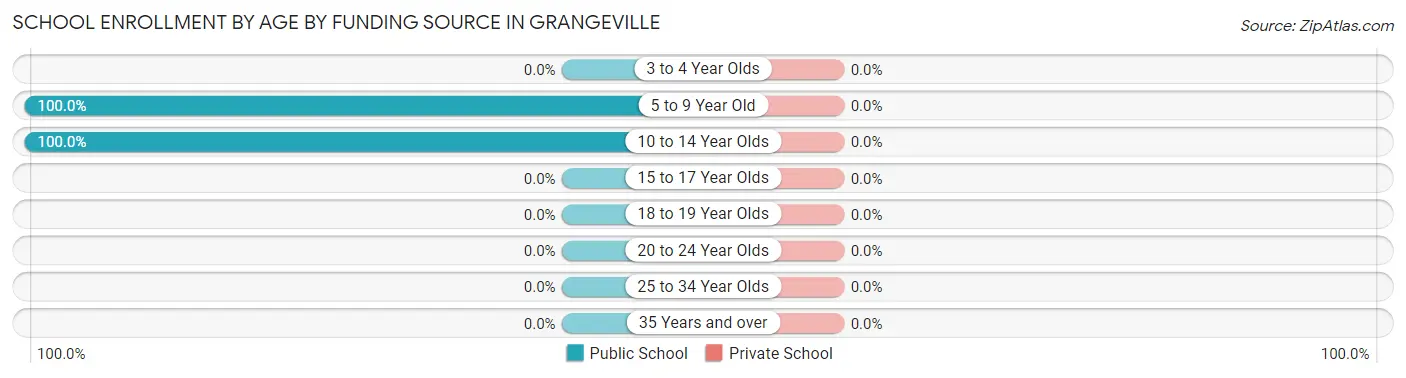
| Age Bracket | Public School | Private School |
| 3 to 4 Year Olds | 0 (0.0%) | 0 (0.0%) |
| 5 to 9 Year Old | 34 (100.0%) | 0 (0.0%) |
| 10 to 14 Year Olds | 15 (100.0%) | 0 (0.0%) |
| 15 to 17 Year Olds | 0 (0.0%) | 0 (0.0%) |
| 18 to 19 Year Olds | 0 (0.0%) | 0 (0.0%) |
| 20 to 24 Year Olds | 0 (0.0%) | 0 (0.0%) |
| 25 to 34 Year Olds | 0 (0.0%) | 0 (0.0%) |
| 35 Years and over | 0 (0.0%) | 0 (0.0%) |
| Total | 49 (100.0%) | 0 (0.0%) |
Educational Attainment by Field of Study in Grangeville
Education (25 | 28.4%), business (17 | 19.3%), bio, nature & agricultural (14 | 15.9%), physical & health sciences (11 | 12.5%), and liberal arts & history (11 | 12.5%) are the most common fields of study among 88 individuals in Grangeville who have obtained a bachelor's degree or higher.
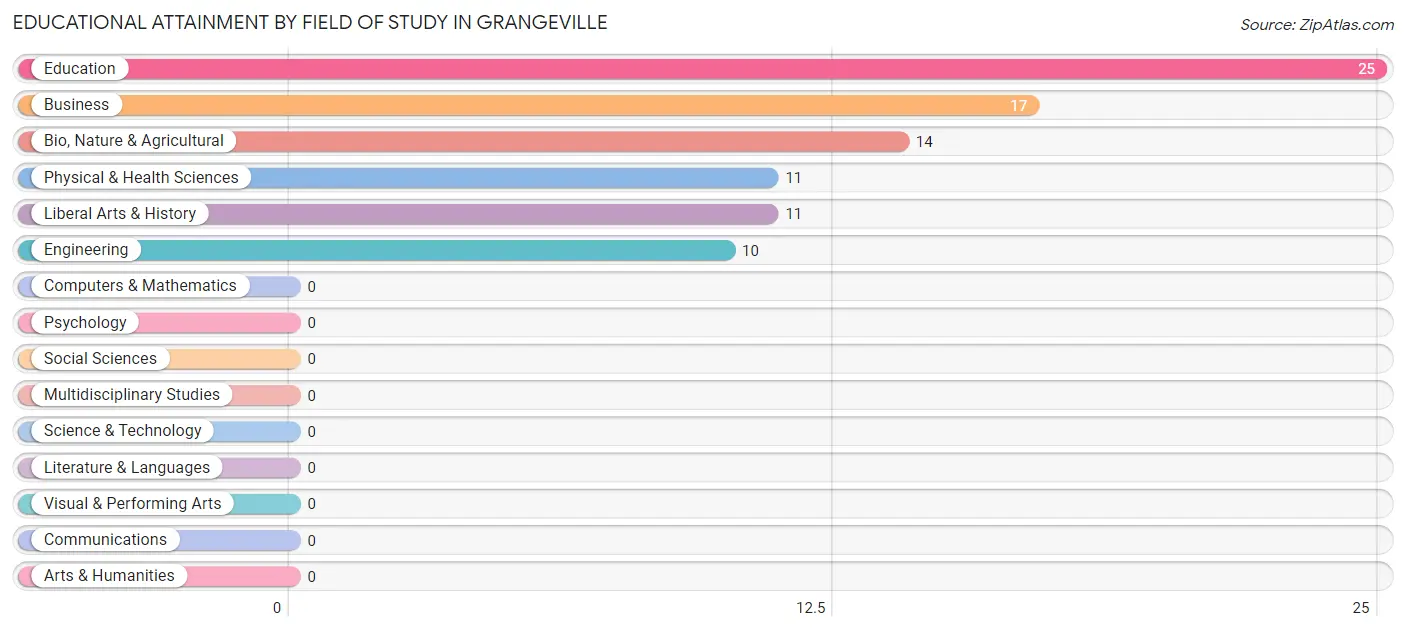
| Field of Study | # Graduates | % Graduates |
| Computers & Mathematics | 0 | 0.0% |
| Bio, Nature & Agricultural | 14 | 15.9% |
| Physical & Health Sciences | 11 | 12.5% |
| Psychology | 0 | 0.0% |
| Social Sciences | 0 | 0.0% |
| Engineering | 10 | 11.4% |
| Multidisciplinary Studies | 0 | 0.0% |
| Science & Technology | 0 | 0.0% |
| Business | 17 | 19.3% |
| Education | 25 | 28.4% |
| Literature & Languages | 0 | 0.0% |
| Liberal Arts & History | 11 | 12.5% |
| Visual & Performing Arts | 0 | 0.0% |
| Communications | 0 | 0.0% |
| Arts & Humanities | 0 | 0.0% |
| Total | 88 | 100.0% |
Transportation & Commute in Grangeville
Vehicle Availability by Sex in Grangeville
The most prevalent vehicle ownership categories in Grangeville are males with 3 vehicles (17, accounting for 26.2%) and females with 3 vehicles (0, making up 188.9%).
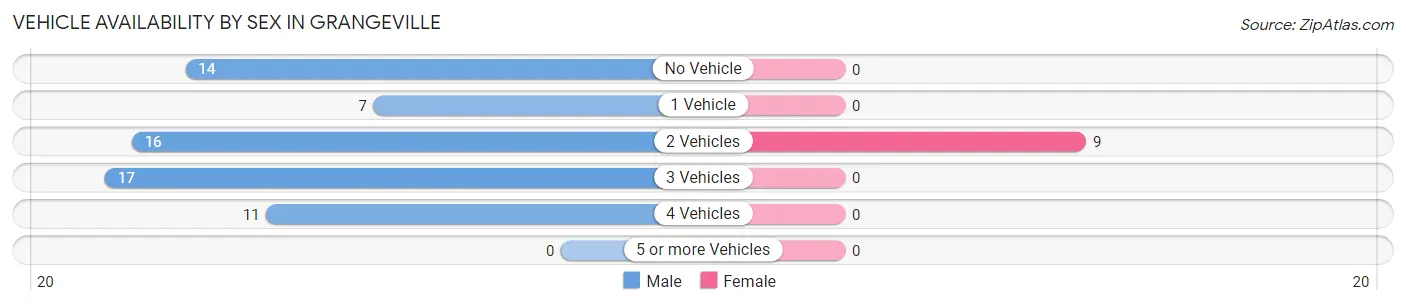
| Vehicles Available | Male | Female |
| No Vehicle | 14 (21.5%) | 0 (0.0%) |
| 1 Vehicle | 7 (10.8%) | 0 (0.0%) |
| 2 Vehicles | 16 (24.6%) | 9 (100.0%) |
| 3 Vehicles | 17 (26.2%) | 0 (0.0%) |
| 4 Vehicles | 11 (16.9%) | 0 (0.0%) |
| 5 or more Vehicles | 0 (0.0%) | 0 (0.0%) |
| Total | 65 (100.0%) | 9 (100.0%) |
Commute Time in Grangeville
The most frequently occuring commute durations in Grangeville are 20 to 24 minutes (22 commuters, 40.0%), 45 to 59 minutes (17 commuters, 30.9%), and 15 to 19 minutes (16 commuters, 29.1%).
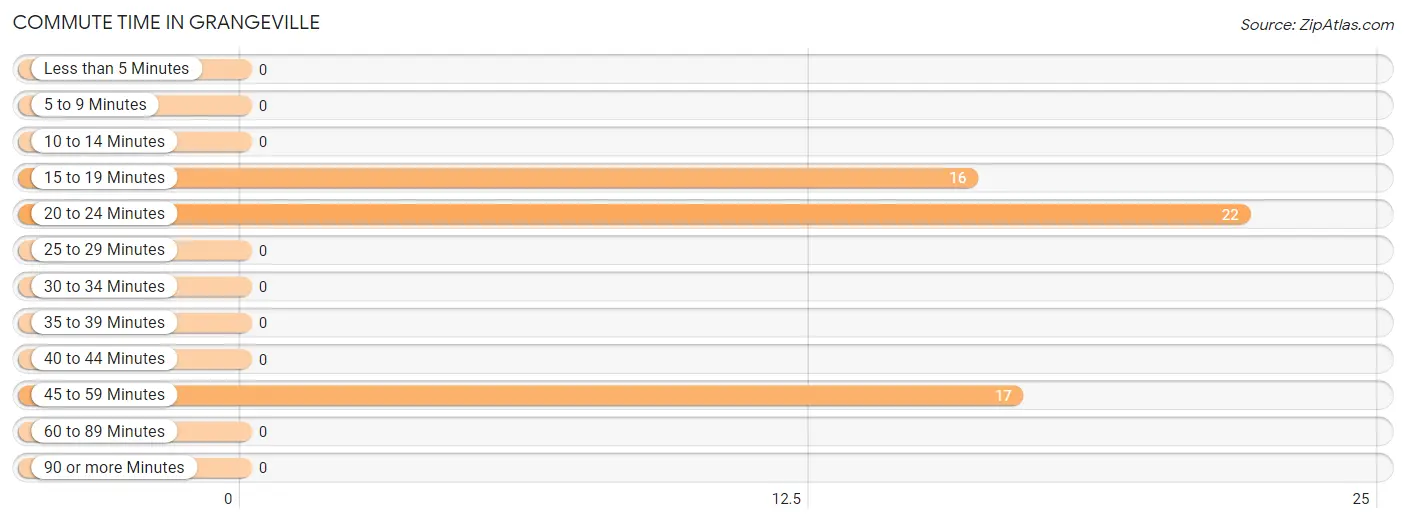
| Commute Time | # Commuters | % Commuters |
| Less than 5 Minutes | 0 | 0.0% |
| 5 to 9 Minutes | 0 | 0.0% |
| 10 to 14 Minutes | 0 | 0.0% |
| 15 to 19 Minutes | 16 | 29.1% |
| 20 to 24 Minutes | 22 | 40.0% |
| 25 to 29 Minutes | 0 | 0.0% |
| 30 to 34 Minutes | 0 | 0.0% |
| 35 to 39 Minutes | 0 | 0.0% |
| 40 to 44 Minutes | 0 | 0.0% |
| 45 to 59 Minutes | 17 | 30.9% |
| 60 to 89 Minutes | 0 | 0.0% |
| 90 or more Minutes | 0 | 0.0% |
Commute Time by Sex in Grangeville
The most common commute times in Grangeville are 20 to 24 minutes (22 commuters, 47.8%) for males and 15 to 19 minutes (9 commuters, 100.0%) for females.
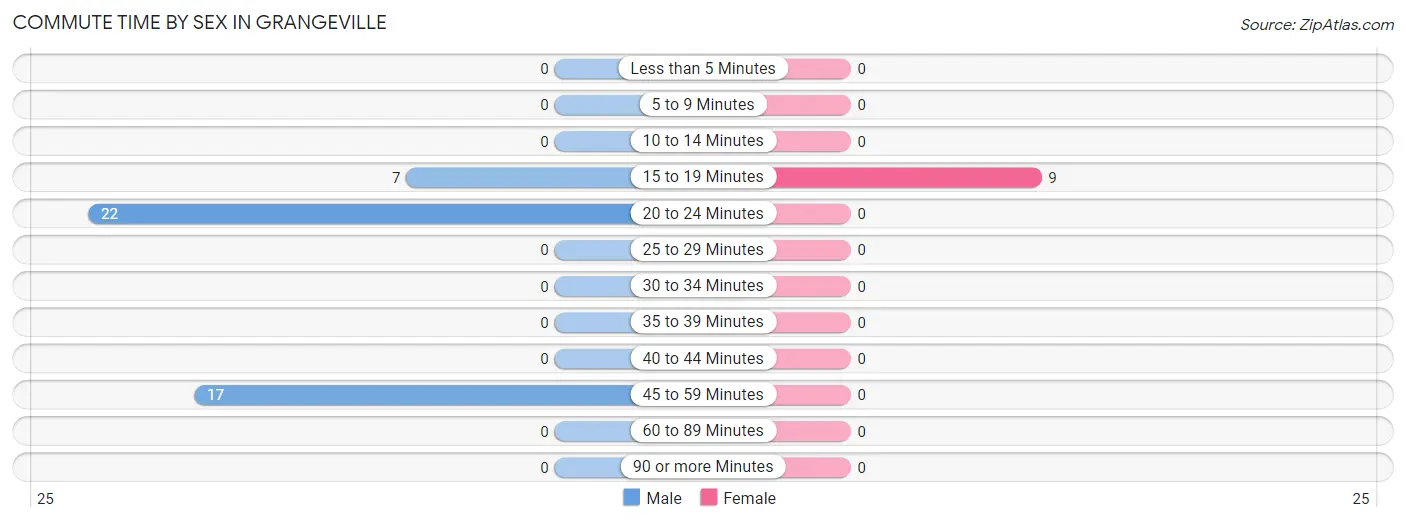
| Commute Time | Male | Female |
| Less than 5 Minutes | 0 (0.0%) | 0 (0.0%) |
| 5 to 9 Minutes | 0 (0.0%) | 0 (0.0%) |
| 10 to 14 Minutes | 0 (0.0%) | 0 (0.0%) |
| 15 to 19 Minutes | 7 (15.2%) | 9 (100.0%) |
| 20 to 24 Minutes | 22 (47.8%) | 0 (0.0%) |
| 25 to 29 Minutes | 0 (0.0%) | 0 (0.0%) |
| 30 to 34 Minutes | 0 (0.0%) | 0 (0.0%) |
| 35 to 39 Minutes | 0 (0.0%) | 0 (0.0%) |
| 40 to 44 Minutes | 0 (0.0%) | 0 (0.0%) |
| 45 to 59 Minutes | 17 (37.0%) | 0 (0.0%) |
| 60 to 89 Minutes | 0 (0.0%) | 0 (0.0%) |
| 90 or more Minutes | 0 (0.0%) | 0 (0.0%) |
Time of Departure to Work by Sex in Grangeville
The most frequent times of departure to work in Grangeville are 6:00 AM to 6:29 AM (17, 37.0%) for males and 7:30 AM to 7:59 AM (9, 100.0%) for females.
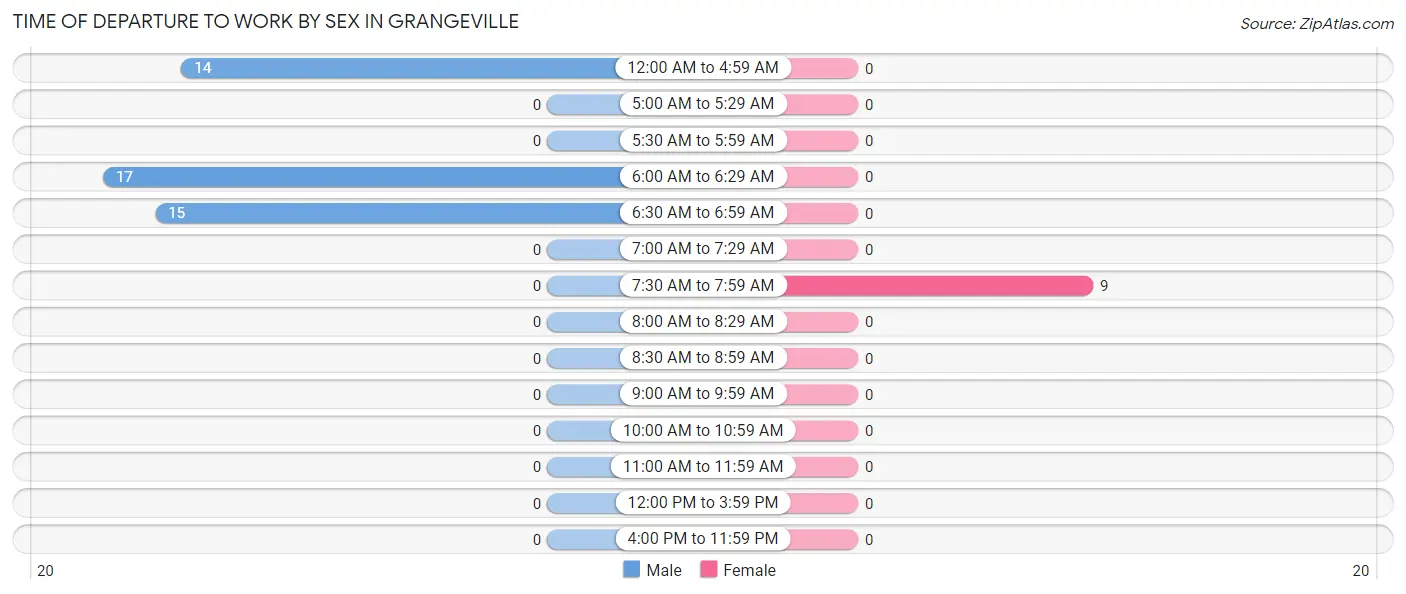
| Time of Departure | Male | Female |
| 12:00 AM to 4:59 AM | 14 (30.4%) | 0 (0.0%) |
| 5:00 AM to 5:29 AM | 0 (0.0%) | 0 (0.0%) |
| 5:30 AM to 5:59 AM | 0 (0.0%) | 0 (0.0%) |
| 6:00 AM to 6:29 AM | 17 (37.0%) | 0 (0.0%) |
| 6:30 AM to 6:59 AM | 15 (32.6%) | 0 (0.0%) |
| 7:00 AM to 7:29 AM | 0 (0.0%) | 0 (0.0%) |
| 7:30 AM to 7:59 AM | 0 (0.0%) | 9 (100.0%) |
| 8:00 AM to 8:29 AM | 0 (0.0%) | 0 (0.0%) |
| 8:30 AM to 8:59 AM | 0 (0.0%) | 0 (0.0%) |
| 9:00 AM to 9:59 AM | 0 (0.0%) | 0 (0.0%) |
| 10:00 AM to 10:59 AM | 0 (0.0%) | 0 (0.0%) |
| 11:00 AM to 11:59 AM | 0 (0.0%) | 0 (0.0%) |
| 12:00 PM to 3:59 PM | 0 (0.0%) | 0 (0.0%) |
| 4:00 PM to 11:59 PM | 0 (0.0%) | 0 (0.0%) |
| Total | 46 (100.0%) | 9 (100.0%) |
Housing Occupancy in Grangeville
Occupancy by Ownership in Grangeville
Of the total 91 dwellings in Grangeville, owner-occupied units account for 84 (92.3%), while renter-occupied units make up 7 (7.7%).
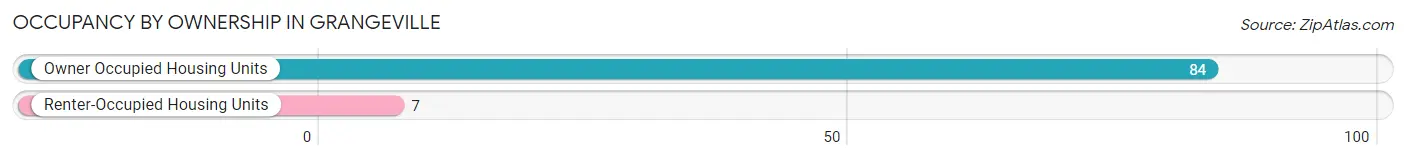
| Occupancy | # Housing Units | % Housing Units |
| Owner Occupied Housing Units | 84 | 92.3% |
| Renter-Occupied Housing Units | 7 | 7.7% |
| Total Occupied Housing Units | 91 | 100.0% |
Occupancy by Household Size in Grangeville
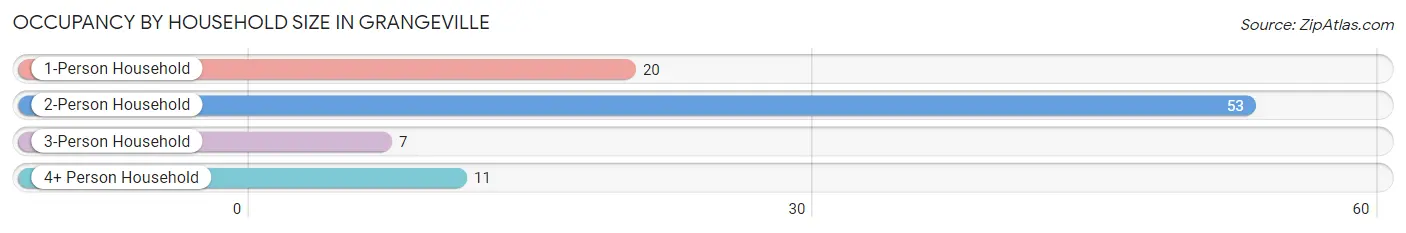
| Household Size | # Housing Units | % Housing Units |
| 1-Person Household | 20 | 22.0% |
| 2-Person Household | 53 | 58.2% |
| 3-Person Household | 7 | 7.7% |
| 4+ Person Household | 11 | 12.1% |
| Total Housing Units | 91 | 100.0% |
Occupancy by Ownership by Household Size in Grangeville
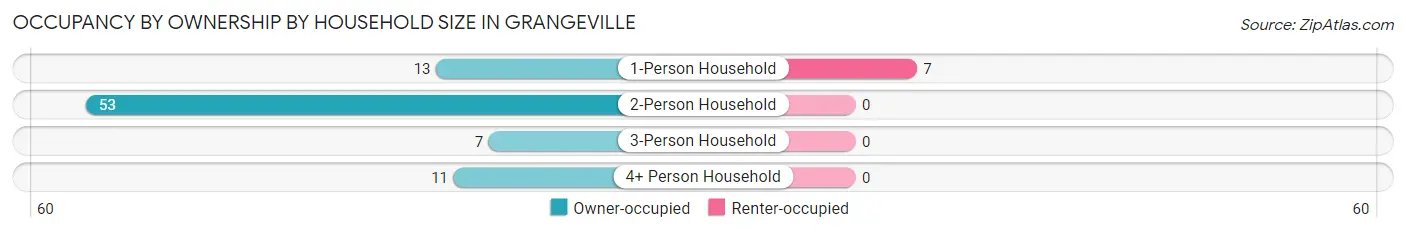
| Household Size | Owner-occupied | Renter-occupied |
| 1-Person Household | 13 (65.0%) | 7 (35.0%) |
| 2-Person Household | 53 (100.0%) | 0 (0.0%) |
| 3-Person Household | 7 (100.0%) | 0 (0.0%) |
| 4+ Person Household | 11 (100.0%) | 0 (0.0%) |
| Total Housing Units | 84 (92.3%) | 7 (7.7%) |
Occupancy by Educational Attainment in Grangeville
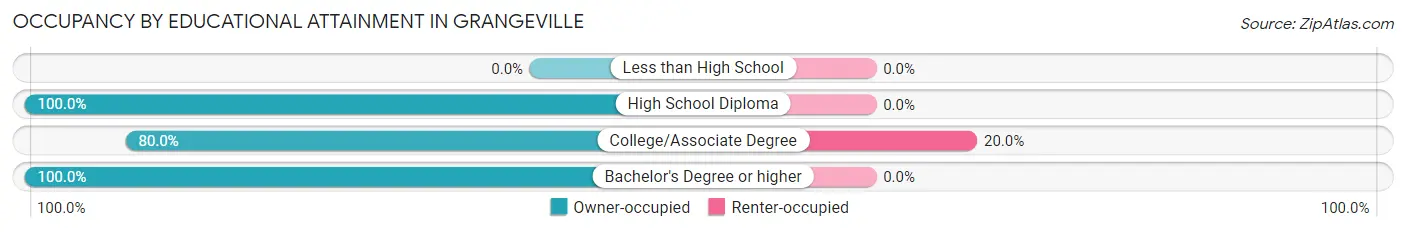
| Household Size | Owner-occupied | Renter-occupied |
| Less than High School | 0 (0.0%) | 0 (0.0%) |
| High School Diploma | 8 (100.0%) | 0 (0.0%) |
| College/Associate Degree | 28 (80.0%) | 7 (20.0%) |
| Bachelor's Degree or higher | 48 (100.0%) | 0 (0.0%) |
Occupancy by Age of Householder in Grangeville
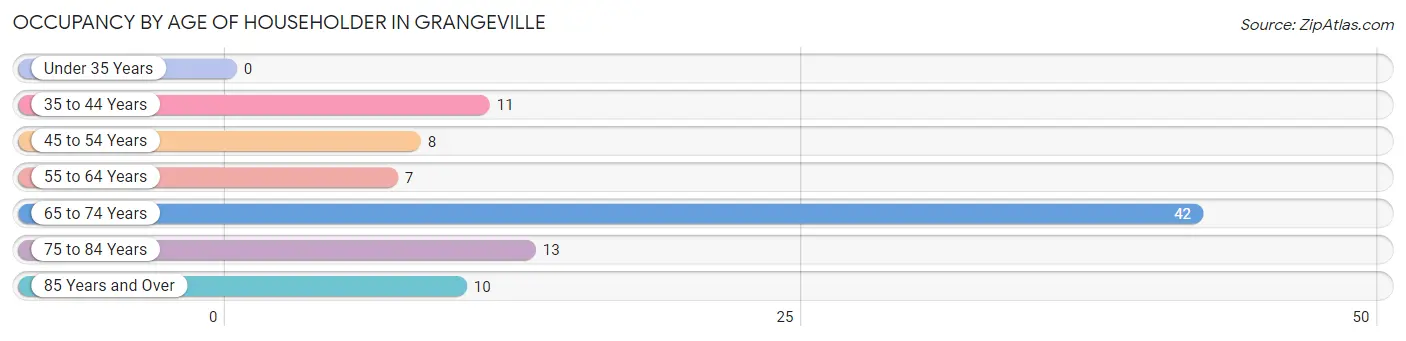
| Age Bracket | # Households | % Households |
| Under 35 Years | 0 | 0.0% |
| 35 to 44 Years | 11 | 12.1% |
| 45 to 54 Years | 8 | 8.8% |
| 55 to 64 Years | 7 | 7.7% |
| 65 to 74 Years | 42 | 46.2% |
| 75 to 84 Years | 13 | 14.3% |
| 85 Years and Over | 10 | 11.0% |
| Total | 91 | 100.0% |
Housing Finances in Grangeville
Median Income by Occupancy in Grangeville
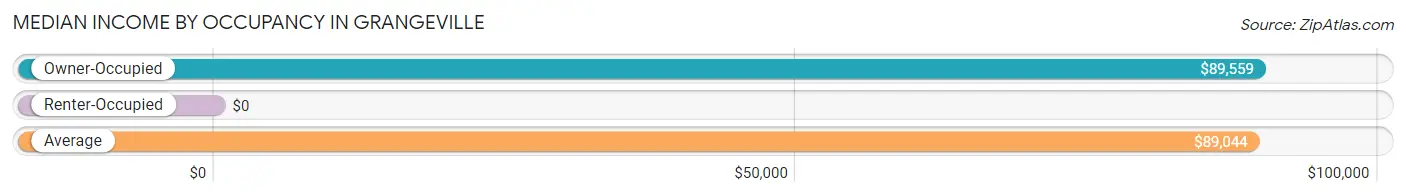
| Occupancy Type | # Households | Median Income |
| Owner-Occupied | 84 (92.3%) | $89,559 |
| Renter-Occupied | 7 (7.7%) | $0 |
| Average | 91 (100.0%) | $89,044 |
Occupancy by Householder Income Bracket in Grangeville
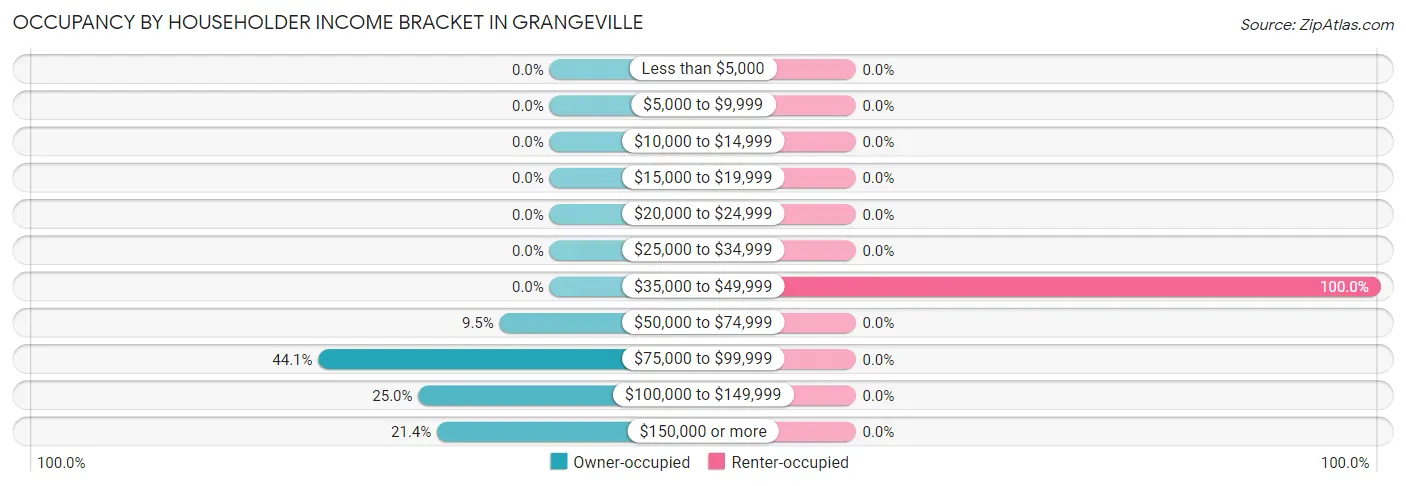
| Income Bracket | Owner-occupied | Renter-occupied |
| Less than $5,000 | 0 (0.0%) | 0 (0.0%) |
| $5,000 to $9,999 | 0 (0.0%) | 0 (0.0%) |
| $10,000 to $14,999 | 0 (0.0%) | 0 (0.0%) |
| $15,000 to $19,999 | 0 (0.0%) | 0 (0.0%) |
| $20,000 to $24,999 | 0 (0.0%) | 0 (0.0%) |
| $25,000 to $34,999 | 0 (0.0%) | 0 (0.0%) |
| $35,000 to $49,999 | 0 (0.0%) | 7 (100.0%) |
| $50,000 to $74,999 | 8 (9.5%) | 0 (0.0%) |
| $75,000 to $99,999 | 37 (44.1%) | 0 (0.0%) |
| $100,000 to $149,999 | 21 (25.0%) | 0 (0.0%) |
| $150,000 or more | 18 (21.4%) | 0 (0.0%) |
| Total | 84 (100.0%) | 7 (100.0%) |
Monthly Housing Cost Tiers in Grangeville
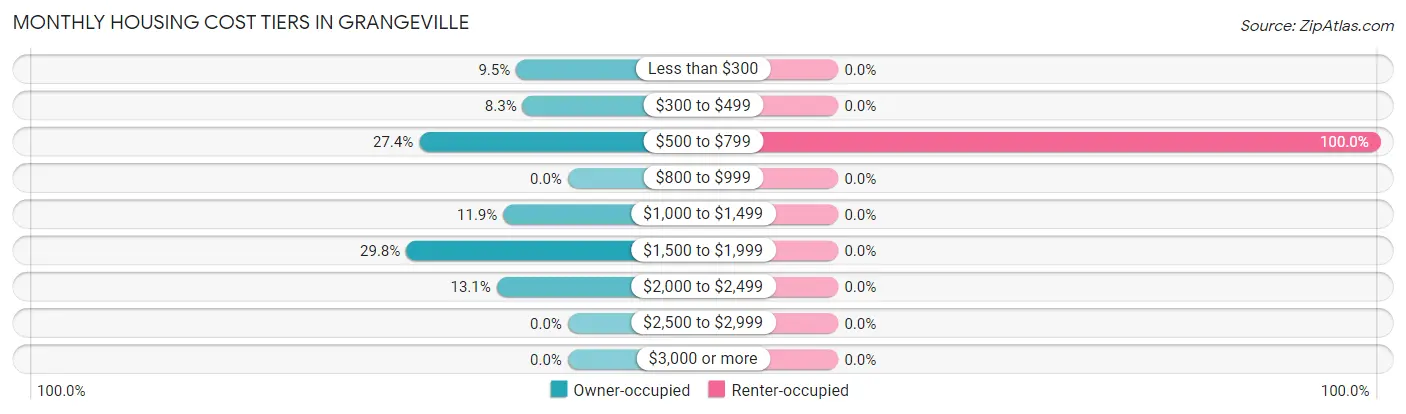
| Monthly Cost | Owner-occupied | Renter-occupied |
| Less than $300 | 8 (9.5%) | 0 (0.0%) |
| $300 to $499 | 7 (8.3%) | 0 (0.0%) |
| $500 to $799 | 23 (27.4%) | 7 (100.0%) |
| $800 to $999 | 0 (0.0%) | 0 (0.0%) |
| $1,000 to $1,499 | 10 (11.9%) | 0 (0.0%) |
| $1,500 to $1,999 | 25 (29.8%) | 0 (0.0%) |
| $2,000 to $2,499 | 11 (13.1%) | 0 (0.0%) |
| $2,500 to $2,999 | 0 (0.0%) | 0 (0.0%) |
| $3,000 or more | 0 (0.0%) | 0 (0.0%) |
| Total | 84 (100.0%) | 7 (100.0%) |
Physical Housing Characteristics in Grangeville
Housing Structures in Grangeville
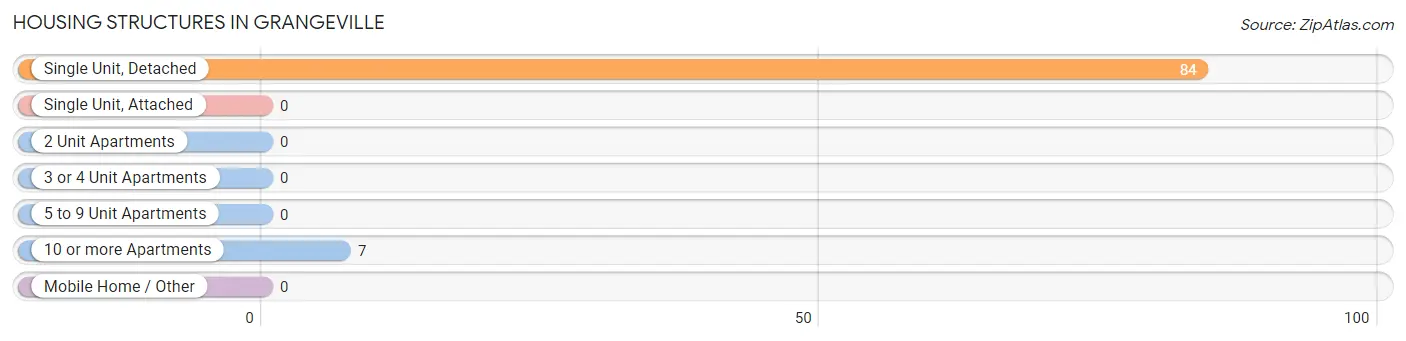
| Structure Type | # Housing Units | % Housing Units |
| Single Unit, Detached | 84 | 92.3% |
| Single Unit, Attached | 0 | 0.0% |
| 2 Unit Apartments | 0 | 0.0% |
| 3 or 4 Unit Apartments | 0 | 0.0% |
| 5 to 9 Unit Apartments | 0 | 0.0% |
| 10 or more Apartments | 7 | 7.7% |
| Mobile Home / Other | 0 | 0.0% |
| Total | 91 | 100.0% |
Housing Structures by Occupancy in Grangeville
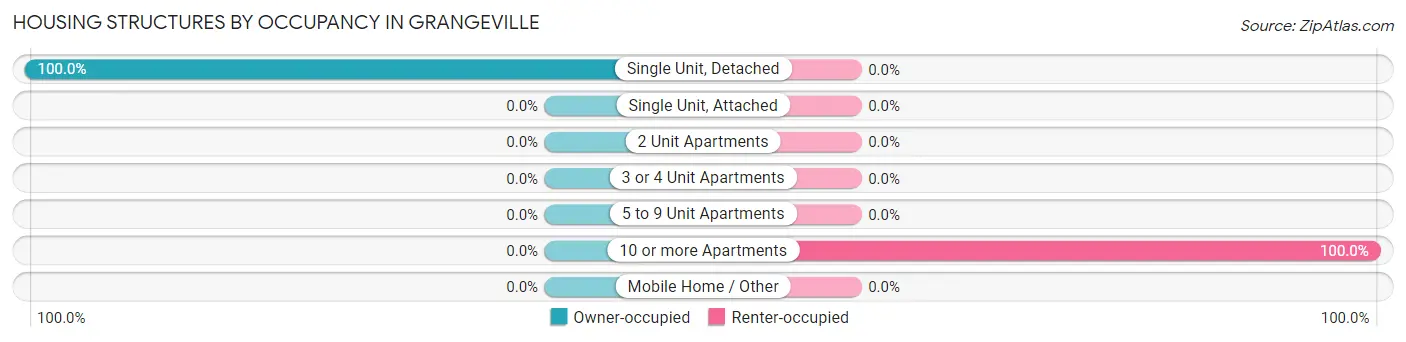
| Structure Type | Owner-occupied | Renter-occupied |
| Single Unit, Detached | 84 (100.0%) | 0 (0.0%) |
| Single Unit, Attached | 0 (0.0%) | 0 (0.0%) |
| 2 Unit Apartments | 0 (0.0%) | 0 (0.0%) |
| 3 or 4 Unit Apartments | 0 (0.0%) | 0 (0.0%) |
| 5 to 9 Unit Apartments | 0 (0.0%) | 0 (0.0%) |
| 10 or more Apartments | 0 (0.0%) | 7 (100.0%) |
| Mobile Home / Other | 0 (0.0%) | 0 (0.0%) |
| Total | 84 (92.3%) | 7 (7.7%) |
Housing Structures by Number of Rooms in Grangeville
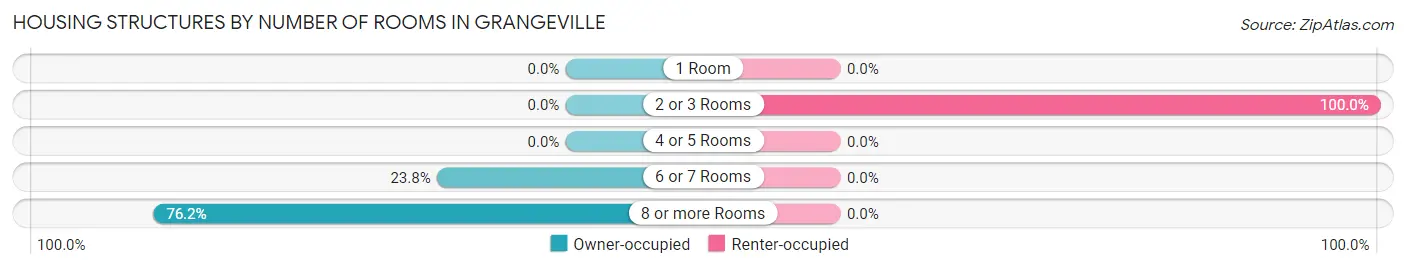
| Number of Rooms | Owner-occupied | Renter-occupied |
| 1 Room | 0 (0.0%) | 0 (0.0%) |
| 2 or 3 Rooms | 0 (0.0%) | 7 (100.0%) |
| 4 or 5 Rooms | 0 (0.0%) | 0 (0.0%) |
| 6 or 7 Rooms | 20 (23.8%) | 0 (0.0%) |
| 8 or more Rooms | 64 (76.2%) | 0 (0.0%) |
| Total | 84 (100.0%) | 7 (100.0%) |
Housing Structure by Heating Type in Grangeville
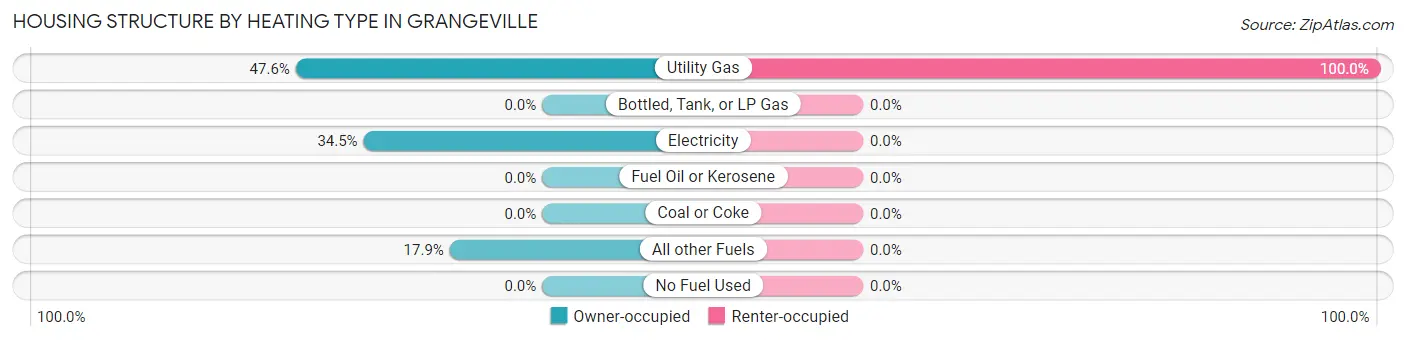
| Heating Type | Owner-occupied | Renter-occupied |
| Utility Gas | 40 (47.6%) | 7 (100.0%) |
| Bottled, Tank, or LP Gas | 0 (0.0%) | 0 (0.0%) |
| Electricity | 29 (34.5%) | 0 (0.0%) |
| Fuel Oil or Kerosene | 0 (0.0%) | 0 (0.0%) |
| Coal or Coke | 0 (0.0%) | 0 (0.0%) |
| All other Fuels | 15 (17.9%) | 0 (0.0%) |
| No Fuel Used | 0 (0.0%) | 0 (0.0%) |
| Total | 84 (100.0%) | 7 (100.0%) |
Household Vehicle Usage in Grangeville
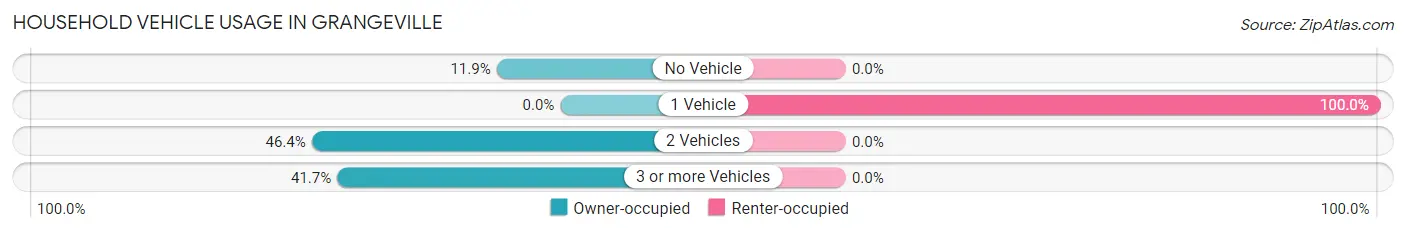
| Vehicles per Household | Owner-occupied | Renter-occupied |
| No Vehicle | 10 (11.9%) | 0 (0.0%) |
| 1 Vehicle | 0 (0.0%) | 7 (100.0%) |
| 2 Vehicles | 39 (46.4%) | 0 (0.0%) |
| 3 or more Vehicles | 35 (41.7%) | 0 (0.0%) |
| Total | 84 (100.0%) | 7 (100.0%) |
Real Estate & Mortgages in Grangeville
Real Estate and Mortgage Overview in Grangeville
| Characteristic | Without Mortgage | With Mortgage |
| Housing Units | 48 | 36 |
| Median Property Value | $430,000 | $490,900 |
| Median Household Income | $77,000 | $8 |
| Monthly Housing Costs | $590 | $0 |
| Real Estate Taxes | $3,300 | $0 |
Property Value by Mortgage Status in Grangeville
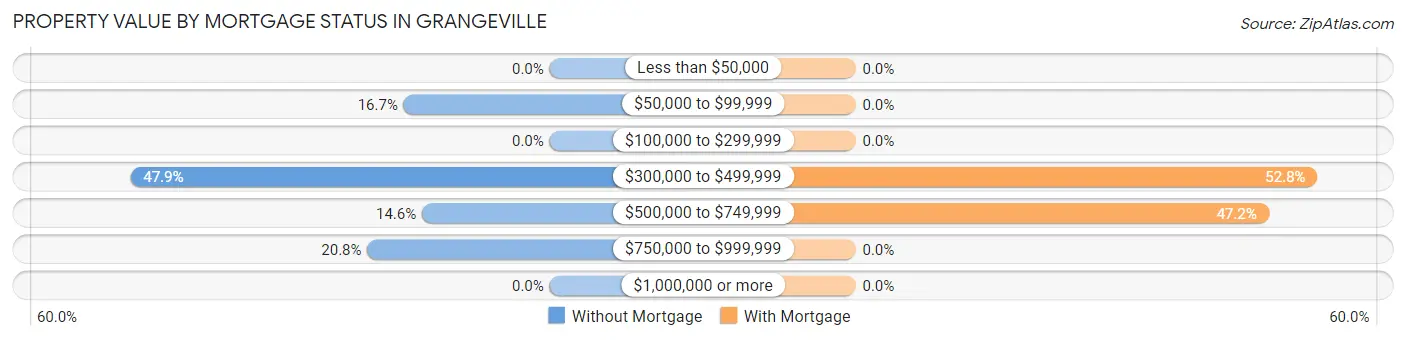
| Property Value | Without Mortgage | With Mortgage |
| Less than $50,000 | 0 (0.0%) | 0 (0.0%) |
| $50,000 to $99,999 | 8 (16.7%) | 0 (0.0%) |
| $100,000 to $299,999 | 0 (0.0%) | 0 (0.0%) |
| $300,000 to $499,999 | 23 (47.9%) | 19 (52.8%) |
| $500,000 to $749,999 | 7 (14.6%) | 17 (47.2%) |
| $750,000 to $999,999 | 10 (20.8%) | 0 (0.0%) |
| $1,000,000 or more | 0 (0.0%) | 0 (0.0%) |
| Total | 48 (100.0%) | 36 (100.0%) |
Household Income by Mortgage Status in Grangeville
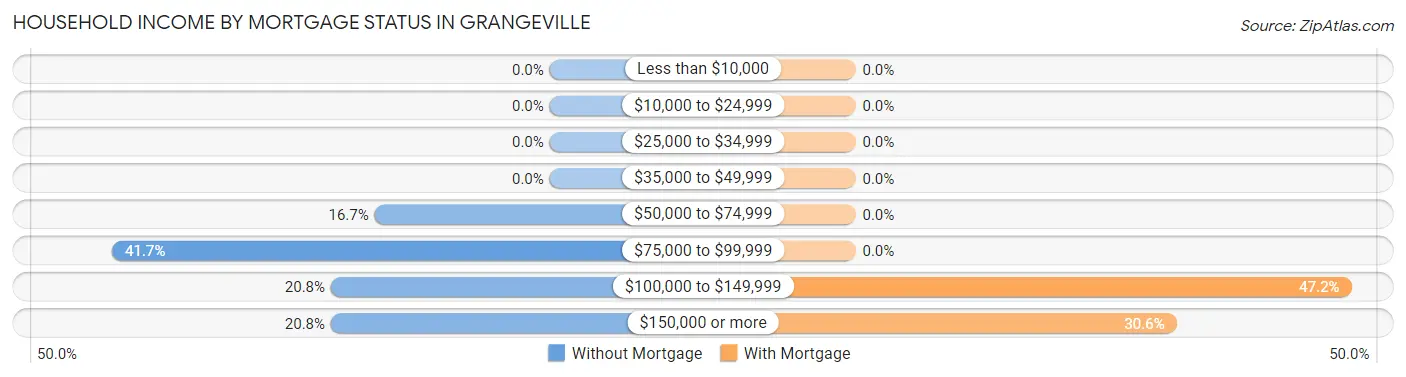
| Household Income | Without Mortgage | With Mortgage |
| Less than $10,000 | 0 (0.0%) | 0 (0.0%) |
| $10,000 to $24,999 | 0 (0.0%) | 0 (0.0%) |
| $25,000 to $34,999 | 0 (0.0%) | 0 (0.0%) |
| $35,000 to $49,999 | 0 (0.0%) | 0 (0.0%) |
| $50,000 to $74,999 | 8 (16.7%) | 0 (0.0%) |
| $75,000 to $99,999 | 20 (41.7%) | 0 (0.0%) |
| $100,000 to $149,999 | 10 (20.8%) | 17 (47.2%) |
| $150,000 or more | 10 (20.8%) | 11 (30.6%) |
| Total | 48 (100.0%) | 36 (100.0%) |
Property Value to Household Income Ratio in Grangeville
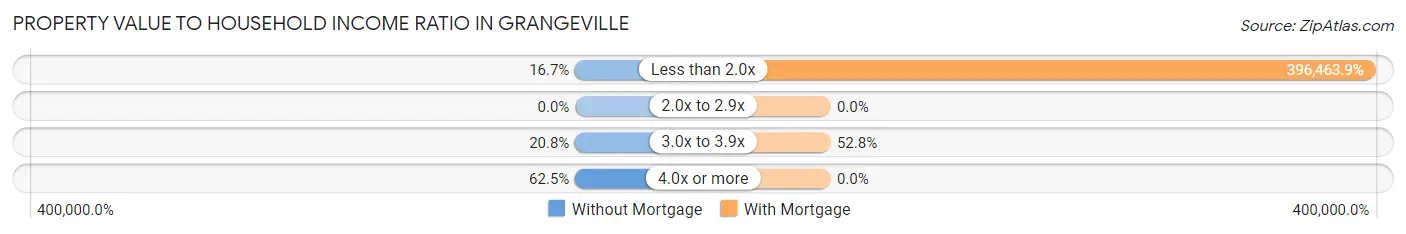
| Value-to-Income Ratio | Without Mortgage | With Mortgage |
| Less than 2.0x | 8 (16.7%) | 142,727 (396,463.9%) |
| 2.0x to 2.9x | 0 (0.0%) | 0 (0.0%) |
| 3.0x to 3.9x | 10 (20.8%) | 19 (52.8%) |
| 4.0x or more | 30 (62.5%) | 0 (0.0%) |
| Total | 48 (100.0%) | 36 (100.0%) |
Real Estate Taxes by Mortgage Status in Grangeville
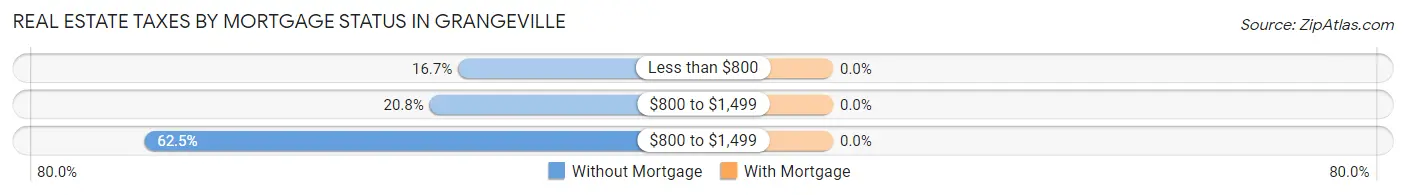
| Property Taxes | Without Mortgage | With Mortgage |
| Less than $800 | 8 (16.7%) | 0 (0.0%) |
| $800 to $1,499 | 10 (20.8%) | 0 (0.0%) |
| $800 to $1,499 | 30 (62.5%) | 0 (0.0%) |
| Total | 48 (100.0%) | 36 (100.0%) |
Health & Disability in Grangeville
Health Insurance Coverage by Age in Grangeville
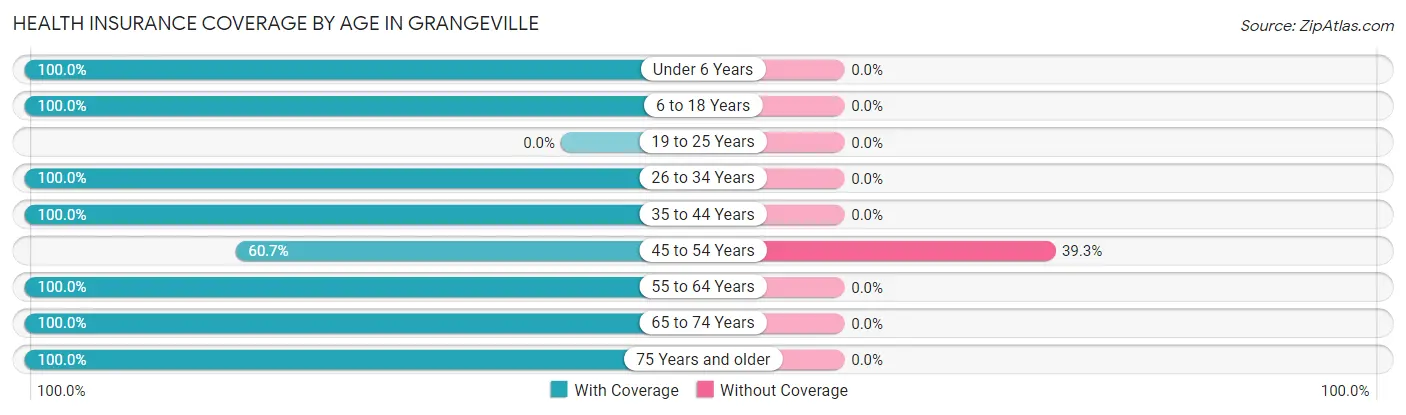
| Age Bracket | With Coverage | Without Coverage |
| Under 6 Years | 30 (100.0%) | 0 (0.0%) |
| 6 to 18 Years | 35 (100.0%) | 0 (0.0%) |
| 19 to 25 Years | 0 (0.0%) | 0 (0.0%) |
| 26 to 34 Years | 11 (100.0%) | 0 (0.0%) |
| 35 to 44 Years | 26 (100.0%) | 0 (0.0%) |
| 45 to 54 Years | 17 (60.7%) | 11 (39.3%) |
| 55 to 64 Years | 30 (100.0%) | 0 (0.0%) |
| 65 to 74 Years | 61 (100.0%) | 0 (0.0%) |
| 75 Years and older | 23 (100.0%) | 0 (0.0%) |
| Total | 233 (95.5%) | 11 (4.5%) |
Health Insurance Coverage by Citizenship Status in Grangeville
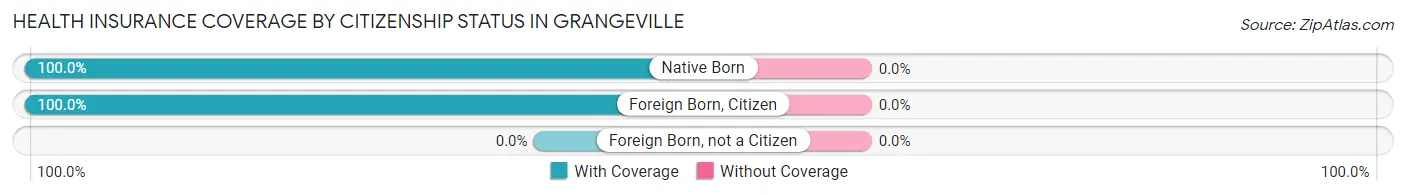
| Citizenship Status | With Coverage | Without Coverage |
| Native Born | 30 (100.0%) | 0 (0.0%) |
| Foreign Born, Citizen | 35 (100.0%) | 0 (0.0%) |
| Foreign Born, not a Citizen | 0 (0.0%) | 0 (0.0%) |
Health Insurance Coverage by Household Income in Grangeville
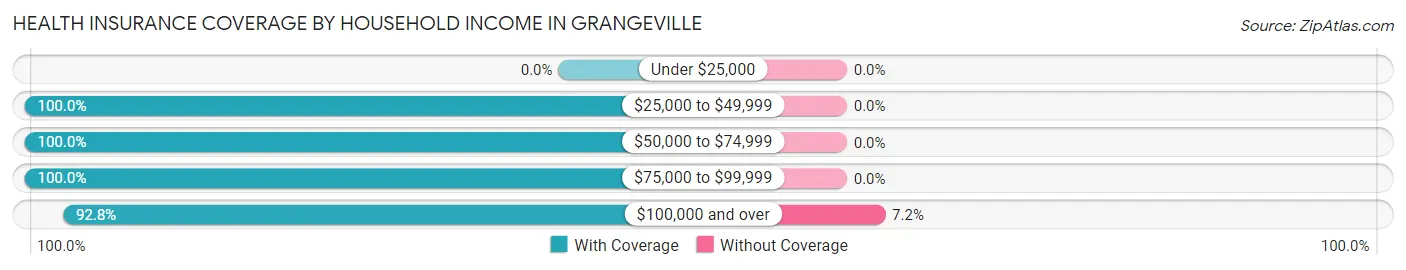
| Household Income | With Coverage | Without Coverage |
| Under $25,000 | 0 (0.0%) | 0 (0.0%) |
| $25,000 to $49,999 | 7 (100.0%) | 0 (0.0%) |
| $50,000 to $74,999 | 16 (100.0%) | 0 (0.0%) |
| $75,000 to $99,999 | 68 (100.0%) | 0 (0.0%) |
| $100,000 and over | 142 (92.8%) | 11 (7.2%) |
Public vs Private Health Insurance Coverage by Age in Grangeville
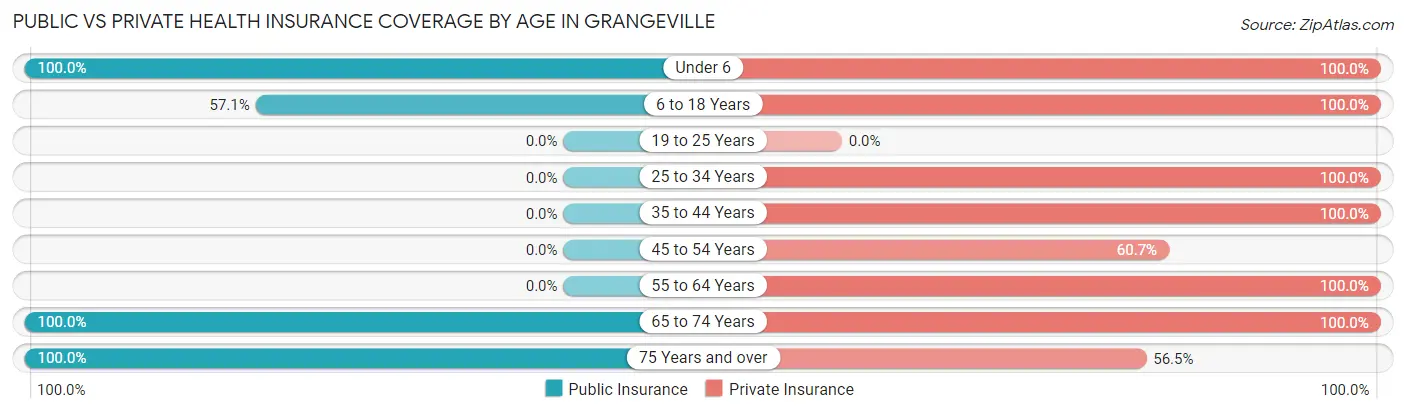
| Age Bracket | Public Insurance | Private Insurance |
| Under 6 | 30 (100.0%) | 30 (100.0%) |
| 6 to 18 Years | 20 (57.1%) | 35 (100.0%) |
| 19 to 25 Years | 0 (0.0%) | 0 (0.0%) |
| 25 to 34 Years | 0 (0.0%) | 11 (100.0%) |
| 35 to 44 Years | 0 (0.0%) | 26 (100.0%) |
| 45 to 54 Years | 0 (0.0%) | 17 (60.7%) |
| 55 to 64 Years | 0 (0.0%) | 30 (100.0%) |
| 65 to 74 Years | 61 (100.0%) | 61 (100.0%) |
| 75 Years and over | 23 (100.0%) | 13 (56.5%) |
| Total | 134 (54.9%) | 223 (91.4%) |
Disability Status by Sex by Age in Grangeville
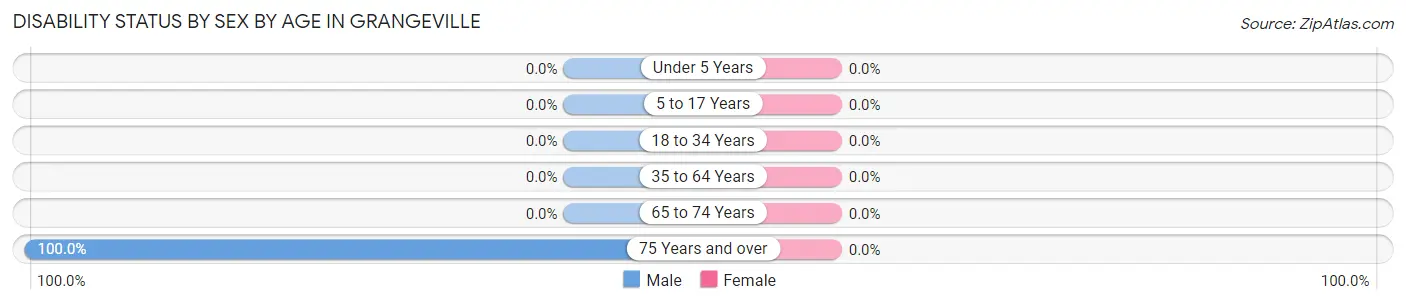
| Age Bracket | Male | Female |
| Under 5 Years | 0 (0.0%) | 0 (0.0%) |
| 5 to 17 Years | 0 (0.0%) | 0 (0.0%) |
| 18 to 34 Years | 0 (0.0%) | 0 (0.0%) |
| 35 to 64 Years | 0 (0.0%) | 0 (0.0%) |
| 65 to 74 Years | 0 (0.0%) | 0 (0.0%) |
| 75 Years and over | 23 (100.0%) | 0 (0.0%) |
Disability Class by Sex by Age in Grangeville
Disability Class: Hearing Difficulty
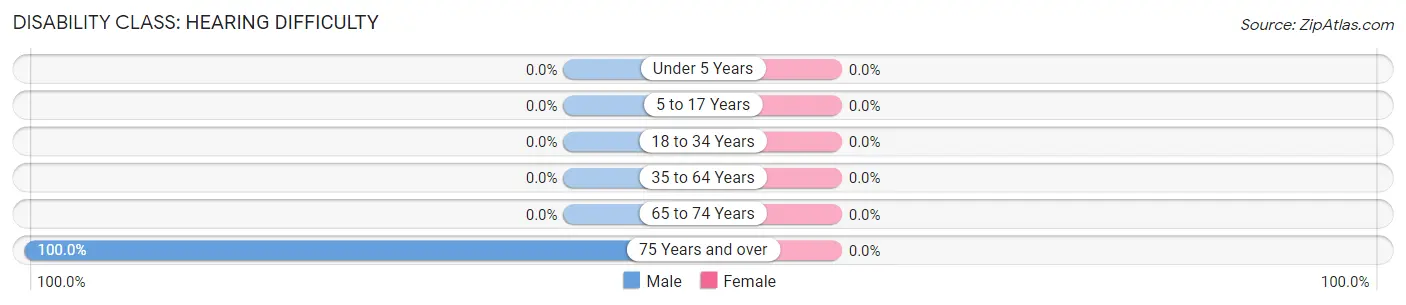
| Age Bracket | Male | Female |
| Under 5 Years | 0 (0.0%) | 0 (0.0%) |
| 5 to 17 Years | 0 (0.0%) | 0 (0.0%) |
| 18 to 34 Years | 0 (0.0%) | 0 (0.0%) |
| 35 to 64 Years | 0 (0.0%) | 0 (0.0%) |
| 65 to 74 Years | 0 (0.0%) | 0 (0.0%) |
| 75 Years and over | 23 (100.0%) | 0 (0.0%) |
Disability Class: Vision Difficulty
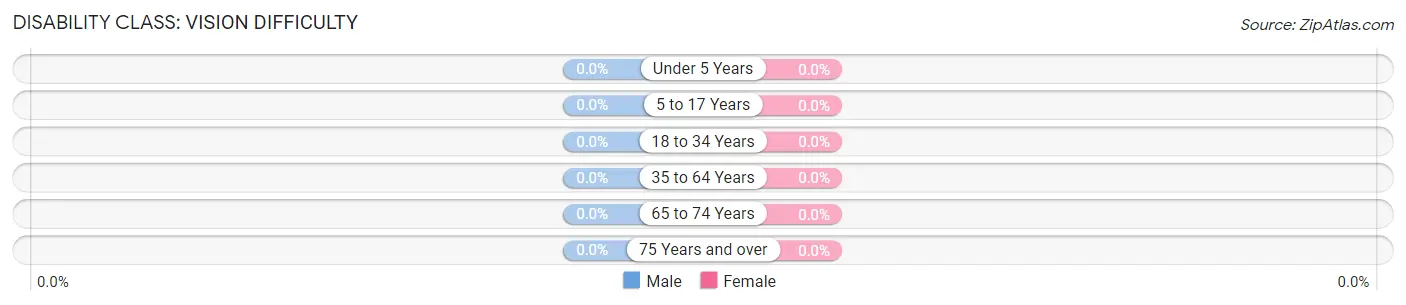
| Age Bracket | Male | Female |
| Under 5 Years | 0 (0.0%) | 0 (0.0%) |
| 5 to 17 Years | 0 (0.0%) | 0 (0.0%) |
| 18 to 34 Years | 0 (0.0%) | 0 (0.0%) |
| 35 to 64 Years | 0 (0.0%) | 0 (0.0%) |
| 65 to 74 Years | 0 (0.0%) | 0 (0.0%) |
| 75 Years and over | 0 (0.0%) | 0 (0.0%) |
Disability Class: Cognitive Difficulty
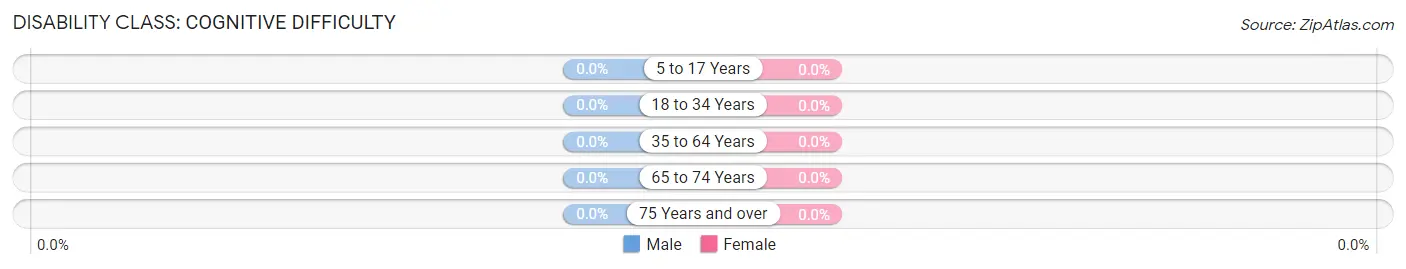
| Age Bracket | Male | Female |
| 5 to 17 Years | 0 (0.0%) | 0 (0.0%) |
| 18 to 34 Years | 0 (0.0%) | 0 (0.0%) |
| 35 to 64 Years | 0 (0.0%) | 0 (0.0%) |
| 65 to 74 Years | 0 (0.0%) | 0 (0.0%) |
| 75 Years and over | 0 (0.0%) | 0 (0.0%) |
Disability Class: Ambulatory Difficulty
| Age Bracket | Male | Female |
| 5 to 17 Years | 0 (0.0%) | 0 (0.0%) |
| 18 to 34 Years | 0 (0.0%) | 0 (0.0%) |
| 35 to 64 Years | 0 (0.0%) | 0 (0.0%) |
| 65 to 74 Years | 0 (0.0%) | 0 (0.0%) |
| 75 Years and over | 0 (0.0%) | 0 (0.0%) |
Disability Class: Self-Care Difficulty
| Age Bracket | Male | Female |
| 5 to 17 Years | 0 (0.0%) | 0 (0.0%) |
| 18 to 34 Years | 0 (0.0%) | 0 (0.0%) |
| 35 to 64 Years | 0 (0.0%) | 0 (0.0%) |
| 65 to 74 Years | 0 (0.0%) | 0 (0.0%) |
| 75 Years and over | 0 (0.0%) | 0 (0.0%) |
Technology Access in Grangeville
Computing Device Access in Grangeville
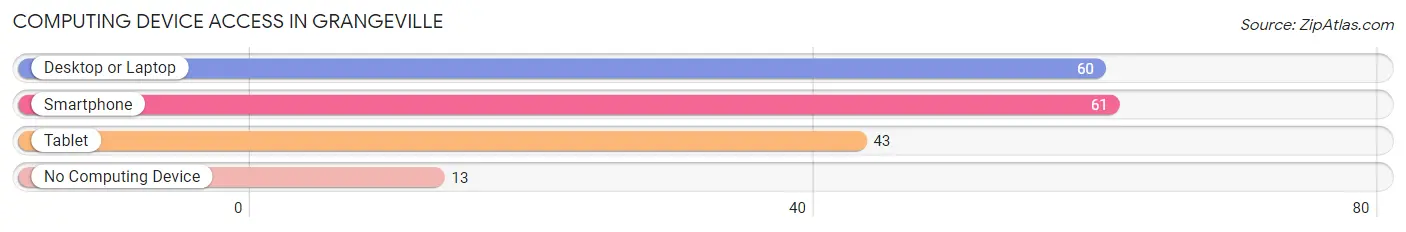
| Device Type | # Households | % Households |
| Desktop or Laptop | 60 | 65.9% |
| Smartphone | 61 | 67.0% |
| Tablet | 43 | 47.2% |
| No Computing Device | 13 | 14.3% |
| Total | 91 | 100.0% |
Internet Access in Grangeville
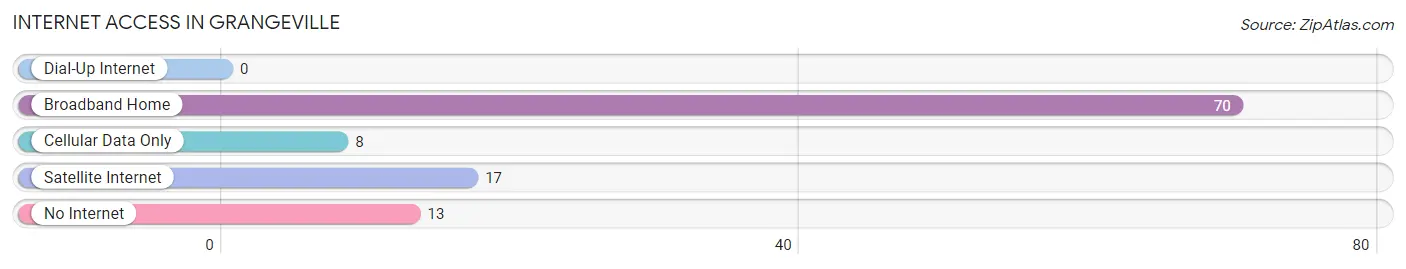
| Internet Type | # Households | % Households |
| Dial-Up Internet | 0 | 0.0% |
| Broadband Home | 70 | 76.9% |
| Cellular Data Only | 8 | 8.8% |
| Satellite Internet | 17 | 18.7% |
| No Internet | 13 | 14.3% |
| Total | 91 | 100.0% |
Grangeville Summary
Grangeville is a small town located in the northern part of California, in the foothills of the Sierra Nevada Mountains. It is situated in the Sierra Valley, which is a large agricultural area. The town is located about 30 miles east of the city of Sacramento and is part of the Sacramento-Arden-Arcade-Roseville Metropolitan Statistical Area.
History
Grangeville was founded in 1852 by a group of settlers from the nearby town of Auburn. The settlers were looking for a place to settle and farm, and they chose the area because of its fertile soil and abundant water supply. The town was named after the Grange, a fraternal organization that was popular in the area at the time.
The town grew slowly but steadily, and by the late 19th century, it had become a thriving agricultural community. The town was home to a variety of businesses, including a flour mill, a blacksmith shop, a general store, and a hotel.
In the early 20th century, the town began to decline as the population shifted to larger cities. However, in the 1950s, the town experienced a resurgence as a result of the construction of the nearby Oroville Dam. The dam provided irrigation water to the area, which allowed for the growth of the agricultural industry.
Geography
Grangeville is located in the Sierra Valley, which is a large agricultural area. The town is situated at an elevation of 1,400 feet and is surrounded by rolling hills and mountains. The town is located about 30 miles east of the city of Sacramento and is part of the Sacramento-Arden-Arcade-Roseville Metropolitan Statistical Area.
The climate in Grangeville is mild and temperate, with hot summers and cool winters. The average annual temperature is around 60 degrees Fahrenheit, and the average annual precipitation is around 20 inches.
Economy
Grangeville’s economy is largely based on agriculture. The town is home to a variety of farms, including dairy farms, fruit and nut farms, and vegetable farms. The town is also home to a number of businesses, including a flour mill, a blacksmith shop, a general store, and a hotel.
Demographics
As of the 2010 census, the population of Grangeville was 1,845. The racial makeup of the town was 87.3% White, 0.7% African American, 0.3% Native American, 0.7% Asian, 0.1% Pacific Islander, 8.7% from other races, and 2.1% from two or more races. The median household income was $45,938, and the median family income was $50,938. The per capita income was $20,938.
Grangeville is a small town with a rich history and a vibrant economy. The town is home to a variety of businesses and farms, and it is a popular destination for tourists and outdoor enthusiasts. The town is also home to a diverse population, with a variety of racial and ethnic backgrounds.
Common Questions
What is Per Capita Income in Grangeville?
Per Capita income in Grangeville is $40,654.
What is the Median Family Income in Grangeville?
Median Family Income in Grangeville is $113,375.
What is the Median Household income in Grangeville?
Median Household Income in Grangeville is $89,044.
What is Inequality or Gini Index in Grangeville?
Inequality or Gini Index in Grangeville is 0.19.
What is the Total Population of Grangeville?
Total Population of Grangeville is 244.
What is the Total Male Population of Grangeville?
Total Male Population of Grangeville is 136.
What is the Total Female Population of Grangeville?
Total Female Population of Grangeville is 108.
What is the Ratio of Males per 100 Females in Grangeville?
There are 125.93 Males per 100 Females in Grangeville.
What is the Ratio of Females per 100 Males in Grangeville?
There are 79.41 Females per 100 Males in Grangeville.
What is the Median Population Age in Grangeville?
Median Population Age in Grangeville is 54.0 Years.
What is the Average Family Size in Grangeville
Average Family Size in Grangeville is 3.1 People.
What is the Average Household Size in Grangeville
Average Household Size in Grangeville is 2.7 People.
How Large is the Labor Force in Grangeville?
There are 85 People in the Labor Forcein in Grangeville.
What is the Percentage of People in the Labor Force in Grangeville?
47.5% of People are in the Labor Force in Grangeville.