Cities with the Highest Percentage of Population Employed in Computer, Engineering & Science in Vermont
RELATED REPORTS & OPTIONS
Computer, Engineering & Science
Vermont
Compare Cities
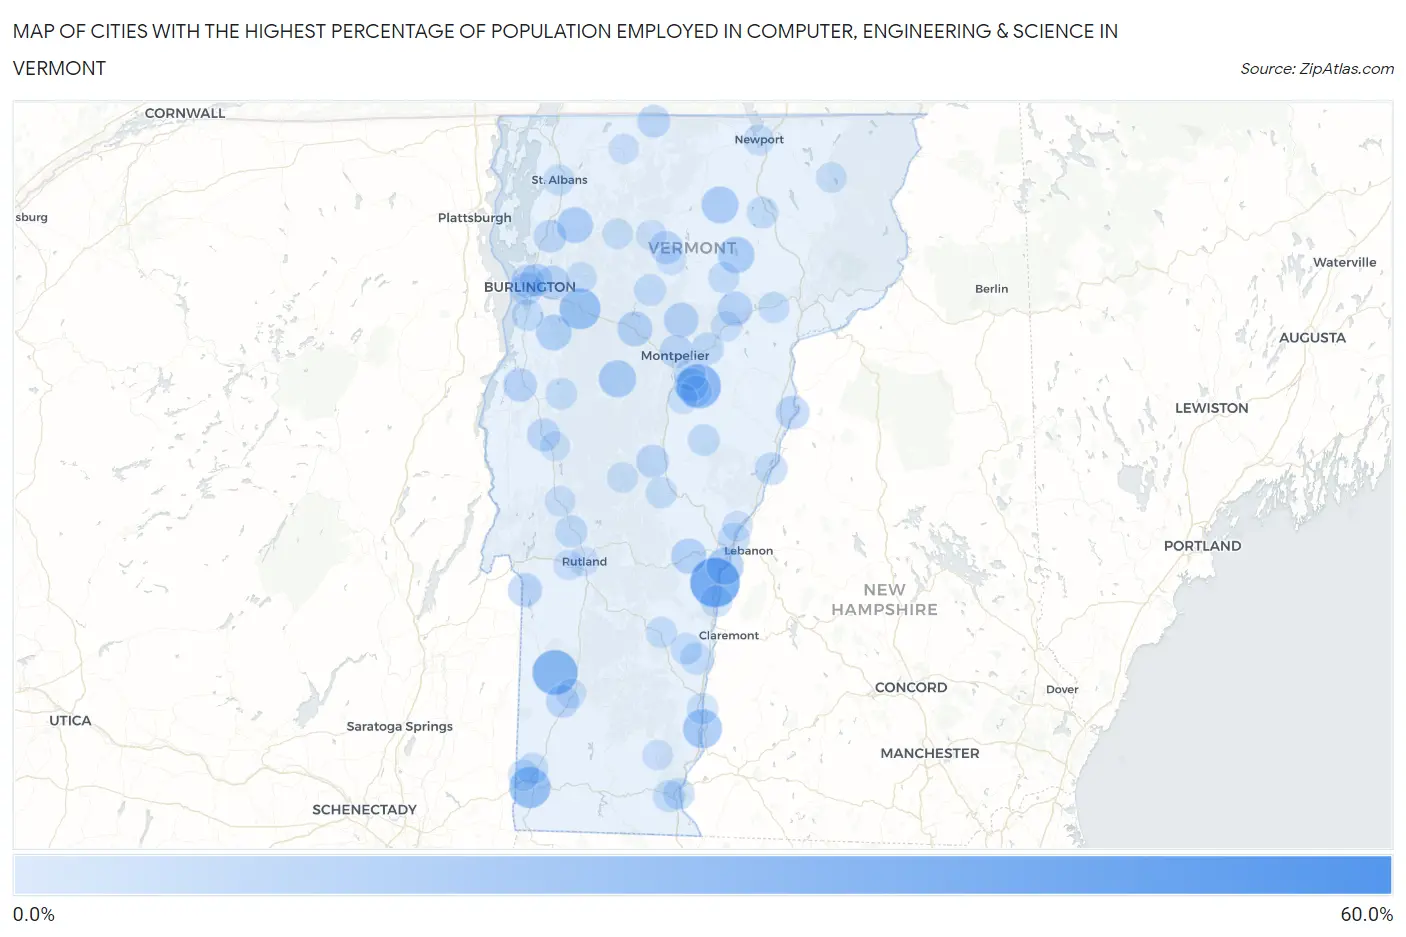
Map of Cities with the Highest Percentage of Population Employed in Computer, Engineering & Science in Vermont
0.0%
60.0%
Cities with the Highest Percentage of Population Employed in Computer, Engineering & Science in Vermont
| City | % Employed | vs State | vs National | |
| 1. | Huntington Center | 57.0% | 6.0%(+51.0)#1 | 6.8%(+50.2)#46 |
| 2. | Hartland | 38.6% | 6.0%(+32.7)#2 | 6.8%(+31.9)#123 |
| 3. | Waterbury Center | 36.9% | 6.0%(+31.0)#3 | 6.8%(+30.2)#136 |
| 4. | Dorset | 30.2% | 6.0%(+24.2)#4 | 6.8%(+23.5)#217 |
| 5. | Hanksville | 29.2% | 6.0%(+23.2)#5 | 6.8%(+22.4)#236 |
| 6. | Websterville | 28.8% | 6.0%(+22.8)#6 | 6.8%(+22.0)#241 |
| 7. | Old Bennington | 22.9% | 6.0%(+16.9)#7 | 6.8%(+16.1)#404 |
| 8. | Richmond | 22.7% | 6.0%(+16.7)#8 | 6.8%(+16.0)#415 |
| 9. | Pawlet | 22.7% | 6.0%(+16.7)#9 | 6.8%(+15.9)#418 |
| 10. | Westminster | 19.0% | 6.0%(+13.0)#10 | 6.8%(+12.2)#640 |
| 11. | South Lincoln | 17.8% | 6.0%(+11.8)#11 | 6.8%(+11.0)#750 |
| 12. | Westford | 16.1% | 6.0%(+10.1)#12 | 6.8%(+9.36)#944 |
| 13. | Waitsfield | 15.5% | 6.0%(+9.53)#13 | 6.8%(+8.75)#1,033 |
| 14. | Albany | 15.3% | 6.0%(+9.32)#14 | 6.8%(+8.54)#1,085 |
| 15. | North Hartland | 15.2% | 6.0%(+9.20)#15 | 6.8%(+8.42)#1,103 |
| 16. | Greensboro | 14.3% | 6.0%(+8.30)#16 | 6.8%(+7.52)#1,272 |
| 17. | East Charlotte | 13.8% | 6.0%(+7.84)#17 | 6.8%(+7.06)#1,390 |
| 18. | Algiers | 13.5% | 6.0%(+7.49)#18 | 6.8%(+6.71)#1,489 |
| 19. | Fairfax | 13.2% | 6.0%(+7.22)#19 | 6.8%(+6.44)#1,574 |
| 20. | East Poultney | 13.0% | 6.0%(+7.06)#20 | 6.8%(+6.28)#1,616 |
| 21. | Hinesburg | 12.7% | 6.0%(+6.74)#21 | 6.8%(+5.96)#1,717 |
| 22. | Woodstock | 12.1% | 6.0%(+6.12)#22 | 6.8%(+5.34)#1,916 |
| 23. | St. George | 11.5% | 6.0%(+5.50)#23 | 6.8%(+4.72)#2,130 |
| 24. | Waterbury | 11.4% | 6.0%(+5.40)#24 | 6.8%(+4.62)#2,177 |
| 25. | Weston | 11.1% | 6.0%(+5.13)#25 | 6.8%(+4.35)#2,324 |
| 26. | Cabot | 11.0% | 6.0%(+5.03)#26 | 6.8%(+4.24)#2,374 |
| 27. | Worcester | 10.8% | 6.0%(+4.83)#27 | 6.8%(+4.05)#2,459 |
| 28. | Huntington | 9.8% | 6.0%(+3.77)#28 | 6.8%(+2.99)#3,105 |
| 29. | Essex Junction | 9.7% | 6.0%(+3.72)#29 | 6.8%(+2.94)#3,151 |
| 30. | Poultney | 9.7% | 6.0%(+3.67)#30 | 6.8%(+2.89)#3,190 |
| 31. | South Barre | 9.3% | 6.0%(+3.31)#31 | 6.8%(+2.53)#3,474 |
| 32. | Vergennes | 9.3% | 6.0%(+3.29)#32 | 6.8%(+2.50)#3,493 |
| 33. | Newbury | 9.2% | 6.0%(+3.21)#33 | 6.8%(+2.42)#3,554 |
| 34. | Killington | 9.0% | 6.0%(+3.03)#34 | 6.8%(+2.25)#3,691 |
| 35. | Hyde Park | 8.5% | 6.0%(+2.47)#35 | 6.8%(+1.69)#4,220 |
| 36. | Montpelier | 8.2% | 6.0%(+2.26)#36 | 6.8%(+1.48)#4,419 |
| 37. | Manchester | 8.2% | 6.0%(+2.20)#37 | 6.8%(+1.42)#4,494 |
| 38. | Burlington | 8.1% | 6.0%(+2.14)#38 | 6.8%(+1.36)#4,554 |
| 39. | South Burlington | 8.1% | 6.0%(+2.09)#39 | 6.8%(+1.31)#4,609 |
| 40. | Randolph | 8.0% | 6.0%(+2.06)#40 | 6.8%(+1.28)#4,635 |
| 41. | Middlebury | 8.0% | 6.0%(+2.03)#41 | 6.8%(+1.25)#4,679 |
| 42. | Milton | 7.9% | 6.0%(+1.90)#42 | 6.8%(+1.12)#4,847 |
| 43. | Hartford | 7.8% | 6.0%(+1.83)#43 | 6.8%(+1.05)#4,916 |
| 44. | Richford | 7.5% | 6.0%(+1.50)#44 | 6.8%(+0.723)#5,310 |
| 45. | Winooski | 7.4% | 6.0%(+1.39)#45 | 6.8%(+0.605)#5,448 |
| 46. | Plainfield | 7.1% | 6.0%(+1.16)#46 | 6.8%(+0.378)#5,742 |
| 47. | Fairlee | 6.9% | 6.0%(+0.913)#47 | 6.8%(+0.132)#6,114 |
| 48. | Pittsford | 6.6% | 6.0%(+0.628)#48 | 6.8%(-0.153)#6,532 |
| 49. | Middletown Springs | 6.6% | 6.0%(+0.595)#49 | 6.8%(-0.186)#6,584 |
| 50. | Barre | 6.5% | 6.0%(+0.469)#50 | 6.8%(-0.311)#6,770 |
| 51. | Springfield | 6.4% | 6.0%(+0.435)#51 | 6.8%(-0.346)#6,832 |
| 52. | Glover | 6.2% | 6.0%(+0.170)#52 | 6.8%(-0.611)#7,299 |
| 53. | South Shaftsbury | 6.1% | 6.0%(+0.100)#53 | 6.8%(-0.681)#7,413 |
| 54. | Wilder | 6.0% | 6.0%(+0.042)#54 | 6.8%(-0.739)#7,541 |
| 55. | Bolton Valley | 6.0% | 6.0%(+0.031)#55 | 6.8%(-0.750)#7,563 |
| 56. | Chelsea | 5.9% | 6.0%(-0.101)#56 | 6.8%(-0.882)#7,815 |
| 57. | Stowe | 5.8% | 6.0%(-0.164)#57 | 6.8%(-0.945)#7,953 |
| 58. | Shelburne | 5.8% | 6.0%(-0.210)#58 | 6.8%(-0.991)#8,031 |
| 59. | Windsor | 5.8% | 6.0%(-0.232)#59 | 6.8%(-1.01)#8,079 |
| 60. | West Brattleboro | 5.7% | 6.0%(-0.244)#60 | 6.8%(-1.02)#8,105 |
| 61. | Brattleboro | 5.7% | 6.0%(-0.270)#61 | 6.8%(-1.05)#8,140 |
| 62. | North Springfield | 5.5% | 6.0%(-0.462)#62 | 6.8%(-1.24)#8,485 |
| 63. | Stamford | 5.5% | 6.0%(-0.475)#63 | 6.8%(-1.26)#8,510 |
| 64. | Graniteville | 5.4% | 6.0%(-0.549)#64 | 6.8%(-1.33)#8,661 |
| 65. | Bristol | 5.4% | 6.0%(-0.565)#65 | 6.8%(-1.35)#8,693 |
| 66. | Bellows Falls | 5.3% | 6.0%(-0.692)#66 | 6.8%(-1.47)#8,940 |
| 67. | North Bennington | 5.1% | 6.0%(-0.838)#67 | 6.8%(-1.62)#9,245 |
| 68. | Hardwick | 5.1% | 6.0%(-0.888)#68 | 6.8%(-1.67)#9,352 |
| 69. | St Albans | 5.1% | 6.0%(-0.930)#69 | 6.8%(-1.71)#9,446 |
| 70. | Proctor | 5.0% | 6.0%(-1.03)#70 | 6.8%(-1.81)#9,669 |
| 71. | Bethel | 5.0% | 6.0%(-1.03)#71 | 6.8%(-1.81)#9,671 |
| 72. | Proctorsville | 4.9% | 6.0%(-1.13)#72 | 6.8%(-1.91)#9,892 |
| 73. | Bakersfield | 4.7% | 6.0%(-1.24)#73 | 6.8%(-2.02)#10,151 |
| 74. | Danville | 4.7% | 6.0%(-1.30)#74 | 6.8%(-2.08)#10,268 |
| 75. | South Hero | 4.4% | 6.0%(-1.59)#75 | 6.8%(-2.37)#10,949 |
| 76. | Jericho | 4.3% | 6.0%(-1.69)#76 | 6.8%(-2.47)#11,187 |
| 77. | Pownal Center | 4.2% | 6.0%(-1.76)#77 | 6.8%(-2.54)#11,395 |
| 78. | Underhill Flats | 4.2% | 6.0%(-1.77)#78 | 6.8%(-2.55)#11,398 |
| 79. | Lincoln | 4.1% | 6.0%(-1.92)#79 | 6.8%(-2.70)#11,802 |
| 80. | Danby | 4.0% | 6.0%(-1.94)#80 | 6.8%(-2.72)#11,869 |
| 81. | Jeffersonville | 4.0% | 6.0%(-2.03)#81 | 6.8%(-2.81)#12,099 |
| 82. | Newport | 3.9% | 6.0%(-2.07)#82 | 6.8%(-2.85)#12,220 |
| 83. | Rochester | 3.9% | 6.0%(-2.10)#83 | 6.8%(-2.88)#12,294 |
| 84. | Brandon | 3.8% | 6.0%(-2.16)#84 | 6.8%(-2.94)#12,453 |
| 85. | Island Pond | 3.8% | 6.0%(-2.19)#85 | 6.8%(-2.97)#12,539 |
| 86. | Marshfield | 3.8% | 6.0%(-2.20)#86 | 6.8%(-2.98)#12,581 |
| 87. | Grafton | 3.7% | 6.0%(-2.28)#87 | 6.8%(-3.06)#12,820 |
| 88. | Johnson | 3.7% | 6.0%(-2.29)#88 | 6.8%(-3.07)#12,837 |
| 89. | Norwich | 3.7% | 6.0%(-2.31)#89 | 6.8%(-3.09)#12,883 |
| 90. | Newfane | 3.5% | 6.0%(-2.48)#90 | 6.8%(-3.26)#13,374 |
| 91. | West Rutland | 3.5% | 6.0%(-2.49)#91 | 6.8%(-3.27)#13,406 |
| 92. | Enosburg Falls | 3.4% | 6.0%(-2.54)#92 | 6.8%(-3.32)#13,575 |
| 93. | Peacham | 3.2% | 6.0%(-2.81)#93 | 6.8%(-3.59)#14,406 |
| 94. | Manchester Center | 3.1% | 6.0%(-2.92)#94 | 6.8%(-3.71)#14,761 |
| 95. | New Haven | 3.1% | 6.0%(-2.93)#95 | 6.8%(-3.71)#14,779 |
| 96. | Williamstown | 3.0% | 6.0%(-3.01)#96 | 6.8%(-3.79)#14,997 |
| 97. | Rutland | 2.8% | 6.0%(-3.17)#97 | 6.8%(-3.95)#15,476 |
| 98. | East Middlebury | 2.8% | 6.0%(-3.19)#98 | 6.8%(-3.97)#15,518 |
| 99. | Morrisville | 2.7% | 6.0%(-3.29)#99 | 6.8%(-4.07)#15,870 |
| 100. | Lunenburg | 2.4% | 6.0%(-3.62)#100 | 6.8%(-4.40)#16,906 |
1
2Common Questions
What are the Top 10 Cities with the Highest Percentage of Population Employed in Computer, Engineering & Science in Vermont?
Top 10 Cities with the Highest Percentage of Population Employed in Computer, Engineering & Science in Vermont are:
#1
38.6%
#2
30.2%
#3
28.8%
#4
22.9%
#5
22.7%
#6
19.0%
#7
15.5%
#8
15.3%
#9
15.2%
#10
14.3%
What city has the Highest Percentage of Population Employed in Computer, Engineering & Science in Vermont?
Hartland has the Highest Percentage of Population Employed in Computer, Engineering & Science in Vermont with 38.6%.
What is the Percentage of Population Employed in Computer, Engineering & Science in the State of Vermont?
Percentage of Population Employed in Computer, Engineering & Science in Vermont is 6.0%.
What is the Percentage of Population Employed in Computer, Engineering & Science in the United States?
Percentage of Population Employed in Computer, Engineering & Science in the United States is 6.8%.