Cities with the Highest Percentage of Population Employed in Computer, Engineering & Science in Montana
RELATED REPORTS & OPTIONS
Computer, Engineering & Science
Montana
Compare Cities
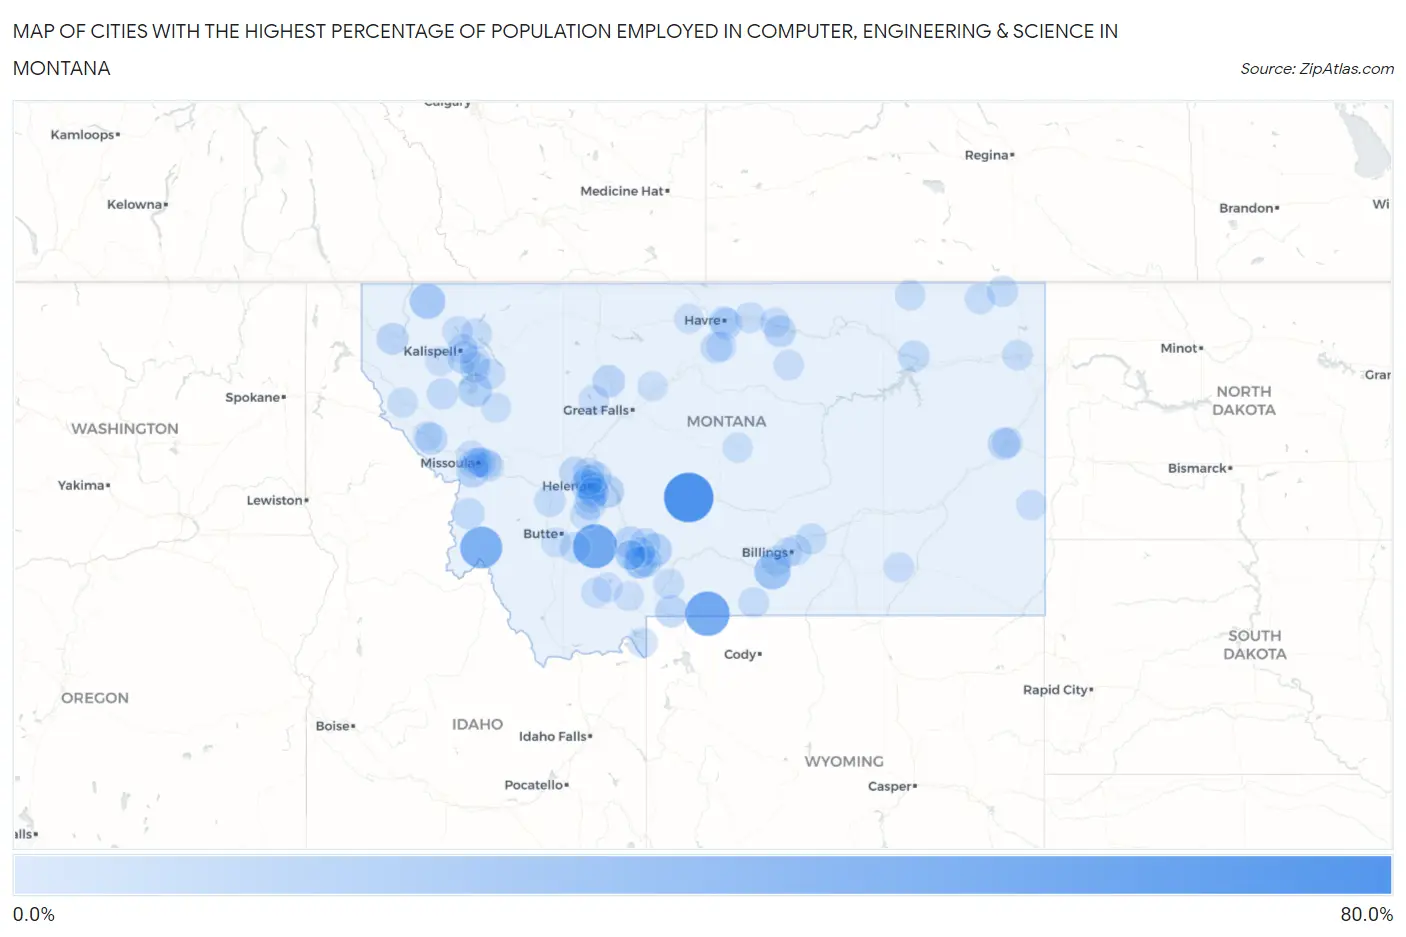
Map of Cities with the Highest Percentage of Population Employed in Computer, Engineering & Science in Montana
0.0%
80.0%
Cities with the Highest Percentage of Population Employed in Computer, Engineering & Science in Montana
| City | % Employed | vs State | vs National | |
| 1. | Martinsdale | 76.7% | 5.4%(+71.3)#1 | 6.8%(+69.9)#29 |
| 2. | Silver Gate | 56.9% | 5.4%(+51.5)#2 | 6.8%(+50.1)#47 |
| 3. | Cardwell | 55.6% | 5.4%(+50.1)#3 | 6.8%(+48.8)#52 |
| 4. | Sula | 47.8% | 5.4%(+42.4)#4 | 6.8%(+41.1)#78 |
| 5. | Canyon Creek | 45.5% | 5.4%(+40.0)#5 | 6.8%(+38.7)#90 |
| 6. | Glen | 32.4% | 5.4%(+26.9)#6 | 6.8%(+25.6)#181 |
| 7. | Maverick Mountain | 31.2% | 5.4%(+25.8)#7 | 6.8%(+24.5)#199 |
| 8. | Unionville | 29.2% | 5.4%(+23.8)#8 | 6.8%(+22.4)#235 |
| 9. | Nye | 28.1% | 5.4%(+22.7)#9 | 6.8%(+21.4)#260 |
| 10. | Silesia | 27.3% | 5.4%(+21.9)#10 | 6.8%(+20.5)#281 |
| 11. | Fortine | 24.0% | 5.4%(+18.6)#11 | 6.8%(+17.3)#363 |
| 12. | Bull Lake | 21.0% | 5.4%(+15.6)#12 | 6.8%(+14.2)#506 |
| 13. | Finley Point | 18.3% | 5.4%(+12.9)#13 | 6.8%(+11.5)#703 |
| 14. | Bridger | 17.6% | 5.4%(+12.2)#14 | 6.8%(+10.8)#766 |
| 15. | Spokane Creek | 16.0% | 5.4%(+10.6)#15 | 6.8%(+9.20)#964 |
| 16. | Cyr | 15.6% | 5.4%(+10.2)#16 | 6.8%(+8.86)#1,018 |
| 17. | Lolo | 14.6% | 5.4%(+9.21)#17 | 6.8%(+7.86)#1,214 |
| 18. | Dutton | 13.7% | 5.4%(+8.30)#18 | 6.8%(+6.94)#1,419 |
| 19. | Acton | 13.5% | 5.4%(+8.10)#19 | 6.8%(+6.75)#1,478 |
| 20. | Forest Hill Village | 13.4% | 5.4%(+8.04)#20 | 6.8%(+6.68)#1,503 |
| 21. | Jefferson City | 13.2% | 5.4%(+7.76)#21 | 6.8%(+6.41)#1,582 |
| 22. | Jardine | 12.9% | 5.4%(+7.49)#22 | 6.8%(+6.14)#1,664 |
| 23. | Gallatin River Ranch | 12.7% | 5.4%(+7.32)#23 | 6.8%(+5.96)#1,718 |
| 24. | West Glendive | 12.0% | 5.4%(+6.63)#24 | 6.8%(+5.27)#1,926 |
| 25. | King Arthur Park | 11.8% | 5.4%(+6.40)#25 | 6.8%(+5.05)#2,003 |
| 26. | Silver Star | 11.8% | 5.4%(+6.36)#26 | 6.8%(+5.00)#2,024 |
| 27. | White Haven | 11.7% | 5.4%(+6.32)#27 | 6.8%(+4.96)#2,034 |
| 28. | Riverbend | 11.6% | 5.4%(+6.21)#28 | 6.8%(+4.85)#2,065 |
| 29. | Fort Belknap Agency | 11.5% | 5.4%(+6.06)#29 | 6.8%(+4.70)#2,137 |
| 30. | Helena Valley Northwest | 11.0% | 5.4%(+5.64)#30 | 6.8%(+4.28)#2,353 |
| 31. | Marysville | 10.8% | 5.4%(+5.40)#31 | 6.8%(+4.05)#2,460 |
| 32. | Helena | 10.7% | 5.4%(+5.25)#32 | 6.8%(+3.89)#2,545 |
| 33. | Saddle Butte | 10.6% | 5.4%(+5.18)#33 | 6.8%(+3.82)#2,584 |
| 34. | Raynesford | 10.3% | 5.4%(+4.94)#34 | 6.8%(+3.58)#2,733 |
| 35. | Nashua | 10.2% | 5.4%(+4.78)#35 | 6.8%(+3.42)#2,826 |
| 36. | Four Corners | 10.1% | 5.4%(+4.73)#36 | 6.8%(+3.37)#2,858 |
| 37. | St Pierre | 10.0% | 5.4%(+4.59)#37 | 6.8%(+3.24)#2,944 |
| 38. | Pine Creek | 10.0% | 5.4%(+4.59)#38 | 6.8%(+3.24)#2,949 |
| 39. | South Hills | 9.9% | 5.4%(+4.53)#39 | 6.8%(+3.18)#2,980 |
| 40. | Springhill | 9.7% | 5.4%(+4.27)#40 | 6.8%(+2.91)#3,173 |
| 41. | Bozeman | 9.6% | 5.4%(+4.19)#41 | 6.8%(+2.84)#3,230 |
| 42. | Lonepine | 9.5% | 5.4%(+4.11)#42 | 6.8%(+2.76)#3,295 |
| 43. | Helena West Side | 9.4% | 5.4%(+4.03)#43 | 6.8%(+2.67)#3,355 |
| 44. | Hamilton | 9.4% | 5.4%(+3.96)#44 | 6.8%(+2.61)#3,418 |
| 45. | Deer Lodge | 9.1% | 5.4%(+3.66)#45 | 6.8%(+2.31)#3,654 |
| 46. | Outlook | 8.7% | 5.4%(+3.29)#46 | 6.8%(+1.93)#3,987 |
| 47. | Helena Valley Northeast | 8.7% | 5.4%(+3.26)#47 | 6.8%(+1.91)#4,003 |
| 48. | Clancy | 8.6% | 5.4%(+3.23)#48 | 6.8%(+1.87)#4,030 |
| 49. | Rader Creek | 8.5% | 5.4%(+3.14)#49 | 6.8%(+1.78)#4,125 |
| 50. | Rimrock Colony | 8.5% | 5.4%(+3.10)#50 | 6.8%(+1.75)#4,164 |
| 51. | Wise River | 8.3% | 5.4%(+2.92)#51 | 6.8%(+1.57)#4,342 |
| 52. | Helena Valley West Central | 8.2% | 5.4%(+2.74)#52 | 6.8%(+1.39)#4,531 |
| 53. | Montana City | 8.1% | 5.4%(+2.73)#53 | 6.8%(+1.38)#4,540 |
| 54. | Ballantine | 8.1% | 5.4%(+2.67)#54 | 6.8%(+1.32)#4,602 |
| 55. | Belgrade | 7.8% | 5.4%(+2.36)#55 | 6.8%(+1.000)#4,985 |
| 56. | Flaxville | 7.7% | 5.4%(+2.28)#56 | 6.8%(+0.928)#5,089 |
| 57. | Woods Bay | 7.6% | 5.4%(+2.23)#57 | 6.8%(+0.873)#5,150 |
| 58. | Wye | 7.6% | 5.4%(+2.22)#58 | 6.8%(+0.865)#5,158 |
| 59. | Bigfork | 7.6% | 5.4%(+2.16)#59 | 6.8%(+0.806)#5,218 |
| 60. | Orchard Homes | 7.4% | 5.4%(+2.02)#60 | 6.8%(+0.669)#5,367 |
| 61. | Martin City | 7.4% | 5.4%(+1.95)#61 | 6.8%(+0.597)#5,463 |
| 62. | Swan Lake | 7.3% | 5.4%(+1.88)#62 | 6.8%(+0.527)#5,545 |
| 63. | Turah | 7.3% | 5.4%(+1.87)#63 | 6.8%(+0.515)#5,563 |
| 64. | Chinook | 7.2% | 5.4%(+1.82)#64 | 6.8%(+0.463)#5,618 |
| 65. | Rockvale | 7.2% | 5.4%(+1.80)#65 | 6.8%(+0.442)#5,648 |
| 66. | Lockwood | 7.2% | 5.4%(+1.77)#66 | 6.8%(+0.415)#5,684 |
| 67. | Opheim | 7.1% | 5.4%(+1.73)#67 | 6.8%(+0.378)#5,751 |
| 68. | Glendive | 7.1% | 5.4%(+1.66)#68 | 6.8%(+0.308)#5,853 |
| 69. | Laurel | 7.0% | 5.4%(+1.59)#69 | 6.8%(+0.236)#5,953 |
| 70. | Bearcreek | 6.9% | 5.4%(+1.49)#70 | 6.8%(+0.132)#6,112 |
| 71. | Pray | 6.9% | 5.4%(+1.47)#71 | 6.8%(+0.117)#6,140 |
| 72. | Piltzville | 6.9% | 5.4%(+1.47)#72 | 6.8%(+0.116)#6,142 |
| 73. | Culbertson | 6.7% | 5.4%(+1.32)#73 | 6.8%(-0.040)#6,364 |
| 74. | Fairfield | 6.6% | 5.4%(+1.18)#74 | 6.8%(-0.178)#6,568 |
| 75. | Thompson Falls | 6.6% | 5.4%(+1.17)#75 | 6.8%(-0.184)#6,577 |
| 76. | Virginia City | 6.6% | 5.4%(+1.15)#76 | 6.8%(-0.207)#6,607 |
| 77. | Missoula | 6.5% | 5.4%(+1.06)#77 | 6.8%(-0.296)#6,755 |
| 78. | East Missoula | 6.3% | 5.4%(+0.899)#78 | 6.8%(-0.457)#7,029 |
| 79. | Whitefish | 6.3% | 5.4%(+0.887)#79 | 6.8%(-0.468)#7,047 |
| 80. | Baker | 6.2% | 5.4%(+0.806)#80 | 6.8%(-0.550)#7,178 |
| 81. | Evergreen | 6.2% | 5.4%(+0.758)#81 | 6.8%(-0.597)#7,268 |
| 82. | Lame Deer | 6.0% | 5.4%(+0.623)#82 | 6.8%(-0.732)#7,529 |
| 83. | Lodge Pole | 6.0% | 5.4%(+0.561)#83 | 6.8%(-0.795)#7,649 |
| 84. | Lewistown | 5.7% | 5.4%(+0.290)#84 | 6.8%(-1.07)#8,177 |
| 85. | Condon | 5.7% | 5.4%(+0.273)#85 | 6.8%(-1.08)#8,200 |
| 86. | Harlem | 5.6% | 5.4%(+0.185)#86 | 6.8%(-1.17)#8,345 |
| 87. | West Yellowstone | 5.6% | 5.4%(+0.155)#87 | 6.8%(-1.20)#8,396 |
| 88. | Parker School | 5.6% | 5.4%(+0.147)#88 | 6.8%(-1.21)#8,407 |
| 89. | Havre | 5.4% | 5.4%(-0.007)#89 | 6.8%(-1.36)#8,734 |
| 90. | Butte Silver Bow Balance | 5.3% | 5.4%(-0.080)#90 | 6.8%(-1.44)#8,881 |
| 91. | Ennis | 5.3% | 5.4%(-0.146)#91 | 6.8%(-1.50)#9,002 |
| 92. | Billings | 5.2% | 5.4%(-0.238)#92 | 6.8%(-1.59)#9,194 |
| 93. | Gildford | 5.1% | 5.4%(-0.324)#93 | 6.8%(-1.68)#9,378 |
| 94. | Churchill | 5.0% | 5.4%(-0.390)#94 | 6.8%(-1.75)#9,522 |
| 95. | Big Sky | 5.0% | 5.4%(-0.404)#95 | 6.8%(-1.76)#9,552 |
| 96. | Amsterdam | 5.0% | 5.4%(-0.409)#96 | 6.8%(-1.76)#9,587 |
| 97. | Carter | 5.0% | 5.4%(-0.409)#97 | 6.8%(-1.76)#9,593 |
| 98. | Boulder | 4.9% | 5.4%(-0.522)#98 | 6.8%(-1.88)#9,817 |
| 99. | Superior | 4.9% | 5.4%(-0.531)#99 | 6.8%(-1.89)#9,836 |
| 100. | Marion | 4.8% | 5.4%(-0.562)#100 | 6.8%(-1.92)#9,901 |
Common Questions
What are the Top 10 Cities with the Highest Percentage of Population Employed in Computer, Engineering & Science in Montana?
Top 10 Cities with the Highest Percentage of Population Employed in Computer, Engineering & Science in Montana are:
#1
76.7%
#2
56.9%
#3
55.6%
#4
47.8%
#5
27.3%
#6
24.0%
#7
18.3%
#8
17.6%
#9
16.0%
#10
14.6%
What city has the Highest Percentage of Population Employed in Computer, Engineering & Science in Montana?
Martinsdale has the Highest Percentage of Population Employed in Computer, Engineering & Science in Montana with 76.7%.
What is the Percentage of Population Employed in Computer, Engineering & Science in the State of Montana?
Percentage of Population Employed in Computer, Engineering & Science in Montana is 5.4%.
What is the Percentage of Population Employed in Computer, Engineering & Science in the United States?
Percentage of Population Employed in Computer, Engineering & Science in the United States is 6.8%.