Zip Codes with the Highest Percentage of Population Employed in Computer, Engineering & Science in Santa Clarita, CA
RELATED REPORTS & OPTIONS
Computer, Engineering & Science
Santa Clarita
Compare Zip Codes
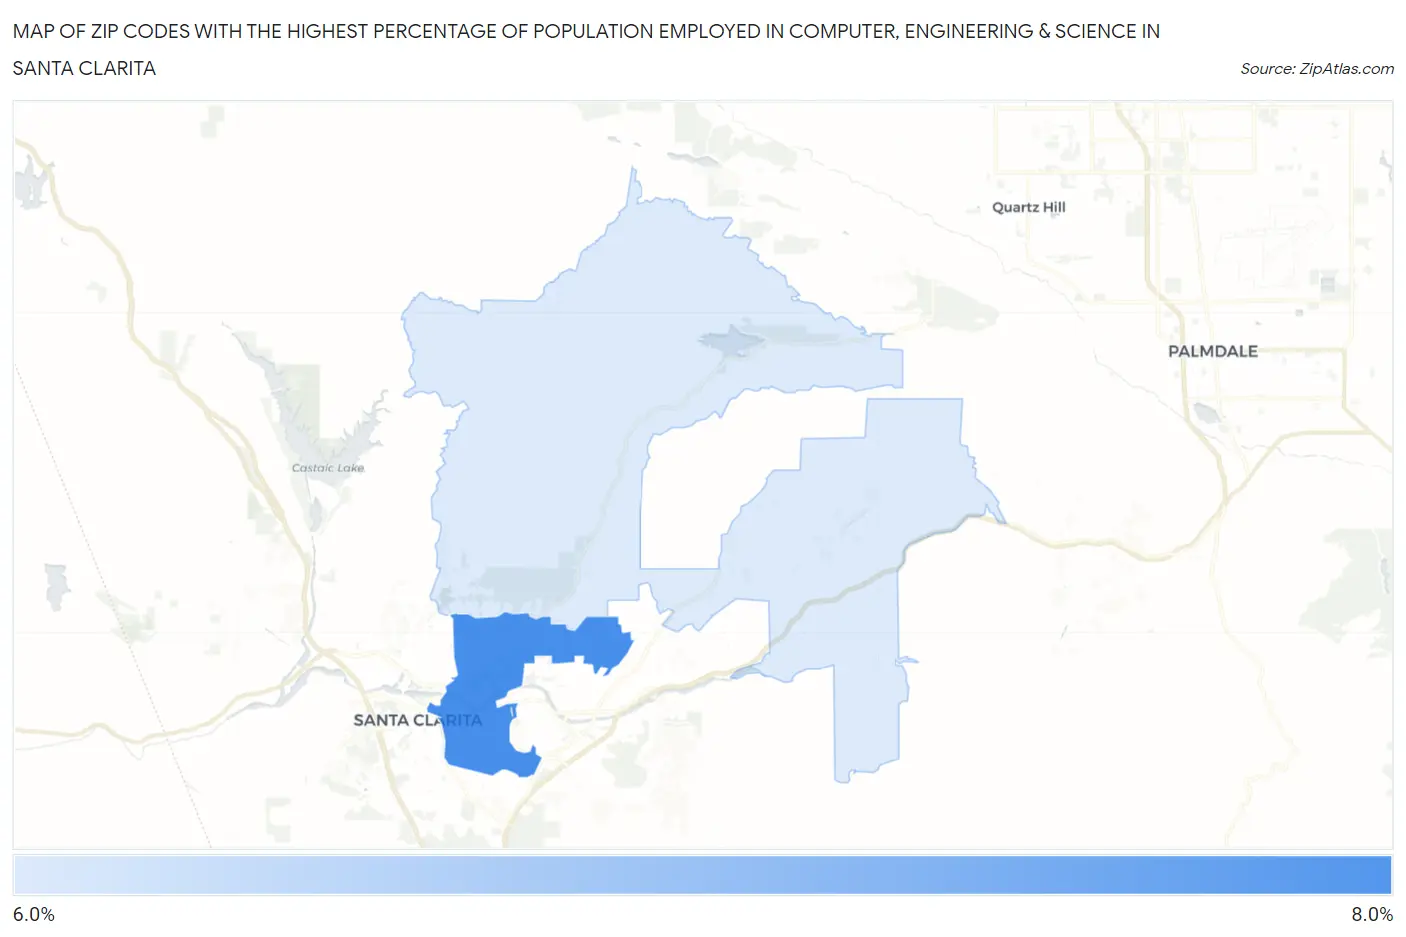
Map of Zip Codes with the Highest Percentage of Population Employed in Computer, Engineering & Science in Santa Clarita
6.7%
7.0%
Zip Codes with the Highest Percentage of Population Employed in Computer, Engineering & Science in Santa Clarita, CA
| Zip Code | % Employed | vs State | vs National | |
| 1. | 91350 | 7.0% | 8.0%(-0.978)#619 | 6.8%(+0.221)#6,821 |
| 2. | 91390 | 6.7% | 8.0%(-1.31)#650 | 6.8%(-0.113)#7,450 |
1
Common Questions
What are the Top Zip Codes with the Highest Percentage of Population Employed in Computer, Engineering & Science in Santa Clarita, CA?
Top Zip Codes with the Highest Percentage of Population Employed in Computer, Engineering & Science in Santa Clarita, CA are:
What zip code has the Highest Percentage of Population Employed in Computer, Engineering & Science in Santa Clarita, CA?
91350 has the Highest Percentage of Population Employed in Computer, Engineering & Science in Santa Clarita, CA with 7.0%.
What is the Percentage of Population Employed in Computer, Engineering & Science in Santa Clarita, CA?
Percentage of Population Employed in Computer, Engineering & Science in Santa Clarita is 7.0%.
What is the Percentage of Population Employed in Computer, Engineering & Science in California?
Percentage of Population Employed in Computer, Engineering & Science in California is 8.0%.
What is the Percentage of Population Employed in Computer, Engineering & Science in the United States?
Percentage of Population Employed in Computer, Engineering & Science in the United States is 6.8%.