Cities with the Highest Percentage of Population Employed in Computer, Engineering & Science in South Dakota
RELATED REPORTS & OPTIONS
Computer, Engineering & Science
South Dakota
Compare Cities
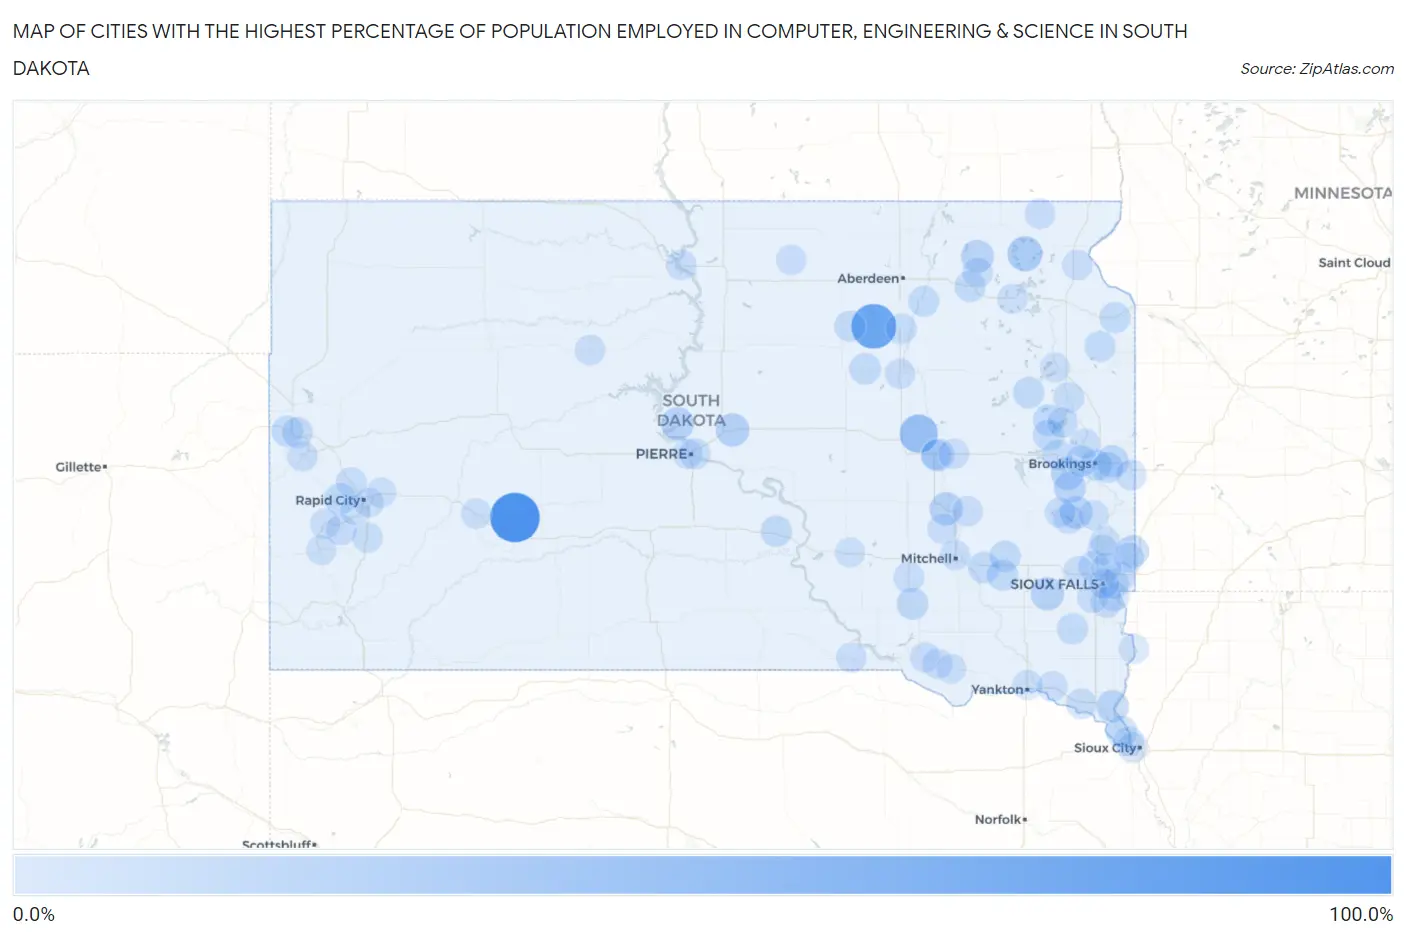
Map of Cities with the Highest Percentage of Population Employed in Computer, Engineering & Science in South Dakota
0.0%
100.0%
Cities with the Highest Percentage of Population Employed in Computer, Engineering & Science in South Dakota
| City | % Employed | vs State | vs National | |
| 1. | Cottonwood | 100.0% | 4.8%(+95.2)#1 | 6.8%(+93.2)#8 |
| 2. | Chelsea | 75.7% | 4.8%(+70.9)#2 | 6.8%(+68.9)#30 |
| 3. | Broadland | 42.9% | 4.8%(+38.1)#3 | 6.8%(+36.1)#102 |
| 4. | Eden | 26.8% | 4.8%(+22.1)#4 | 6.8%(+20.1)#290 |
| 5. | Wonderland Homes | 21.0% | 4.8%(+16.3)#5 | 6.8%(+14.3)#503 |
| 6. | Oahe Acres | 19.7% | 4.8%(+15.0)#6 | 6.8%(+13.0)#570 |
| 7. | Blunt | 19.7% | 4.8%(+14.9)#7 | 6.8%(+12.9)#575 |
| 8. | Monroe | 19.1% | 4.8%(+14.3)#8 | 6.8%(+12.3)#623 |
| 9. | Forestburg | 18.5% | 4.8%(+13.8)#9 | 6.8%(+11.8)#677 |
| 10. | Cow Creek | 17.9% | 4.8%(+13.1)#10 | 6.8%(+11.1)#743 |
| 11. | Morningside | 17.2% | 4.8%(+12.4)#11 | 6.8%(+10.4)#810 |
| 12. | Sinai | 16.9% | 4.8%(+12.1)#12 | 6.8%(+10.1)#850 |
| 13. | Langford | 16.4% | 4.8%(+11.6)#13 | 6.8%(+9.61)#912 |
| 14. | Wentworth | 16.1% | 4.8%(+11.4)#14 | 6.8%(+9.36)#945 |
| 15. | Richland | 14.6% | 4.8%(+9.82)#15 | 6.8%(+7.82)#1,221 |
| 16. | Enemy Swim | 14.3% | 4.8%(+9.52)#16 | 6.8%(+7.52)#1,267 |
| 17. | Sherman | 14.3% | 4.8%(+9.52)#17 | 6.8%(+7.52)#1,276 |
| 18. | Nunda | 14.3% | 4.8%(+9.52)#18 | 6.8%(+7.52)#1,278 |
| 19. | Bushnell | 13.3% | 4.8%(+8.57)#19 | 6.8%(+6.57)#1,540 |
| 20. | Corsica | 11.9% | 4.8%(+7.10)#20 | 6.8%(+5.10)#1,988 |
| 21. | Hazel | 11.3% | 4.8%(+6.53)#21 | 6.8%(+4.53)#2,222 |
| 22. | Johnson Siding | 11.3% | 4.8%(+6.49)#22 | 6.8%(+4.49)#2,243 |
| 23. | Brookings | 11.2% | 4.8%(+6.48)#23 | 6.8%(+4.48)#2,244 |
| 24. | Rockham | 11.1% | 4.8%(+6.35)#24 | 6.8%(+4.35)#2,325 |
| 25. | Alexandria | 11.0% | 4.8%(+6.25)#25 | 6.8%(+4.25)#2,369 |
| 26. | Jefferson | 10.8% | 4.8%(+6.02)#26 | 6.8%(+4.02)#2,474 |
| 27. | Lake Norden | 10.5% | 4.8%(+5.78)#27 | 6.8%(+3.78)#2,614 |
| 28. | Volga | 10.4% | 4.8%(+5.59)#28 | 6.8%(+3.59)#2,727 |
| 29. | Badger | 10.3% | 4.8%(+5.49)#29 | 6.8%(+3.49)#2,783 |
| 30. | Spencer | 10.3% | 4.8%(+5.49)#31 | 6.8%(+3.49)#2,785 |
| 31. | Reliance | 10.3% | 4.8%(+5.49)#32 | 6.8%(+3.49)#2,786 |
| 32. | North Spearfish | 10.1% | 4.8%(+5.31)#33 | 6.8%(+3.31)#2,901 |
| 33. | Emery | 9.8% | 4.8%(+5.05)#34 | 6.8%(+3.05)#3,059 |
| 34. | Andover | 9.5% | 4.8%(+4.76)#35 | 6.8%(+2.76)#3,297 |
| 35. | Cresbard | 9.3% | 4.8%(+4.54)#36 | 6.8%(+2.54)#3,465 |
| 36. | Davis | 9.3% | 4.8%(+4.54)#37 | 6.8%(+2.54)#3,466 |
| 37. | Milbank | 9.2% | 4.8%(+4.45)#38 | 6.8%(+2.45)#3,535 |
| 38. | Aurora | 8.8% | 4.8%(+4.02)#39 | 6.8%(+2.02)#3,911 |
| 39. | Strandburg | 8.6% | 4.8%(+3.81)#40 | 6.8%(+1.81)#4,105 |
| 40. | Crooks | 8.4% | 4.8%(+3.62)#41 | 6.8%(+1.62)#4,285 |
| 41. | Stratford | 8.1% | 4.8%(+3.34)#42 | 6.8%(+1.34)#4,576 |
| 42. | Arlington | 8.0% | 4.8%(+3.22)#43 | 6.8%(+1.22)#4,732 |
| 43. | Pierre | 7.9% | 4.8%(+3.09)#44 | 6.8%(+1.09)#4,875 |
| 44. | Harrisburg | 7.6% | 4.8%(+2.87)#45 | 6.8%(+0.872)#5,152 |
| 45. | Mellette | 7.6% | 4.8%(+2.83)#46 | 6.8%(+0.830)#5,200 |
| 46. | Tea | 7.5% | 4.8%(+2.72)#47 | 6.8%(+0.722)#5,312 |
| 47. | Stickney | 7.5% | 4.8%(+2.71)#48 | 6.8%(+0.712)#5,324 |
| 48. | Castlewood | 7.4% | 4.8%(+2.63)#49 | 6.8%(+0.633)#5,415 |
| 49. | Summerset | 7.3% | 4.8%(+2.55)#50 | 6.8%(+0.552)#5,519 |
| 50. | Keystone | 7.0% | 4.8%(+2.21)#51 | 6.8%(+0.212)#5,986 |
| 51. | Spearfish | 6.9% | 4.8%(+2.18)#52 | 6.8%(+0.180)#6,028 |
| 52. | Vermillion | 6.7% | 4.8%(+1.96)#53 | 6.8%(-0.037)#6,359 |
| 53. | Elkton | 6.7% | 4.8%(+1.90)#54 | 6.8%(-0.098)#6,448 |
| 54. | Veblen | 6.4% | 4.8%(+1.67)#55 | 6.8%(-0.332)#6,808 |
| 55. | Pine Lakes Addition | 6.3% | 4.8%(+1.56)#56 | 6.8%(-0.443)#7,007 |
| 56. | Lake Poinsett | 6.2% | 4.8%(+1.49)#57 | 6.8%(-0.515)#7,122 |
| 57. | Baltic | 6.2% | 4.8%(+1.45)#58 | 6.8%(-0.555)#7,192 |
| 58. | Hartford | 6.2% | 4.8%(+1.43)#59 | 6.8%(-0.574)#7,227 |
| 59. | Dante | 6.2% | 4.8%(+1.39)#60 | 6.8%(-0.611)#7,300 |
| 60. | Shindler | 6.1% | 4.8%(+1.31)#61 | 6.8%(-0.686)#7,421 |
| 61. | Brandon | 6.0% | 4.8%(+1.28)#62 | 6.8%(-0.717)#7,501 |
| 62. | Peever | 6.0% | 4.8%(+1.24)#63 | 6.8%(-0.765)#7,596 |
| 63. | Lake Madison | 6.0% | 4.8%(+1.23)#64 | 6.8%(-0.774)#7,611 |
| 64. | Madison | 5.9% | 4.8%(+1.13)#65 | 6.8%(-0.868)#7,782 |
| 65. | Sioux Falls | 5.9% | 4.8%(+1.13)#66 | 6.8%(-0.871)#7,787 |
| 66. | Hermosa | 5.9% | 4.8%(+1.09)#67 | 6.8%(-0.914)#7,897 |
| 67. | Letcher | 5.8% | 4.8%(+1.05)#68 | 6.8%(-0.951)#7,967 |
| 68. | Artesian | 5.8% | 4.8%(+1.00)#69 | 6.8%(-0.995)#8,046 |
| 69. | Mobridge | 5.7% | 4.8%(+0.954)#70 | 6.8%(-1.05)#8,135 |
| 70. | Garretson | 5.6% | 4.8%(+0.872)#71 | 6.8%(-1.13)#8,277 |
| 71. | Bonesteel | 5.6% | 4.8%(+0.854)#72 | 6.8%(-1.15)#8,306 |
| 72. | Cavour | 5.6% | 4.8%(+0.791)#73 | 6.8%(-1.21)#8,414 |
| 73. | Pierpont | 5.6% | 4.8%(+0.791)#74 | 6.8%(-1.21)#8,419 |
| 74. | Bruce | 5.5% | 4.8%(+0.748)#75 | 6.8%(-1.25)#8,505 |
| 75. | Lead | 5.5% | 4.8%(+0.698)#76 | 6.8%(-1.30)#8,605 |
| 76. | Hosmer | 5.4% | 4.8%(+0.612)#77 | 6.8%(-1.39)#8,793 |
| 77. | Wall | 5.4% | 4.8%(+0.587)#78 | 6.8%(-1.41)#8,852 |
| 78. | North Eagle Butte | 5.3% | 4.8%(+0.542)#79 | 6.8%(-1.46)#8,919 |
| 79. | Dakota Dunes | 5.3% | 4.8%(+0.534)#80 | 6.8%(-1.47)#8,935 |
| 80. | Redfield | 5.1% | 4.8%(+0.369)#81 | 6.8%(-1.63)#9,269 |
| 81. | Hill City | 5.1% | 4.8%(+0.330)#82 | 6.8%(-1.67)#9,356 |
| 82. | Mitchell | 5.1% | 4.8%(+0.303)#83 | 6.8%(-1.70)#9,418 |
| 83. | Gayville | 5.1% | 4.8%(+0.294)#84 | 6.8%(-1.71)#9,437 |
| 84. | Wagner | 5.0% | 4.8%(+0.204)#85 | 6.8%(-1.80)#9,657 |
| 85. | North Sioux City | 4.9% | 4.8%(+0.165)#86 | 6.8%(-1.84)#9,729 |
| 86. | Yankton | 4.9% | 4.8%(+0.128)#87 | 6.8%(-1.87)#9,805 |
| 87. | Renner Corner | 4.9% | 4.8%(+0.090)#88 | 6.8%(-1.91)#9,894 |
| 88. | Webster | 4.8% | 4.8%(+0.078)#89 | 6.8%(-1.92)#9,911 |
| 89. | Fort Pierre | 4.8% | 4.8%(+0.007)#90 | 6.8%(-1.99)#10,078 |
| 90. | Dell Rapids | 4.7% | 4.8%(-0.031)#91 | 6.8%(-2.03)#10,158 |
| 91. | Hudson | 4.7% | 4.8%(-0.063)#92 | 6.8%(-2.06)#10,231 |
| 92. | Watertown | 4.7% | 4.8%(-0.113)#93 | 6.8%(-2.11)#10,345 |
| 93. | Kimball | 4.6% | 4.8%(-0.204)#94 | 6.8%(-2.20)#10,552 |
| 94. | Box Elder | 4.5% | 4.8%(-0.255)#95 | 6.8%(-2.26)#10,681 |
| 95. | Colonial Pine Hills | 4.5% | 4.8%(-0.277)#96 | 6.8%(-2.28)#10,728 |
| 96. | Colman | 4.4% | 4.8%(-0.342)#97 | 6.8%(-2.34)#10,879 |
| 97. | Avon | 4.4% | 4.8%(-0.369)#98 | 6.8%(-2.37)#10,942 |
| 98. | Rapid City | 4.3% | 4.8%(-0.444)#99 | 6.8%(-2.44)#11,123 |
| 99. | Custer | 4.2% | 4.8%(-0.570)#100 | 6.8%(-2.57)#11,470 |
| 100. | Huron | 4.1% | 4.8%(-0.651)#101 | 6.8%(-2.65)#11,671 |
Common Questions
What are the Top 10 Cities with the Highest Percentage of Population Employed in Computer, Engineering & Science in South Dakota?
Top 10 Cities with the Highest Percentage of Population Employed in Computer, Engineering & Science in South Dakota are:
#1
100.0%
#2
75.7%
#3
42.9%
#4
26.8%
#5
19.7%
#6
19.1%
#7
18.5%
#8
17.9%
#9
17.2%
#10
16.9%
What city has the Highest Percentage of Population Employed in Computer, Engineering & Science in South Dakota?
Cottonwood has the Highest Percentage of Population Employed in Computer, Engineering & Science in South Dakota with 100.0%.
What is the Percentage of Population Employed in Computer, Engineering & Science in the State of South Dakota?
Percentage of Population Employed in Computer, Engineering & Science in South Dakota is 4.8%.
What is the Percentage of Population Employed in Computer, Engineering & Science in the United States?
Percentage of Population Employed in Computer, Engineering & Science in the United States is 6.8%.