Big Lagoon, CA Map & Demographics
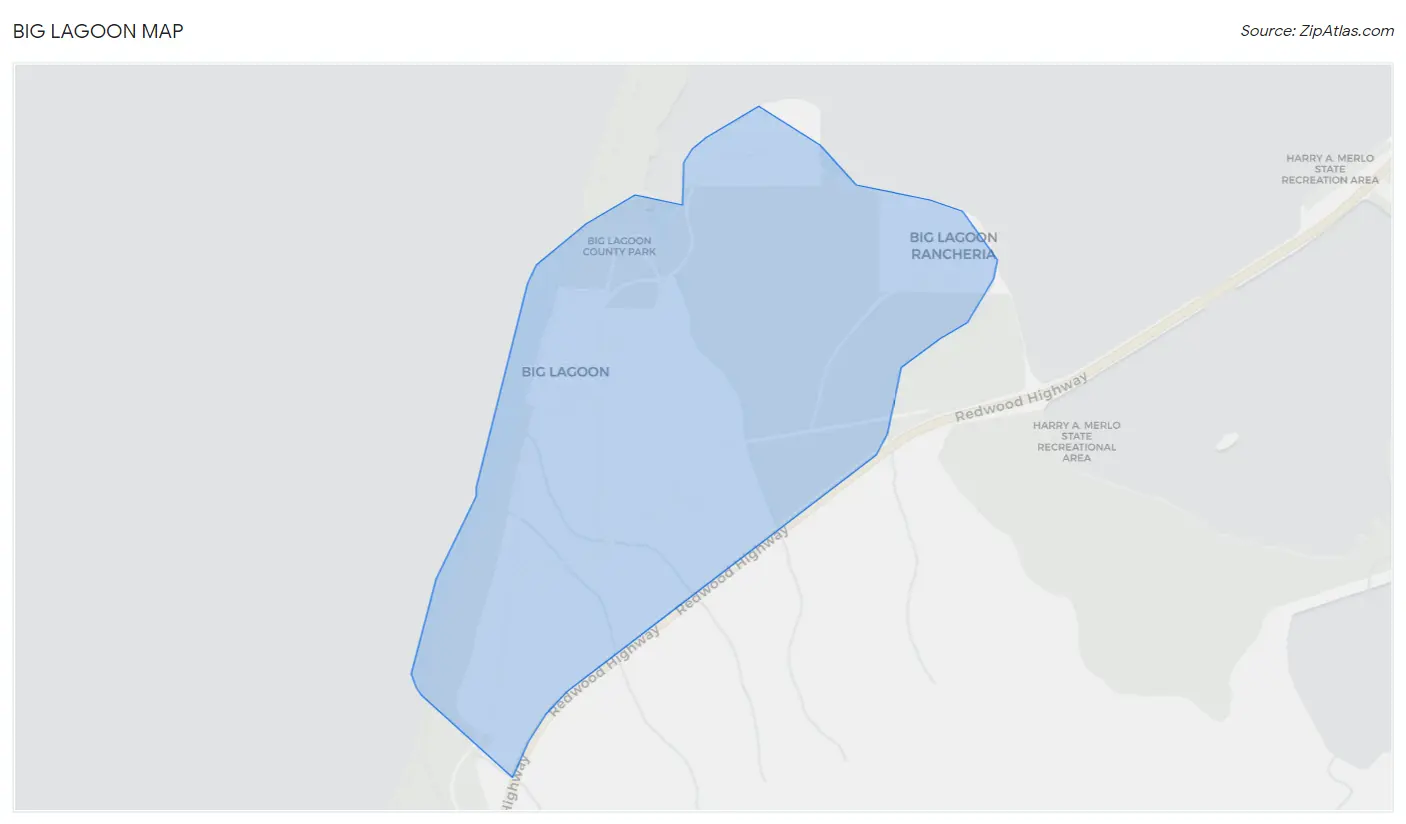
Big Lagoon Map
Big Lagoon Overview
$50,547
PER CAPITA INCOME
0.37
INEQUALITY / GINI INDEX
104
TOTAL POPULATION
43
MALE POPULATION
61
FEMALE POPULATION
70.49
MALES / 100 FEMALES
141.86
FEMALES / 100 MALES
61.6
MEDIAN AGE
2.4
AVG FAMILY SIZE
1.6
AVG HOUSEHOLD SIZE
37
LABOR FORCE [ PEOPLE ]
35.6%
PERCENT IN LABOR FORCE
Income in Big Lagoon
Income Overview in Big Lagoon
| Characteristic | Number | Measure |
| Per Capita Income | 104 | $50,547 |
| Median Family Income | 18 | $0 |
| Mean Family Income | 18 | $89,806 |
| Median Household Income | 65 | $0 |
| Mean Household Income | 65 | $78,978 |
| Income Deficit | 18 | $0 |
| Wage / Income Gap (%) | 104 | 0.00% |
| Wage / Income Gap ($) | 104 | 100.00¢ per $1 |
| Gini / Inequality Index | 104 | 0.37 |
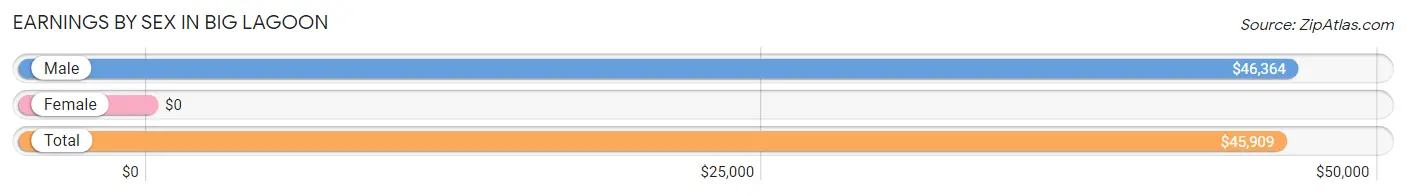
Earnings by Sex in Big Lagoon
| Sex | Number | Average Earnings |
| Male | 18 (45.0%) | $46,364 |
| Female | 22 (55.0%) | $0 |
| Total | 40 (100.0%) | $45,909 |
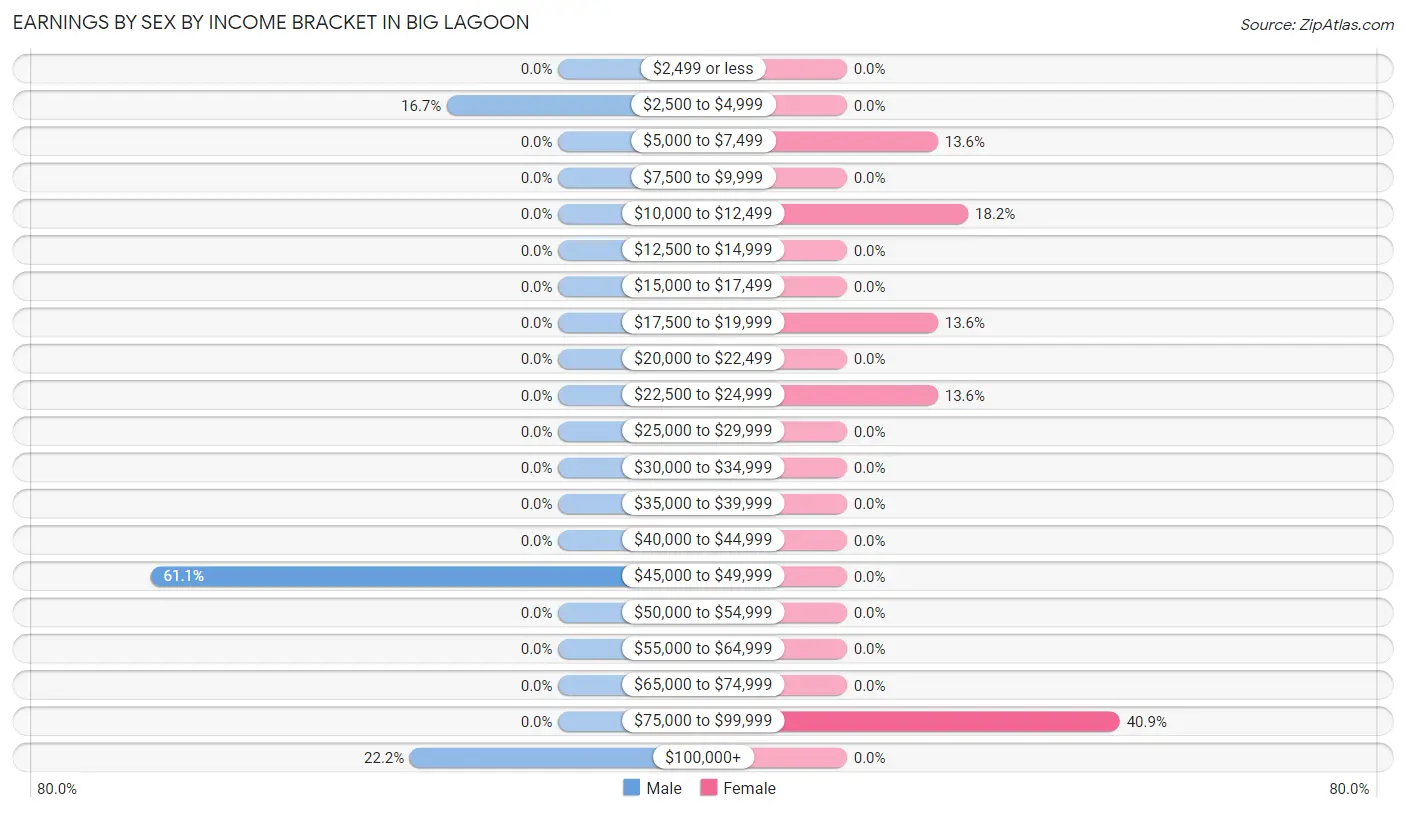
Earnings by Sex by Income Bracket in Big Lagoon
The most common earnings brackets in Big Lagoon are $45,000 to $49,999 for men (11 | 61.1%) and $75,000 to $99,999 for women (9 | 40.9%).
| Income | Male | Female |
| $2,499 or less | 0 (0.0%) | 0 (0.0%) |
| $2,500 to $4,999 | 3 (16.7%) | 0 (0.0%) |
| $5,000 to $7,499 | 0 (0.0%) | 3 (13.6%) |
| $7,500 to $9,999 | 0 (0.0%) | 0 (0.0%) |
| $10,000 to $12,499 | 0 (0.0%) | 4 (18.2%) |
| $12,500 to $14,999 | 0 (0.0%) | 0 (0.0%) |
| $15,000 to $17,499 | 0 (0.0%) | 0 (0.0%) |
| $17,500 to $19,999 | 0 (0.0%) | 3 (13.6%) |
| $20,000 to $22,499 | 0 (0.0%) | 0 (0.0%) |
| $22,500 to $24,999 | 0 (0.0%) | 3 (13.6%) |
| $25,000 to $29,999 | 0 (0.0%) | 0 (0.0%) |
| $30,000 to $34,999 | 0 (0.0%) | 0 (0.0%) |
| $35,000 to $39,999 | 0 (0.0%) | 0 (0.0%) |
| $40,000 to $44,999 | 0 (0.0%) | 0 (0.0%) |
| $45,000 to $49,999 | 11 (61.1%) | 0 (0.0%) |
| $50,000 to $54,999 | 0 (0.0%) | 0 (0.0%) |
| $55,000 to $64,999 | 0 (0.0%) | 0 (0.0%) |
| $65,000 to $74,999 | 0 (0.0%) | 0 (0.0%) |
| $75,000 to $99,999 | 0 (0.0%) | 9 (40.9%) |
| $100,000+ | 4 (22.2%) | 0 (0.0%) |
| Total | 18 (100.0%) | 22 (100.0%) |
Earnings by Sex by Educational Attainment in Big Lagoon
| Educational Attainment | Male Income | Female Income |
| Less than High School | - | - |
| High School Diploma | - | - |
| College or Associate's Degree | - | - |
| Bachelor's Degree | - | - |
| Graduate Degree | - | - |
| Total | $46,364 | $0 |
Family Income in Big Lagoon
Family Income Brackets in Big Lagoon
According to the Big Lagoon family income data, there are 4 families falling into the $100,000 to $149,999 income range, which is the most common income bracket and makes up 22.2% of all families.
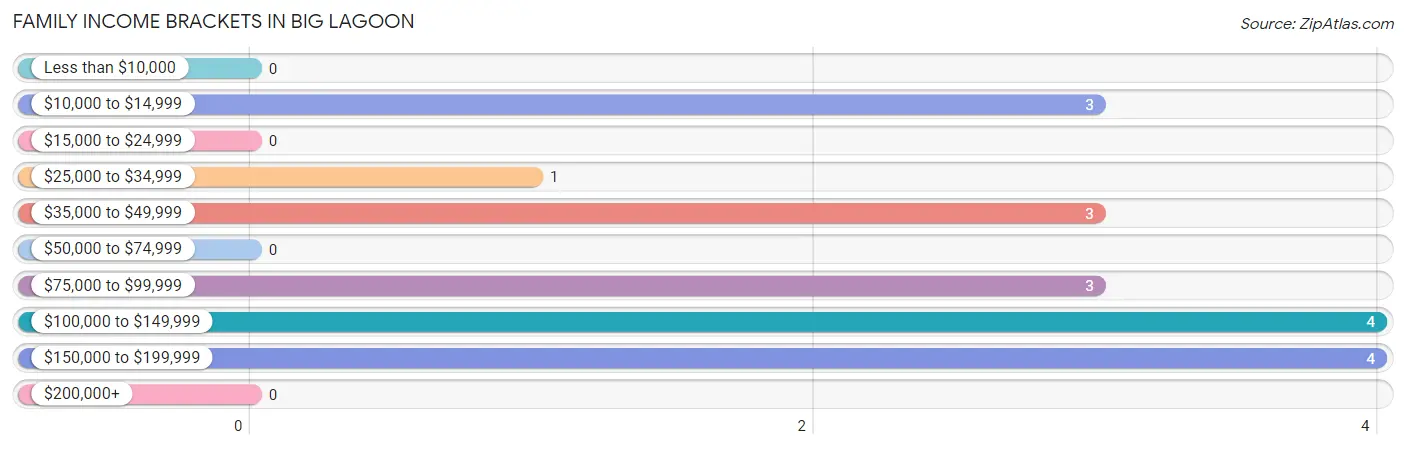
| Income Bracket | # Families | % Families |
| Less than $10,000 | 0 | 0.0% |
| $10,000 to $14,999 | 3 | 16.7% |
| $15,000 to $24,999 | 0 | 0.0% |
| $25,000 to $34,999 | 1 | 5.6% |
| $35,000 to $49,999 | 3 | 16.7% |
| $50,000 to $74,999 | 0 | 0.0% |
| $75,000 to $99,999 | 3 | 16.7% |
| $100,000 to $149,999 | 4 | 22.2% |
| $150,000 to $199,999 | 4 | 22.2% |
| $200,000+ | 0 | 0.0% |
Family Income by Famaliy Size in Big Lagoon
2-person families (12 | 66.7%) account for the highest median family income in Big Lagoon with $128,750 per family, while 2-person families (12 | 66.7%) have the highest median income of $64,375 per family member.
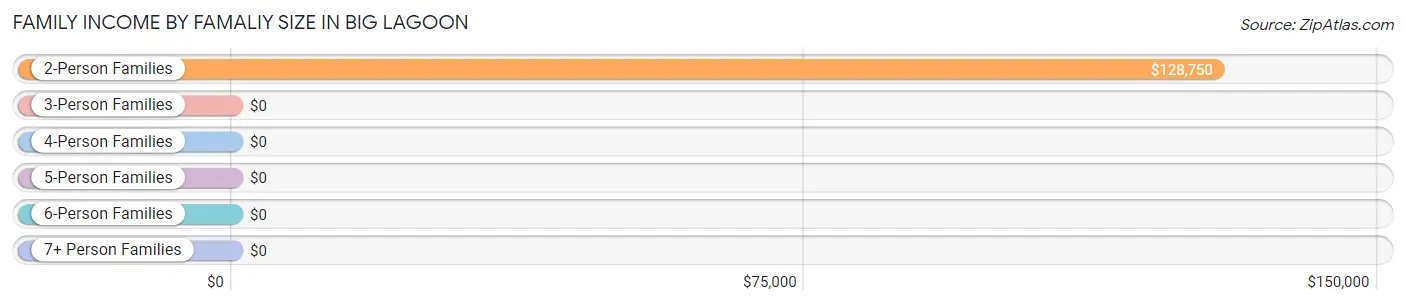
| Income Bracket | # Families | Median Income |
| 2-Person Families | 12 (66.7%) | $128,750 |
| 3-Person Families | 6 (33.3%) | $0 |
| 4-Person Families | 0 (0.0%) | $0 |
| 5-Person Families | 0 (0.0%) | $0 |
| 6-Person Families | 0 (0.0%) | $0 |
| 7+ Person Families | 0 (0.0%) | $0 |
| Total | 18 (100.0%) | $0 |
Family Income by Number of Earners in Big Lagoon
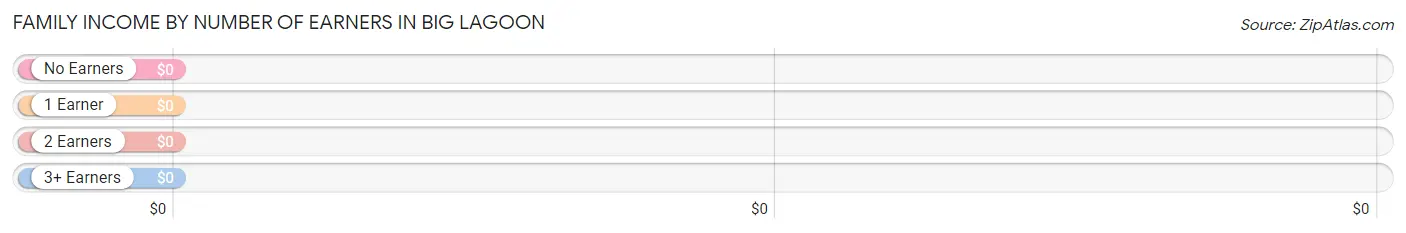
| Number of Earners | # Families | Median Income |
| No Earners | 11 (61.1%) | $0 |
| 1 Earner | 3 (16.7%) | $0 |
| 2 Earners | 4 (22.2%) | $0 |
| 3+ Earners | 0 (0.0%) | $0 |
| Total | 18 (100.0%) | $0 |
Household Income in Big Lagoon
Household Income Brackets in Big Lagoon
With 20 households falling in the category, the $100,000 to $149,999 income range is the most frequent in Big Lagoon, accounting for 30.8% of all households.
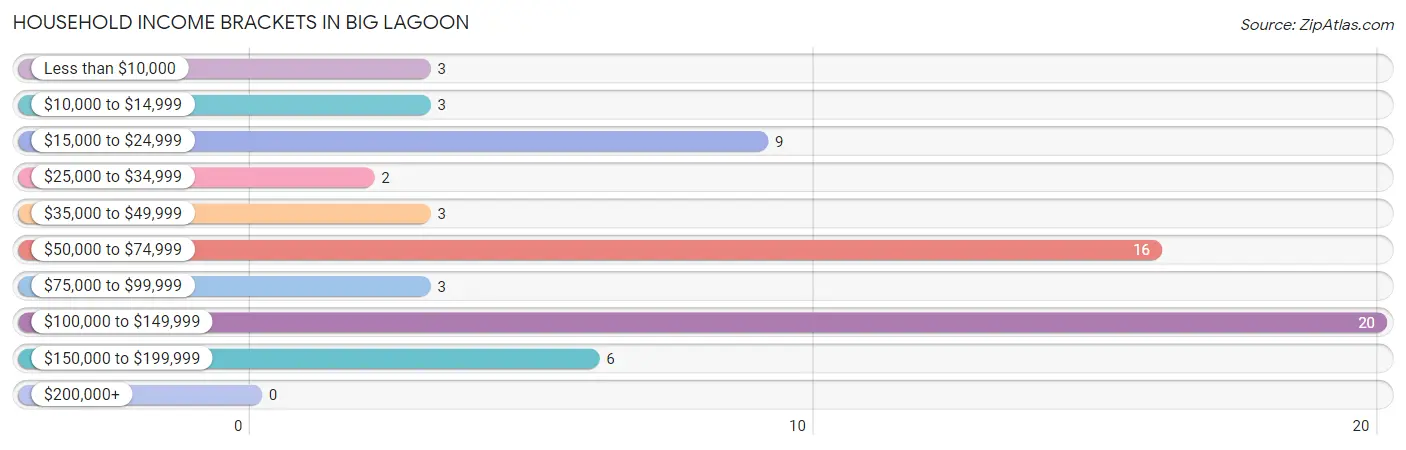
| Income Bracket | # Households | % Households |
| Less than $10,000 | 3 | 4.6% |
| $10,000 to $14,999 | 3 | 4.6% |
| $15,000 to $24,999 | 9 | 13.8% |
| $25,000 to $34,999 | 2 | 3.1% |
| $35,000 to $49,999 | 3 | 4.6% |
| $50,000 to $74,999 | 16 | 24.6% |
| $75,000 to $99,999 | 3 | 4.6% |
| $100,000 to $149,999 | 20 | 30.8% |
| $150,000 to $199,999 | 6 | 9.2% |
| $200,000+ | 0 | 0.0% |
Household Income by Householder Age in Big Lagoon
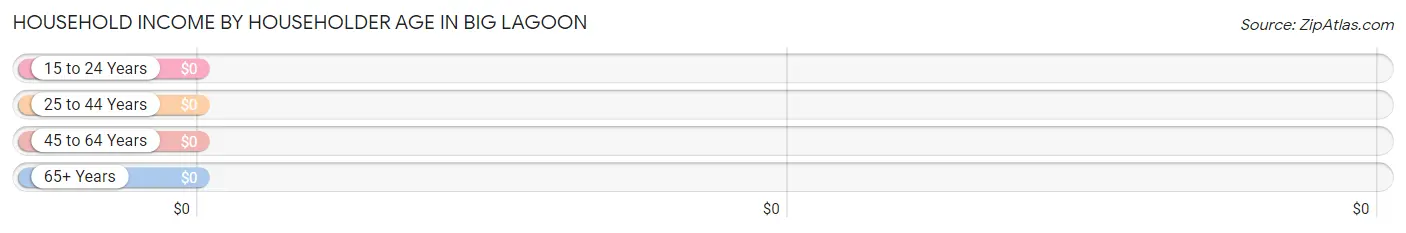
| Income Bracket | # Households | Median Income |
| 15 to 24 Years | 0 (0.0%) | $0 |
| 25 to 44 Years | 4 (6.1%) | $0 |
| 45 to 64 Years | 26 (40.0%) | $0 |
| 65+ Years | 35 (53.8%) | $0 |
| Total | 65 (100.0%) | $0 |
Poverty in Big Lagoon
Income Below Poverty by Sex and Age in Big Lagoon
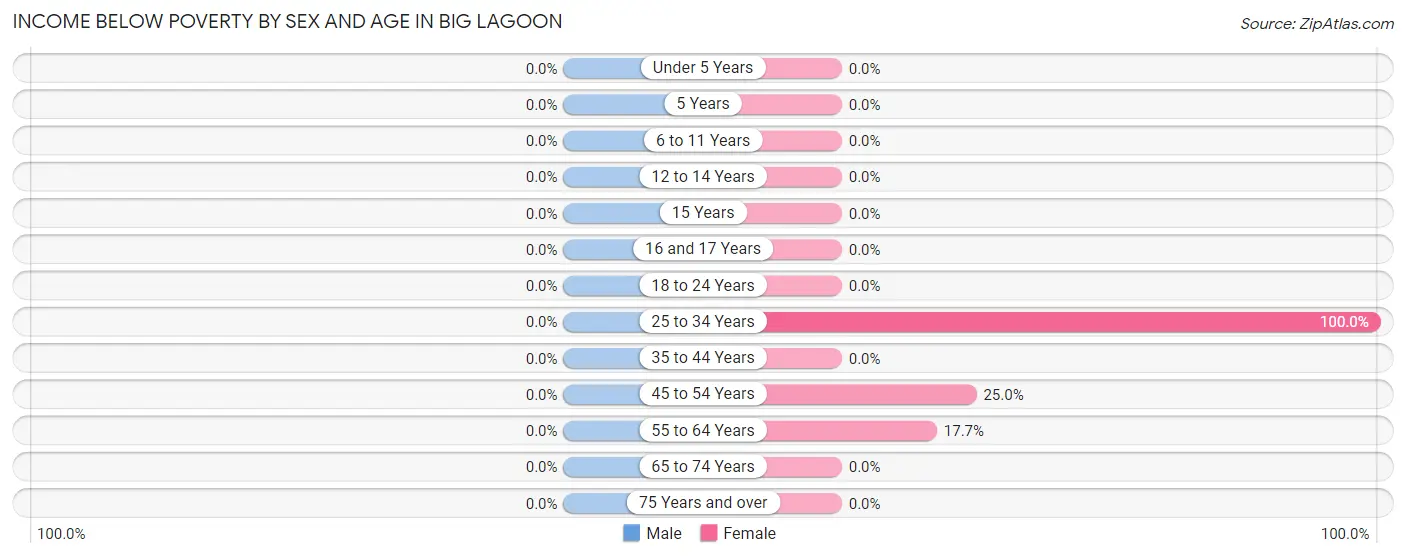
| Age Bracket | Male | Female |
| Under 5 Years | 0 (0.0%) | 0 (0.0%) |
| 5 Years | 0 (0.0%) | 0 (0.0%) |
| 6 to 11 Years | 0 (0.0%) | 0 (0.0%) |
| 12 to 14 Years | 0 (0.0%) | 0 (0.0%) |
| 15 Years | 0 (0.0%) | 0 (0.0%) |
| 16 and 17 Years | 0 (0.0%) | 0 (0.0%) |
| 18 to 24 Years | 0 (0.0%) | 0 (0.0%) |
| 25 to 34 Years | 0 (0.0%) | 4 (100.0%) |
| 35 to 44 Years | 0 (0.0%) | 0 (0.0%) |
| 45 to 54 Years | 0 (0.0%) | 3 (25.0%) |
| 55 to 64 Years | 0 (0.0%) | 3 (17.6%) |
| 65 to 74 Years | 0 (0.0%) | 0 (0.0%) |
| 75 Years and over | 0 (0.0%) | 0 (0.0%) |
| Total | 0 (0.0%) | 10 (16.4%) |
Income Above Poverty by Sex and Age in Big Lagoon
According to the poverty statistics in Big Lagoon, males aged 25 to 34 years and females aged 35 to 44 years are the age groups that are most secure financially, with 100.0% of males and 100.0% of females in these age groups living above the poverty line.
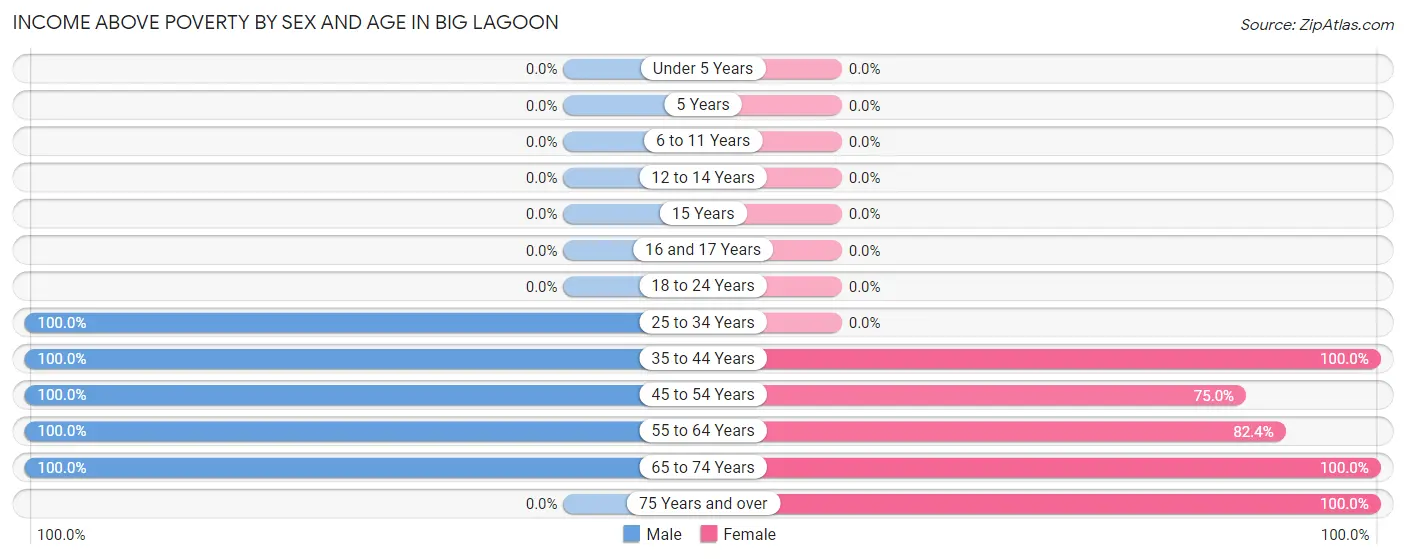
| Age Bracket | Male | Female |
| Under 5 Years | 0 (0.0%) | 0 (0.0%) |
| 5 Years | 0 (0.0%) | 0 (0.0%) |
| 6 to 11 Years | 0 (0.0%) | 0 (0.0%) |
| 12 to 14 Years | 0 (0.0%) | 0 (0.0%) |
| 15 Years | 0 (0.0%) | 0 (0.0%) |
| 16 and 17 Years | 0 (0.0%) | 0 (0.0%) |
| 18 to 24 Years | 0 (0.0%) | 0 (0.0%) |
| 25 to 34 Years | 3 (100.0%) | 0 (0.0%) |
| 35 to 44 Years | 7 (100.0%) | 4 (100.0%) |
| 45 to 54 Years | 11 (100.0%) | 9 (75.0%) |
| 55 to 64 Years | 2 (100.0%) | 14 (82.4%) |
| 65 to 74 Years | 20 (100.0%) | 8 (100.0%) |
| 75 Years and over | 0 (0.0%) | 16 (100.0%) |
| Total | 43 (100.0%) | 51 (83.6%) |
Income Below Poverty Among Married-Couple Families in Big Lagoon
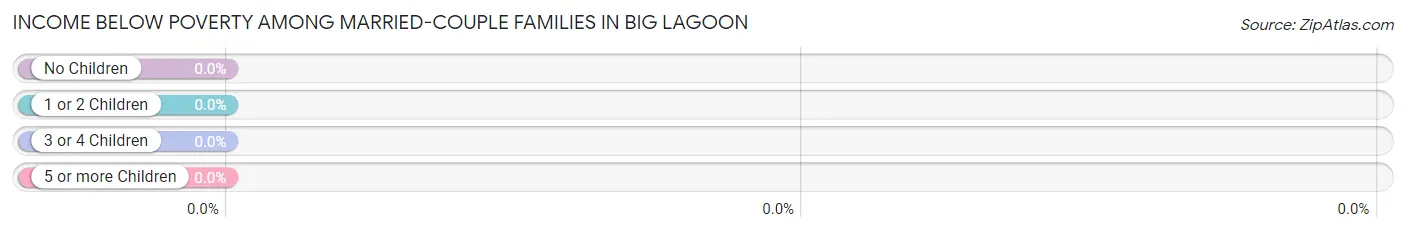
| Children | Above Poverty | Below Poverty |
| No Children | 15 (100.0%) | 0 (0.0%) |
| 1 or 2 Children | 0 (0.0%) | 0 (0.0%) |
| 3 or 4 Children | 0 (0.0%) | 0 (0.0%) |
| 5 or more Children | 0 (0.0%) | 0 (0.0%) |
| Total | 15 (100.0%) | 0 (0.0%) |
Income Below Poverty Among Single-Parent Households in Big Lagoon
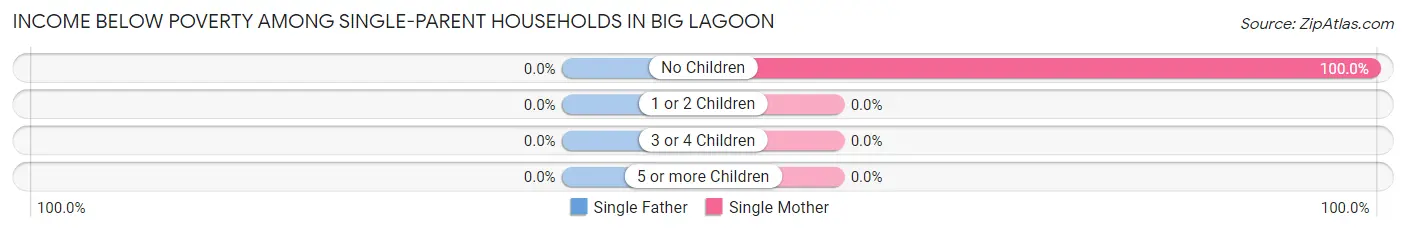
| Children | Single Father | Single Mother |
| No Children | 0 (0.0%) | 3 (100.0%) |
| 1 or 2 Children | 0 (0.0%) | 0 (0.0%) |
| 3 or 4 Children | 0 (0.0%) | 0 (0.0%) |
| 5 or more Children | 0 (0.0%) | 0 (0.0%) |
| Total | 0 (0.0%) | 3 (100.0%) |
Income Below Poverty Among Married-Couple vs Single-Parent Households in Big Lagoon
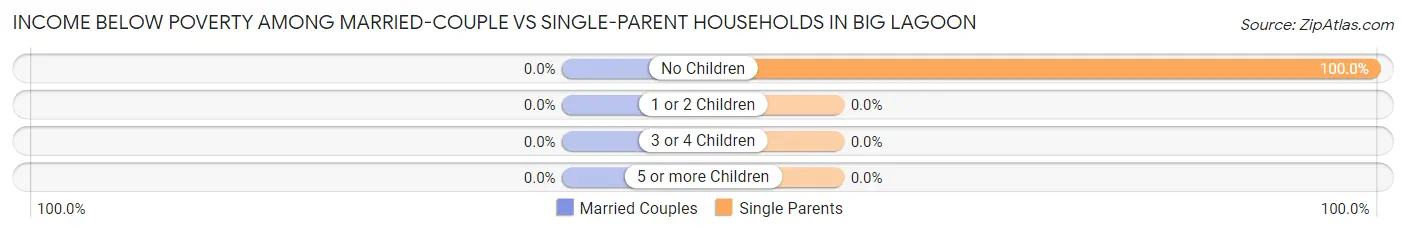
| Children | Married-Couple Families | Single-Parent Households |
| No Children | 0 (0.0%) | 3 (100.0%) |
| 1 or 2 Children | 0 (0.0%) | 0 (0.0%) |
| 3 or 4 Children | 0 (0.0%) | 0 (0.0%) |
| 5 or more Children | 0 (0.0%) | 0 (0.0%) |
| Total | 0 (0.0%) | 3 (100.0%) |
Race in Big Lagoon
The most populous races in Big Lagoon are White / Caucasian (81 | 77.9%), Two or more Races (23 | 22.1%), and Hispanic or Latino (14 | 13.5%).
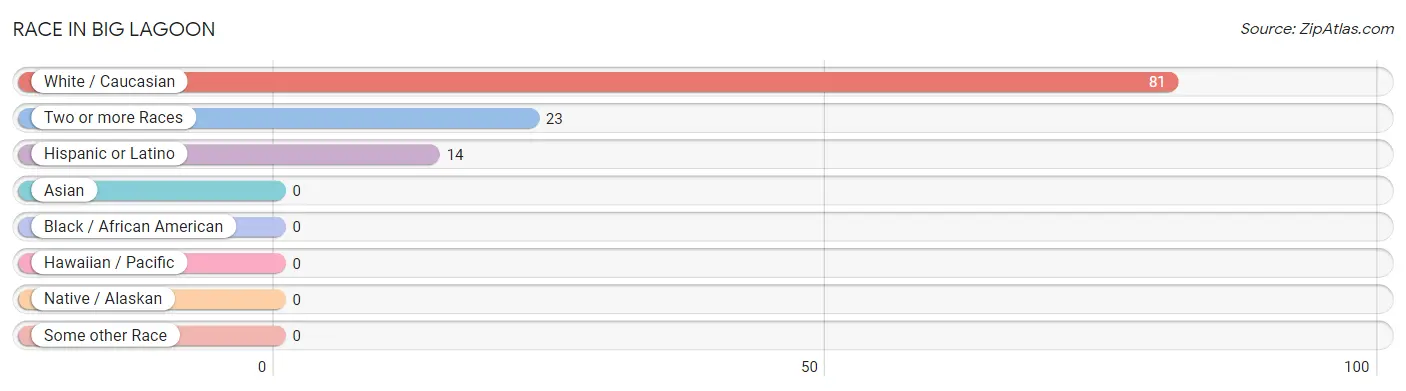
| Race | # Population | % Population |
| Asian | 0 | 0.0% |
| Black / African American | 0 | 0.0% |
| Hawaiian / Pacific | 0 | 0.0% |
| Hispanic or Latino | 14 | 13.5% |
| Native / Alaskan | 0 | 0.0% |
| White / Caucasian | 81 | 77.9% |
| Two or more Races | 23 | 22.1% |
| Some other Race | 0 | 0.0% |
| Total | 104 | 100.0% |
Ancestry in Big Lagoon
The most populous ancestries reported in Big Lagoon are Irish (39 | 37.5%), German (32 | 30.8%), English (13 | 12.5%), Korean (11 | 10.6%), and Spanish (11 | 10.6%), together accounting for 101.9% of all Big Lagoon residents.
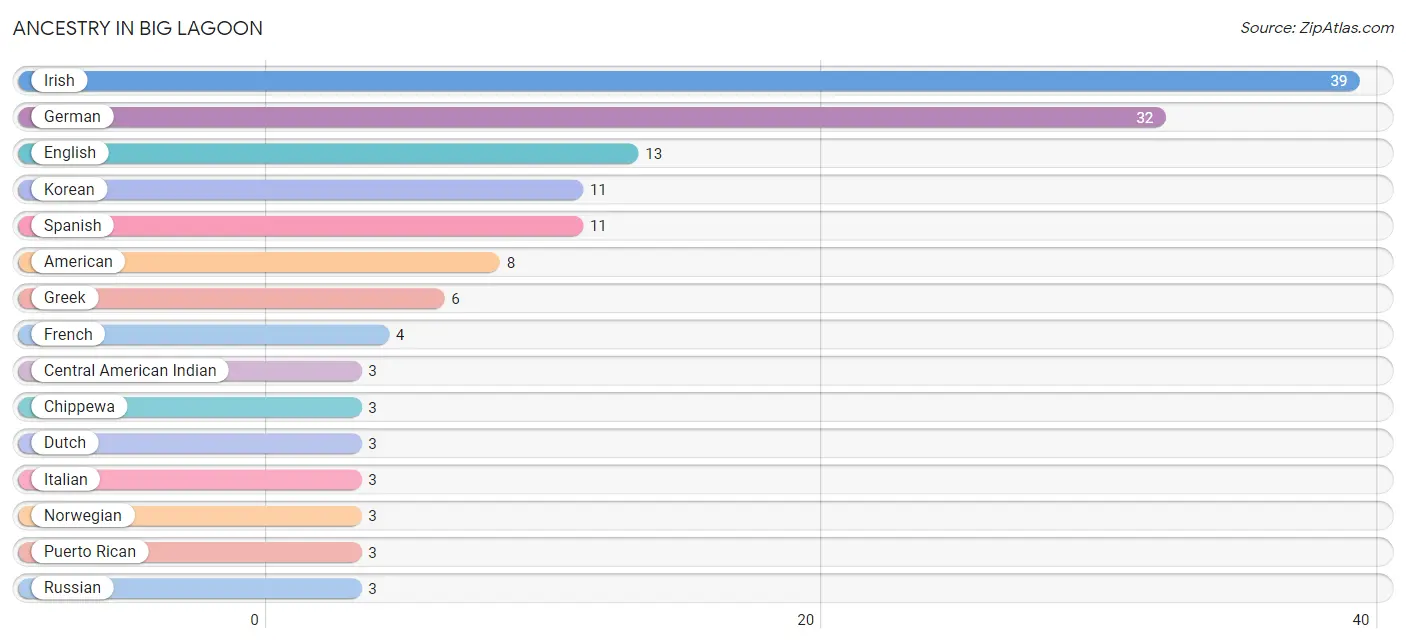
| Ancestry | # Population | % Population |
| American | 8 | 7.7% |
| Celtic | 2 | 1.9% |
| Central American Indian | 3 | 2.9% |
| Chippewa | 3 | 2.9% |
| Dutch | 3 | 2.9% |
| Eastern European | 2 | 1.9% |
| English | 13 | 12.5% |
| French | 4 | 3.8% |
| German | 32 | 30.8% |
| Greek | 6 | 5.8% |
| Irish | 39 | 37.5% |
| Italian | 3 | 2.9% |
| Korean | 11 | 10.6% |
| Norwegian | 3 | 2.9% |
| Puerto Rican | 3 | 2.9% |
| Russian | 3 | 2.9% |
| Spanish | 11 | 10.6% |
| Swedish | 1 | 1.0% |
| Swiss | 2 | 1.9% | View All 19 Rows |
Immigrants in Big Lagoon
The most numerous immigrant groups reported in Big Lagoon came from Canada (1 | 1.0%), Europe (1 | 1.0%), Northern Europe (1 | 1.0%), and Sweden (1 | 1.0%), together accounting for 3.8% of all Big Lagoon residents.
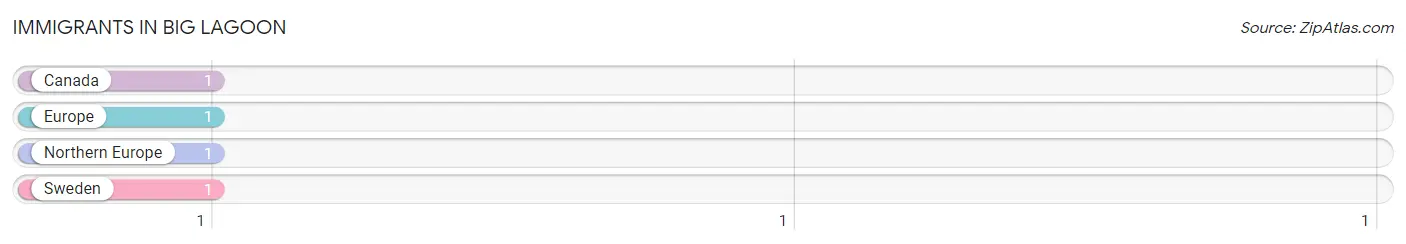
| Immigration Origin | # Population | % Population |
| Canada | 1 | 1.0% |
| Europe | 1 | 1.0% |
| Northern Europe | 1 | 1.0% |
| Sweden | 1 | 1.0% | View All 4 Rows |
Sex and Age in Big Lagoon
Sex and Age in Big Lagoon
The most populous age groups in Big Lagoon are 70 to 74 Years (12 | 27.9%) for men and 75 to 79 Years (16 | 26.2%) for women.
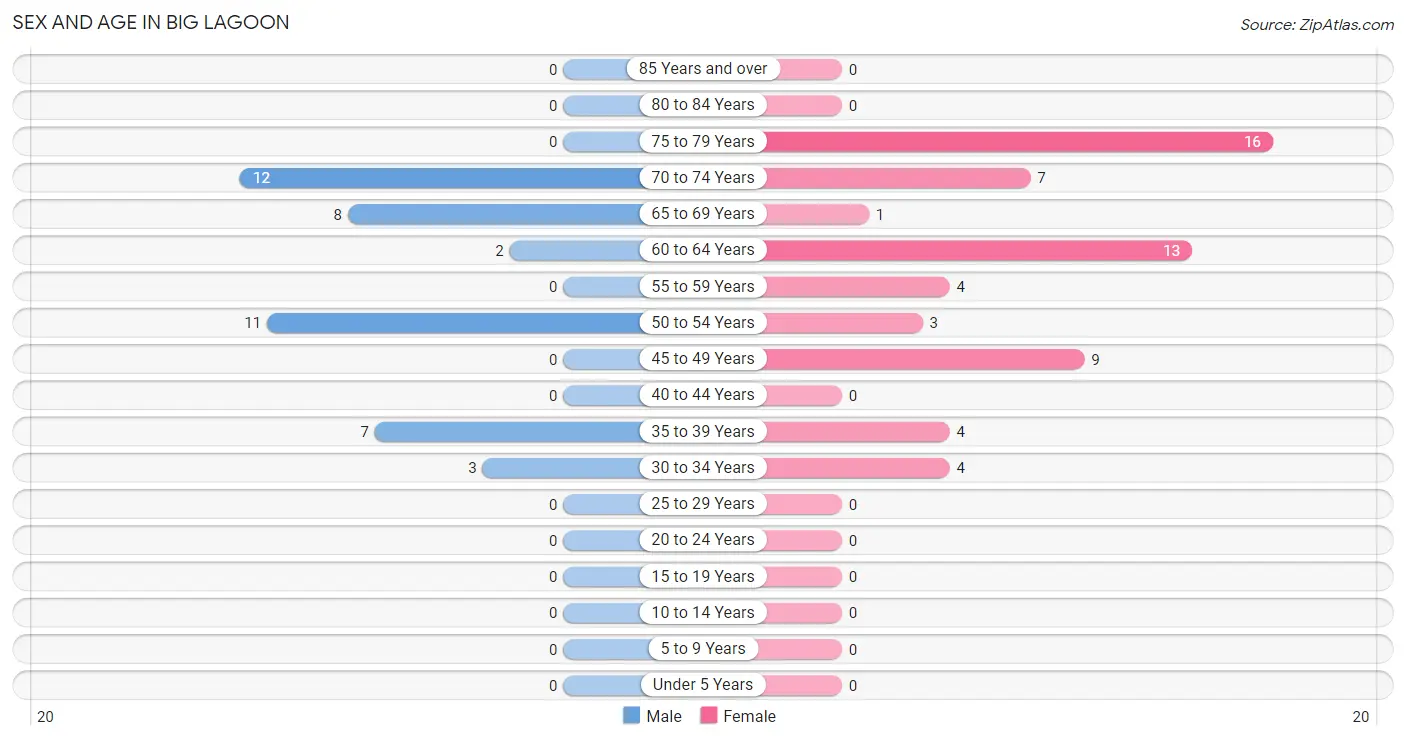
| Age Bracket | Male | Female |
| Under 5 Years | 0 (0.0%) | 0 (0.0%) |
| 5 to 9 Years | 0 (0.0%) | 0 (0.0%) |
| 10 to 14 Years | 0 (0.0%) | 0 (0.0%) |
| 15 to 19 Years | 0 (0.0%) | 0 (0.0%) |
| 20 to 24 Years | 0 (0.0%) | 0 (0.0%) |
| 25 to 29 Years | 0 (0.0%) | 0 (0.0%) |
| 30 to 34 Years | 3 (7.0%) | 4 (6.6%) |
| 35 to 39 Years | 7 (16.3%) | 4 (6.6%) |
| 40 to 44 Years | 0 (0.0%) | 0 (0.0%) |
| 45 to 49 Years | 0 (0.0%) | 9 (14.7%) |
| 50 to 54 Years | 11 (25.6%) | 3 (4.9%) |
| 55 to 59 Years | 0 (0.0%) | 4 (6.6%) |
| 60 to 64 Years | 2 (4.6%) | 13 (21.3%) |
| 65 to 69 Years | 8 (18.6%) | 1 (1.6%) |
| 70 to 74 Years | 12 (27.9%) | 7 (11.5%) |
| 75 to 79 Years | 0 (0.0%) | 16 (26.2%) |
| 80 to 84 Years | 0 (0.0%) | 0 (0.0%) |
| 85 Years and over | 0 (0.0%) | 0 (0.0%) |
| Total | 43 (100.0%) | 61 (100.0%) |
Families and Households in Big Lagoon
Median Family Size in Big Lagoon
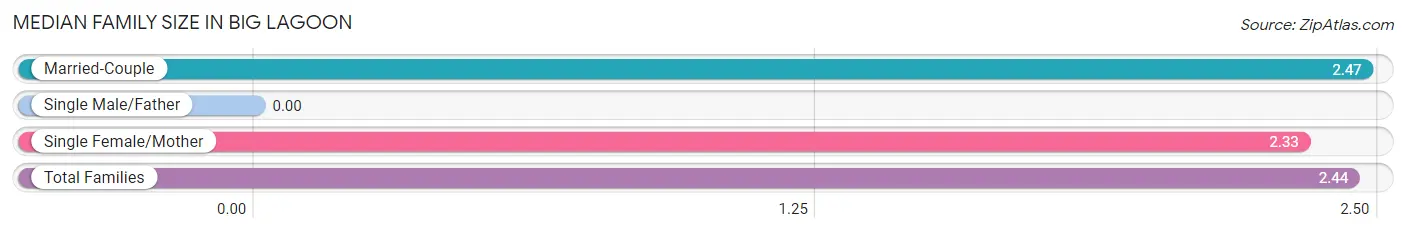
| Family Type | # Families | Family Size |
| Married-Couple | 15 (83.3%) | 2.47 |
| Single Male/Father | 0 (0.0%) | - |
| Single Female/Mother | 3 (16.7%) | 2.33 |
| Total Families | 18 (100.0%) | 2.44 |
Median Household Size in Big Lagoon
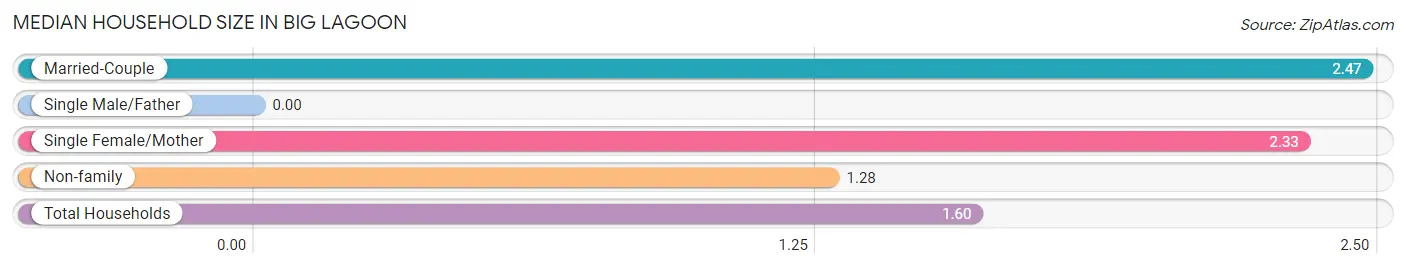
| Household Type | # Households | Household Size |
| Married-Couple | 15 (23.1%) | 2.47 |
| Single Male/Father | 0 (0.0%) | - |
| Single Female/Mother | 3 (4.6%) | 2.33 |
| Non-family | 47 (72.3%) | 1.28 |
| Total Households | 65 (100.0%) | 1.60 |
Household Size by Marriage Status in Big Lagoon
Out of a total of 65 households in Big Lagoon, 18 (27.7%) are family households, while 47 (72.3%) are nonfamily households. The most numerous type of family households are 2-person households, comprising 12, and the most common type of nonfamily households are 1-person households, comprising 36.
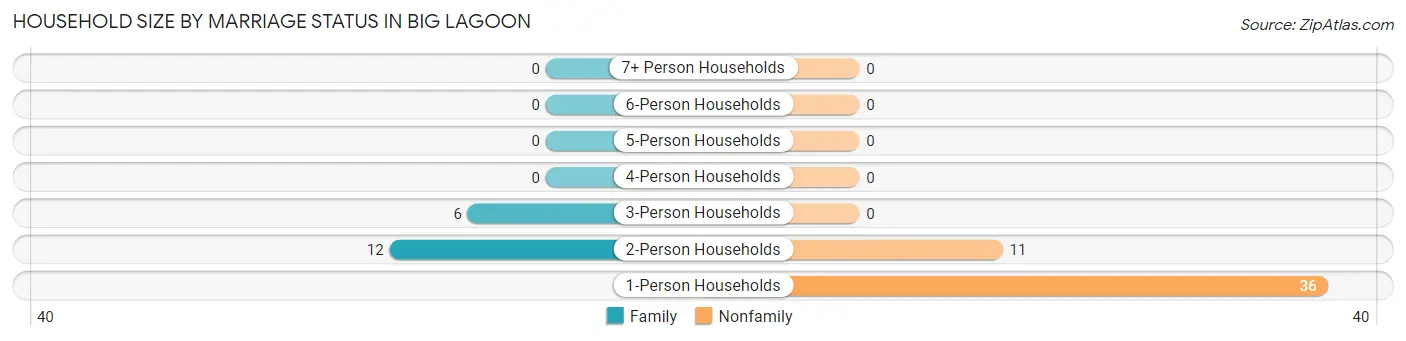
| Household Size | Family Households | Nonfamily Households |
| 1-Person Households | - | 36 (55.4%) |
| 2-Person Households | 12 (18.5%) | 11 (16.9%) |
| 3-Person Households | 6 (9.2%) | 0 (0.0%) |
| 4-Person Households | 0 (0.0%) | 0 (0.0%) |
| 5-Person Households | 0 (0.0%) | 0 (0.0%) |
| 6-Person Households | 0 (0.0%) | 0 (0.0%) |
| 7+ Person Households | 0 (0.0%) | 0 (0.0%) |
| Total | 18 (27.7%) | 47 (72.3%) |
Female Fertility in Big Lagoon
Fertility by Age in Big Lagoon
| Age Bracket | Women with Births | Births / 1,000 Women |
| 15 to 19 years | 0 (0.0%) | 0.0 |
| 20 to 34 years | 0 (0.0%) | 0.0 |
| 35 to 50 years | 0 (0.0%) | 0.0 |
| Total | 0 (0.0%) | 0.0 |
Fertility by Age by Marriage Status in Big Lagoon
| Age Bracket | Married | Unmarried |
| 15 to 19 years | 0 (0.0%) | 0 (0.0%) |
| 20 to 34 years | 0 (0.0%) | 0 (0.0%) |
| 35 to 50 years | 0 (0.0%) | 0 (0.0%) |
| Total | 0 (0.0%) | 0 (0.0%) |
Fertility by Education in Big Lagoon
| Educational Attainment | Women with Births | Births / 1,000 Women |
| Less than High School | 0 (0.0%) | 0.0 |
| High School Diploma | 0 (0.0%) | 0.0 |
| College or Associate's Degree | 0 (0.0%) | 0.0 |
| Bachelor's Degree | 0 (0.0%) | 0.0 |
| Graduate Degree | 0 (0.0%) | 0.0 |
| Total | 0 (0.0%) | 0.0 |
Fertility by Education by Marriage Status in Big Lagoon
| Educational Attainment | Married | Unmarried |
| Less than High School | 0 (0.0%) | 0 (0.0%) |
| High School Diploma | 0 (0.0%) | 0 (0.0%) |
| College or Associate's Degree | 0 (0.0%) | 0 (0.0%) |
| Bachelor's Degree | 0 (0.0%) | 0 (0.0%) |
| Graduate Degree | 0 (0.0%) | 0 (0.0%) |
| Total | 0 (0.0%) | 0 (0.0%) |
Employment Characteristics in Big Lagoon
Employment by Class of Employer in Big Lagoon
Among the 37 employed individuals in Big Lagoon, private company employees (23 | 62.2%), not-for-profit organizations (7 | 18.9%), and federal government employees (4 | 10.8%) make up the most common classes of employment.
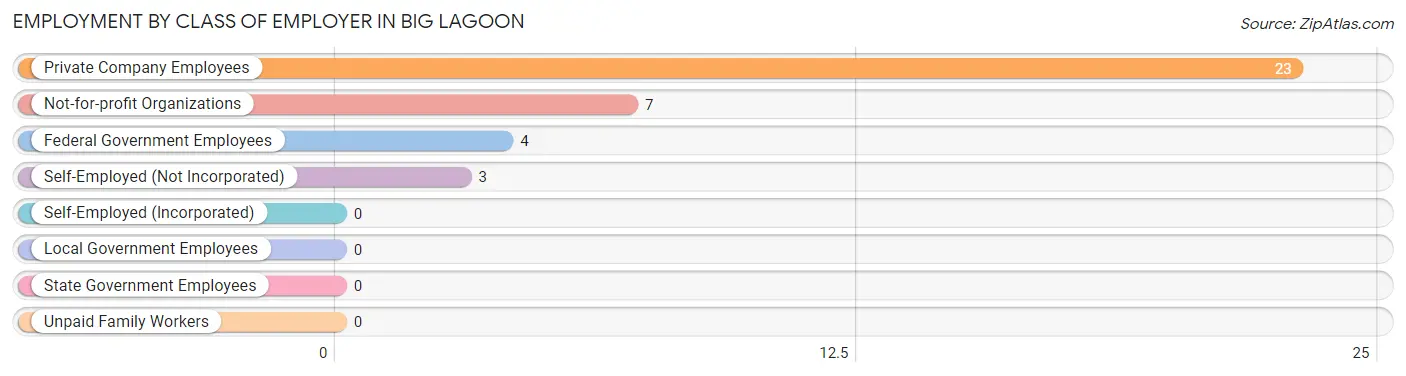
| Employer Class | # Employees | % Employees |
| Private Company Employees | 23 | 62.2% |
| Self-Employed (Incorporated) | 0 | 0.0% |
| Self-Employed (Not Incorporated) | 3 | 8.1% |
| Not-for-profit Organizations | 7 | 18.9% |
| Local Government Employees | 0 | 0.0% |
| State Government Employees | 0 | 0.0% |
| Federal Government Employees | 4 | 10.8% |
| Unpaid Family Workers | 0 | 0.0% |
| Total | 37 | 100.0% |
Employment Status by Age in Big Lagoon
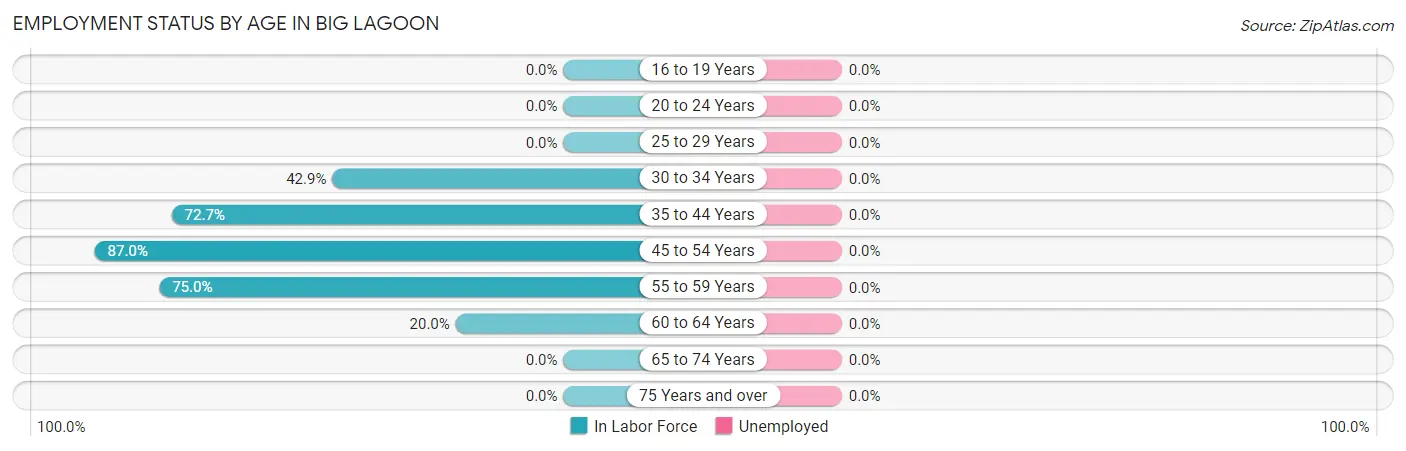
| Age Bracket | In Labor Force | Unemployed |
| 16 to 19 Years | 0 (0.0%) | 0 (0.0%) |
| 20 to 24 Years | 0 (0.0%) | 0 (0.0%) |
| 25 to 29 Years | 0 (0.0%) | 0 (0.0%) |
| 30 to 34 Years | 3 (42.9%) | 0 (0.0%) |
| 35 to 44 Years | 8 (72.7%) | 0 (0.0%) |
| 45 to 54 Years | 20 (87.0%) | 0 (0.0%) |
| 55 to 59 Years | 3 (75.0%) | 0 (0.0%) |
| 60 to 64 Years | 3 (20.0%) | 0 (0.0%) |
| 65 to 74 Years | 0 (0.0%) | 0 (0.0%) |
| 75 Years and over | 0 (0.0%) | 0 (0.0%) |
| Total | 37 (35.6%) | 0 (0.0%) |
Employment Status by Educational Attainment in Big Lagoon
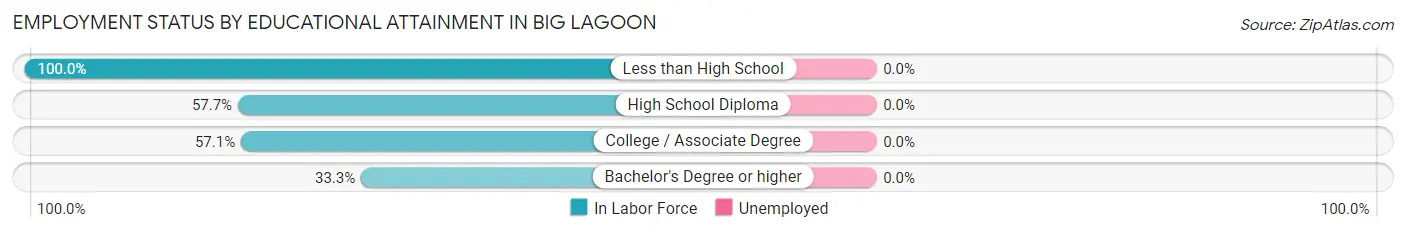
| Educational Attainment | In Labor Force | Unemployed |
| Less than High School | 11 (100.0%) | 0 (0.0%) |
| High School Diploma | 15 (57.7%) | 0 (0.0%) |
| College / Associate Degree | 8 (57.1%) | 0 (0.0%) |
| Bachelor's Degree or higher | 3 (33.3%) | 0 (0.0%) |
| Total | 37 (61.7%) | 0 (0.0%) |
Employment Occupations by Sex in Big Lagoon
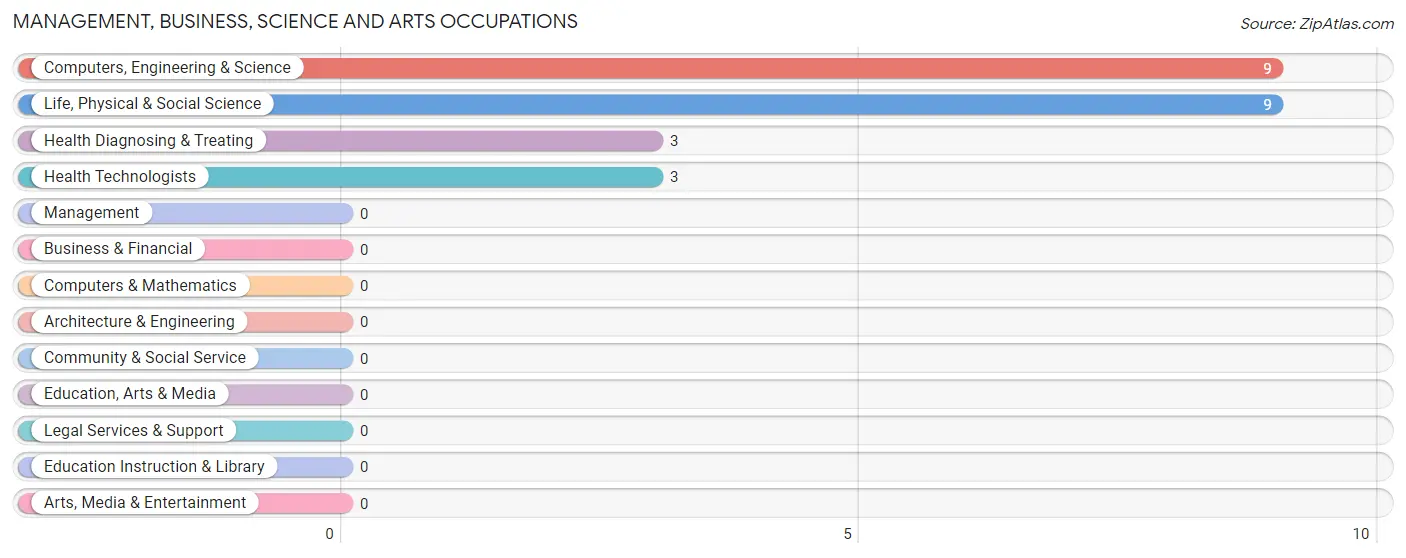
Management, Business, Science and Arts Occupations
The most common Management, Business, Science and Arts occupations in Big Lagoon are Computers, Engineering & Science (9 | 27.3%), Life, Physical & Social Science (9 | 27.3%), Health Diagnosing & Treating (3 | 9.1%), and Health Technologists (3 | 9.1%).
Management, Business, Science and Arts Occupations by Sex
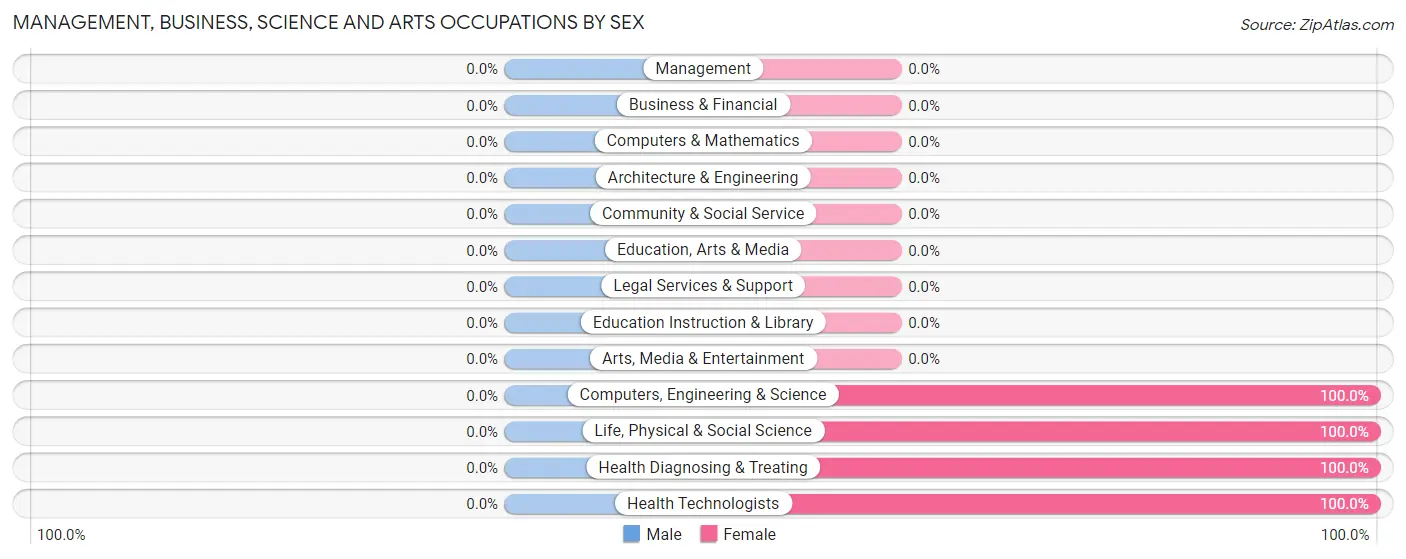
| Occupation | Male | Female |
| Management | 0 (0.0%) | 0 (0.0%) |
| Business & Financial | 0 (0.0%) | 0 (0.0%) |
| Computers, Engineering & Science | 0 (0.0%) | 9 (100.0%) |
| Computers & Mathematics | 0 (0.0%) | 0 (0.0%) |
| Architecture & Engineering | 0 (0.0%) | 0 (0.0%) |
| Life, Physical & Social Science | 0 (0.0%) | 9 (100.0%) |
| Community & Social Service | 0 (0.0%) | 0 (0.0%) |
| Education, Arts & Media | 0 (0.0%) | 0 (0.0%) |
| Legal Services & Support | 0 (0.0%) | 0 (0.0%) |
| Education Instruction & Library | 0 (0.0%) | 0 (0.0%) |
| Arts, Media & Entertainment | 0 (0.0%) | 0 (0.0%) |
| Health Diagnosing & Treating | 0 (0.0%) | 3 (100.0%) |
| Health Technologists | 0 (0.0%) | 3 (100.0%) |
| Total (Category) | 0 (0.0%) | 12 (100.0%) |
| Total (Overall) | 14 (42.4%) | 19 (57.6%) |
Services Occupations
Services Occupations by Sex
| Occupation | Male | Female |
| Healthcare Support | 0 (0.0%) | 0 (0.0%) |
| Security & Protection | 0 (0.0%) | 0 (0.0%) |
| Firefighting & Prevention | 0 (0.0%) | 0 (0.0%) |
| Law Enforcement | 0 (0.0%) | 0 (0.0%) |
| Food Preparation & Serving | 0 (0.0%) | 0 (0.0%) |
| Cleaning & Maintenance | 0 (0.0%) | 0 (0.0%) |
| Personal Care & Service | 0 (0.0%) | 0 (0.0%) |
| Total (Category) | 0 (0.0%) | 0 (0.0%) |
| Total (Overall) | 14 (42.4%) | 19 (57.6%) |
Sales and Office Occupations
The most common Sales and Office occupations in Big Lagoon are , and Office & Administration (4 | 12.1%).
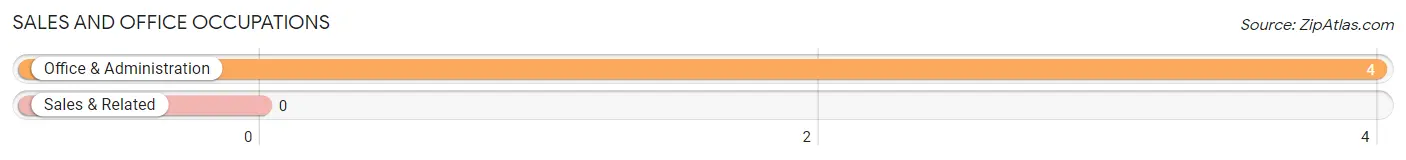
Sales and Office Occupations by Sex
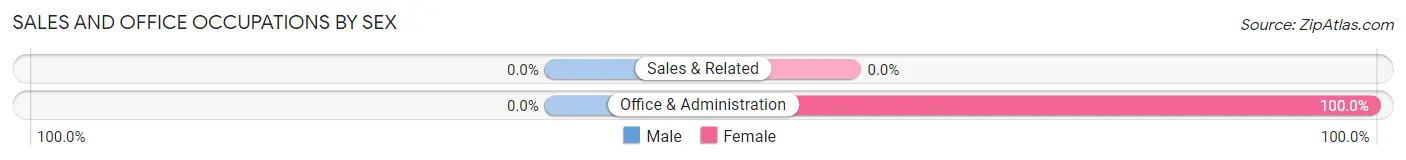
| Occupation | Male | Female |
| Sales & Related | 0 (0.0%) | 0 (0.0%) |
| Office & Administration | 0 (0.0%) | 4 (100.0%) |
| Total (Category) | 0 (0.0%) | 4 (100.0%) |
| Total (Overall) | 14 (42.4%) | 19 (57.6%) |
Natural Resources, Construction and Maintenance Occupations
The most common Natural Resources, Construction and Maintenance occupations in Big Lagoon are Farming, Fishing & Forestry (11 | 33.3%), and Construction & Extraction (3 | 9.1%).
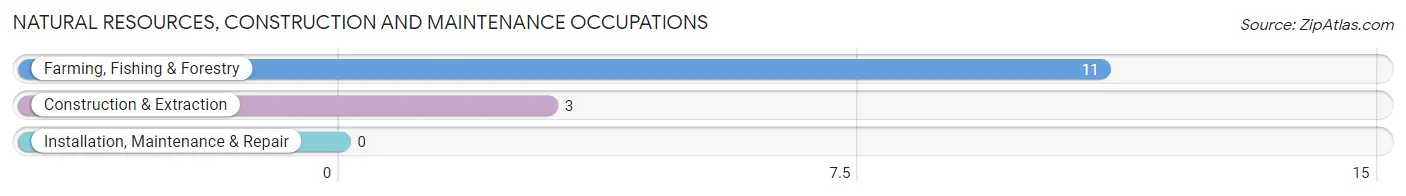
Natural Resources, Construction and Maintenance Occupations by Sex
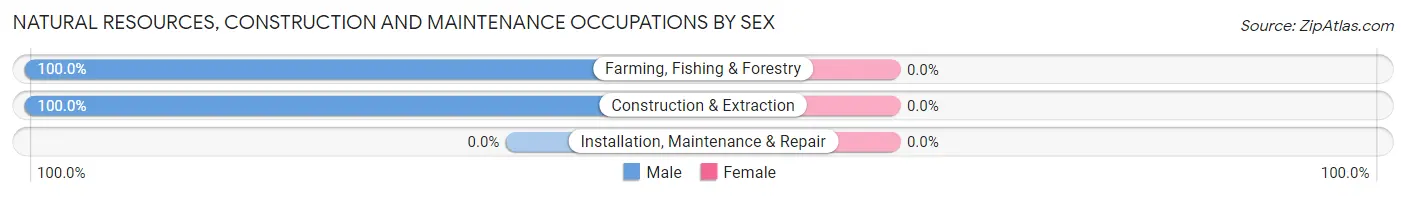
| Occupation | Male | Female |
| Farming, Fishing & Forestry | 11 (100.0%) | 0 (0.0%) |
| Construction & Extraction | 3 (100.0%) | 0 (0.0%) |
| Installation, Maintenance & Repair | 0 (0.0%) | 0 (0.0%) |
| Total (Category) | 14 (100.0%) | 0 (0.0%) |
| Total (Overall) | 14 (42.4%) | 19 (57.6%) |
Production, Transportation and Moving Occupations
The most common Production, Transportation and Moving occupations in Big Lagoon are , and Production (3 | 9.1%).
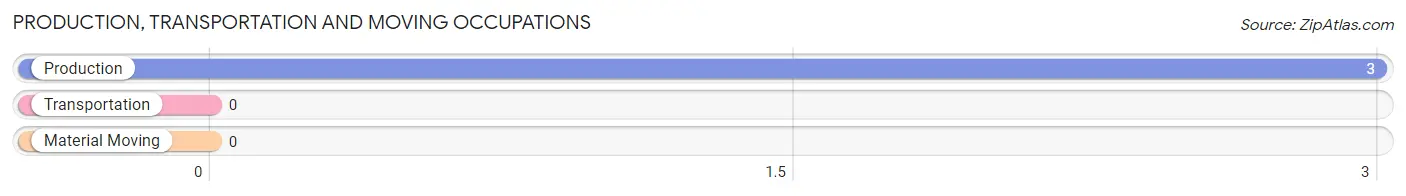
Production, Transportation and Moving Occupations by Sex
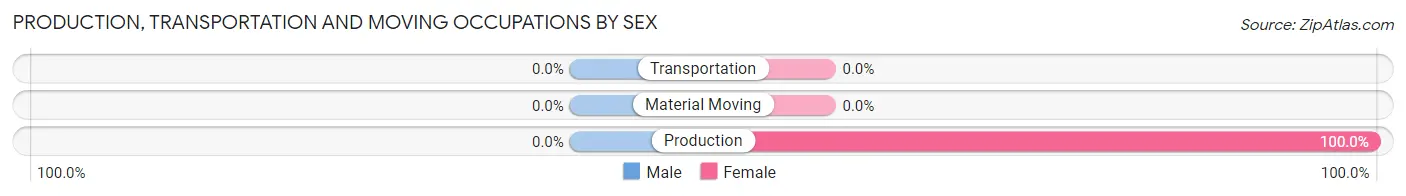
| Occupation | Male | Female |
| Production | 0 (0.0%) | 3 (100.0%) |
| Transportation | 0 (0.0%) | 0 (0.0%) |
| Material Moving | 0 (0.0%) | 0 (0.0%) |
| Total (Category) | 0 (0.0%) | 3 (100.0%) |
| Total (Overall) | 14 (42.4%) | 19 (57.6%) |
Employment Industries by Sex in Big Lagoon
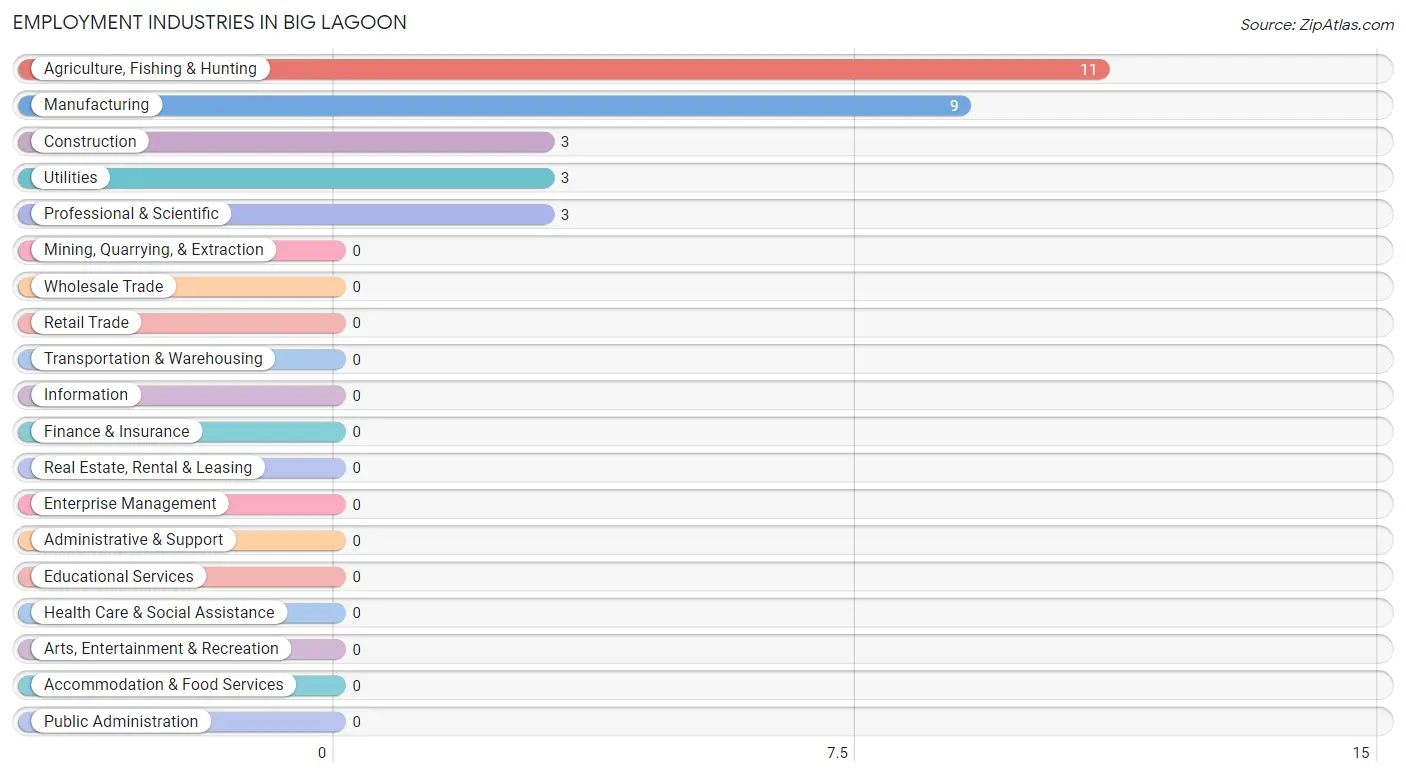
Employment Industries in Big Lagoon
The major employment industries in Big Lagoon include Agriculture, Fishing & Hunting (11 | 33.3%), Manufacturing (9 | 27.3%), Construction (3 | 9.1%), Utilities (3 | 9.1%), and Professional & Scientific (3 | 9.1%).
Employment Industries by Sex in Big Lagoon
The Big Lagoon industries that see more men than women are Agriculture, Fishing & Hunting (100.0%), and Construction (100.0%), whereas the industries that tend to have a higher number of women are Manufacturing (100.0%), Utilities (100.0%), and Professional & Scientific (100.0%).
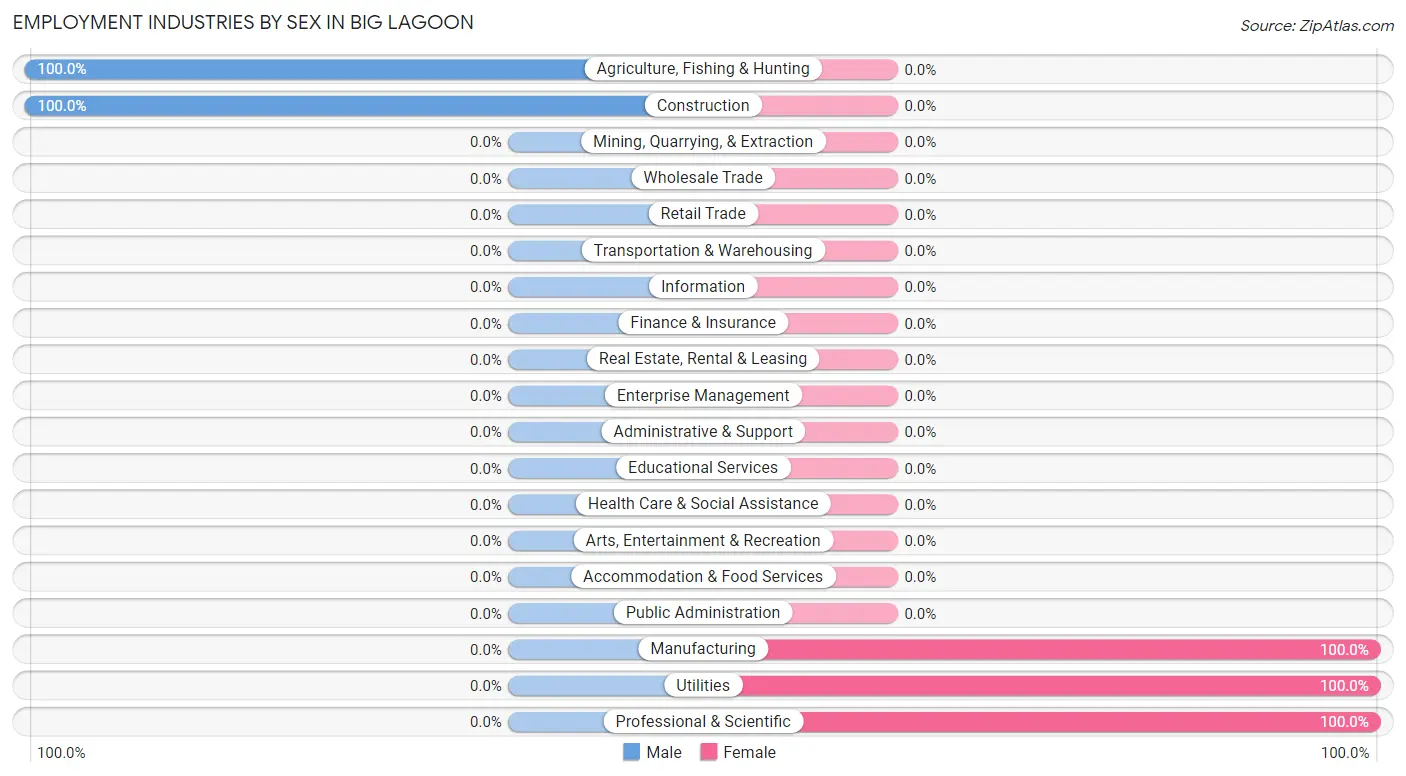
| Industry | Male | Female |
| Agriculture, Fishing & Hunting | 11 (100.0%) | 0 (0.0%) |
| Mining, Quarrying, & Extraction | 0 (0.0%) | 0 (0.0%) |
| Construction | 3 (100.0%) | 0 (0.0%) |
| Manufacturing | 0 (0.0%) | 9 (100.0%) |
| Wholesale Trade | 0 (0.0%) | 0 (0.0%) |
| Retail Trade | 0 (0.0%) | 0 (0.0%) |
| Transportation & Warehousing | 0 (0.0%) | 0 (0.0%) |
| Utilities | 0 (0.0%) | 3 (100.0%) |
| Information | 0 (0.0%) | 0 (0.0%) |
| Finance & Insurance | 0 (0.0%) | 0 (0.0%) |
| Real Estate, Rental & Leasing | 0 (0.0%) | 0 (0.0%) |
| Professional & Scientific | 0 (0.0%) | 3 (100.0%) |
| Enterprise Management | 0 (0.0%) | 0 (0.0%) |
| Administrative & Support | 0 (0.0%) | 0 (0.0%) |
| Educational Services | 0 (0.0%) | 0 (0.0%) |
| Health Care & Social Assistance | 0 (0.0%) | 0 (0.0%) |
| Arts, Entertainment & Recreation | 0 (0.0%) | 0 (0.0%) |
| Accommodation & Food Services | 0 (0.0%) | 0 (0.0%) |
| Public Administration | 0 (0.0%) | 0 (0.0%) |
| Total | 14 (42.4%) | 19 (57.6%) |
Education in Big Lagoon
School Enrollment in Big Lagoon
| School Level | # Students | % Students |
| Nursery / Preschool | 0 | 0.0% |
| Kindergarten | 0 | 0.0% |
| Elementary School | 0 | 0.0% |
| Middle School | 0 | 0.0% |
| High School | 0 | 0.0% |
| College / Undergraduate | 0 | 0.0% |
| Graduate / Professional | 0 | 0.0% |
| Total | 0 | 0.0% |
School Enrollment by Age by Funding Source in Big Lagoon
| Age Bracket | Public School | Private School |
| 3 to 4 Year Olds | 0 (0.0%) | 0 (0.0%) |
| 5 to 9 Year Old | 0 (0.0%) | 0 (0.0%) |
| 10 to 14 Year Olds | 0 (0.0%) | 0 (0.0%) |
| 15 to 17 Year Olds | 0 (0.0%) | 0 (0.0%) |
| 18 to 19 Year Olds | 0 (0.0%) | 0 (0.0%) |
| 20 to 24 Year Olds | 0 (0.0%) | 0 (0.0%) |
| 25 to 34 Year Olds | 0 (0.0%) | 0 (0.0%) |
| 35 Years and over | 0 (0.0%) | 0 (0.0%) |
| Total | 0 (0.0%) | 0 (0.0%) |
Educational Attainment by Field of Study in Big Lagoon
Education (21 | 36.8%), psychology (7 | 12.3%), arts & humanities (7 | 12.3%), science & technology (6 | 10.5%), and bio, nature & agricultural (5 | 8.8%) are the most common fields of study among 57 individuals in Big Lagoon who have obtained a bachelor's degree or higher.
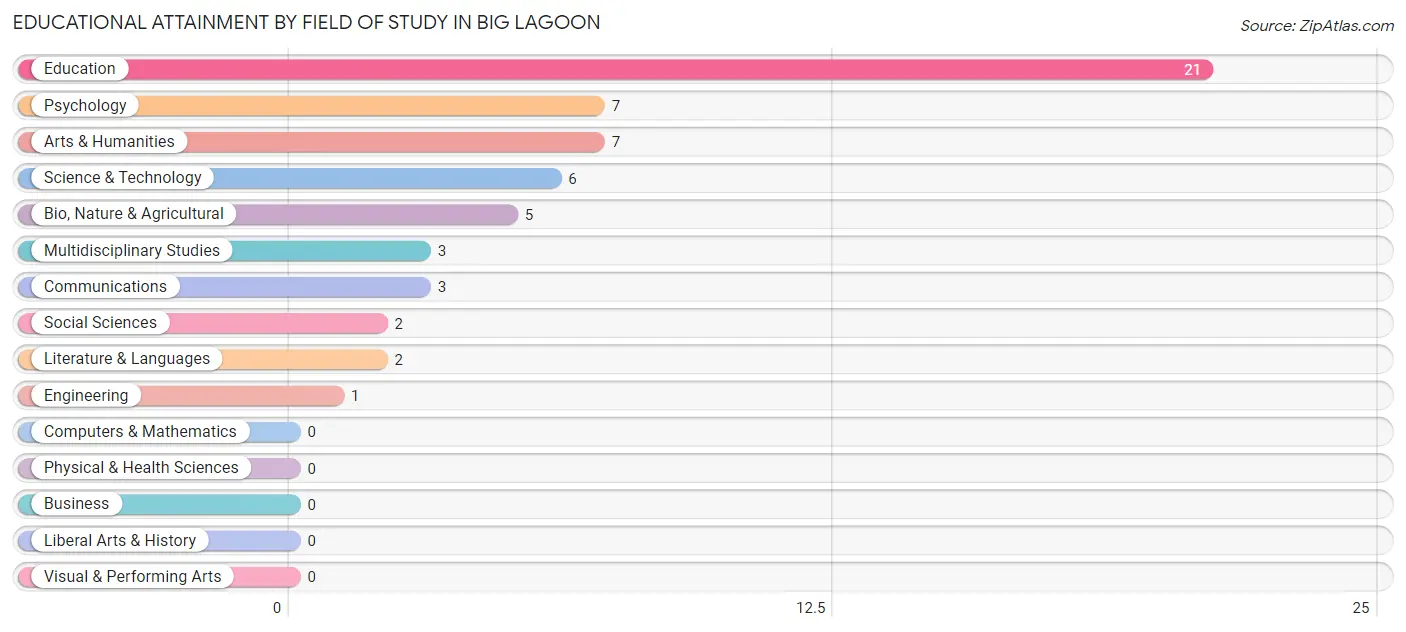
| Field of Study | # Graduates | % Graduates |
| Computers & Mathematics | 0 | 0.0% |
| Bio, Nature & Agricultural | 5 | 8.8% |
| Physical & Health Sciences | 0 | 0.0% |
| Psychology | 7 | 12.3% |
| Social Sciences | 2 | 3.5% |
| Engineering | 1 | 1.8% |
| Multidisciplinary Studies | 3 | 5.3% |
| Science & Technology | 6 | 10.5% |
| Business | 0 | 0.0% |
| Education | 21 | 36.8% |
| Literature & Languages | 2 | 3.5% |
| Liberal Arts & History | 0 | 0.0% |
| Visual & Performing Arts | 0 | 0.0% |
| Communications | 3 | 5.3% |
| Arts & Humanities | 7 | 12.3% |
| Total | 57 | 100.0% |
Transportation & Commute in Big Lagoon
Vehicle Availability by Sex in Big Lagoon
The most prevalent vehicle ownership categories in Big Lagoon are males with 2 vehicles (15, accounting for 83.3%) and females with 2 vehicles (13, making up 78.9%).
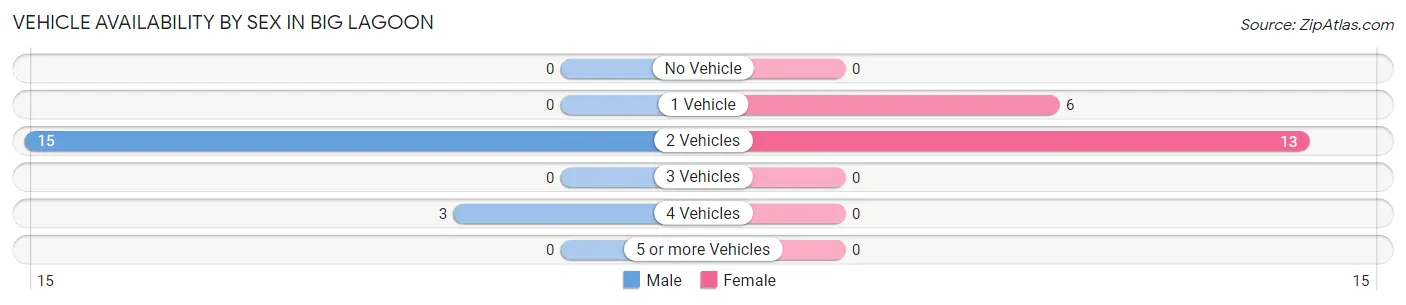
| Vehicles Available | Male | Female |
| No Vehicle | 0 (0.0%) | 0 (0.0%) |
| 1 Vehicle | 0 (0.0%) | 6 (31.6%) |
| 2 Vehicles | 15 (83.3%) | 13 (68.4%) |
| 3 Vehicles | 0 (0.0%) | 0 (0.0%) |
| 4 Vehicles | 3 (16.7%) | 0 (0.0%) |
| 5 or more Vehicles | 0 (0.0%) | 0 (0.0%) |
| Total | 18 (100.0%) | 19 (100.0%) |
Commute Time in Big Lagoon
The most frequently occuring commute durations in Big Lagoon are less than 5 minutes (14 commuters, 56.0%), 25 to 29 minutes (4 commuters, 16.0%), and 35 to 39 minutes (4 commuters, 16.0%).
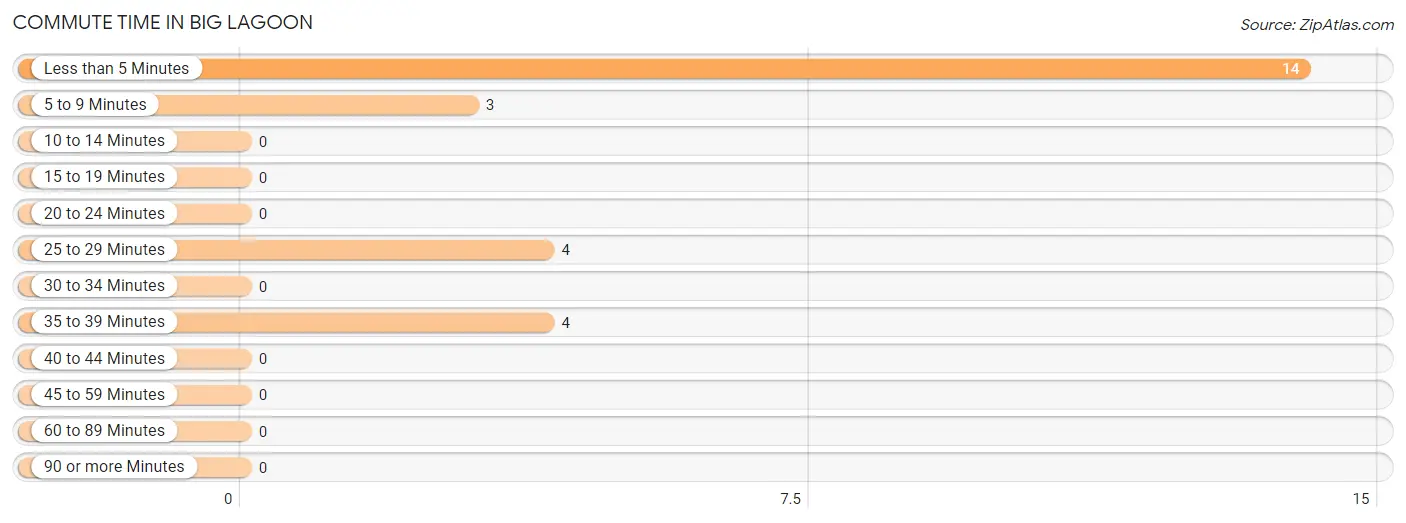
| Commute Time | # Commuters | % Commuters |
| Less than 5 Minutes | 14 | 56.0% |
| 5 to 9 Minutes | 3 | 12.0% |
| 10 to 14 Minutes | 0 | 0.0% |
| 15 to 19 Minutes | 0 | 0.0% |
| 20 to 24 Minutes | 0 | 0.0% |
| 25 to 29 Minutes | 4 | 16.0% |
| 30 to 34 Minutes | 0 | 0.0% |
| 35 to 39 Minutes | 4 | 16.0% |
| 40 to 44 Minutes | 0 | 0.0% |
| 45 to 59 Minutes | 0 | 0.0% |
| 60 to 89 Minutes | 0 | 0.0% |
| 90 or more Minutes | 0 | 0.0% |
Commute Time by Sex in Big Lagoon
The most common commute times in Big Lagoon are less than 5 minutes (14 commuters, 77.8%) for males and 25 to 29 minutes (4 commuters, 57.1%) for females.
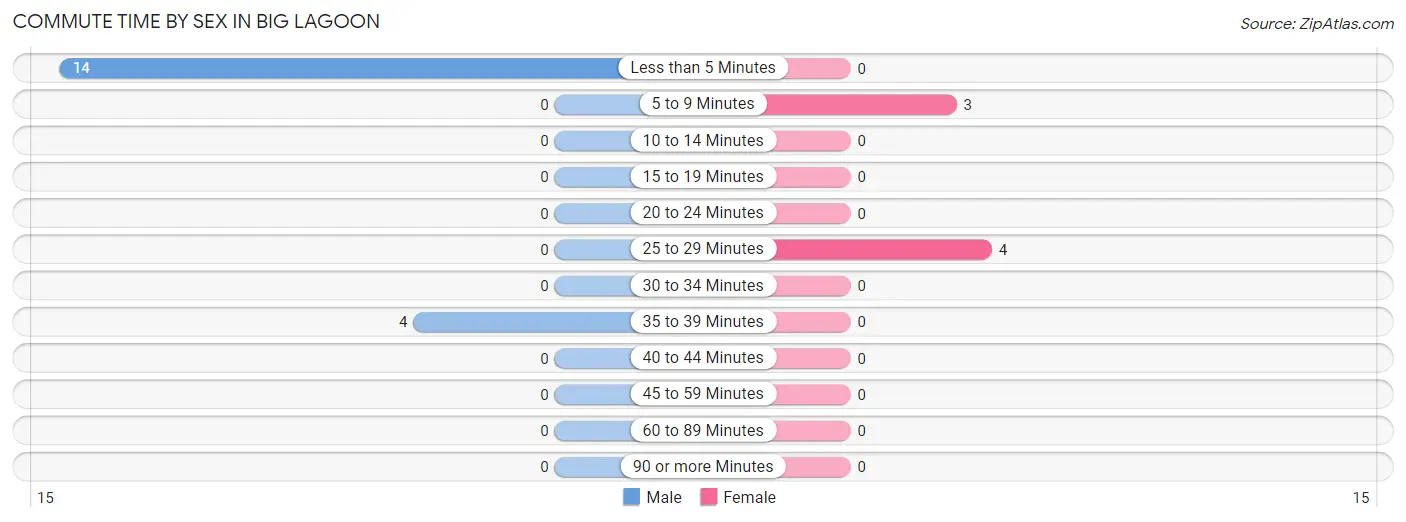
| Commute Time | Male | Female |
| Less than 5 Minutes | 14 (77.8%) | 0 (0.0%) |
| 5 to 9 Minutes | 0 (0.0%) | 3 (42.9%) |
| 10 to 14 Minutes | 0 (0.0%) | 0 (0.0%) |
| 15 to 19 Minutes | 0 (0.0%) | 0 (0.0%) |
| 20 to 24 Minutes | 0 (0.0%) | 0 (0.0%) |
| 25 to 29 Minutes | 0 (0.0%) | 4 (57.1%) |
| 30 to 34 Minutes | 0 (0.0%) | 0 (0.0%) |
| 35 to 39 Minutes | 4 (22.2%) | 0 (0.0%) |
| 40 to 44 Minutes | 0 (0.0%) | 0 (0.0%) |
| 45 to 59 Minutes | 0 (0.0%) | 0 (0.0%) |
| 60 to 89 Minutes | 0 (0.0%) | 0 (0.0%) |
| 90 or more Minutes | 0 (0.0%) | 0 (0.0%) |
Time of Departure to Work by Sex in Big Lagoon
The most frequent times of departure to work in Big Lagoon are 7:00 AM to 7:29 AM (11, 61.1%) for males and 8:00 AM to 8:29 AM (4, 57.1%) for females.
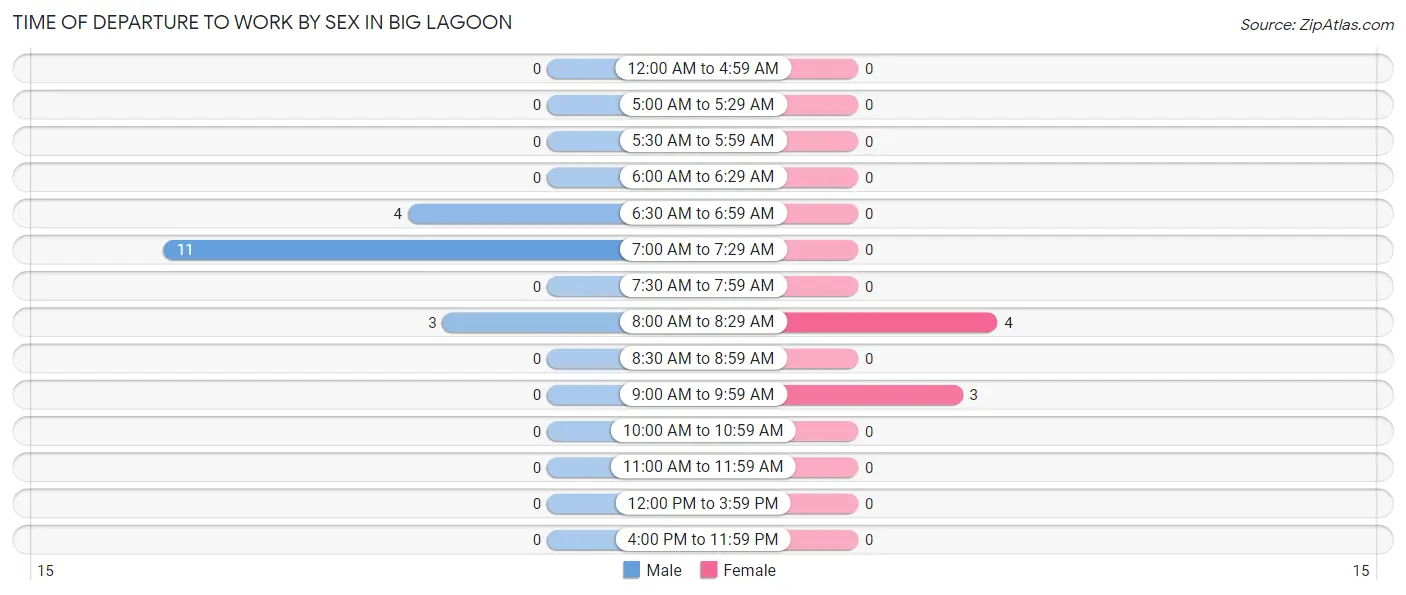
| Time of Departure | Male | Female |
| 12:00 AM to 4:59 AM | 0 (0.0%) | 0 (0.0%) |
| 5:00 AM to 5:29 AM | 0 (0.0%) | 0 (0.0%) |
| 5:30 AM to 5:59 AM | 0 (0.0%) | 0 (0.0%) |
| 6:00 AM to 6:29 AM | 0 (0.0%) | 0 (0.0%) |
| 6:30 AM to 6:59 AM | 4 (22.2%) | 0 (0.0%) |
| 7:00 AM to 7:29 AM | 11 (61.1%) | 0 (0.0%) |
| 7:30 AM to 7:59 AM | 0 (0.0%) | 0 (0.0%) |
| 8:00 AM to 8:29 AM | 3 (16.7%) | 4 (57.1%) |
| 8:30 AM to 8:59 AM | 0 (0.0%) | 0 (0.0%) |
| 9:00 AM to 9:59 AM | 0 (0.0%) | 3 (42.9%) |
| 10:00 AM to 10:59 AM | 0 (0.0%) | 0 (0.0%) |
| 11:00 AM to 11:59 AM | 0 (0.0%) | 0 (0.0%) |
| 12:00 PM to 3:59 PM | 0 (0.0%) | 0 (0.0%) |
| 4:00 PM to 11:59 PM | 0 (0.0%) | 0 (0.0%) |
| Total | 18 (100.0%) | 7 (100.0%) |
Housing Occupancy in Big Lagoon
Occupancy by Ownership in Big Lagoon
Of the total 65 dwellings in Big Lagoon, owner-occupied units account for 48 (73.9%), while renter-occupied units make up 17 (26.2%).
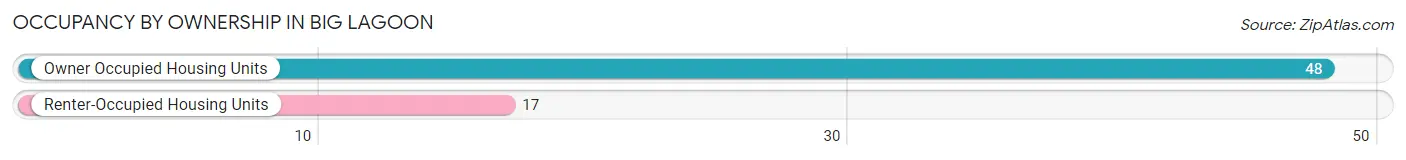
| Occupancy | # Housing Units | % Housing Units |
| Owner Occupied Housing Units | 48 | 73.9% |
| Renter-Occupied Housing Units | 17 | 26.2% |
| Total Occupied Housing Units | 65 | 100.0% |
Occupancy by Household Size in Big Lagoon
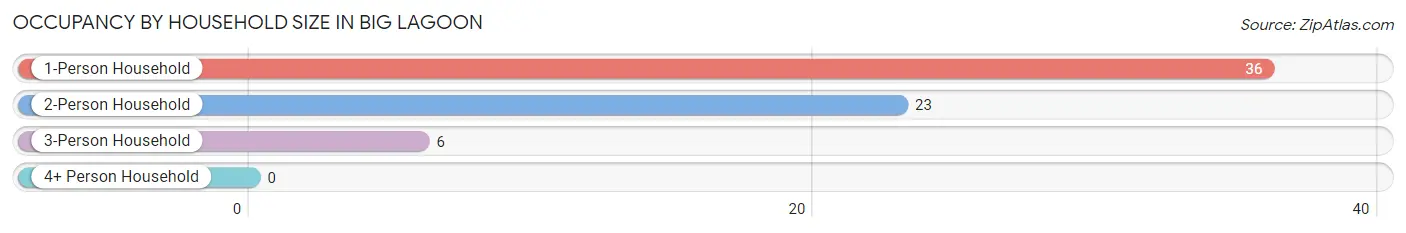
| Household Size | # Housing Units | % Housing Units |
| 1-Person Household | 36 | 55.4% |
| 2-Person Household | 23 | 35.4% |
| 3-Person Household | 6 | 9.2% |
| 4+ Person Household | 0 | 0.0% |
| Total Housing Units | 65 | 100.0% |
Occupancy by Ownership by Household Size in Big Lagoon
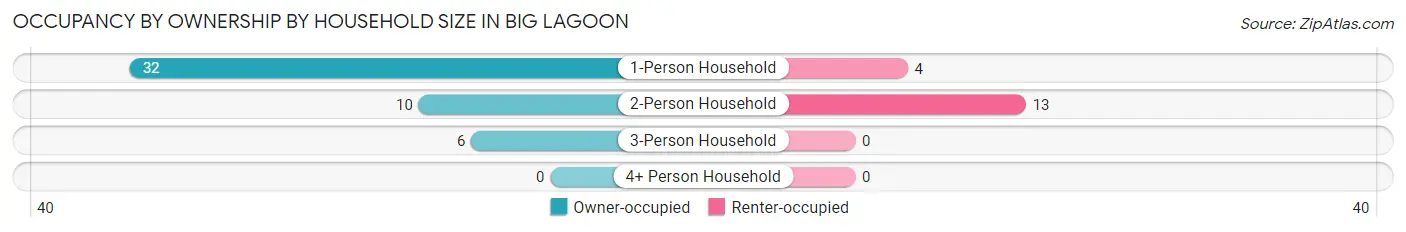
| Household Size | Owner-occupied | Renter-occupied |
| 1-Person Household | 32 (88.9%) | 4 (11.1%) |
| 2-Person Household | 10 (43.5%) | 13 (56.5%) |
| 3-Person Household | 6 (100.0%) | 0 (0.0%) |
| 4+ Person Household | 0 (0.0%) | 0 (0.0%) |
| Total Housing Units | 48 (73.9%) | 17 (26.2%) |
Occupancy by Educational Attainment in Big Lagoon
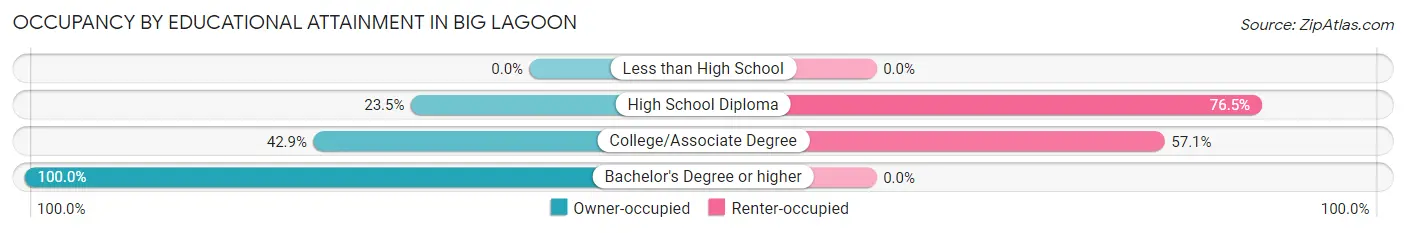
| Household Size | Owner-occupied | Renter-occupied |
| Less than High School | 0 (0.0%) | 0 (0.0%) |
| High School Diploma | 4 (23.5%) | 13 (76.5%) |
| College/Associate Degree | 3 (42.9%) | 4 (57.1%) |
| Bachelor's Degree or higher | 41 (100.0%) | 0 (0.0%) |
Occupancy by Age of Householder in Big Lagoon
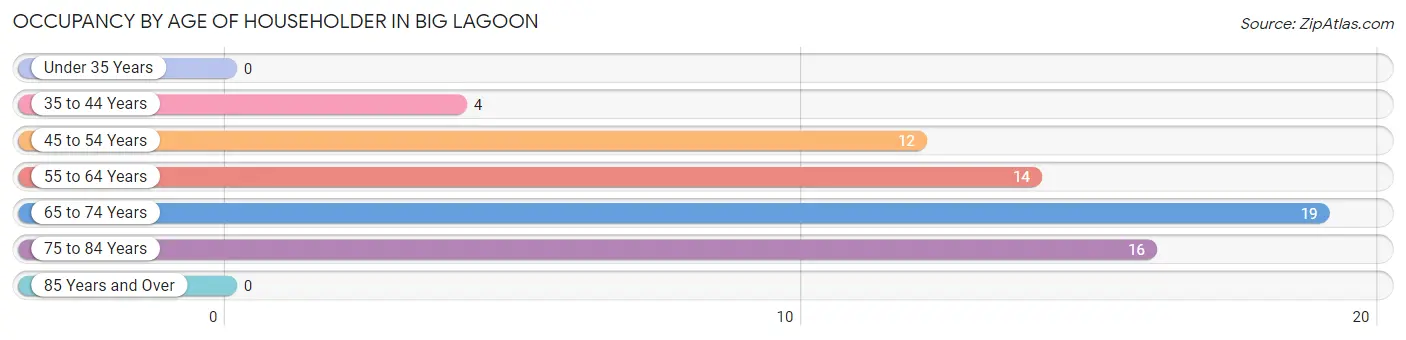
| Age Bracket | # Households | % Households |
| Under 35 Years | 0 | 0.0% |
| 35 to 44 Years | 4 | 6.1% |
| 45 to 54 Years | 12 | 18.5% |
| 55 to 64 Years | 14 | 21.5% |
| 65 to 74 Years | 19 | 29.2% |
| 75 to 84 Years | 16 | 24.6% |
| 85 Years and Over | 0 | 0.0% |
| Total | 65 | 100.0% |
Housing Finances in Big Lagoon
Median Income by Occupancy in Big Lagoon
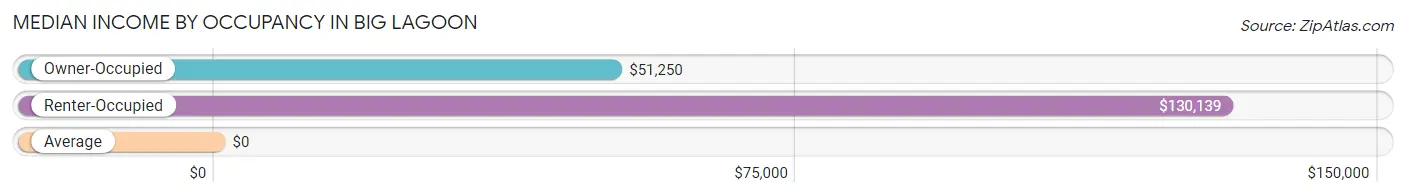
| Occupancy Type | # Households | Median Income |
| Owner-Occupied | 48 (73.9%) | $51,250 |
| Renter-Occupied | 17 (26.2%) | $130,139 |
| Average | 65 (100.0%) | $0 |
Occupancy by Householder Income Bracket in Big Lagoon
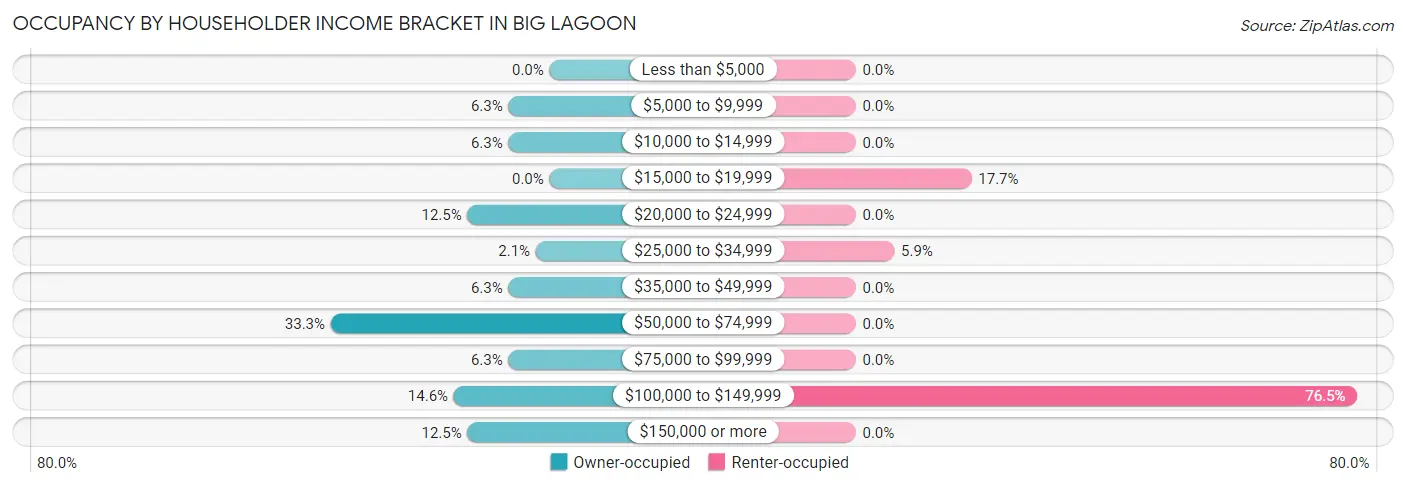
| Income Bracket | Owner-occupied | Renter-occupied |
| Less than $5,000 | 0 (0.0%) | 0 (0.0%) |
| $5,000 to $9,999 | 3 (6.2%) | 0 (0.0%) |
| $10,000 to $14,999 | 3 (6.2%) | 0 (0.0%) |
| $15,000 to $19,999 | 0 (0.0%) | 3 (17.6%) |
| $20,000 to $24,999 | 6 (12.5%) | 0 (0.0%) |
| $25,000 to $34,999 | 1 (2.1%) | 1 (5.9%) |
| $35,000 to $49,999 | 3 (6.2%) | 0 (0.0%) |
| $50,000 to $74,999 | 16 (33.3%) | 0 (0.0%) |
| $75,000 to $99,999 | 3 (6.2%) | 0 (0.0%) |
| $100,000 to $149,999 | 7 (14.6%) | 13 (76.5%) |
| $150,000 or more | 6 (12.5%) | 0 (0.0%) |
| Total | 48 (100.0%) | 17 (100.0%) |
Monthly Housing Cost Tiers in Big Lagoon
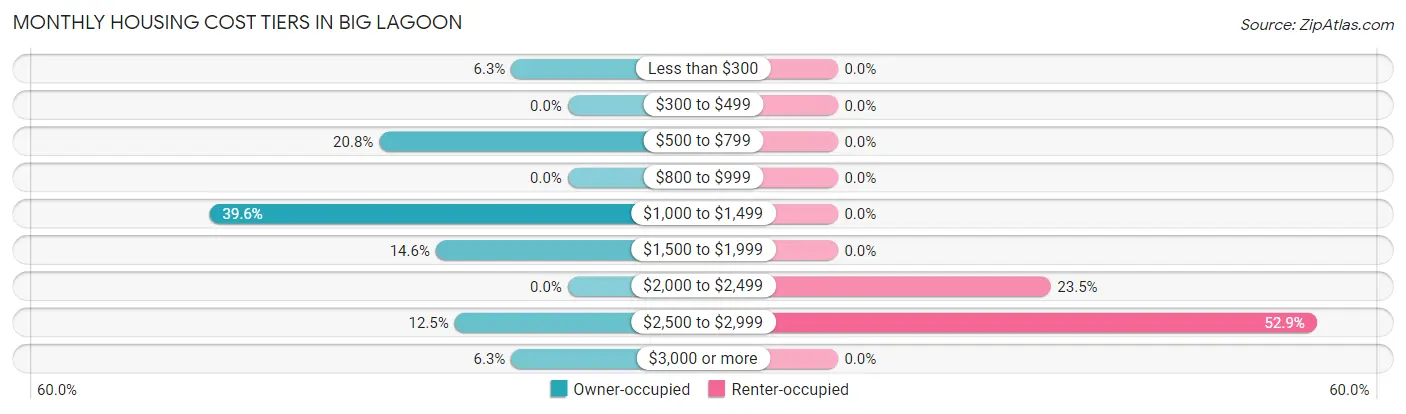
| Monthly Cost | Owner-occupied | Renter-occupied |
| Less than $300 | 3 (6.2%) | 0 (0.0%) |
| $300 to $499 | 0 (0.0%) | 0 (0.0%) |
| $500 to $799 | 10 (20.8%) | 0 (0.0%) |
| $800 to $999 | 0 (0.0%) | 0 (0.0%) |
| $1,000 to $1,499 | 19 (39.6%) | 0 (0.0%) |
| $1,500 to $1,999 | 7 (14.6%) | 0 (0.0%) |
| $2,000 to $2,499 | 0 (0.0%) | 4 (23.5%) |
| $2,500 to $2,999 | 6 (12.5%) | 9 (52.9%) |
| $3,000 or more | 3 (6.2%) | 0 (0.0%) |
| Total | 48 (100.0%) | 17 (100.0%) |
Physical Housing Characteristics in Big Lagoon
Housing Structures in Big Lagoon
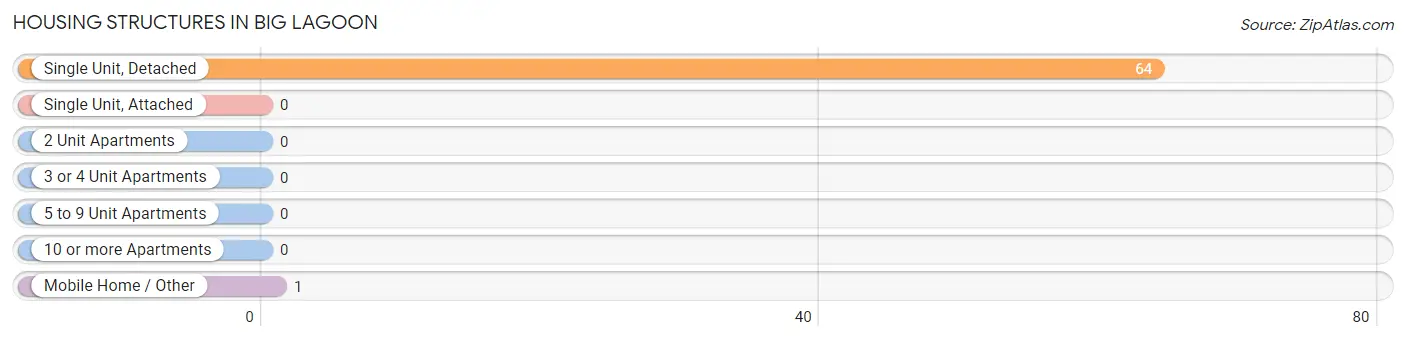
| Structure Type | # Housing Units | % Housing Units |
| Single Unit, Detached | 64 | 98.5% |
| Single Unit, Attached | 0 | 0.0% |
| 2 Unit Apartments | 0 | 0.0% |
| 3 or 4 Unit Apartments | 0 | 0.0% |
| 5 to 9 Unit Apartments | 0 | 0.0% |
| 10 or more Apartments | 0 | 0.0% |
| Mobile Home / Other | 1 | 1.5% |
| Total | 65 | 100.0% |
Housing Structures by Occupancy in Big Lagoon

| Structure Type | Owner-occupied | Renter-occupied |
| Single Unit, Detached | 48 (75.0%) | 16 (25.0%) |
| Single Unit, Attached | 0 (0.0%) | 0 (0.0%) |
| 2 Unit Apartments | 0 (0.0%) | 0 (0.0%) |
| 3 or 4 Unit Apartments | 0 (0.0%) | 0 (0.0%) |
| 5 to 9 Unit Apartments | 0 (0.0%) | 0 (0.0%) |
| 10 or more Apartments | 0 (0.0%) | 0 (0.0%) |
| Mobile Home / Other | 0 (0.0%) | 1 (100.0%) |
| Total | 48 (73.9%) | 17 (26.2%) |
Housing Structures by Number of Rooms in Big Lagoon
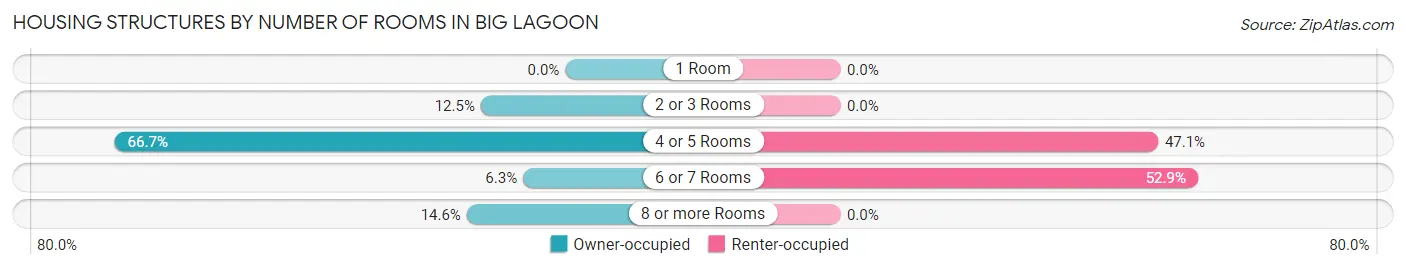
| Number of Rooms | Owner-occupied | Renter-occupied |
| 1 Room | 0 (0.0%) | 0 (0.0%) |
| 2 or 3 Rooms | 6 (12.5%) | 0 (0.0%) |
| 4 or 5 Rooms | 32 (66.7%) | 8 (47.1%) |
| 6 or 7 Rooms | 3 (6.2%) | 9 (52.9%) |
| 8 or more Rooms | 7 (14.6%) | 0 (0.0%) |
| Total | 48 (100.0%) | 17 (100.0%) |
Housing Structure by Heating Type in Big Lagoon
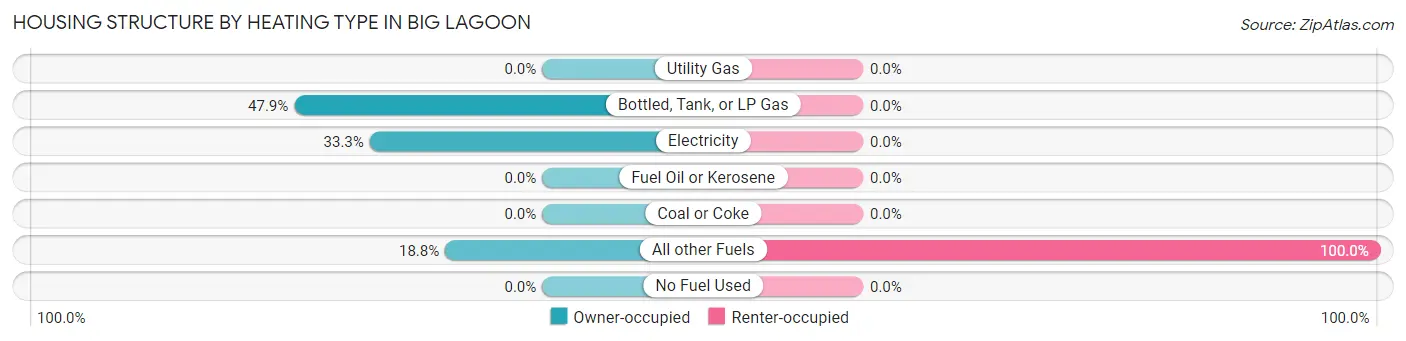
| Heating Type | Owner-occupied | Renter-occupied |
| Utility Gas | 0 (0.0%) | 0 (0.0%) |
| Bottled, Tank, or LP Gas | 23 (47.9%) | 0 (0.0%) |
| Electricity | 16 (33.3%) | 0 (0.0%) |
| Fuel Oil or Kerosene | 0 (0.0%) | 0 (0.0%) |
| Coal or Coke | 0 (0.0%) | 0 (0.0%) |
| All other Fuels | 9 (18.8%) | 17 (100.0%) |
| No Fuel Used | 0 (0.0%) | 0 (0.0%) |
| Total | 48 (100.0%) | 17 (100.0%) |
Household Vehicle Usage in Big Lagoon
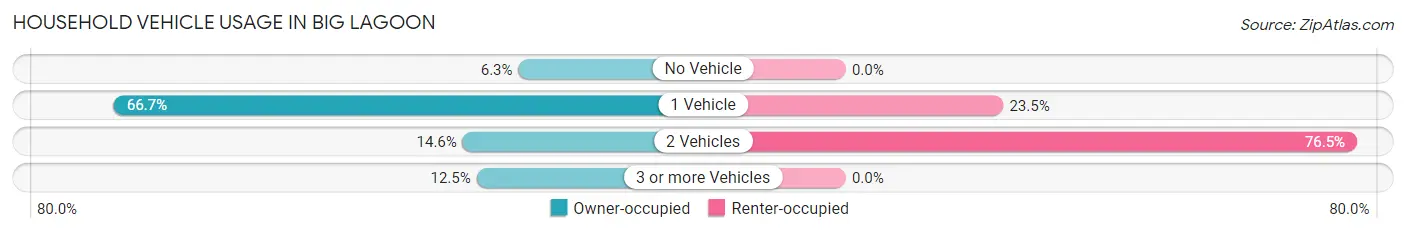
| Vehicles per Household | Owner-occupied | Renter-occupied |
| No Vehicle | 3 (6.2%) | 0 (0.0%) |
| 1 Vehicle | 32 (66.7%) | 4 (23.5%) |
| 2 Vehicles | 7 (14.6%) | 13 (76.5%) |
| 3 or more Vehicles | 6 (12.5%) | 0 (0.0%) |
| Total | 48 (100.0%) | 17 (100.0%) |
Real Estate & Mortgages in Big Lagoon
Real Estate and Mortgage Overview in Big Lagoon
| Characteristic | Without Mortgage | With Mortgage |
| Housing Units | 16 | 32 |
| Median Property Value | $483,300 | $469,600 |
| Median Household Income | - | - |
| Monthly Housing Costs | $556 | $3 |
| Real Estate Taxes | $4,333 | $0 |
Property Value by Mortgage Status in Big Lagoon
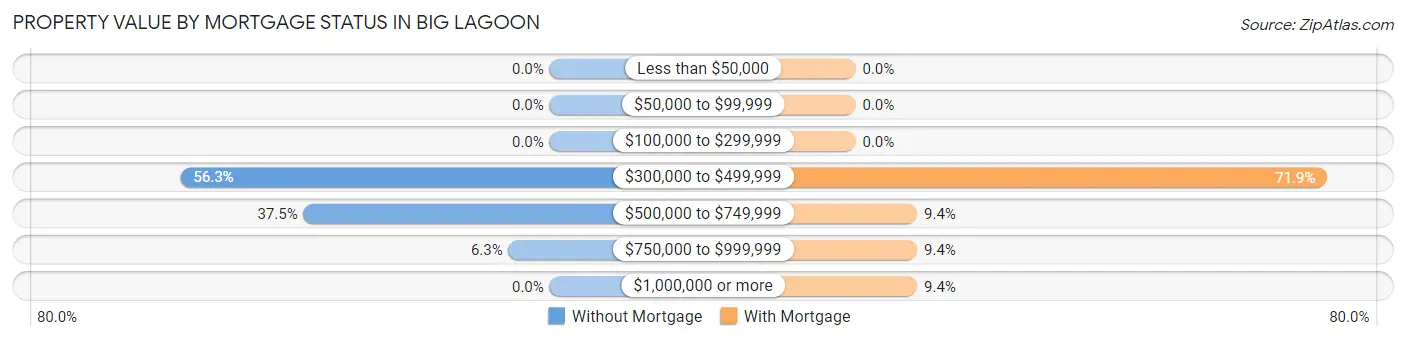
| Property Value | Without Mortgage | With Mortgage |
| Less than $50,000 | 0 (0.0%) | 0 (0.0%) |
| $50,000 to $99,999 | 0 (0.0%) | 0 (0.0%) |
| $100,000 to $299,999 | 0 (0.0%) | 0 (0.0%) |
| $300,000 to $499,999 | 9 (56.2%) | 23 (71.9%) |
| $500,000 to $749,999 | 6 (37.5%) | 3 (9.4%) |
| $750,000 to $999,999 | 1 (6.2%) | 3 (9.4%) |
| $1,000,000 or more | 0 (0.0%) | 3 (9.4%) |
| Total | 16 (100.0%) | 32 (100.0%) |
Household Income by Mortgage Status in Big Lagoon
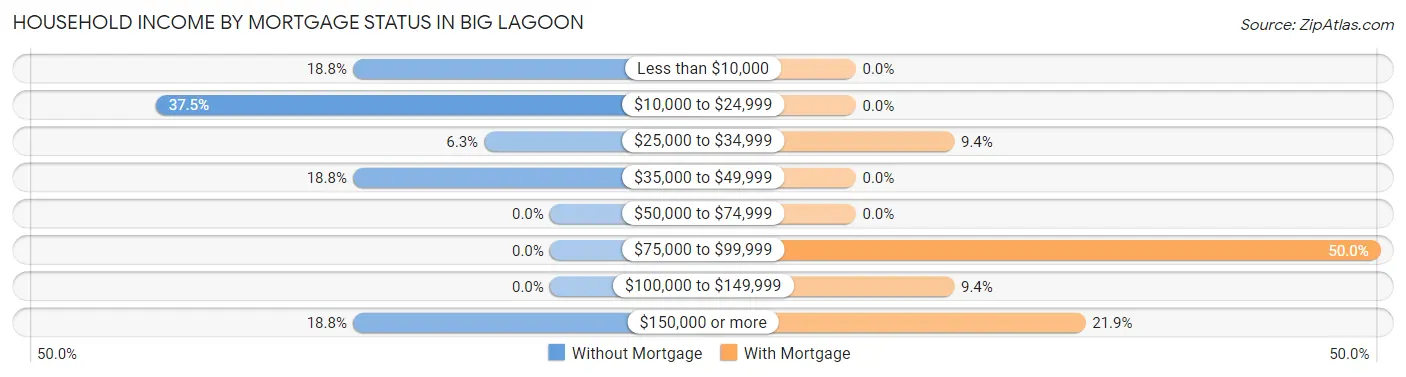
| Household Income | Without Mortgage | With Mortgage |
| Less than $10,000 | 3 (18.8%) | 0 (0.0%) |
| $10,000 to $24,999 | 6 (37.5%) | 0 (0.0%) |
| $25,000 to $34,999 | 1 (6.2%) | 3 (9.4%) |
| $35,000 to $49,999 | 3 (18.8%) | 0 (0.0%) |
| $50,000 to $74,999 | 0 (0.0%) | 0 (0.0%) |
| $75,000 to $99,999 | 0 (0.0%) | 16 (50.0%) |
| $100,000 to $149,999 | 0 (0.0%) | 3 (9.4%) |
| $150,000 or more | 3 (18.8%) | 7 (21.9%) |
| Total | 16 (100.0%) | 32 (100.0%) |
Property Value to Household Income Ratio in Big Lagoon
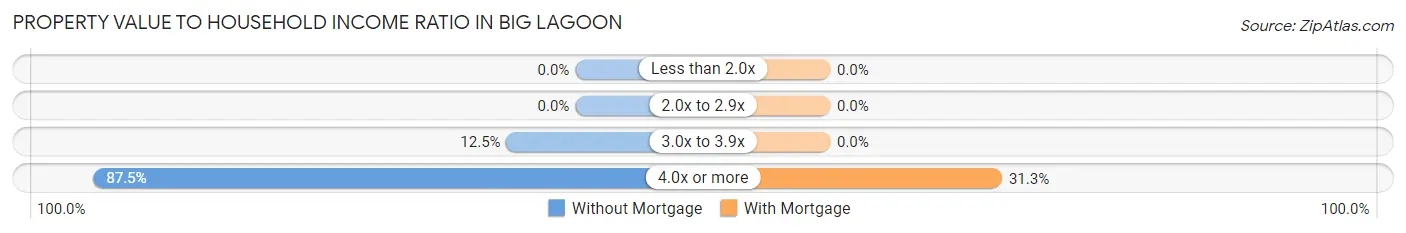
| Value-to-Income Ratio | Without Mortgage | With Mortgage |
| Less than 2.0x | 0 (0.0%) | 0 (0.0%) |
| 2.0x to 2.9x | 0 (0.0%) | 0 (0.0%) |
| 3.0x to 3.9x | 2 (12.5%) | 0 (0.0%) |
| 4.0x or more | 14 (87.5%) | 10 (31.2%) |
| Total | 16 (100.0%) | 32 (100.0%) |
Real Estate Taxes by Mortgage Status in Big Lagoon
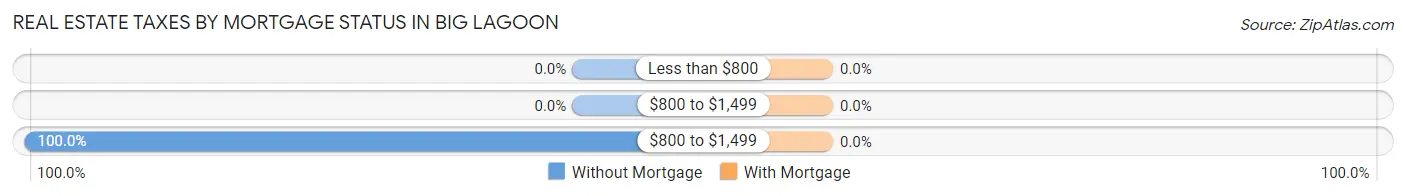
| Property Taxes | Without Mortgage | With Mortgage |
| Less than $800 | 0 (0.0%) | 0 (0.0%) |
| $800 to $1,499 | 0 (0.0%) | 0 (0.0%) |
| $800 to $1,499 | 16 (100.0%) | 0 (0.0%) |
| Total | 16 (100.0%) | 32 (100.0%) |
Health & Disability in Big Lagoon
Health Insurance Coverage by Age in Big Lagoon
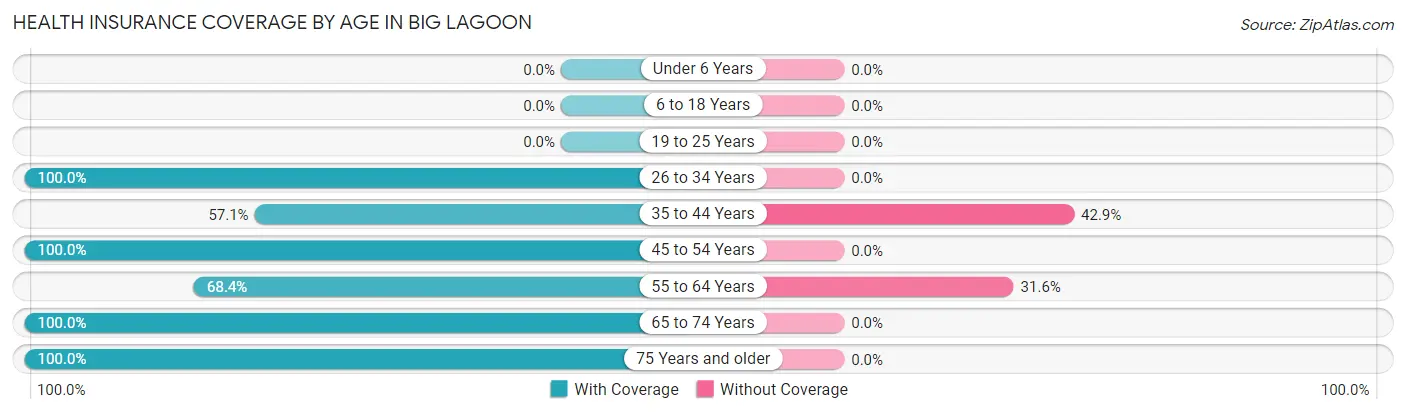
| Age Bracket | With Coverage | Without Coverage |
| Under 6 Years | 0 (0.0%) | 0 (0.0%) |
| 6 to 18 Years | 0 (0.0%) | 0 (0.0%) |
| 19 to 25 Years | 0 (0.0%) | 0 (0.0%) |
| 26 to 34 Years | 7 (100.0%) | 0 (0.0%) |
| 35 to 44 Years | 4 (57.1%) | 3 (42.9%) |
| 45 to 54 Years | 23 (100.0%) | 0 (0.0%) |
| 55 to 64 Years | 13 (68.4%) | 6 (31.6%) |
| 65 to 74 Years | 28 (100.0%) | 0 (0.0%) |
| 75 Years and older | 16 (100.0%) | 0 (0.0%) |
| Total | 91 (91.0%) | 9 (9.0%) |
Health Insurance Coverage by Citizenship Status in Big Lagoon
| Citizenship Status | With Coverage | Without Coverage |
| Native Born | 0 (0.0%) | 0 (0.0%) |
| Foreign Born, Citizen | 0 (0.0%) | 0 (0.0%) |
| Foreign Born, not a Citizen | 0 (0.0%) | 0 (0.0%) |
Health Insurance Coverage by Household Income in Big Lagoon
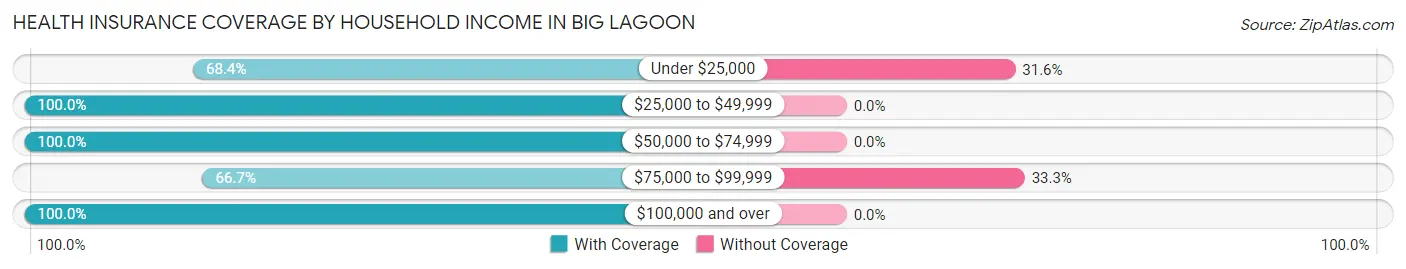
| Household Income | With Coverage | Without Coverage |
| Under $25,000 | 13 (68.4%) | 6 (31.6%) |
| $25,000 to $49,999 | 13 (100.0%) | 0 (0.0%) |
| $50,000 to $74,999 | 16 (100.0%) | 0 (0.0%) |
| $75,000 to $99,999 | 6 (66.7%) | 3 (33.3%) |
| $100,000 and over | 43 (100.0%) | 0 (0.0%) |
Public vs Private Health Insurance Coverage by Age in Big Lagoon
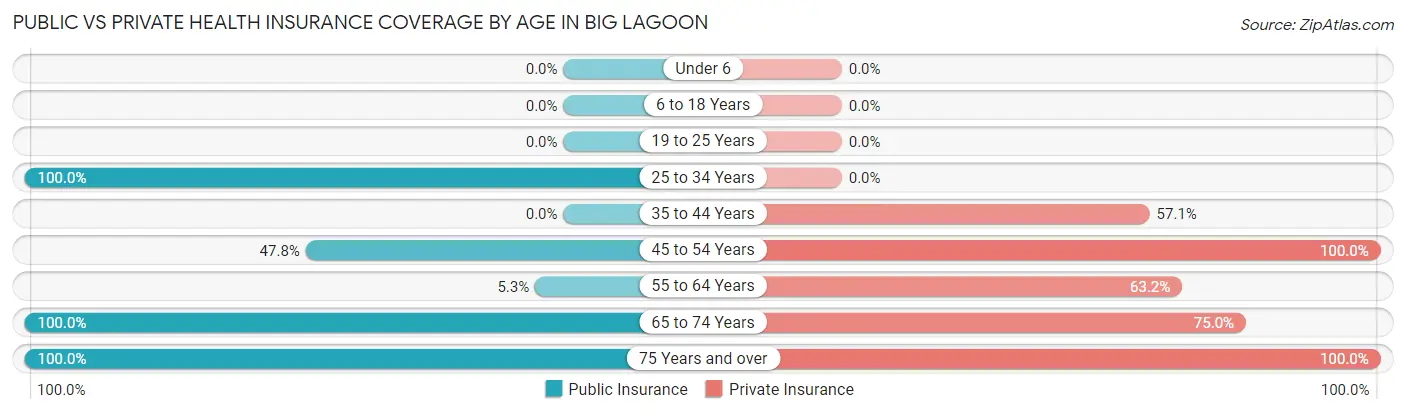
| Age Bracket | Public Insurance | Private Insurance |
| Under 6 | 0 (0.0%) | 0 (0.0%) |
| 6 to 18 Years | 0 (0.0%) | 0 (0.0%) |
| 19 to 25 Years | 0 (0.0%) | 0 (0.0%) |
| 25 to 34 Years | 7 (100.0%) | 0 (0.0%) |
| 35 to 44 Years | 0 (0.0%) | 4 (57.1%) |
| 45 to 54 Years | 11 (47.8%) | 23 (100.0%) |
| 55 to 64 Years | 1 (5.3%) | 12 (63.2%) |
| 65 to 74 Years | 28 (100.0%) | 21 (75.0%) |
| 75 Years and over | 16 (100.0%) | 16 (100.0%) |
| Total | 63 (63.0%) | 76 (76.0%) |
Disability Status by Sex by Age in Big Lagoon
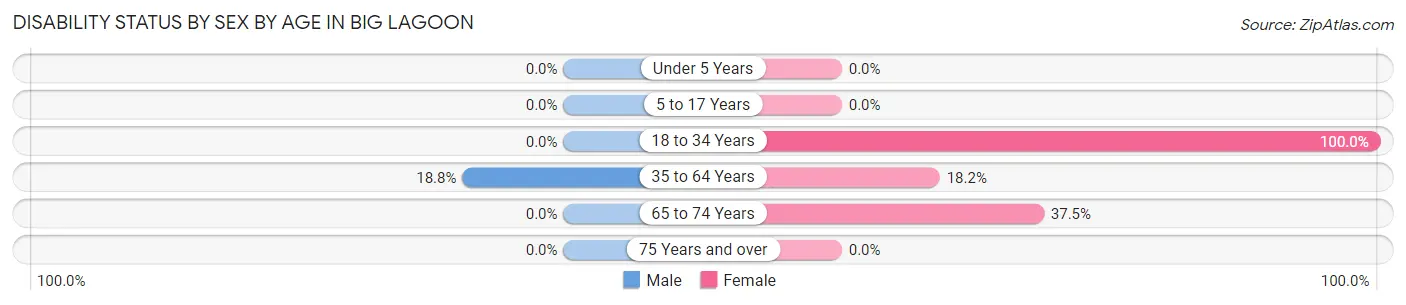
| Age Bracket | Male | Female |
| Under 5 Years | 0 (0.0%) | 0 (0.0%) |
| 5 to 17 Years | 0 (0.0%) | 0 (0.0%) |
| 18 to 34 Years | 0 (0.0%) | 4 (100.0%) |
| 35 to 64 Years | 3 (18.8%) | 6 (18.2%) |
| 65 to 74 Years | 0 (0.0%) | 3 (37.5%) |
| 75 Years and over | 0 (0.0%) | 0 (0.0%) |
Disability Class by Sex by Age in Big Lagoon
Disability Class: Hearing Difficulty
| Age Bracket | Male | Female |
| Under 5 Years | 0 (0.0%) | 0 (0.0%) |
| 5 to 17 Years | 0 (0.0%) | 0 (0.0%) |
| 18 to 34 Years | 0 (0.0%) | 0 (0.0%) |
| 35 to 64 Years | 0 (0.0%) | 0 (0.0%) |
| 65 to 74 Years | 0 (0.0%) | 0 (0.0%) |
| 75 Years and over | 0 (0.0%) | 0 (0.0%) |
Disability Class: Vision Difficulty
| Age Bracket | Male | Female |
| Under 5 Years | 0 (0.0%) | 0 (0.0%) |
| 5 to 17 Years | 0 (0.0%) | 0 (0.0%) |
| 18 to 34 Years | 0 (0.0%) | 0 (0.0%) |
| 35 to 64 Years | 0 (0.0%) | 0 (0.0%) |
| 65 to 74 Years | 0 (0.0%) | 0 (0.0%) |
| 75 Years and over | 0 (0.0%) | 0 (0.0%) |
Disability Class: Cognitive Difficulty
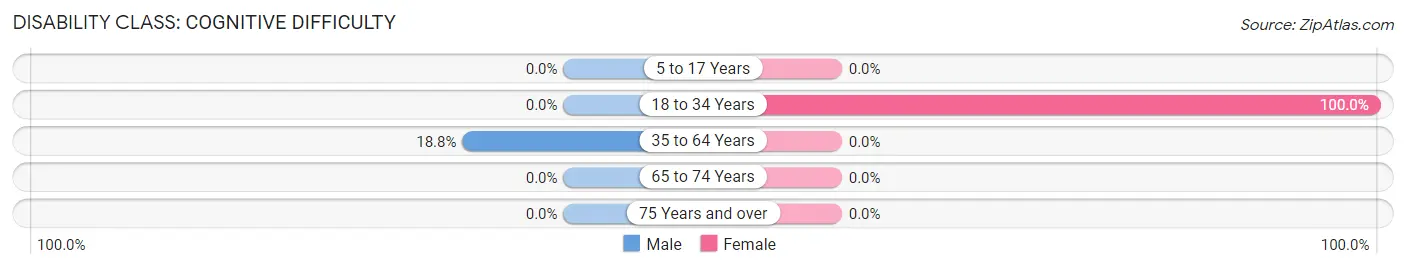
| Age Bracket | Male | Female |
| 5 to 17 Years | 0 (0.0%) | 0 (0.0%) |
| 18 to 34 Years | 0 (0.0%) | 4 (100.0%) |
| 35 to 64 Years | 3 (18.8%) | 0 (0.0%) |
| 65 to 74 Years | 0 (0.0%) | 0 (0.0%) |
| 75 Years and over | 0 (0.0%) | 0 (0.0%) |
Disability Class: Ambulatory Difficulty
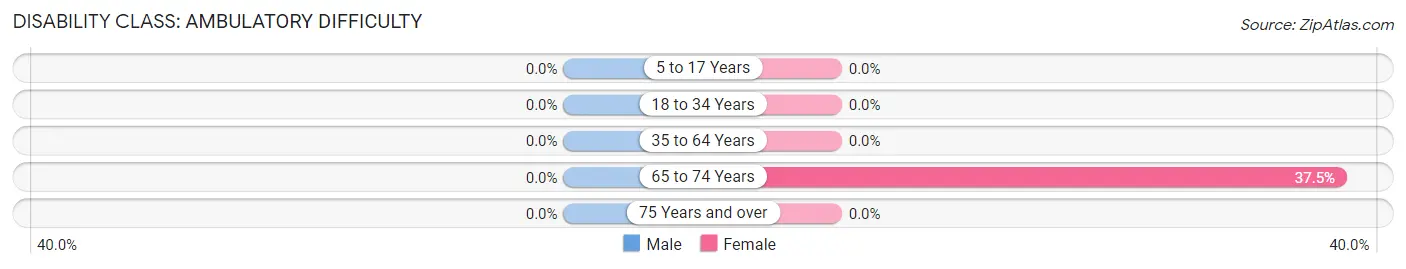
| Age Bracket | Male | Female |
| 5 to 17 Years | 0 (0.0%) | 0 (0.0%) |
| 18 to 34 Years | 0 (0.0%) | 0 (0.0%) |
| 35 to 64 Years | 0 (0.0%) | 0 (0.0%) |
| 65 to 74 Years | 0 (0.0%) | 3 (37.5%) |
| 75 Years and over | 0 (0.0%) | 0 (0.0%) |
Disability Class: Self-Care Difficulty
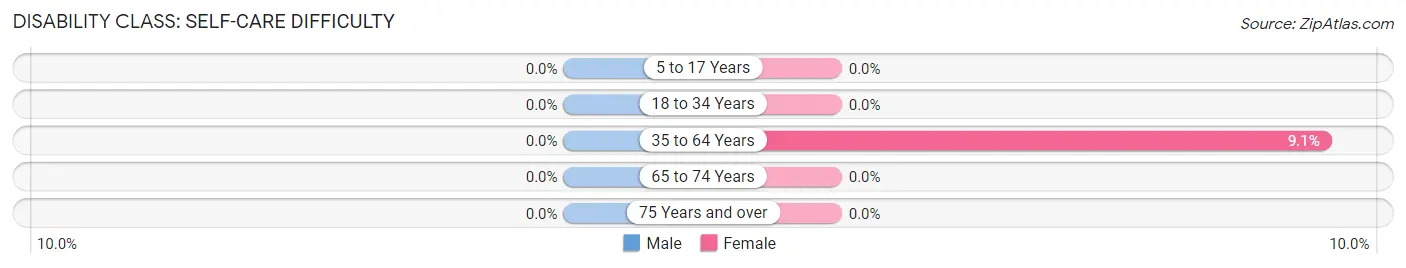
| Age Bracket | Male | Female |
| 5 to 17 Years | 0 (0.0%) | 0 (0.0%) |
| 18 to 34 Years | 0 (0.0%) | 0 (0.0%) |
| 35 to 64 Years | 0 (0.0%) | 3 (9.1%) |
| 65 to 74 Years | 0 (0.0%) | 0 (0.0%) |
| 75 Years and over | 0 (0.0%) | 0 (0.0%) |
Technology Access in Big Lagoon
Computing Device Access in Big Lagoon
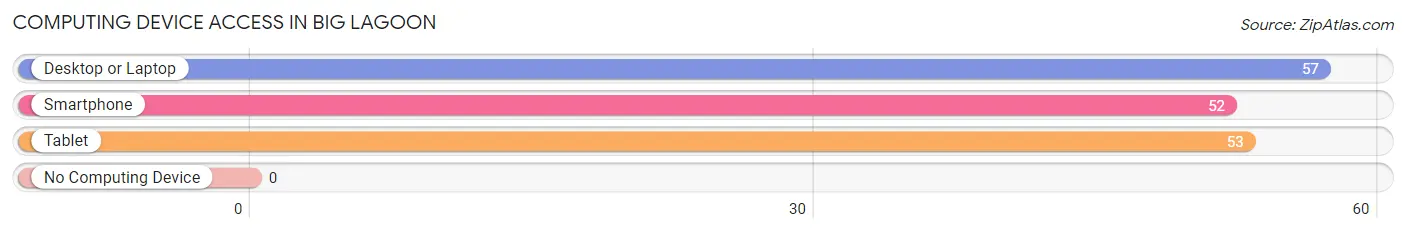
| Device Type | # Households | % Households |
| Desktop or Laptop | 57 | 87.7% |
| Smartphone | 52 | 80.0% |
| Tablet | 53 | 81.5% |
| No Computing Device | 0 | 0.0% |
| Total | 65 | 100.0% |
Internet Access in Big Lagoon
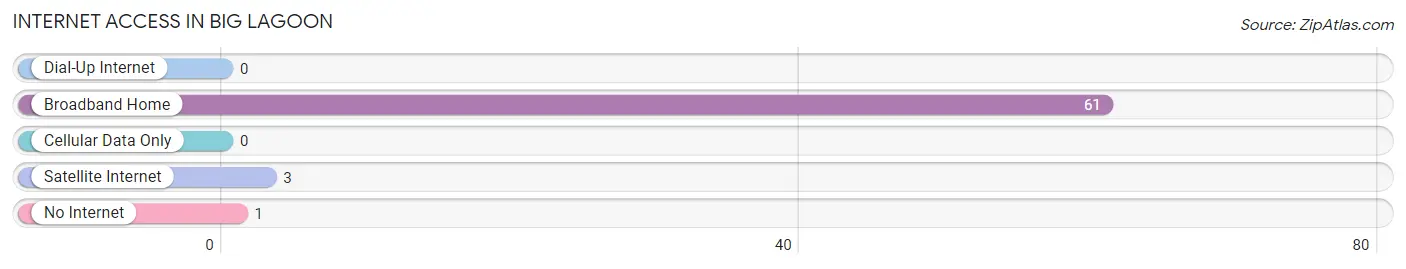
| Internet Type | # Households | % Households |
| Dial-Up Internet | 0 | 0.0% |
| Broadband Home | 61 | 93.9% |
| Cellular Data Only | 0 | 0.0% |
| Satellite Internet | 3 | 4.6% |
| No Internet | 1 | 1.5% |
| Total | 65 | 100.0% |
Big Lagoon Summary
Big Lagoon is a census-designated place located in Humboldt County, California. It is situated on the northern coast of California, approximately 20 miles north of Eureka. The population of Big Lagoon was 1,093 at the 2010 census.
History
Big Lagoon was originally inhabited by the Wiyot people, who lived in the area for thousands of years before the arrival of European settlers. The Wiyot people were a hunter-gatherer society that relied on the abundance of fish, shellfish, and other resources found in the lagoon.
In the late 19th century, the area was settled by European settlers, who established a fishing and logging industry in the area. The town of Big Lagoon was officially established in 1892.
Geography
Big Lagoon is located at 40°45'N 124°14'W. It is situated on the northern coast of California, approximately 20 miles north of Eureka. The town is surrounded by the Big Lagoon, a large estuary that is fed by several small streams. The lagoon is home to a variety of wildlife, including fish, birds, and mammals.
The town is located in a temperate rainforest climate, with mild temperatures year-round. The average annual precipitation is approximately 50 inches.
Economy
The economy of Big Lagoon is largely based on fishing and tourism. The town is home to several commercial fishing operations, which harvest a variety of fish, shellfish, and other marine life from the lagoon. The town also has a number of tourist attractions, including a marina, a beach, and a campground.
Demographics
As of the 2010 census, the population of Big Lagoon was 1,093. The racial makeup of the town was 94.3% White, 0.7% African American, 0.7% Native American, 0.7% Asian, 0.3% Pacific Islander, 0.7% from other races, and 2.3% from two or more races. Hispanic or Latino of any race were 3.3% of the population.
The median income for a household in Big Lagoon was $37,500, and the median income for a family was $41,250. The per capita income for the town was $19,945. About 11.3% of families and 14.3% of the population were below the poverty line, including 18.2% of those under age 18 and none of those age 65 or over.
Common Questions
What is Per Capita Income in Big Lagoon?
Per Capita income in Big Lagoon is $50,547.
What is Inequality or Gini Index in Big Lagoon?
Inequality or Gini Index in Big Lagoon is 0.37.
What is the Total Population of Big Lagoon?
Total Population of Big Lagoon is 104.
What is the Total Male Population of Big Lagoon?
Total Male Population of Big Lagoon is 43.
What is the Total Female Population of Big Lagoon?
Total Female Population of Big Lagoon is 61.
What is the Ratio of Males per 100 Females in Big Lagoon?
There are 70.49 Males per 100 Females in Big Lagoon.
What is the Ratio of Females per 100 Males in Big Lagoon?
There are 141.86 Females per 100 Males in Big Lagoon.
What is the Median Population Age in Big Lagoon?
Median Population Age in Big Lagoon is 61.6 Years.
What is the Average Family Size in Big Lagoon
Average Family Size in Big Lagoon is 2.4 People.
What is the Average Household Size in Big Lagoon
Average Household Size in Big Lagoon is 1.6 People.
How Large is the Labor Force in Big Lagoon?
There are 37 People in the Labor Forcein in Big Lagoon.
What is the Percentage of People in the Labor Force in Big Lagoon?
35.6% of People are in the Labor Force in Big Lagoon.