March ARB, CA Map & Demographics
March ARB Map
March ARB Overview
$36,324
PER CAPITA INCOME
$92,670
AVG FAMILY INCOME
$82,375
AVG HOUSEHOLD INCOME
0.45
INEQUALITY / GINI INDEX
1,175
TOTAL POPULATION
572
MALE POPULATION
603
FEMALE POPULATION
94.86
MALES / 100 FEMALES
105.42
FEMALES / 100 MALES
38.6
MEDIAN AGE
3.2
AVG FAMILY SIZE
2.2
AVG HOUSEHOLD SIZE
224
LABOR FORCE [ PEOPLE ]
26.0%
PERCENT IN LABOR FORCE
March ARB Area Codes
Income in March ARB
Income Overview in March ARB
Per Capita Income in March ARB is $36,324, while median incomes of families and households are $92,670 and $82,375 respectively.
| Characteristic | Number | Measure |
| Per Capita Income | 1,175 | $36,324 |
| Median Family Income | 201 | $92,670 |
| Mean Family Income | 201 | $100,228 |
| Median Household Income | 515 | $82,375 |
| Mean Household Income | 515 | $81,111 |
| Income Deficit | 201 | $0 |
| Wage / Income Gap (%) | 1,175 | 0.00% |
| Wage / Income Gap ($) | 1,175 | 100.00¢ per $1 |
| Gini / Inequality Index | 1,175 | 0.45 |
Earnings by Sex in March ARB
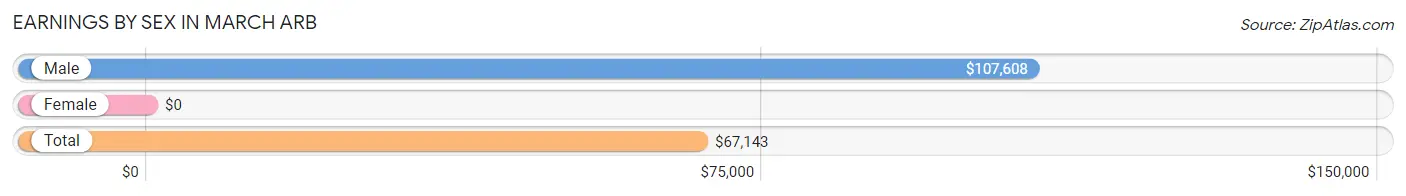
| Sex | Number | Average Earnings |
| Male | 167 (69.0%) | $107,608 |
| Female | 75 (31.0%) | $0 |
| Total | 242 (100.0%) | $67,143 |
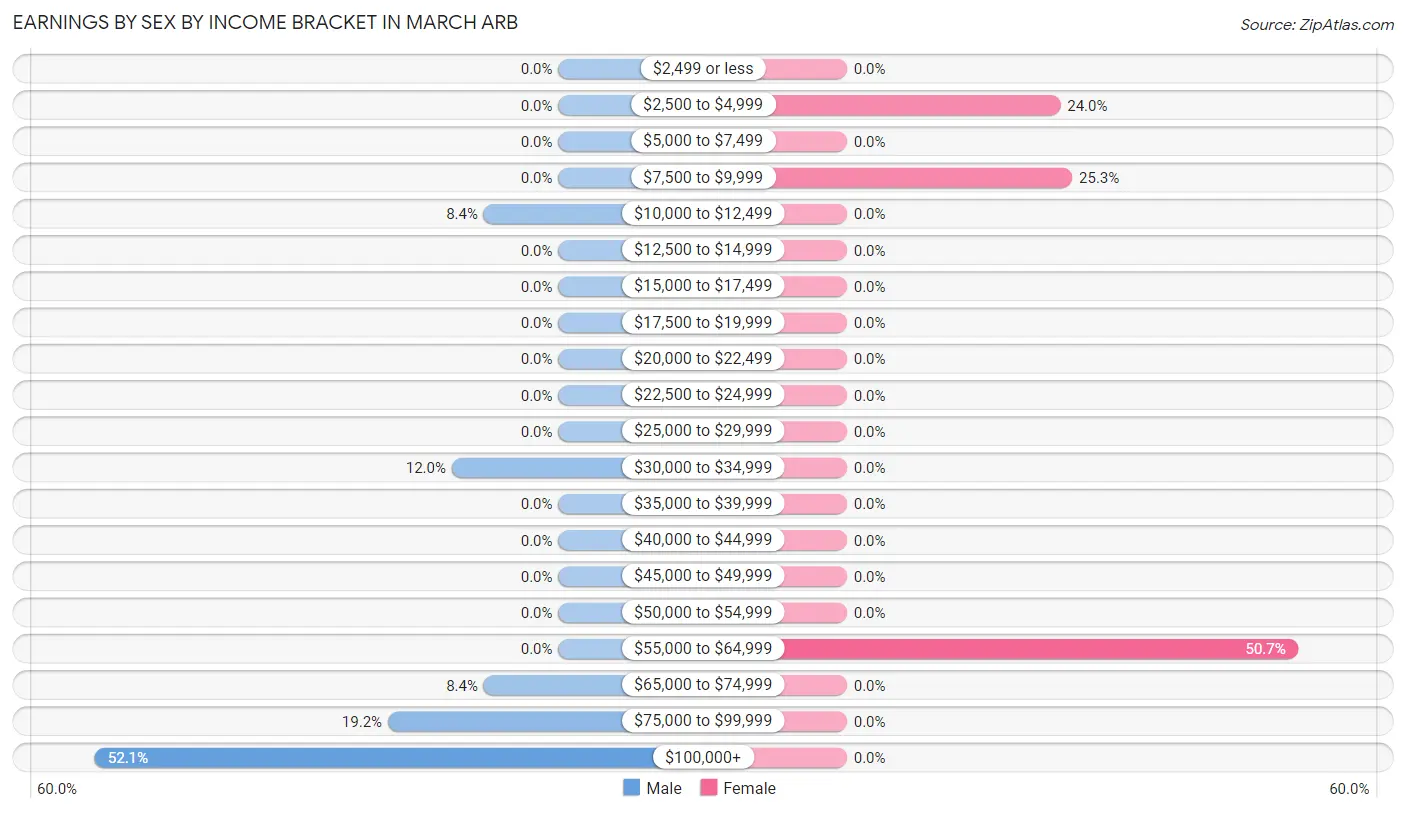
Earnings by Sex by Income Bracket in March ARB
The most common earnings brackets in March ARB are $100,000+ for men (87 | 52.1%) and $55,000 to $64,999 for women (38 | 50.7%).
| Income | Male | Female |
| $2,499 or less | 0 (0.0%) | 0 (0.0%) |
| $2,500 to $4,999 | 0 (0.0%) | 18 (24.0%) |
| $5,000 to $7,499 | 0 (0.0%) | 0 (0.0%) |
| $7,500 to $9,999 | 0 (0.0%) | 19 (25.3%) |
| $10,000 to $12,499 | 14 (8.4%) | 0 (0.0%) |
| $12,500 to $14,999 | 0 (0.0%) | 0 (0.0%) |
| $15,000 to $17,499 | 0 (0.0%) | 0 (0.0%) |
| $17,500 to $19,999 | 0 (0.0%) | 0 (0.0%) |
| $20,000 to $22,499 | 0 (0.0%) | 0 (0.0%) |
| $22,500 to $24,999 | 0 (0.0%) | 0 (0.0%) |
| $25,000 to $29,999 | 0 (0.0%) | 0 (0.0%) |
| $30,000 to $34,999 | 20 (12.0%) | 0 (0.0%) |
| $35,000 to $39,999 | 0 (0.0%) | 0 (0.0%) |
| $40,000 to $44,999 | 0 (0.0%) | 0 (0.0%) |
| $45,000 to $49,999 | 0 (0.0%) | 0 (0.0%) |
| $50,000 to $54,999 | 0 (0.0%) | 0 (0.0%) |
| $55,000 to $64,999 | 0 (0.0%) | 38 (50.7%) |
| $65,000 to $74,999 | 14 (8.4%) | 0 (0.0%) |
| $75,000 to $99,999 | 32 (19.2%) | 0 (0.0%) |
| $100,000+ | 87 (52.1%) | 0 (0.0%) |
| Total | 167 (100.0%) | 75 (100.0%) |
Earnings by Sex by Educational Attainment in March ARB
| Educational Attainment | Male Income | Female Income |
| Less than High School | - | - |
| High School Diploma | - | - |
| College or Associate's Degree | - | - |
| Bachelor's Degree | - | - |
| Graduate Degree | - | - |
| Total | $107,608 | $55,625 |
Family Income in March ARB
Family Income Brackets in March ARB
According to the March ARB family income data, there are 55 families falling into the $100,000 to $149,999 income range, which is the most common income bracket and makes up 27.4% of all families.
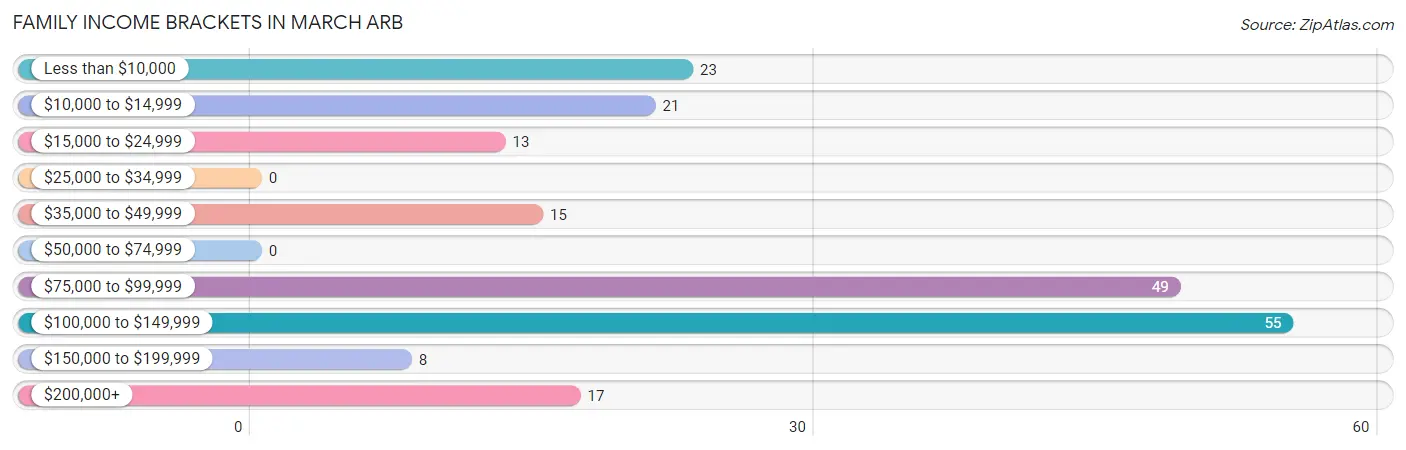
| Income Bracket | # Families | % Families |
| Less than $10,000 | 23 | 11.4% |
| $10,000 to $14,999 | 21 | 10.4% |
| $15,000 to $24,999 | 13 | 6.5% |
| $25,000 to $34,999 | 0 | 0.0% |
| $35,000 to $49,999 | 15 | 7.5% |
| $50,000 to $74,999 | 0 | 0.0% |
| $75,000 to $99,999 | 49 | 24.4% |
| $100,000 to $149,999 | 55 | 27.4% |
| $150,000 to $199,999 | 8 | 4.0% |
| $200,000+ | 17 | 8.5% |
Family Income by Famaliy Size in March ARB
2-person families (89 | 44.3%) account for the highest median family income in March ARB with $125,781 per family, while 2-person families (89 | 44.3%) have the highest median income of $62,890 per family member.
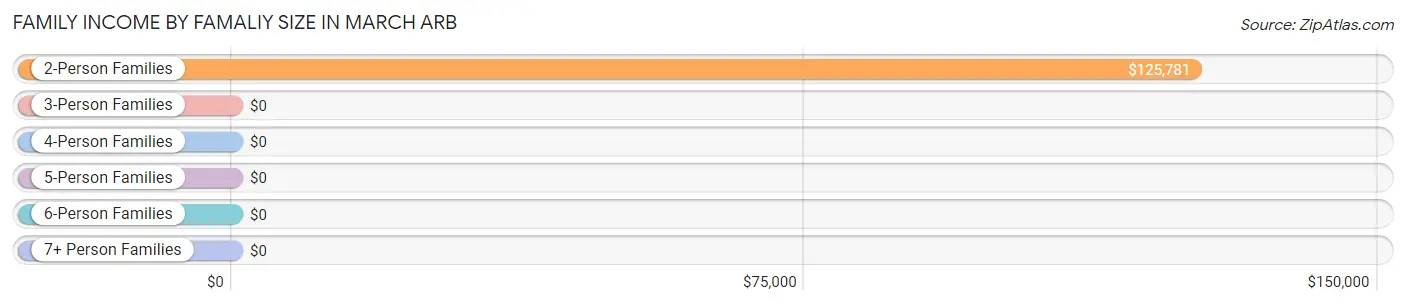
| Income Bracket | # Families | Median Income |
| 2-Person Families | 89 (44.3%) | $125,781 |
| 3-Person Families | 23 (11.4%) | $0 |
| 4-Person Families | 56 (27.9%) | $0 |
| 5-Person Families | 33 (16.4%) | $0 |
| 6-Person Families | 0 (0.0%) | $0 |
| 7+ Person Families | 0 (0.0%) | $0 |
| Total | 201 (100.0%) | $92,670 |
Family Income by Number of Earners in March ARB
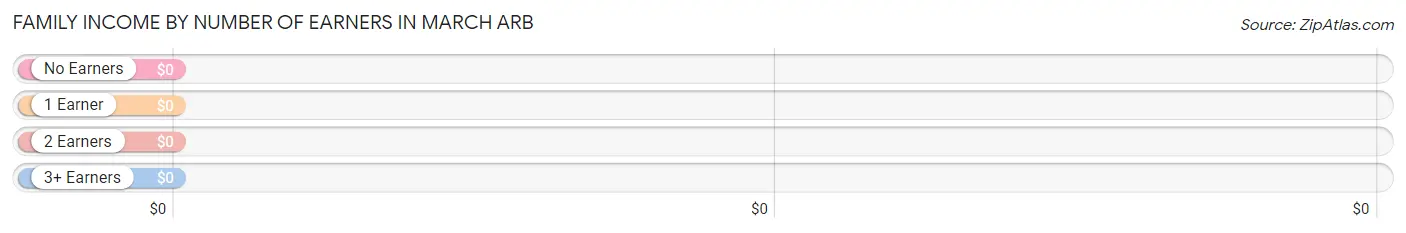
| Number of Earners | # Families | Median Income |
| No Earners | 132 (65.7%) | $0 |
| 1 Earner | 31 (15.4%) | $0 |
| 2 Earners | 38 (18.9%) | $0 |
| 3+ Earners | 0 (0.0%) | $0 |
| Total | 201 (100.0%) | $92,670 |
Household Income in March ARB
Household Income Brackets in March ARB
With 176 households falling in the category, the $100,000 to $149,999 income range is the most frequent in March ARB, accounting for 34.2% of all households. In contrast, only 8 households (1.5%) fall into the $150,000 to $199,999 income bracket, making it the least populous group.
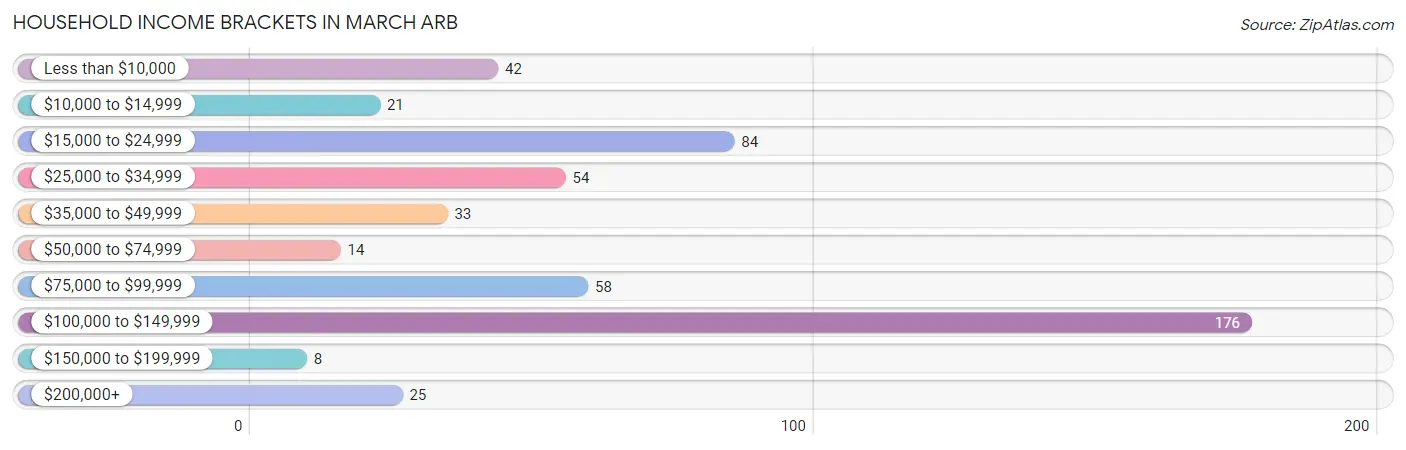
| Income Bracket | # Households | % Households |
| Less than $10,000 | 42 | 8.2% |
| $10,000 to $14,999 | 21 | 4.1% |
| $15,000 to $24,999 | 84 | 16.3% |
| $25,000 to $34,999 | 54 | 10.5% |
| $35,000 to $49,999 | 33 | 6.4% |
| $50,000 to $74,999 | 14 | 2.7% |
| $75,000 to $99,999 | 58 | 11.3% |
| $100,000 to $149,999 | 176 | 34.2% |
| $150,000 to $199,999 | 8 | 1.6% |
| $200,000+ | 25 | 4.9% |
Household Income by Householder Age in March ARB
The median household income in March ARB is $82,375, with the highest median household income of $94,943 found in the 25 to 44 years age bracket for the primary householder. A total of 163 households (31.7%) fall into this category.
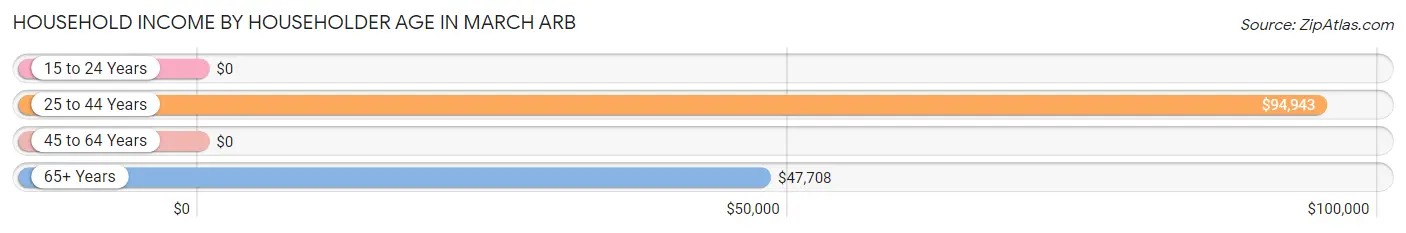
| Income Bracket | # Households | Median Income |
| 15 to 24 Years | 0 (0.0%) | $0 |
| 25 to 44 Years | 163 (31.7%) | $94,943 |
| 45 to 64 Years | 69 (13.4%) | $0 |
| 65+ Years | 283 (54.9%) | $47,708 |
| Total | 515 (100.0%) | $82,375 |
Poverty in March ARB
Income Below Poverty by Sex and Age in March ARB
With 14.2% poverty level for males and 43.3% for females among the residents of March ARB, 25 to 34 year old males and under 5 year old females are the most vulnerable to poverty, with 23 males (100.0%) and 25 females (100.0%) in their respective age groups living below the poverty level.
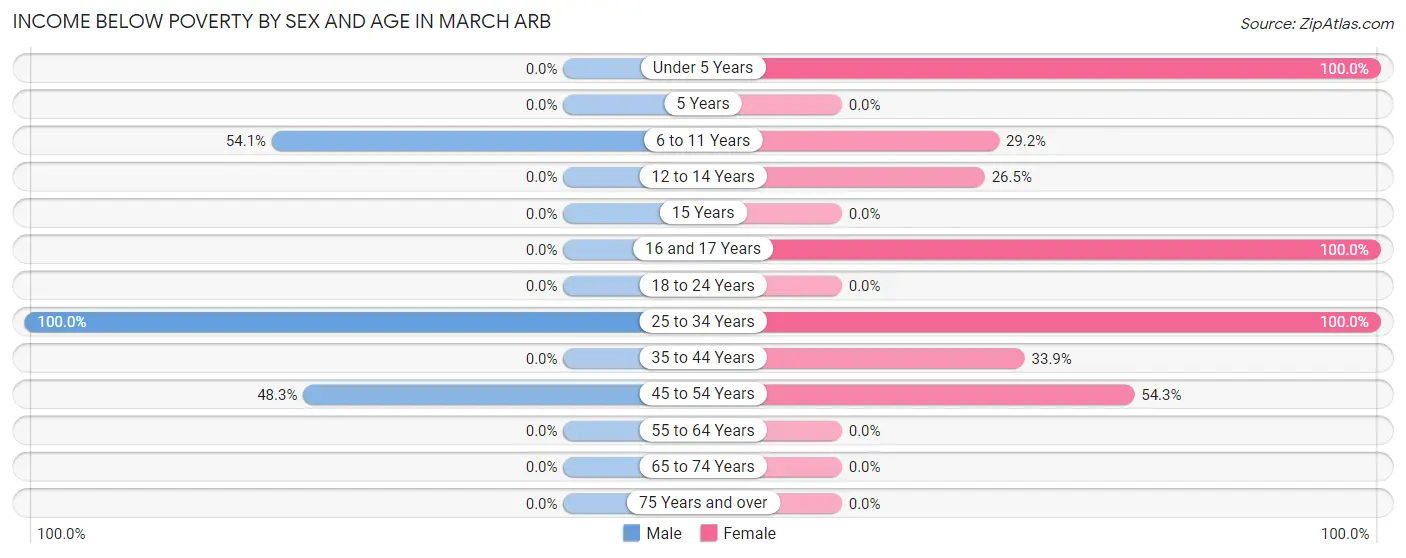
| Age Bracket | Male | Female |
| Under 5 Years | 0 (0.0%) | 25 (100.0%) |
| 5 Years | 0 (0.0%) | 0 (0.0%) |
| 6 to 11 Years | 33 (54.1%) | 14 (29.2%) |
| 12 to 14 Years | 0 (0.0%) | 13 (26.5%) |
| 15 Years | 0 (0.0%) | 0 (0.0%) |
| 16 and 17 Years | 0 (0.0%) | 20 (100.0%) |
| 18 to 24 Years | 0 (0.0%) | 0 (0.0%) |
| 25 to 34 Years | 23 (100.0%) | 129 (100.0%) |
| 35 to 44 Years | 0 (0.0%) | 19 (33.9%) |
| 45 to 54 Years | 14 (48.3%) | 19 (54.3%) |
| 55 to 64 Years | 0 (0.0%) | 0 (0.0%) |
| 65 to 74 Years | 0 (0.0%) | 0 (0.0%) |
| 75 Years and over | 0 (0.0%) | 0 (0.0%) |
| Total | 70 (14.2%) | 239 (43.3%) |
Income Above Poverty by Sex and Age in March ARB
According to the poverty statistics in March ARB, males aged under 5 years and females aged 55 to 64 years are the age groups that are most secure financially, with 100.0% of males and 100.0% of females in these age groups living above the poverty line.
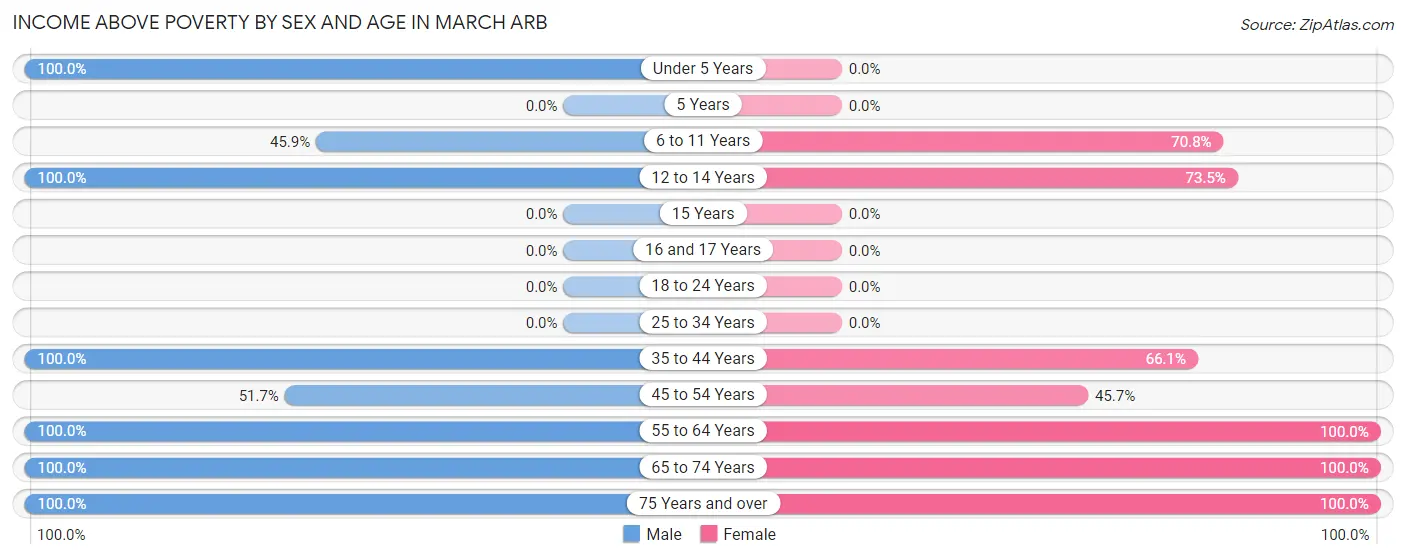
| Age Bracket | Male | Female |
| Under 5 Years | 18 (100.0%) | 0 (0.0%) |
| 5 Years | 0 (0.0%) | 0 (0.0%) |
| 6 to 11 Years | 28 (45.9%) | 34 (70.8%) |
| 12 to 14 Years | 42 (100.0%) | 36 (73.5%) |
| 15 Years | 0 (0.0%) | 0 (0.0%) |
| 16 and 17 Years | 0 (0.0%) | 0 (0.0%) |
| 18 to 24 Years | 0 (0.0%) | 0 (0.0%) |
| 25 to 34 Years | 0 (0.0%) | 0 (0.0%) |
| 35 to 44 Years | 118 (100.0%) | 37 (66.1%) |
| 45 to 54 Years | 15 (51.7%) | 16 (45.7%) |
| 55 to 64 Years | 20 (100.0%) | 7 (100.0%) |
| 65 to 74 Years | 45 (100.0%) | 44 (100.0%) |
| 75 Years and over | 136 (100.0%) | 139 (100.0%) |
| Total | 422 (85.8%) | 313 (56.7%) |
Income Below Poverty Among Married-Couple Families in March ARB
The poverty statistics for married-couple families in March ARB show that 20.4% or 37 of the total 181 families live below the poverty line. Families with 1 or 2 children have the highest poverty rate of 62.7%, comprising of 37 families. On the other hand, families with no children have the lowest poverty rate of 0.0%, which includes 0 families.
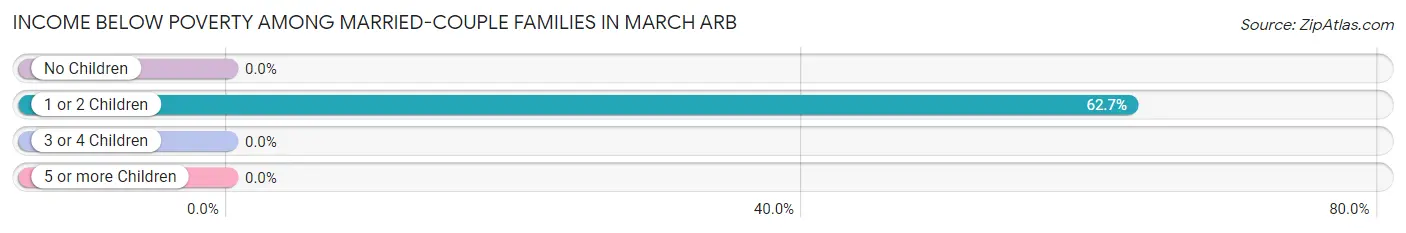
| Children | Above Poverty | Below Poverty |
| No Children | 89 (100.0%) | 0 (0.0%) |
| 1 or 2 Children | 22 (37.3%) | 37 (62.7%) |
| 3 or 4 Children | 33 (100.0%) | 0 (0.0%) |
| 5 or more Children | 0 (0.0%) | 0 (0.0%) |
| Total | 144 (79.6%) | 37 (20.4%) |
Income Below Poverty Among Single-Parent Households in March ARB
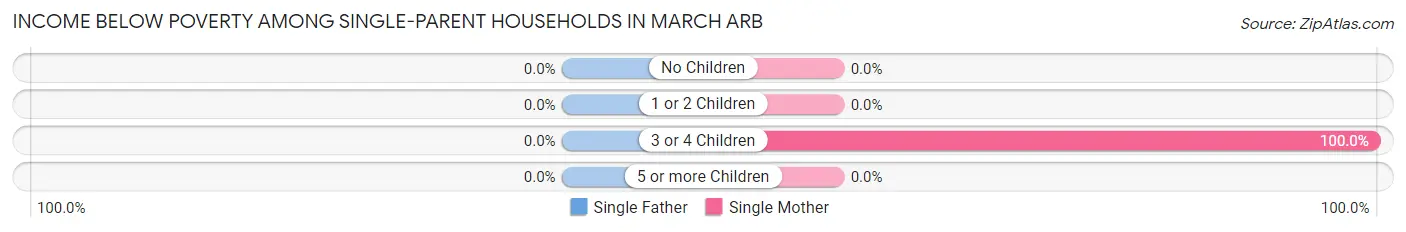
| Children | Single Father | Single Mother |
| No Children | 0 (0.0%) | 0 (0.0%) |
| 1 or 2 Children | 0 (0.0%) | 0 (0.0%) |
| 3 or 4 Children | 0 (0.0%) | 20 (100.0%) |
| 5 or more Children | 0 (0.0%) | 0 (0.0%) |
| Total | 0 (0.0%) | 20 (100.0%) |
Income Below Poverty Among Married-Couple vs Single-Parent Households in March ARB
The poverty data for March ARB shows that 37 of the married-couple family households (20.4%) and 20 of the single-parent households (100.0%) are living below the poverty level. Within the married-couple family households, those with 1 or 2 children have the highest poverty rate, with 37 households (62.7%) falling below the poverty line. Among the single-parent households, those with 3 or 4 children have the highest poverty rate, with 20 household (100.0%) living below poverty.
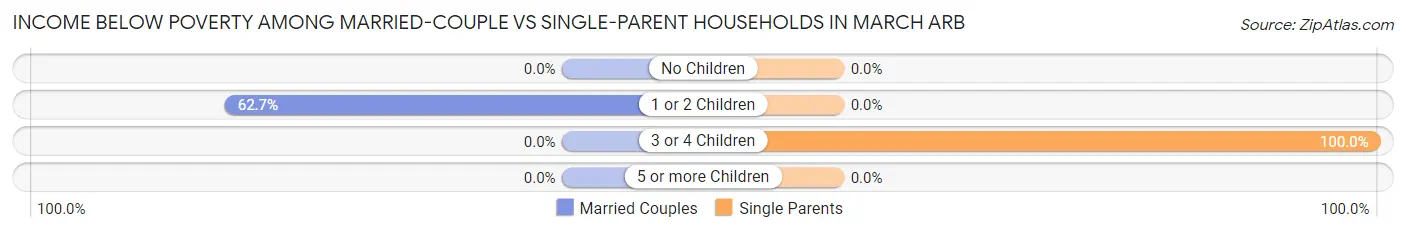
| Children | Married-Couple Families | Single-Parent Households |
| No Children | 0 (0.0%) | 0 (0.0%) |
| 1 or 2 Children | 37 (62.7%) | 0 (0.0%) |
| 3 or 4 Children | 0 (0.0%) | 20 (100.0%) |
| 5 or more Children | 0 (0.0%) | 0 (0.0%) |
| Total | 37 (20.4%) | 20 (100.0%) |
Race in March ARB
The most populous races in March ARB are White / Caucasian (501 | 42.6%), Hispanic or Latino (340 | 28.9%), and Two or more Races (326 | 27.7%).
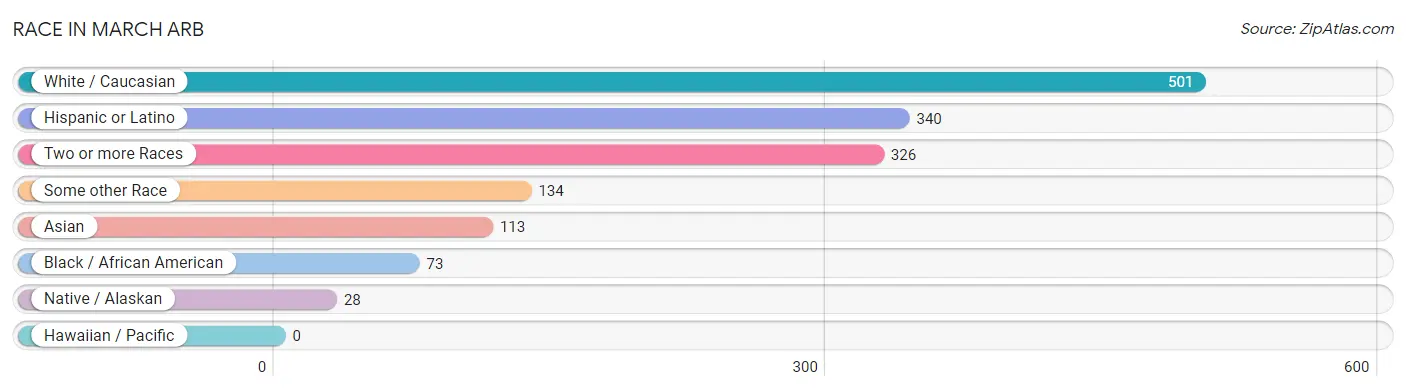
| Race | # Population | % Population |
| Asian | 113 | 9.6% |
| Black / African American | 73 | 6.2% |
| Hawaiian / Pacific | 0 | 0.0% |
| Hispanic or Latino | 340 | 28.9% |
| Native / Alaskan | 28 | 2.4% |
| White / Caucasian | 501 | 42.6% |
| Two or more Races | 326 | 27.7% |
| Some other Race | 134 | 11.4% |
| Total | 1,175 | 100.0% |
Ancestry in March ARB
The most populous ancestries reported in March ARB are Irish (282 | 24.0%), Mexican (217 | 18.5%), Choctaw (144 | 12.3%), English (122 | 10.4%), and German (117 | 10.0%), together accounting for 75.1% of all March ARB residents.
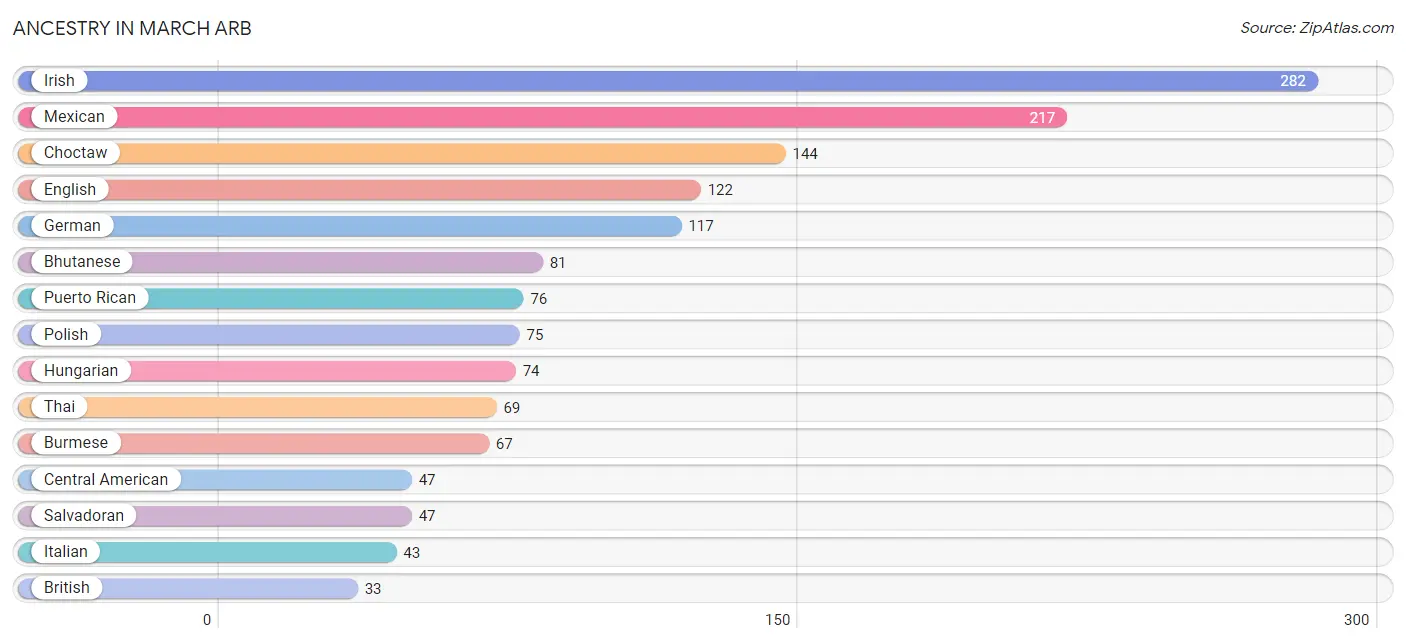
| Ancestry | # Population | % Population |
| African | 23 | 2.0% |
| American | 22 | 1.9% |
| Bhutanese | 81 | 6.9% |
| British | 33 | 2.8% |
| Burmese | 67 | 5.7% |
| Central American | 47 | 4.0% |
| Choctaw | 144 | 12.3% |
| Czech | 14 | 1.2% |
| Dutch | 18 | 1.5% |
| English | 122 | 10.4% |
| French | 19 | 1.6% |
| German | 117 | 10.0% |
| Hungarian | 74 | 6.3% |
| Indian (Asian) | 9 | 0.8% |
| Irish | 282 | 24.0% |
| Italian | 43 | 3.7% |
| Korean | 8 | 0.7% |
| Mexican | 217 | 18.5% |
| Mexican American Indian | 28 | 2.4% |
| Northern European | 19 | 1.6% |
| Norwegian | 16 | 1.4% |
| Polish | 75 | 6.4% |
| Puerto Rican | 76 | 6.5% |
| Russian | 17 | 1.5% |
| Salvadoran | 47 | 4.0% |
| Subsaharan African | 23 | 2.0% |
| Swedish | 17 | 1.5% |
| Thai | 69 | 5.9% | View All 28 Rows |
Immigrants in March ARB
The most numerous immigrant groups reported in March ARB came from Latin America (56 | 4.8%), Central America (41 | 3.5%), Mexico (41 | 3.5%), Caribbean (15 | 1.3%), and Trinidad and Tobago (15 | 1.3%), together accounting for 14.3% of all March ARB residents.
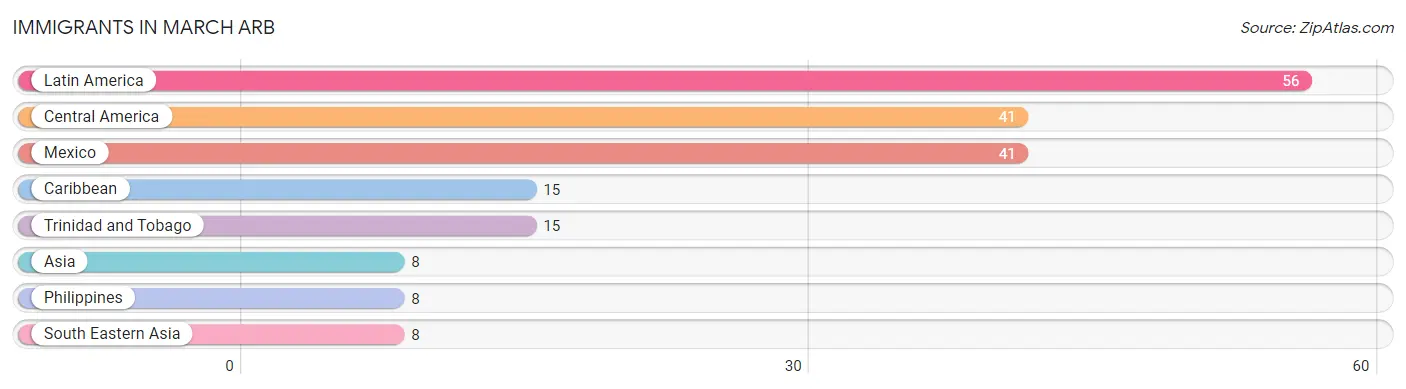
| Immigration Origin | # Population | % Population |
| Asia | 8 | 0.7% |
| Caribbean | 15 | 1.3% |
| Central America | 41 | 3.5% |
| Latin America | 56 | 4.8% |
| Mexico | 41 | 3.5% |
| Philippines | 8 | 0.7% |
| South Eastern Asia | 8 | 0.7% |
| Trinidad and Tobago | 15 | 1.3% | View All 8 Rows |
Sex and Age in March ARB
Sex and Age in March ARB
The most populous age groups in March ARB are 10 to 14 Years (134 | 23.4%) for men and 30 to 34 Years (108 | 17.9%) for women.
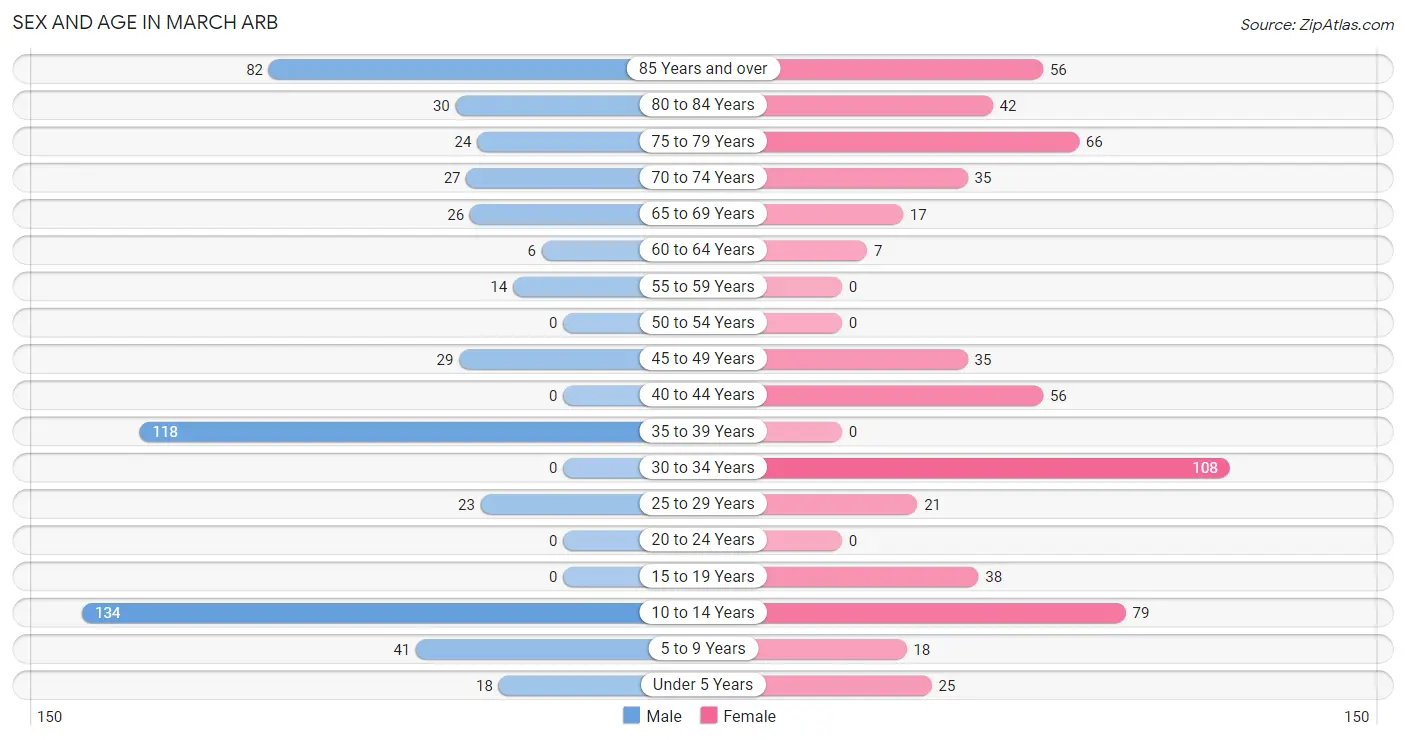
| Age Bracket | Male | Female |
| Under 5 Years | 18 (3.2%) | 25 (4.2%) |
| 5 to 9 Years | 41 (7.2%) | 18 (3.0%) |
| 10 to 14 Years | 134 (23.4%) | 79 (13.1%) |
| 15 to 19 Years | 0 (0.0%) | 38 (6.3%) |
| 20 to 24 Years | 0 (0.0%) | 0 (0.0%) |
| 25 to 29 Years | 23 (4.0%) | 21 (3.5%) |
| 30 to 34 Years | 0 (0.0%) | 108 (17.9%) |
| 35 to 39 Years | 118 (20.6%) | 0 (0.0%) |
| 40 to 44 Years | 0 (0.0%) | 56 (9.3%) |
| 45 to 49 Years | 29 (5.1%) | 35 (5.8%) |
| 50 to 54 Years | 0 (0.0%) | 0 (0.0%) |
| 55 to 59 Years | 14 (2.5%) | 0 (0.0%) |
| 60 to 64 Years | 6 (1.1%) | 7 (1.2%) |
| 65 to 69 Years | 26 (4.5%) | 17 (2.8%) |
| 70 to 74 Years | 27 (4.7%) | 35 (5.8%) |
| 75 to 79 Years | 24 (4.2%) | 66 (11.0%) |
| 80 to 84 Years | 30 (5.2%) | 42 (7.0%) |
| 85 Years and over | 82 (14.3%) | 56 (9.3%) |
| Total | 572 (100.0%) | 603 (100.0%) |
Families and Households in March ARB
Median Family Size in March ARB
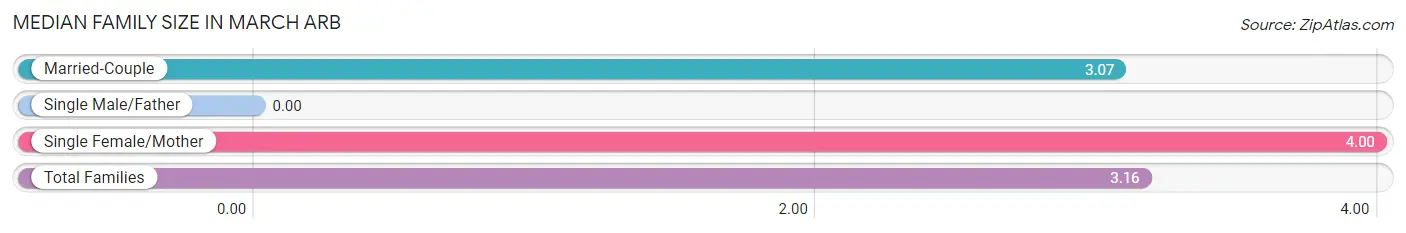
| Family Type | # Families | Family Size |
| Married-Couple | 181 (90.0%) | 3.07 |
| Single Male/Father | 0 (0.0%) | - |
| Single Female/Mother | 20 (10.0%) | 4.00 |
| Total Families | 201 (100.0%) | 3.16 |
Median Household Size in March ARB
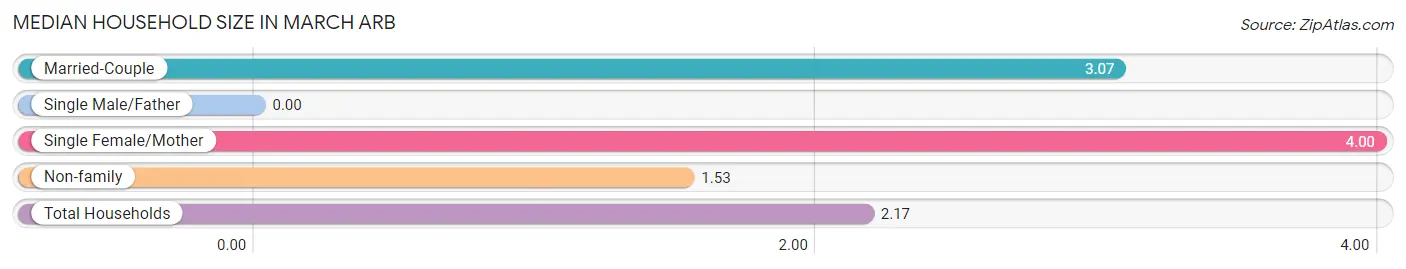
| Household Type | # Households | Household Size |
| Married-Couple | 181 (35.1%) | 3.07 |
| Single Male/Father | 0 (0.0%) | - |
| Single Female/Mother | 20 (3.9%) | 4.00 |
| Non-family | 314 (61.0%) | 1.53 |
| Total Households | 515 (100.0%) | 2.17 |
Household Size by Marriage Status in March ARB
Out of a total of 515 households in March ARB, 201 (39.0%) are family households, while 314 (61.0%) are nonfamily households. The most numerous type of family households are 2-person households, comprising 89, and the most common type of nonfamily households are 1-person households, comprising 214.
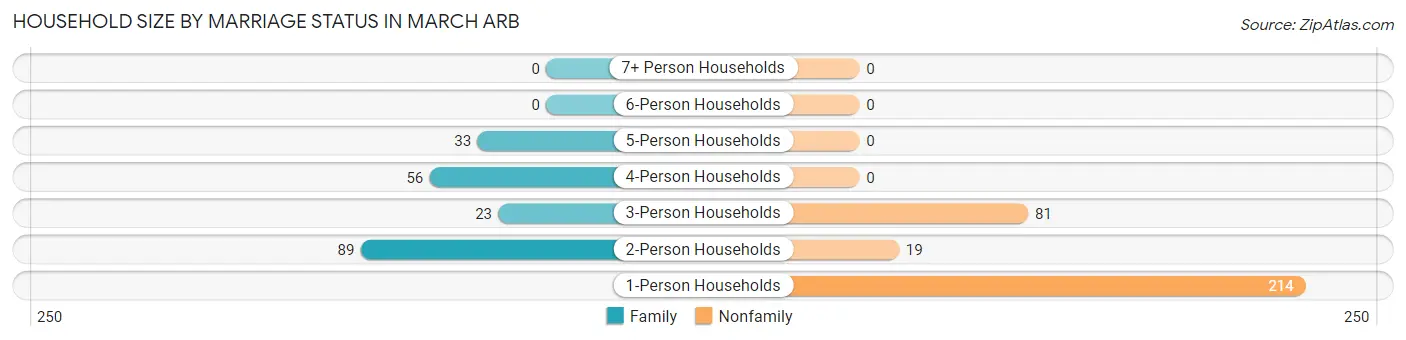
| Household Size | Family Households | Nonfamily Households |
| 1-Person Households | - | 214 (41.5%) |
| 2-Person Households | 89 (17.3%) | 19 (3.7%) |
| 3-Person Households | 23 (4.5%) | 81 (15.7%) |
| 4-Person Households | 56 (10.9%) | 0 (0.0%) |
| 5-Person Households | 33 (6.4%) | 0 (0.0%) |
| 6-Person Households | 0 (0.0%) | 0 (0.0%) |
| 7+ Person Households | 0 (0.0%) | 0 (0.0%) |
| Total | 201 (39.0%) | 314 (61.0%) |
Female Fertility in March ARB
Fertility by Age in March ARB
Average fertility rate in March ARB is 81.0 births per 1,000 women. Women in the age bracket of 20 to 34 years have the highest fertility rate with 163.0 births per 1,000 women. Women in the age bracket of 20 to 34 years acount for 100.0% of all women with births.
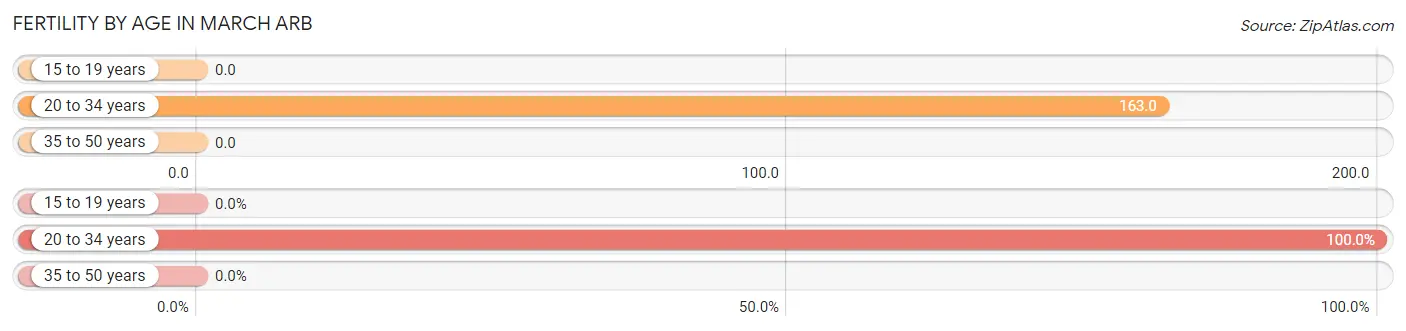
| Age Bracket | Women with Births | Births / 1,000 Women |
| 15 to 19 years | 0 (0.0%) | 0.0 |
| 20 to 34 years | 21 (100.0%) | 163.0 |
| 35 to 50 years | 0 (0.0%) | 0.0 |
| Total | 21 (100.0%) | 81.0 |
Fertility by Age by Marriage Status in March ARB
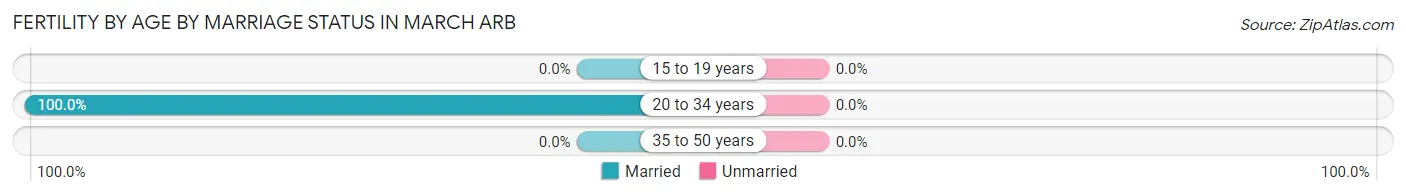
| Age Bracket | Married | Unmarried |
| 15 to 19 years | 0 (0.0%) | 0 (0.0%) |
| 20 to 34 years | 21 (100.0%) | 0 (0.0%) |
| 35 to 50 years | 0 (0.0%) | 0 (0.0%) |
| Total | 21 (100.0%) | 0 (0.0%) |
Fertility by Education in March ARB
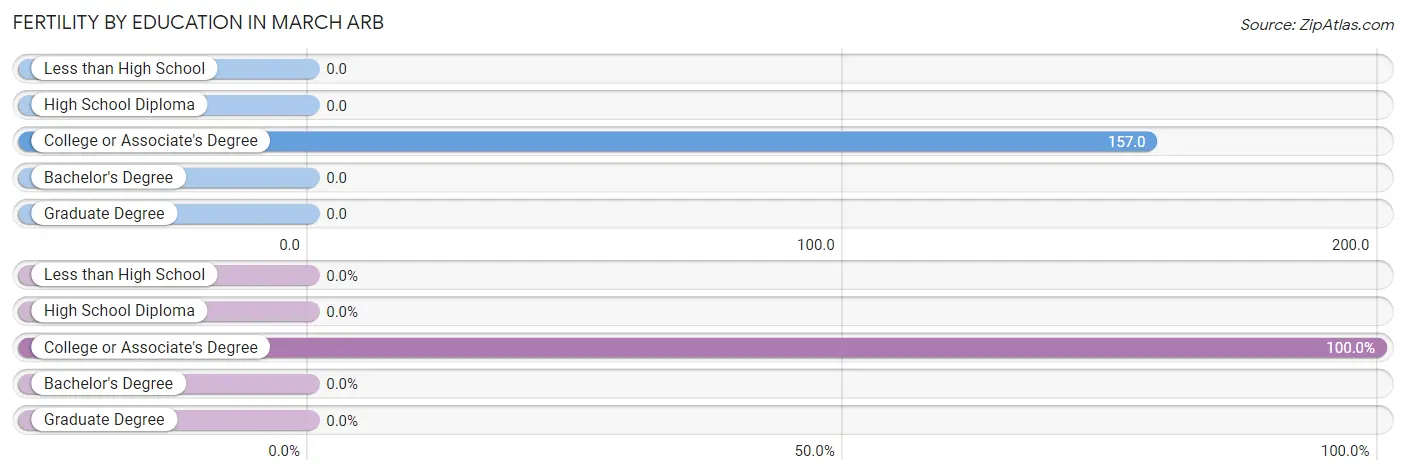
| Educational Attainment | Women with Births | Births / 1,000 Women |
| Less than High School | 0 (0.0%) | 0.0 |
| High School Diploma | 0 (0.0%) | 0.0 |
| College or Associate's Degree | 21 (100.0%) | 157.0 |
| Bachelor's Degree | 0 (0.0%) | 0.0 |
| Graduate Degree | 0 (0.0%) | 0.0 |
| Total | 21 (100.0%) | 81.0 |
Fertility by Education by Marriage Status in March ARB
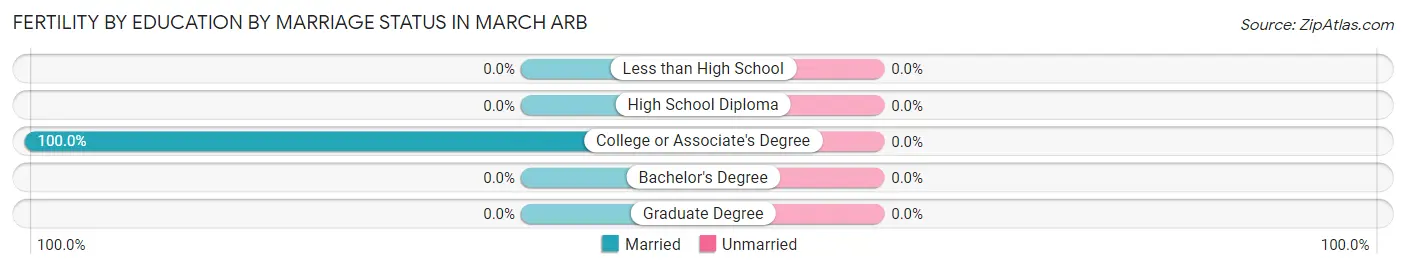
| Educational Attainment | Married | Unmarried |
| Less than High School | 0 (0.0%) | 0 (0.0%) |
| High School Diploma | 0 (0.0%) | 0 (0.0%) |
| College or Associate's Degree | 21 (100.0%) | 0 (0.0%) |
| Bachelor's Degree | 0 (0.0%) | 0 (0.0%) |
| Graduate Degree | 0 (0.0%) | 0 (0.0%) |
| Total | 21 (100.0%) | 0 (0.0%) |
Employment Characteristics in March ARB
Employment by Class of Employer in March ARB
Among the 224 employed individuals in March ARB, federal government employees (96 | 42.9%), private company employees (54 | 24.1%), and local government employees (36 | 16.1%) make up the most common classes of employment.
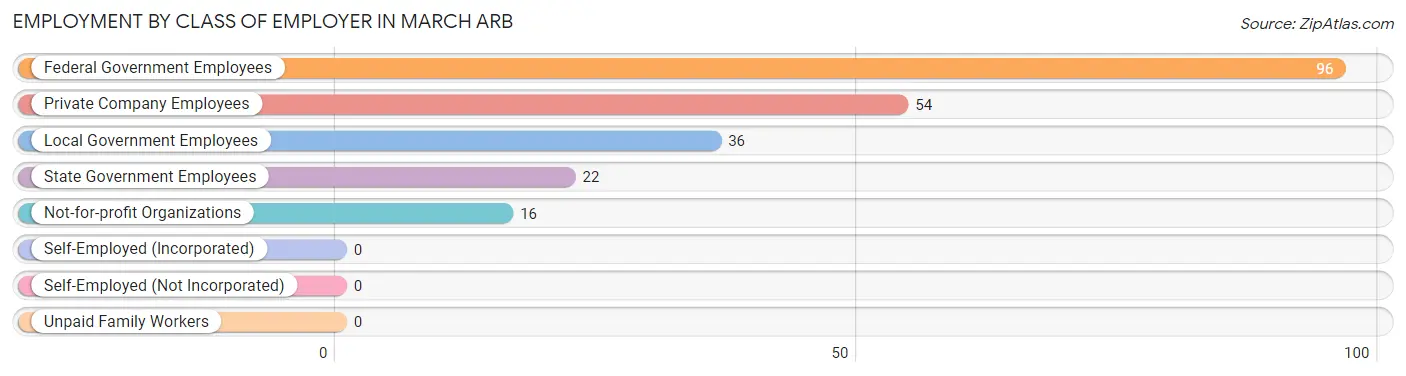
| Employer Class | # Employees | % Employees |
| Private Company Employees | 54 | 24.1% |
| Self-Employed (Incorporated) | 0 | 0.0% |
| Self-Employed (Not Incorporated) | 0 | 0.0% |
| Not-for-profit Organizations | 16 | 7.1% |
| Local Government Employees | 36 | 16.1% |
| State Government Employees | 22 | 9.8% |
| Federal Government Employees | 96 | 42.9% |
| Unpaid Family Workers | 0 | 0.0% |
| Total | 224 | 100.0% |
Employment Status by Age in March ARB
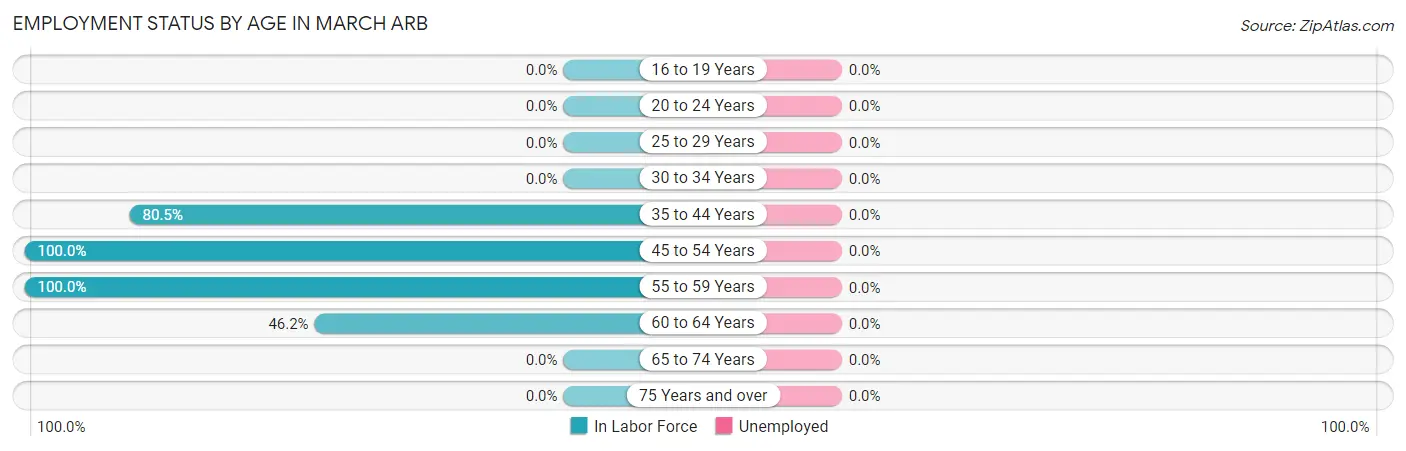
| Age Bracket | In Labor Force | Unemployed |
| 16 to 19 Years | 0 (0.0%) | 0 (0.0%) |
| 20 to 24 Years | 0 (0.0%) | 0 (0.0%) |
| 25 to 29 Years | 0 (0.0%) | 0 (0.0%) |
| 30 to 34 Years | 0 (0.0%) | 0 (0.0%) |
| 35 to 44 Years | 140 (80.5%) | 0 (0.0%) |
| 45 to 54 Years | 64 (100.0%) | 0 (0.0%) |
| 55 to 59 Years | 14 (100.0%) | 0 (0.0%) |
| 60 to 64 Years | 6 (46.2%) | 0 (0.0%) |
| 65 to 74 Years | 0 (0.0%) | 0 (0.0%) |
| 75 Years and over | 0 (0.0%) | 0 (0.0%) |
| Total | 224 (26.0%) | 0 (0.0%) |
Employment Status by Educational Attainment in March ARB
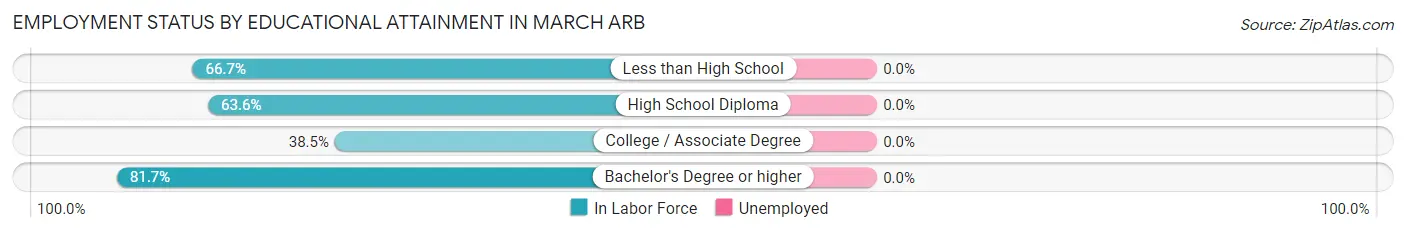
| Educational Attainment | In Labor Force | Unemployed |
| Less than High School | 14 (66.7%) | 0 (0.0%) |
| High School Diploma | 56 (63.6%) | 0 (0.0%) |
| College / Associate Degree | 87 (38.5%) | 0 (0.0%) |
| Bachelor's Degree or higher | 67 (81.7%) | 0 (0.0%) |
| Total | 224 (53.7%) | 0 (0.0%) |
Employment Occupations by Sex in March ARB
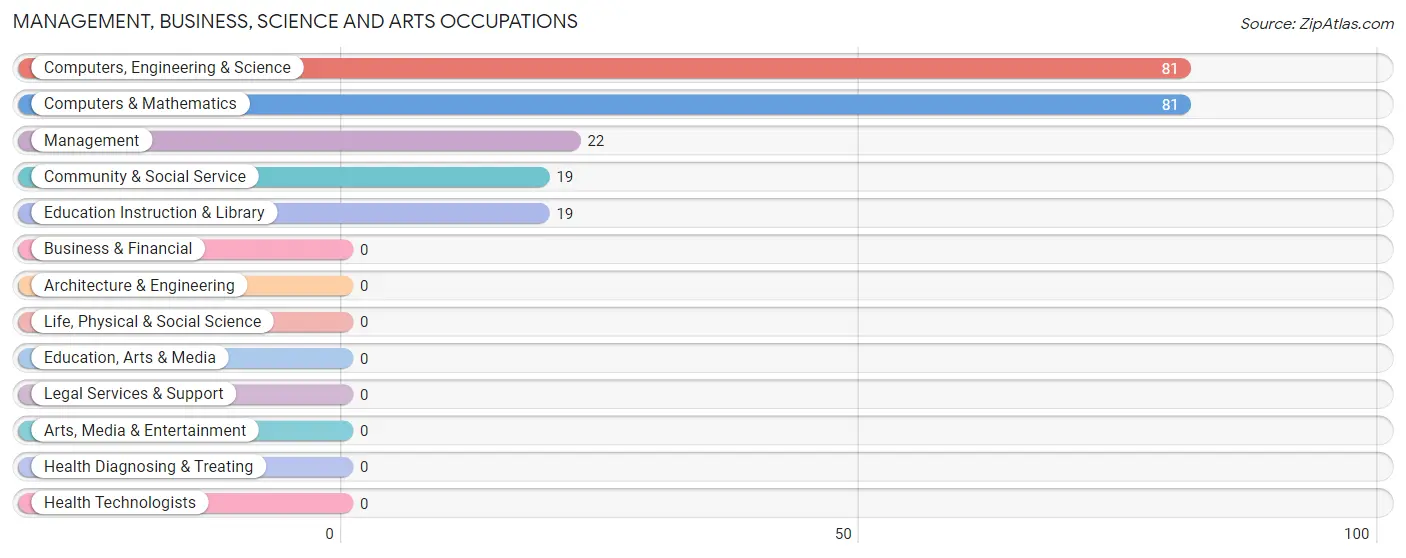
Management, Business, Science and Arts Occupations
The most common Management, Business, Science and Arts occupations in March ARB are Computers, Engineering & Science (81 | 38.8%), Computers & Mathematics (81 | 38.8%), Management (22 | 10.5%), Community & Social Service (19 | 9.1%), and Education Instruction & Library (19 | 9.1%).
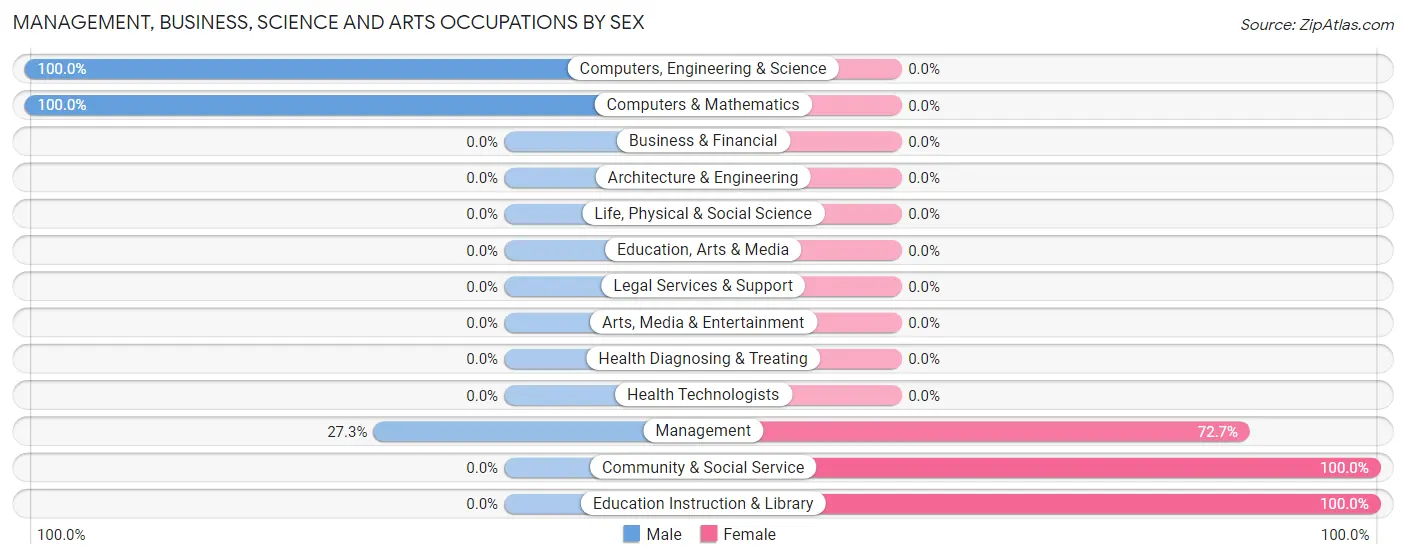
Management, Business, Science and Arts Occupations by Sex
Within the Management, Business, Science and Arts occupations in March ARB, the most male-oriented occupations are Computers, Engineering & Science (100.0%), Computers & Mathematics (100.0%), and Management (27.3%), while the most female-oriented occupations are Community & Social Service (100.0%), Education Instruction & Library (100.0%), and Management (72.7%).
| Occupation | Male | Female |
| Management | 6 (27.3%) | 16 (72.7%) |
| Business & Financial | 0 (0.0%) | 0 (0.0%) |
| Computers, Engineering & Science | 81 (100.0%) | 0 (0.0%) |
| Computers & Mathematics | 81 (100.0%) | 0 (0.0%) |
| Architecture & Engineering | 0 (0.0%) | 0 (0.0%) |
| Life, Physical & Social Science | 0 (0.0%) | 0 (0.0%) |
| Community & Social Service | 0 (0.0%) | 19 (100.0%) |
| Education, Arts & Media | 0 (0.0%) | 0 (0.0%) |
| Legal Services & Support | 0 (0.0%) | 0 (0.0%) |
| Education Instruction & Library | 0 (0.0%) | 19 (100.0%) |
| Arts, Media & Entertainment | 0 (0.0%) | 0 (0.0%) |
| Health Diagnosing & Treating | 0 (0.0%) | 0 (0.0%) |
| Health Technologists | 0 (0.0%) | 0 (0.0%) |
| Total (Category) | 87 (71.3%) | 35 (28.7%) |
| Total (Overall) | 152 (72.7%) | 57 (27.3%) |
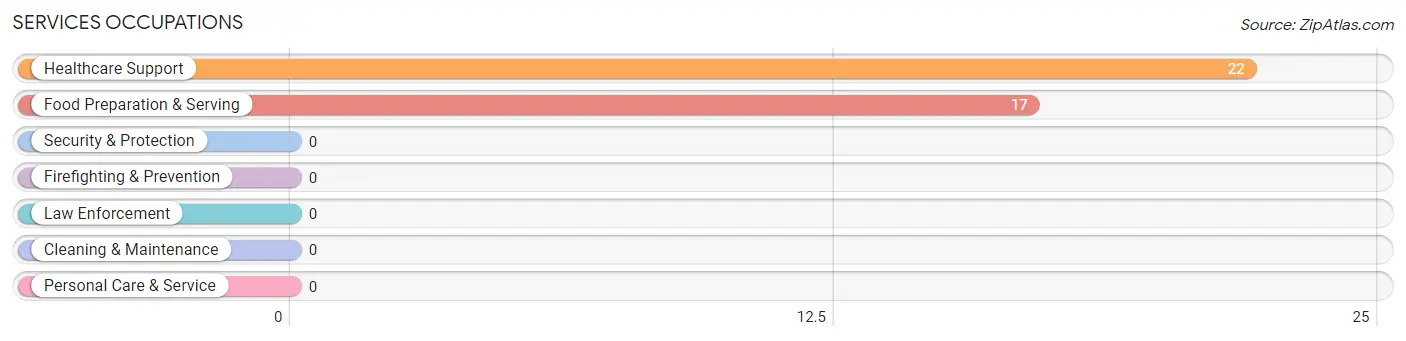
Services Occupations
The most common Services occupations in March ARB are Healthcare Support (22 | 10.5%), and Food Preparation & Serving (17 | 8.1%).
Services Occupations by Sex
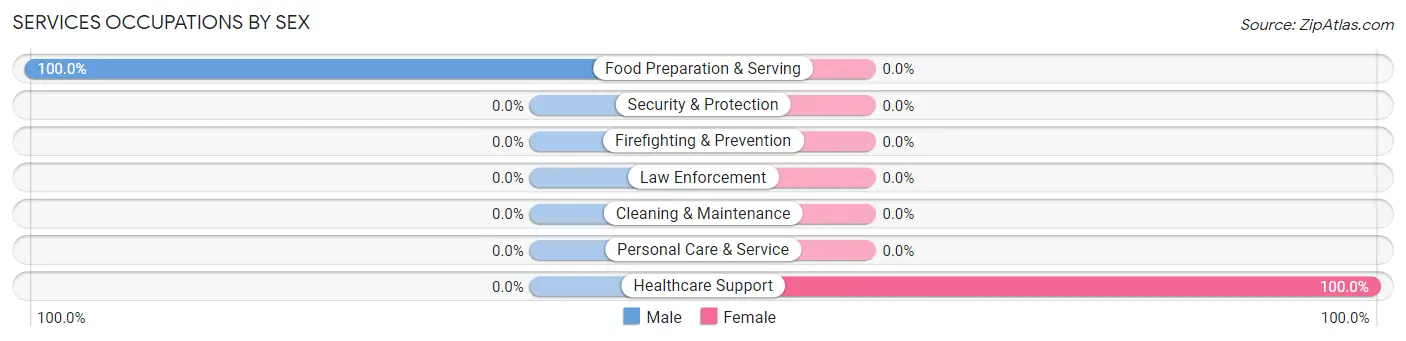
| Occupation | Male | Female |
| Healthcare Support | 0 (0.0%) | 22 (100.0%) |
| Security & Protection | 0 (0.0%) | 0 (0.0%) |
| Firefighting & Prevention | 0 (0.0%) | 0 (0.0%) |
| Law Enforcement | 0 (0.0%) | 0 (0.0%) |
| Food Preparation & Serving | 17 (100.0%) | 0 (0.0%) |
| Cleaning & Maintenance | 0 (0.0%) | 0 (0.0%) |
| Personal Care & Service | 0 (0.0%) | 0 (0.0%) |
| Total (Category) | 17 (43.6%) | 22 (56.4%) |
| Total (Overall) | 152 (72.7%) | 57 (27.3%) |
Sales and Office Occupations
Sales and Office Occupations by Sex
| Occupation | Male | Female |
| Sales & Related | 0 (0.0%) | 0 (0.0%) |
| Office & Administration | 0 (0.0%) | 0 (0.0%) |
| Total (Category) | 0 (0.0%) | 0 (0.0%) |
| Total (Overall) | 152 (72.7%) | 57 (27.3%) |
Natural Resources, Construction and Maintenance Occupations
The most common Natural Resources, Construction and Maintenance occupations in March ARB are , and Construction & Extraction (14 | 6.7%).
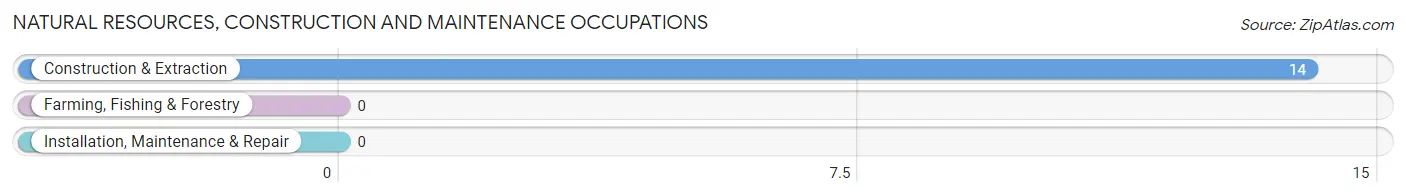
Natural Resources, Construction and Maintenance Occupations by Sex
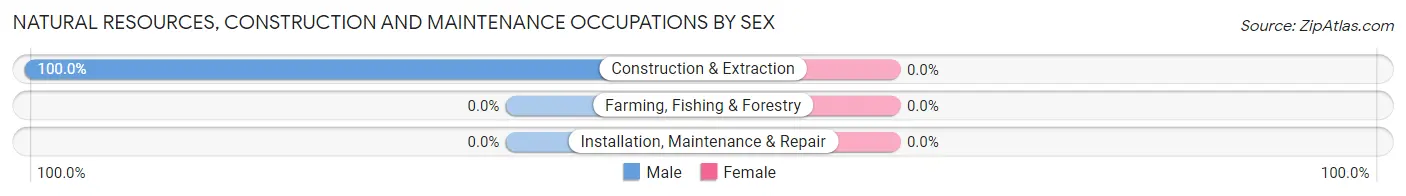
| Occupation | Male | Female |
| Farming, Fishing & Forestry | 0 (0.0%) | 0 (0.0%) |
| Construction & Extraction | 14 (100.0%) | 0 (0.0%) |
| Installation, Maintenance & Repair | 0 (0.0%) | 0 (0.0%) |
| Total (Category) | 14 (100.0%) | 0 (0.0%) |
| Total (Overall) | 152 (72.7%) | 57 (27.3%) |
Production, Transportation and Moving Occupations
The most common Production, Transportation and Moving occupations in March ARB are Material Moving (20 | 9.6%), and Production (14 | 6.7%).
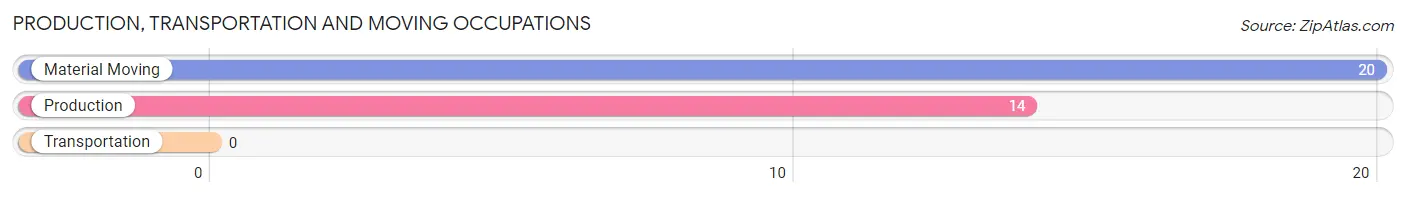
Production, Transportation and Moving Occupations by Sex
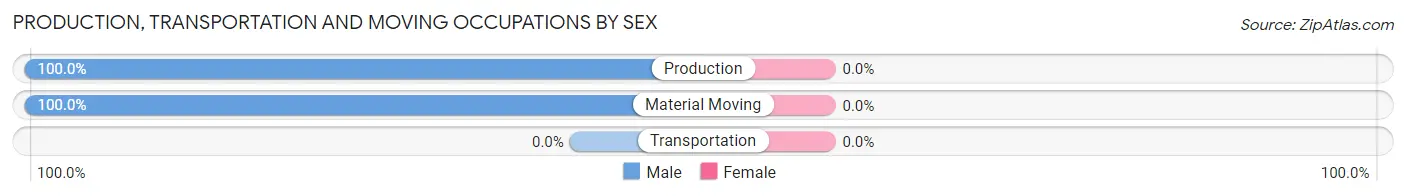
| Occupation | Male | Female |
| Production | 14 (100.0%) | 0 (0.0%) |
| Transportation | 0 (0.0%) | 0 (0.0%) |
| Material Moving | 20 (100.0%) | 0 (0.0%) |
| Total (Category) | 34 (100.0%) | 0 (0.0%) |
| Total (Overall) | 152 (72.7%) | 57 (27.3%) |
Employment Industries by Sex in March ARB
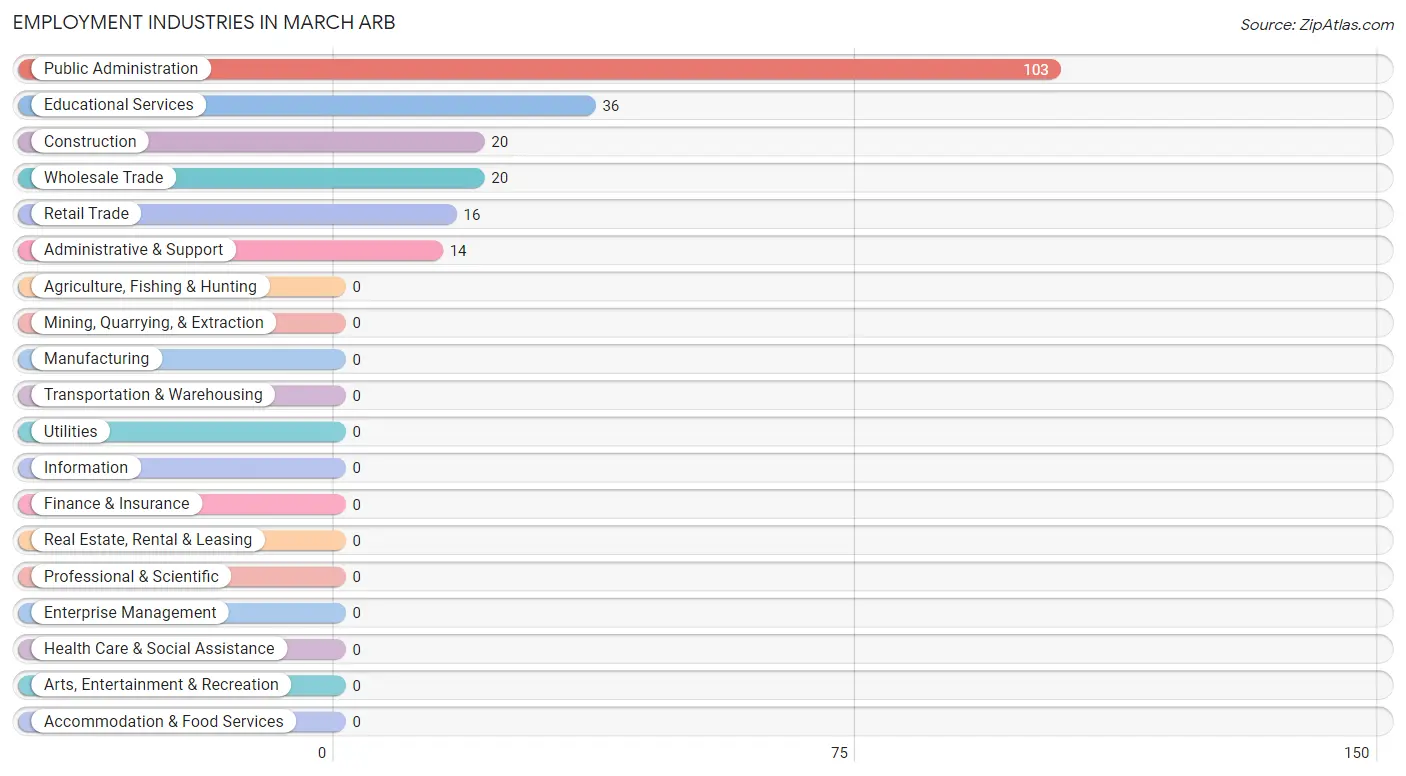
Employment Industries in March ARB
The major employment industries in March ARB include Public Administration (103 | 49.3%), Educational Services (36 | 17.2%), Construction (20 | 9.6%), Wholesale Trade (20 | 9.6%), and Retail Trade (16 | 7.7%).
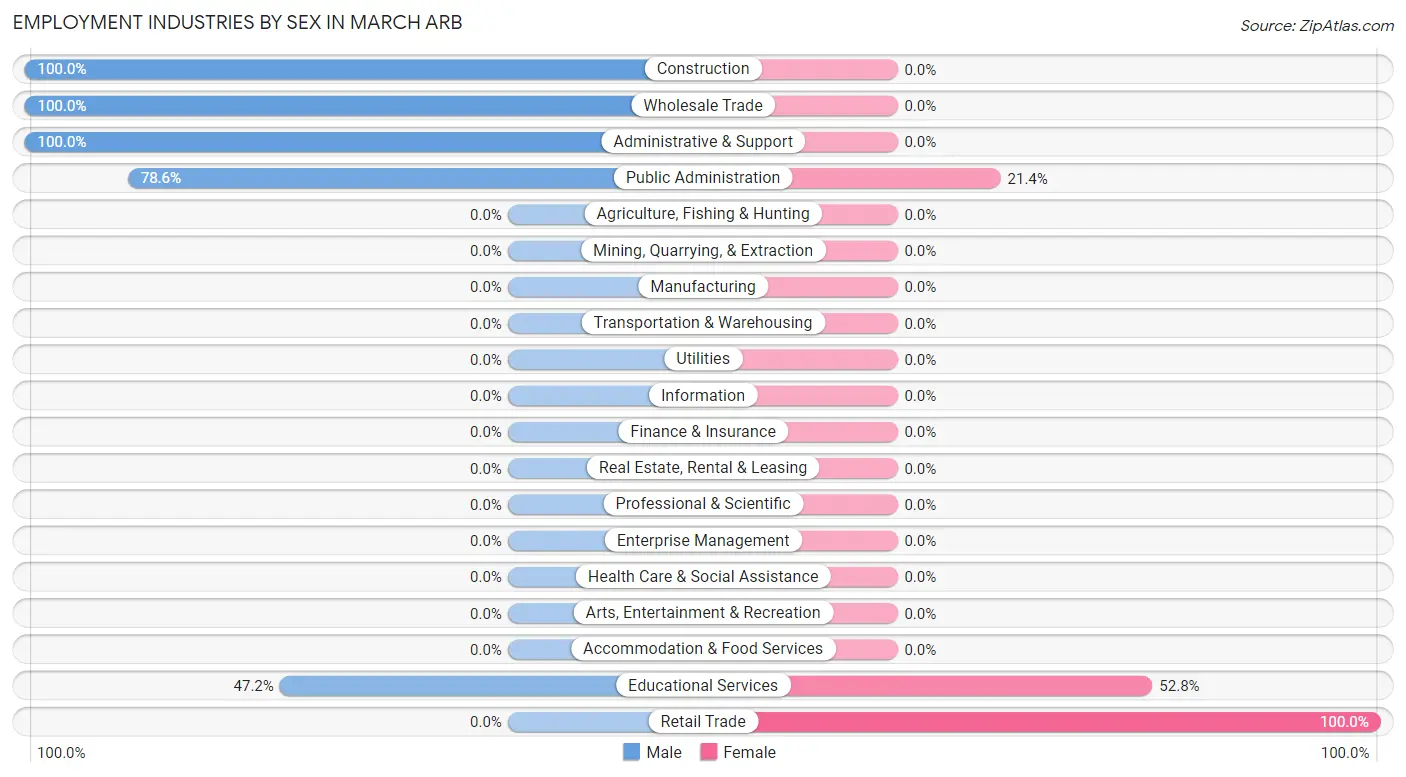
Employment Industries by Sex in March ARB
The March ARB industries that see more men than women are Construction (100.0%), Wholesale Trade (100.0%), and Administrative & Support (100.0%), whereas the industries that tend to have a higher number of women are Retail Trade (100.0%), Educational Services (52.8%), and Public Administration (21.4%).
| Industry | Male | Female |
| Agriculture, Fishing & Hunting | 0 (0.0%) | 0 (0.0%) |
| Mining, Quarrying, & Extraction | 0 (0.0%) | 0 (0.0%) |
| Construction | 20 (100.0%) | 0 (0.0%) |
| Manufacturing | 0 (0.0%) | 0 (0.0%) |
| Wholesale Trade | 20 (100.0%) | 0 (0.0%) |
| Retail Trade | 0 (0.0%) | 16 (100.0%) |
| Transportation & Warehousing | 0 (0.0%) | 0 (0.0%) |
| Utilities | 0 (0.0%) | 0 (0.0%) |
| Information | 0 (0.0%) | 0 (0.0%) |
| Finance & Insurance | 0 (0.0%) | 0 (0.0%) |
| Real Estate, Rental & Leasing | 0 (0.0%) | 0 (0.0%) |
| Professional & Scientific | 0 (0.0%) | 0 (0.0%) |
| Enterprise Management | 0 (0.0%) | 0 (0.0%) |
| Administrative & Support | 14 (100.0%) | 0 (0.0%) |
| Educational Services | 17 (47.2%) | 19 (52.8%) |
| Health Care & Social Assistance | 0 (0.0%) | 0 (0.0%) |
| Arts, Entertainment & Recreation | 0 (0.0%) | 0 (0.0%) |
| Accommodation & Food Services | 0 (0.0%) | 0 (0.0%) |
| Public Administration | 81 (78.6%) | 22 (21.4%) |
| Total | 152 (72.7%) | 57 (27.3%) |
Education in March ARB
School Enrollment in March ARB
The most common levels of schooling among the 392 students in March ARB are college / undergraduate (157 | 40.1%), middle school (156 | 39.8%), and high school (38 | 9.7%).
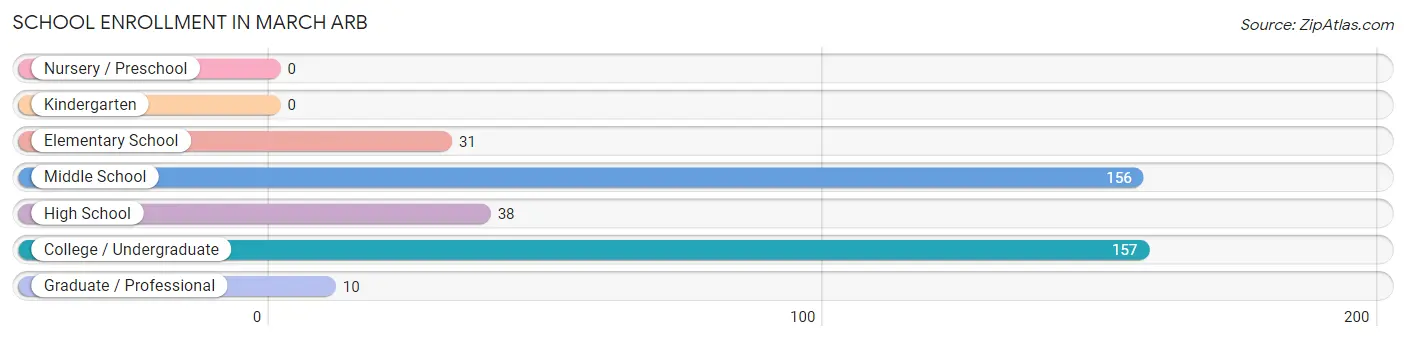
| School Level | # Students | % Students |
| Nursery / Preschool | 0 | 0.0% |
| Kindergarten | 0 | 0.0% |
| Elementary School | 31 | 7.9% |
| Middle School | 156 | 39.8% |
| High School | 38 | 9.7% |
| College / Undergraduate | 157 | 40.1% |
| Graduate / Professional | 10 | 2.5% |
| Total | 392 | 100.0% |
School Enrollment by Age by Funding Source in March ARB
Out of a total of 392 students who are enrolled in schools in March ARB, 34 (8.7%) attend a private institution, while the remaining 358 (91.3%) are enrolled in public schools. The age group of 18 to 19 year olds has the highest likelihood of being enrolled in private schools, with 18 (100.0% in the age bracket) enrolled. Conversely, the age group of 5 to 9 year old has the lowest likelihood of being enrolled in a private school, with 31 (100.0% in the age bracket) attending a public institution.
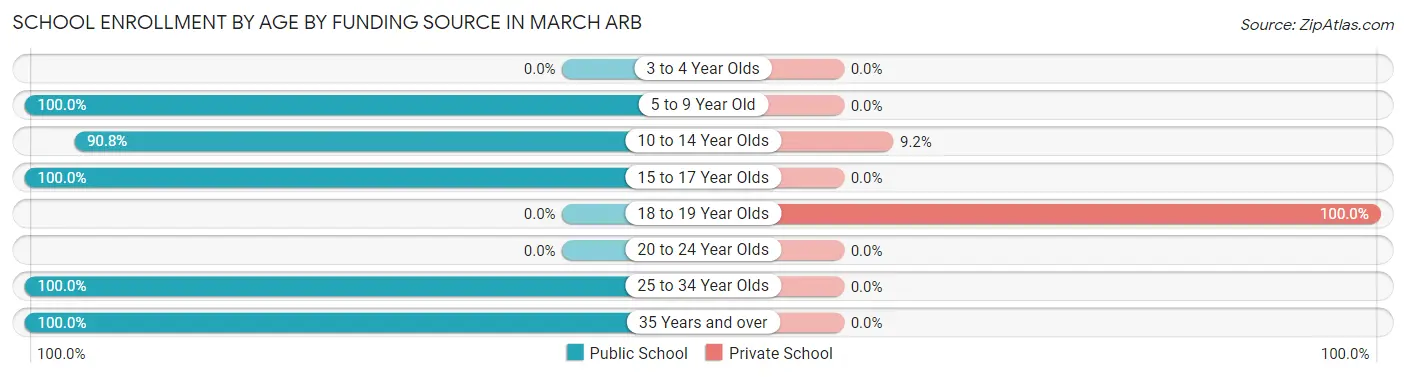
| Age Bracket | Public School | Private School |
| 3 to 4 Year Olds | 0 (0.0%) | 0 (0.0%) |
| 5 to 9 Year Old | 31 (100.0%) | 0 (0.0%) |
| 10 to 14 Year Olds | 158 (90.8%) | 16 (9.2%) |
| 15 to 17 Year Olds | 20 (100.0%) | 0 (0.0%) |
| 18 to 19 Year Olds | 0 (0.0%) | 18 (100.0%) |
| 20 to 24 Year Olds | 0 (0.0%) | 0 (0.0%) |
| 25 to 34 Year Olds | 139 (100.0%) | 0 (0.0%) |
| 35 Years and over | 10 (100.0%) | 0 (0.0%) |
| Total | 358 (91.3%) | 34 (8.7%) |
Educational Attainment by Field of Study in March ARB
Education (58 | 19.7%), psychology (43 | 14.6%), social sciences (34 | 11.6%), science & technology (34 | 11.6%), and engineering (33 | 11.2%) are the most common fields of study among 294 individuals in March ARB who have obtained a bachelor's degree or higher.
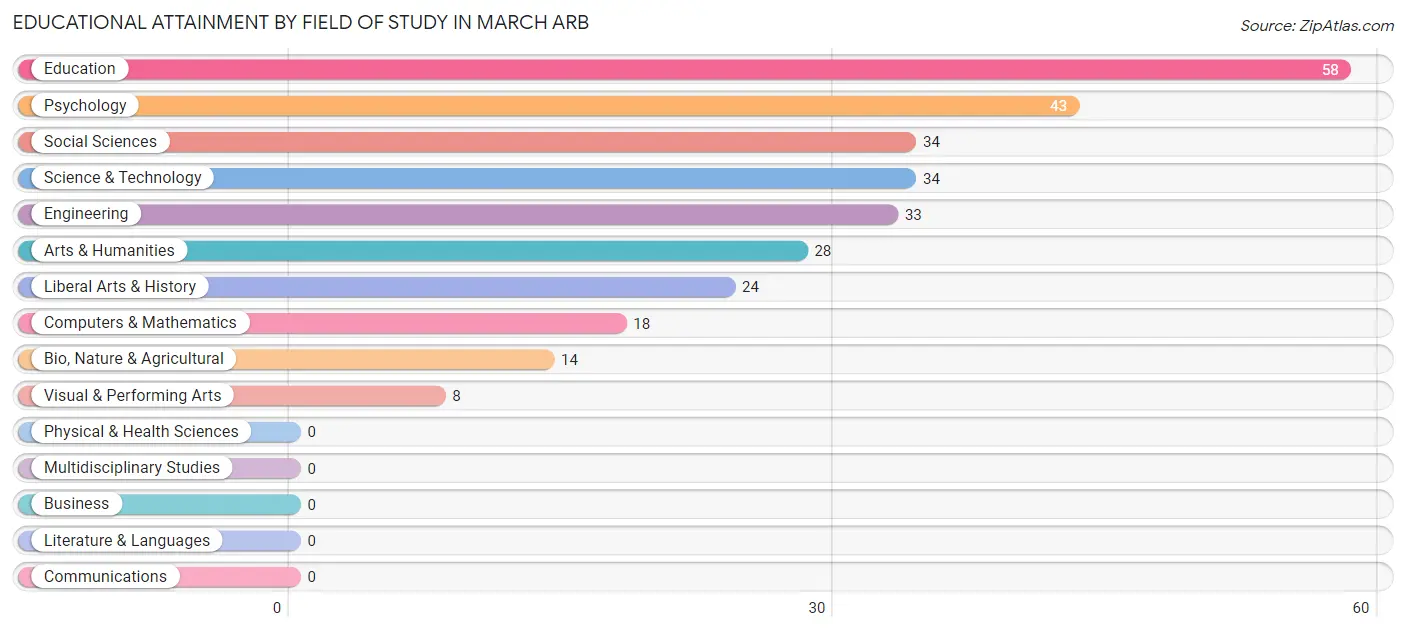
| Field of Study | # Graduates | % Graduates |
| Computers & Mathematics | 18 | 6.1% |
| Bio, Nature & Agricultural | 14 | 4.8% |
| Physical & Health Sciences | 0 | 0.0% |
| Psychology | 43 | 14.6% |
| Social Sciences | 34 | 11.6% |
| Engineering | 33 | 11.2% |
| Multidisciplinary Studies | 0 | 0.0% |
| Science & Technology | 34 | 11.6% |
| Business | 0 | 0.0% |
| Education | 58 | 19.7% |
| Literature & Languages | 0 | 0.0% |
| Liberal Arts & History | 24 | 8.2% |
| Visual & Performing Arts | 8 | 2.7% |
| Communications | 0 | 0.0% |
| Arts & Humanities | 28 | 9.5% |
| Total | 294 | 100.0% |
Transportation & Commute in March ARB
Vehicle Availability by Sex in March ARB
The most prevalent vehicle ownership categories in March ARB are males with 2 vehicles (147, accounting for 88.0%) and females with 2 vehicles (57, making up 257.9%).
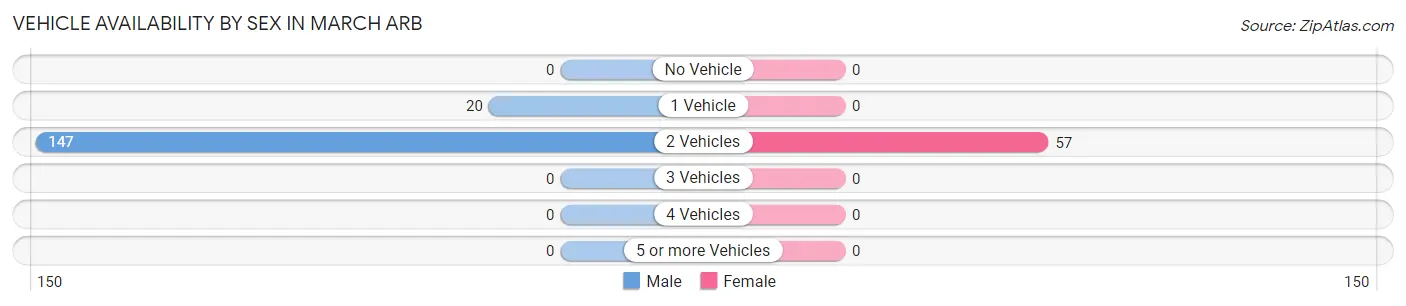
| Vehicles Available | Male | Female |
| No Vehicle | 0 (0.0%) | 0 (0.0%) |
| 1 Vehicle | 20 (12.0%) | 0 (0.0%) |
| 2 Vehicles | 147 (88.0%) | 57 (100.0%) |
| 3 Vehicles | 0 (0.0%) | 0 (0.0%) |
| 4 Vehicles | 0 (0.0%) | 0 (0.0%) |
| 5 or more Vehicles | 0 (0.0%) | 0 (0.0%) |
| Total | 167 (100.0%) | 57 (100.0%) |
Commute Time in March ARB
The most frequently occuring commute durations in March ARB are 30 to 34 minutes (81 commuters, 44.5%), 35 to 39 minutes (22 commuters, 12.1%), and 20 to 24 minutes (19 commuters, 10.4%).
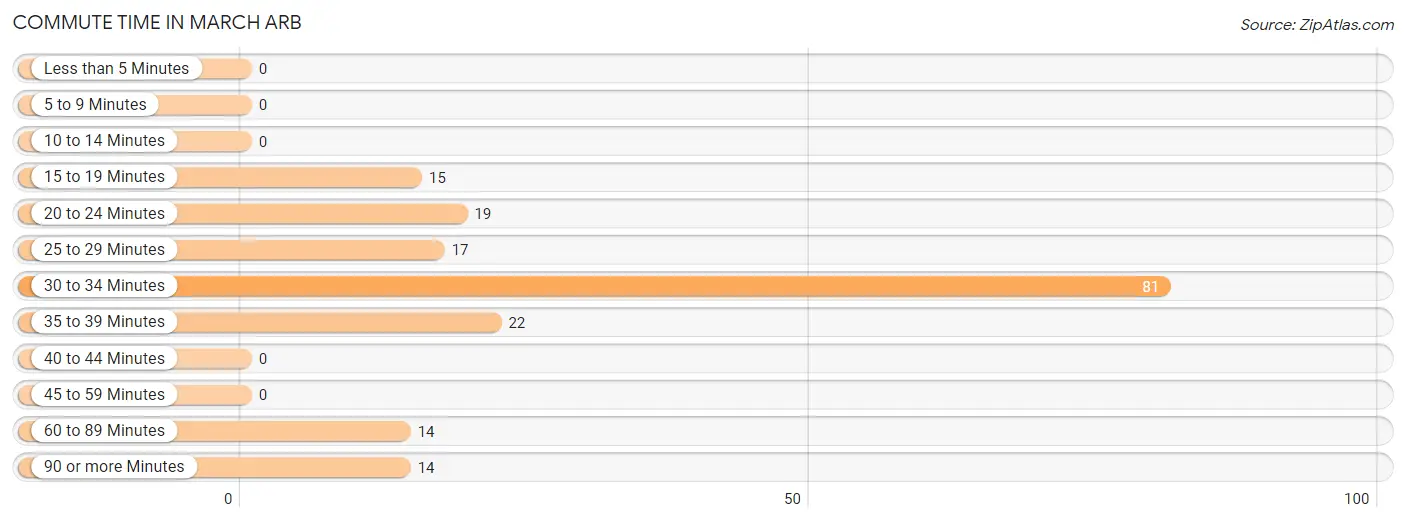
| Commute Time | # Commuters | % Commuters |
| Less than 5 Minutes | 0 | 0.0% |
| 5 to 9 Minutes | 0 | 0.0% |
| 10 to 14 Minutes | 0 | 0.0% |
| 15 to 19 Minutes | 15 | 8.2% |
| 20 to 24 Minutes | 19 | 10.4% |
| 25 to 29 Minutes | 17 | 9.3% |
| 30 to 34 Minutes | 81 | 44.5% |
| 35 to 39 Minutes | 22 | 12.1% |
| 40 to 44 Minutes | 0 | 0.0% |
| 45 to 59 Minutes | 0 | 0.0% |
| 60 to 89 Minutes | 14 | 7.7% |
| 90 or more Minutes | 14 | 7.7% |
Commute Time by Sex in March ARB
The most common commute times in March ARB are 30 to 34 minutes (81 commuters, 55.1%) for males and 20 to 24 minutes (19 commuters, 54.3%) for females.
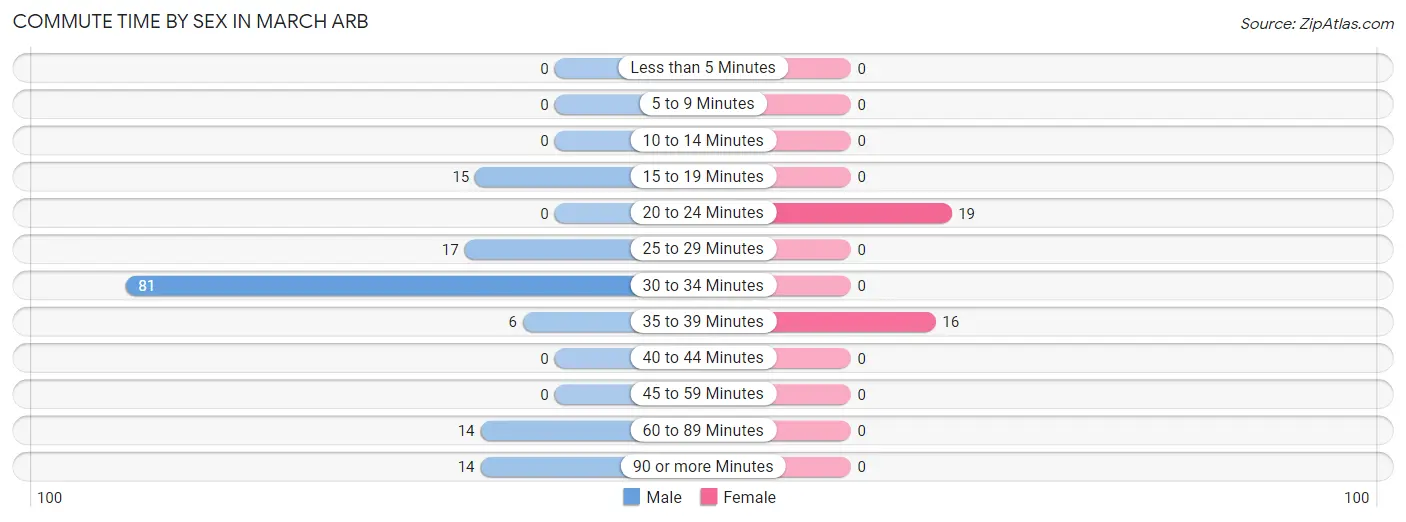
| Commute Time | Male | Female |
| Less than 5 Minutes | 0 (0.0%) | 0 (0.0%) |
| 5 to 9 Minutes | 0 (0.0%) | 0 (0.0%) |
| 10 to 14 Minutes | 0 (0.0%) | 0 (0.0%) |
| 15 to 19 Minutes | 15 (10.2%) | 0 (0.0%) |
| 20 to 24 Minutes | 0 (0.0%) | 19 (54.3%) |
| 25 to 29 Minutes | 17 (11.6%) | 0 (0.0%) |
| 30 to 34 Minutes | 81 (55.1%) | 0 (0.0%) |
| 35 to 39 Minutes | 6 (4.1%) | 16 (45.7%) |
| 40 to 44 Minutes | 0 (0.0%) | 0 (0.0%) |
| 45 to 59 Minutes | 0 (0.0%) | 0 (0.0%) |
| 60 to 89 Minutes | 14 (9.5%) | 0 (0.0%) |
| 90 or more Minutes | 14 (9.5%) | 0 (0.0%) |
Time of Departure to Work by Sex in March ARB
The most frequent times of departure to work in March ARB are 5:30 AM to 5:59 AM (96, 65.3%) for males and 7:00 AM to 7:29 AM (19, 54.3%) for females.
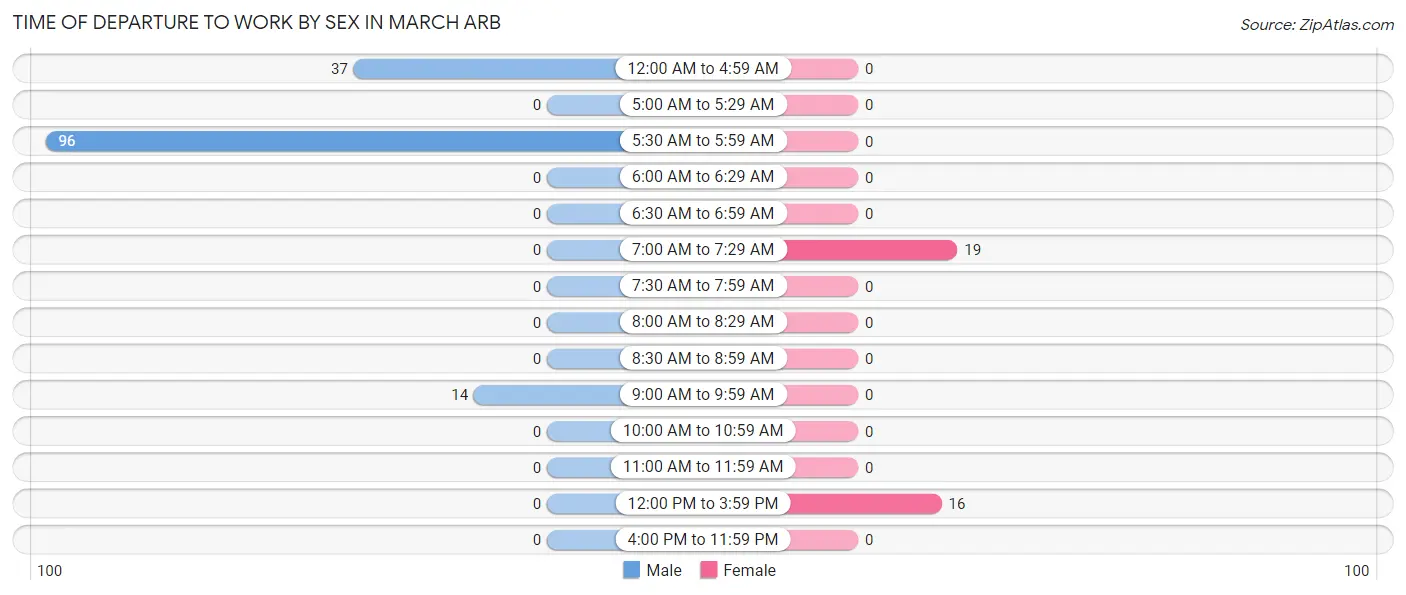
| Time of Departure | Male | Female |
| 12:00 AM to 4:59 AM | 37 (25.2%) | 0 (0.0%) |
| 5:00 AM to 5:29 AM | 0 (0.0%) | 0 (0.0%) |
| 5:30 AM to 5:59 AM | 96 (65.3%) | 0 (0.0%) |
| 6:00 AM to 6:29 AM | 0 (0.0%) | 0 (0.0%) |
| 6:30 AM to 6:59 AM | 0 (0.0%) | 0 (0.0%) |
| 7:00 AM to 7:29 AM | 0 (0.0%) | 19 (54.3%) |
| 7:30 AM to 7:59 AM | 0 (0.0%) | 0 (0.0%) |
| 8:00 AM to 8:29 AM | 0 (0.0%) | 0 (0.0%) |
| 8:30 AM to 8:59 AM | 0 (0.0%) | 0 (0.0%) |
| 9:00 AM to 9:59 AM | 14 (9.5%) | 0 (0.0%) |
| 10:00 AM to 10:59 AM | 0 (0.0%) | 0 (0.0%) |
| 11:00 AM to 11:59 AM | 0 (0.0%) | 0 (0.0%) |
| 12:00 PM to 3:59 PM | 0 (0.0%) | 16 (45.7%) |
| 4:00 PM to 11:59 PM | 0 (0.0%) | 0 (0.0%) |
| Total | 147 (100.0%) | 35 (100.0%) |
Housing Occupancy in March ARB
Occupancy by Ownership in March ARB
Of the total 515 dwellings in March ARB, owner-occupied units account for 38 (7.4%), while renter-occupied units make up 477 (92.6%).
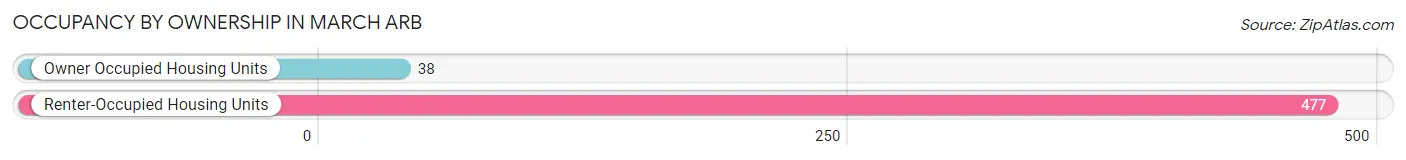
| Occupancy | # Housing Units | % Housing Units |
| Owner Occupied Housing Units | 38 | 7.4% |
| Renter-Occupied Housing Units | 477 | 92.6% |
| Total Occupied Housing Units | 515 | 100.0% |
Occupancy by Household Size in March ARB
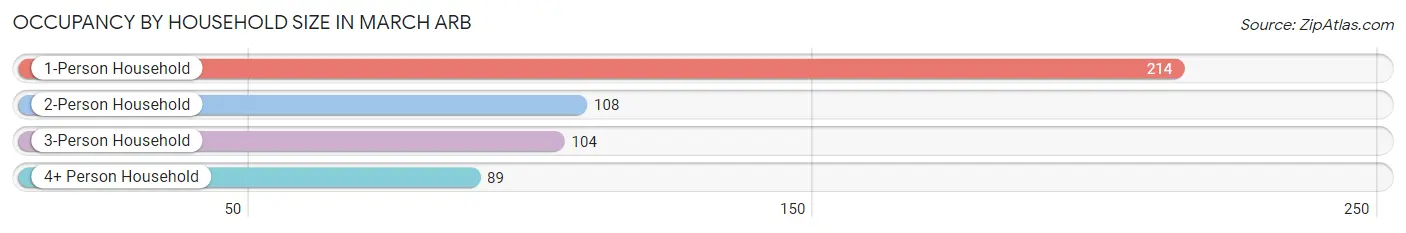
| Household Size | # Housing Units | % Housing Units |
| 1-Person Household | 214 | 41.5% |
| 2-Person Household | 108 | 21.0% |
| 3-Person Household | 104 | 20.2% |
| 4+ Person Household | 89 | 17.3% |
| Total Housing Units | 515 | 100.0% |
Occupancy by Ownership by Household Size in March ARB
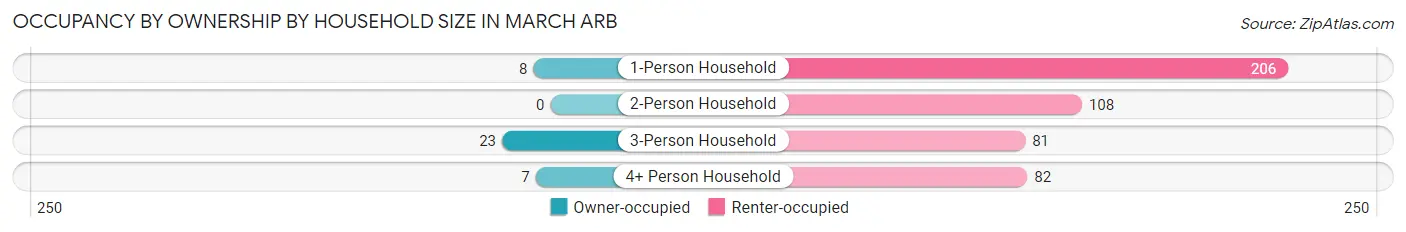
| Household Size | Owner-occupied | Renter-occupied |
| 1-Person Household | 8 (3.7%) | 206 (96.3%) |
| 2-Person Household | 0 (0.0%) | 108 (100.0%) |
| 3-Person Household | 23 (22.1%) | 81 (77.9%) |
| 4+ Person Household | 7 (7.9%) | 82 (92.1%) |
| Total Housing Units | 38 (7.4%) | 477 (92.6%) |
Occupancy by Educational Attainment in March ARB
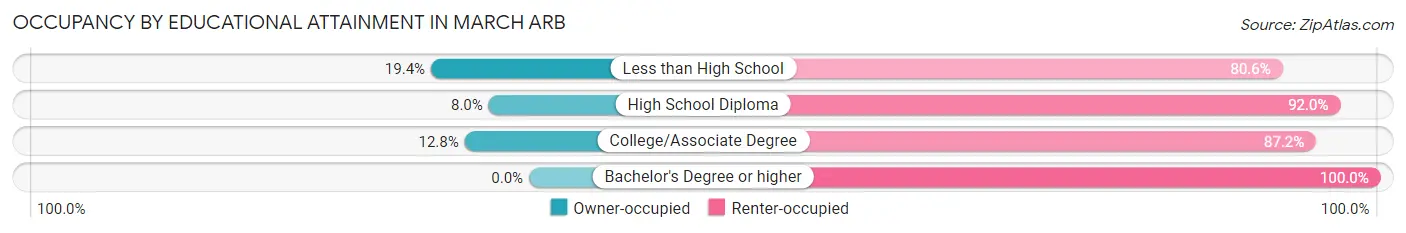
| Household Size | Owner-occupied | Renter-occupied |
| Less than High School | 7 (19.4%) | 29 (80.6%) |
| High School Diploma | 8 (8.0%) | 92 (92.0%) |
| College/Associate Degree | 23 (12.8%) | 157 (87.2%) |
| Bachelor's Degree or higher | 0 (0.0%) | 199 (100.0%) |
Occupancy by Age of Householder in March ARB
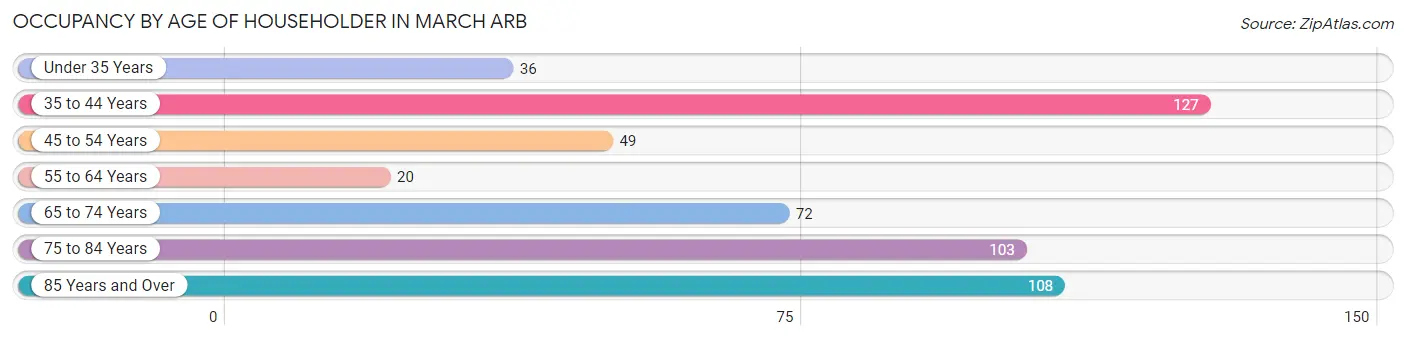
| Age Bracket | # Households | % Households |
| Under 35 Years | 36 | 7.0% |
| 35 to 44 Years | 127 | 24.7% |
| 45 to 54 Years | 49 | 9.5% |
| 55 to 64 Years | 20 | 3.9% |
| 65 to 74 Years | 72 | 14.0% |
| 75 to 84 Years | 103 | 20.0% |
| 85 Years and Over | 108 | 21.0% |
| Total | 515 | 100.0% |
Housing Finances in March ARB
Median Income by Occupancy in March ARB
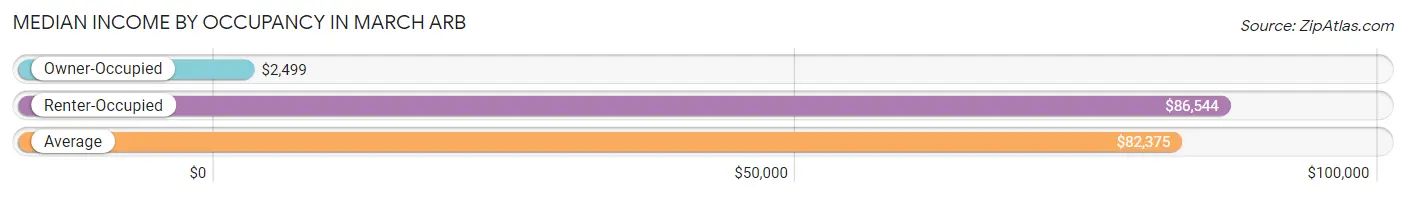
| Occupancy Type | # Households | Median Income |
| Owner-Occupied | 38 (7.4%) | $2,499 |
| Renter-Occupied | 477 (92.6%) | $86,544 |
| Average | 515 (100.0%) | $82,375 |
Occupancy by Householder Income Bracket in March ARB
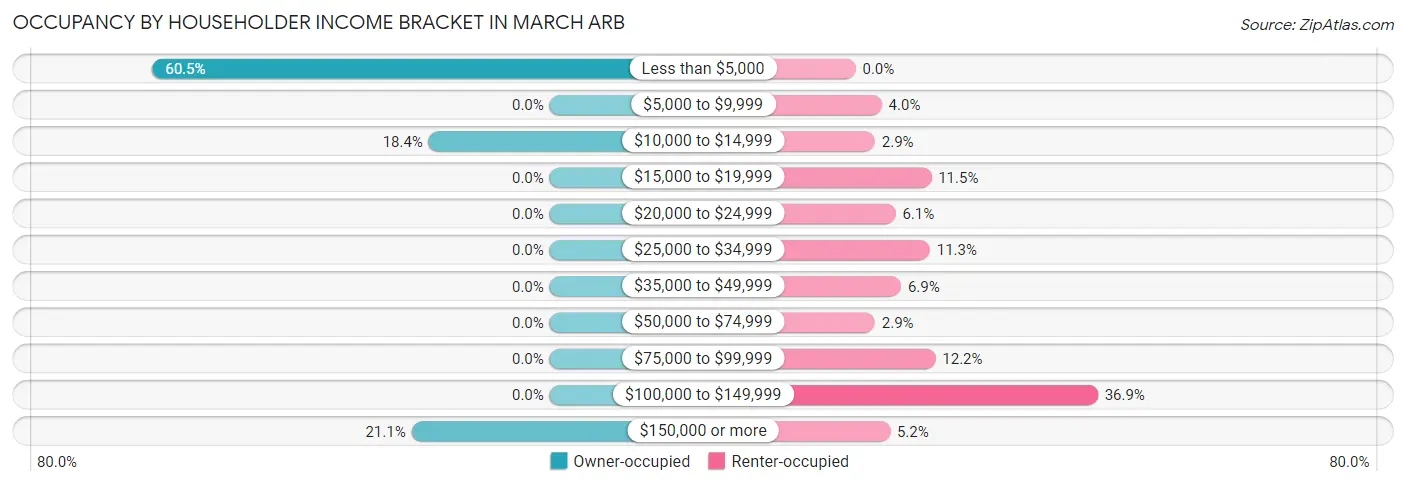
| Income Bracket | Owner-occupied | Renter-occupied |
| Less than $5,000 | 23 (60.5%) | 0 (0.0%) |
| $5,000 to $9,999 | 0 (0.0%) | 19 (4.0%) |
| $10,000 to $14,999 | 7 (18.4%) | 14 (2.9%) |
| $15,000 to $19,999 | 0 (0.0%) | 55 (11.5%) |
| $20,000 to $24,999 | 0 (0.0%) | 29 (6.1%) |
| $25,000 to $34,999 | 0 (0.0%) | 54 (11.3%) |
| $35,000 to $49,999 | 0 (0.0%) | 33 (6.9%) |
| $50,000 to $74,999 | 0 (0.0%) | 14 (2.9%) |
| $75,000 to $99,999 | 0 (0.0%) | 58 (12.2%) |
| $100,000 to $149,999 | 0 (0.0%) | 176 (36.9%) |
| $150,000 or more | 8 (21.0%) | 25 (5.2%) |
| Total | 38 (100.0%) | 477 (100.0%) |
Monthly Housing Cost Tiers in March ARB
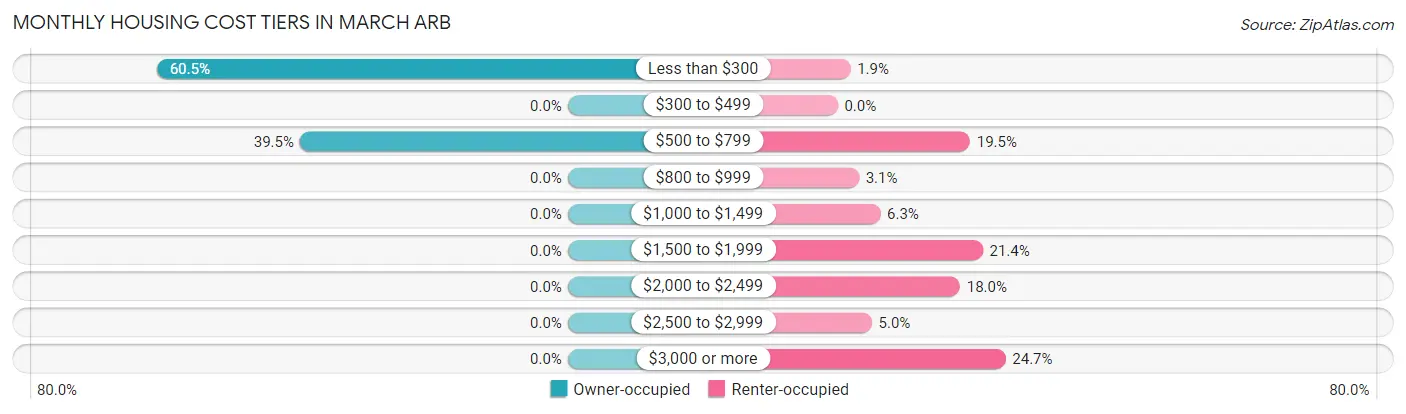
| Monthly Cost | Owner-occupied | Renter-occupied |
| Less than $300 | 23 (60.5%) | 9 (1.9%) |
| $300 to $499 | 0 (0.0%) | 0 (0.0%) |
| $500 to $799 | 15 (39.5%) | 93 (19.5%) |
| $800 to $999 | 0 (0.0%) | 15 (3.1%) |
| $1,000 to $1,499 | 0 (0.0%) | 30 (6.3%) |
| $1,500 to $1,999 | 0 (0.0%) | 102 (21.4%) |
| $2,000 to $2,499 | 0 (0.0%) | 86 (18.0%) |
| $2,500 to $2,999 | 0 (0.0%) | 24 (5.0%) |
| $3,000 or more | 0 (0.0%) | 118 (24.7%) |
| Total | 38 (100.0%) | 477 (100.0%) |
Physical Housing Characteristics in March ARB
Housing Structures in March ARB
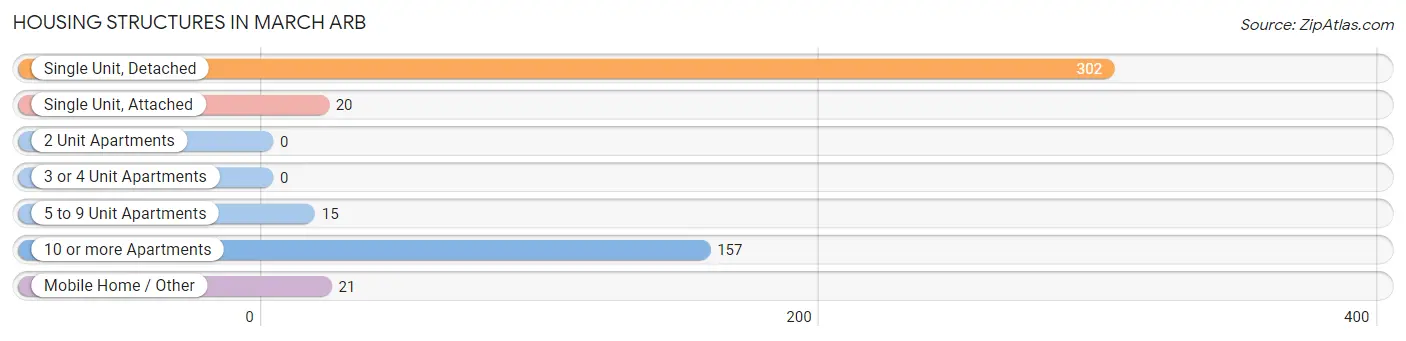
| Structure Type | # Housing Units | % Housing Units |
| Single Unit, Detached | 302 | 58.6% |
| Single Unit, Attached | 20 | 3.9% |
| 2 Unit Apartments | 0 | 0.0% |
| 3 or 4 Unit Apartments | 0 | 0.0% |
| 5 to 9 Unit Apartments | 15 | 2.9% |
| 10 or more Apartments | 157 | 30.5% |
| Mobile Home / Other | 21 | 4.1% |
| Total | 515 | 100.0% |
Housing Structures by Occupancy in March ARB
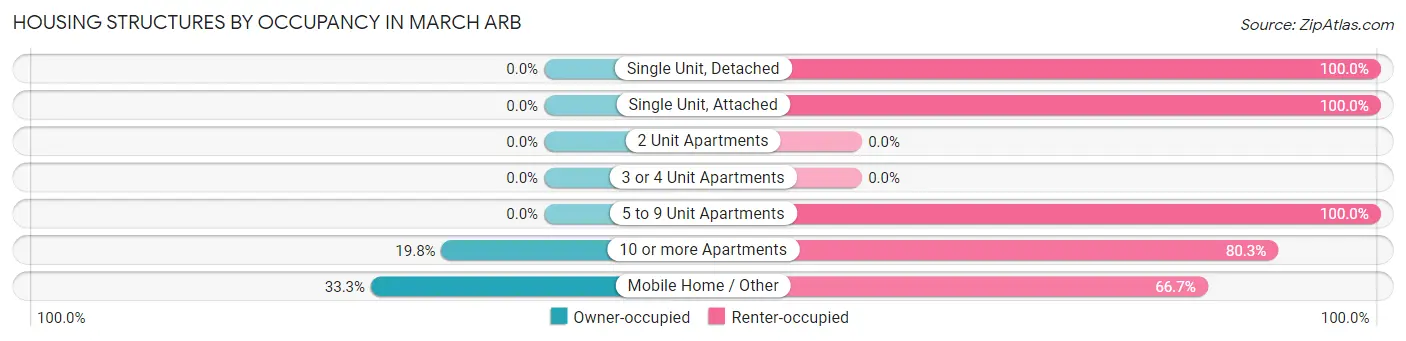
| Structure Type | Owner-occupied | Renter-occupied |
| Single Unit, Detached | 0 (0.0%) | 302 (100.0%) |
| Single Unit, Attached | 0 (0.0%) | 20 (100.0%) |
| 2 Unit Apartments | 0 (0.0%) | 0 (0.0%) |
| 3 or 4 Unit Apartments | 0 (0.0%) | 0 (0.0%) |
| 5 to 9 Unit Apartments | 0 (0.0%) | 15 (100.0%) |
| 10 or more Apartments | 31 (19.8%) | 126 (80.2%) |
| Mobile Home / Other | 7 (33.3%) | 14 (66.7%) |
| Total | 38 (7.4%) | 477 (92.6%) |
Housing Structures by Number of Rooms in March ARB
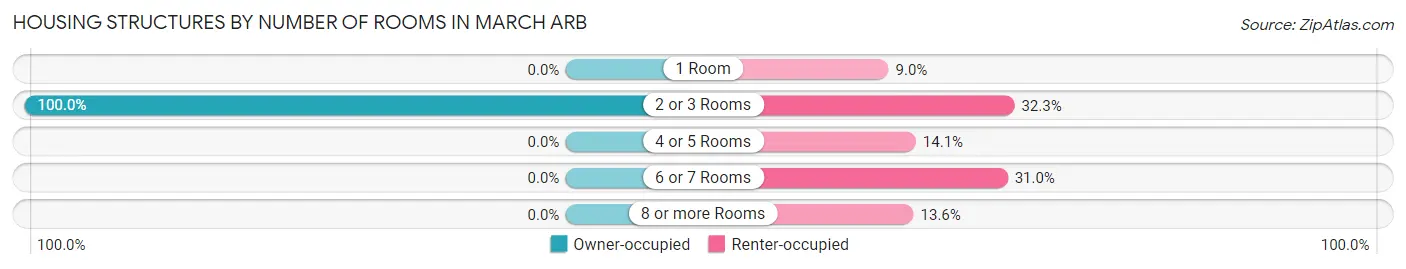
| Number of Rooms | Owner-occupied | Renter-occupied |
| 1 Room | 0 (0.0%) | 43 (9.0%) |
| 2 or 3 Rooms | 38 (100.0%) | 154 (32.3%) |
| 4 or 5 Rooms | 0 (0.0%) | 67 (14.1%) |
| 6 or 7 Rooms | 0 (0.0%) | 148 (31.0%) |
| 8 or more Rooms | 0 (0.0%) | 65 (13.6%) |
| Total | 38 (100.0%) | 477 (100.0%) |
Housing Structure by Heating Type in March ARB
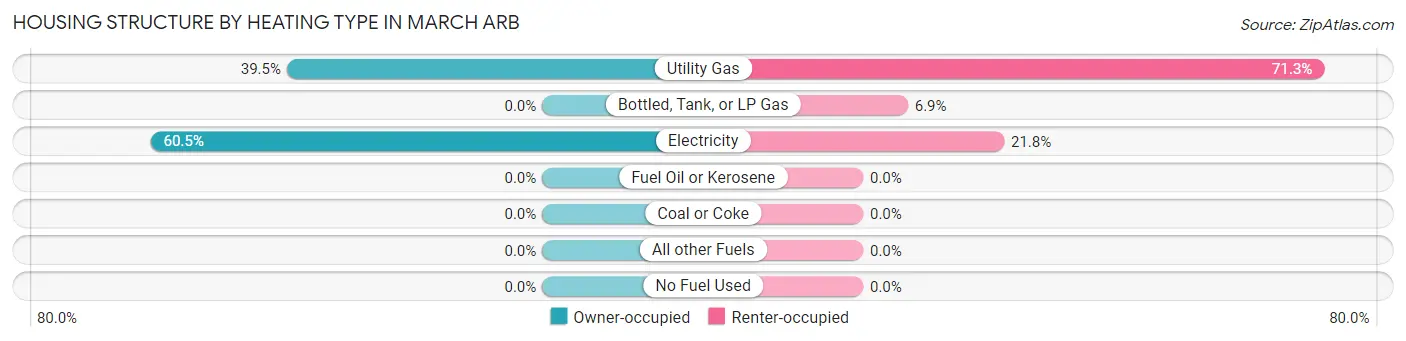
| Heating Type | Owner-occupied | Renter-occupied |
| Utility Gas | 15 (39.5%) | 340 (71.3%) |
| Bottled, Tank, or LP Gas | 0 (0.0%) | 33 (6.9%) |
| Electricity | 23 (60.5%) | 104 (21.8%) |
| Fuel Oil or Kerosene | 0 (0.0%) | 0 (0.0%) |
| Coal or Coke | 0 (0.0%) | 0 (0.0%) |
| All other Fuels | 0 (0.0%) | 0 (0.0%) |
| No Fuel Used | 0 (0.0%) | 0 (0.0%) |
| Total | 38 (100.0%) | 477 (100.0%) |
Household Vehicle Usage in March ARB
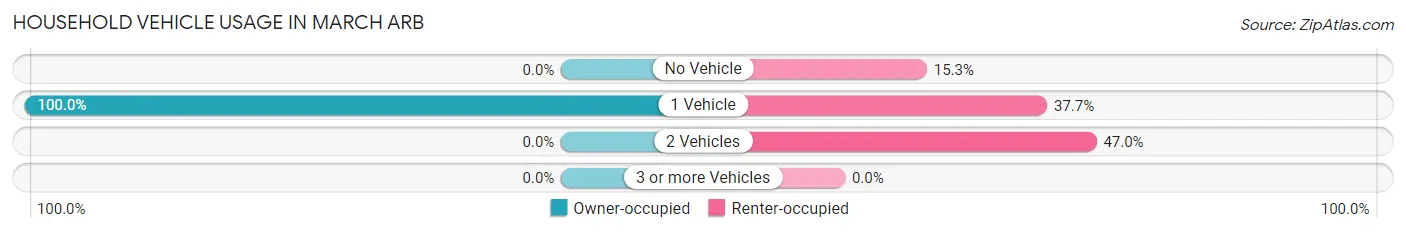
| Vehicles per Household | Owner-occupied | Renter-occupied |
| No Vehicle | 0 (0.0%) | 73 (15.3%) |
| 1 Vehicle | 38 (100.0%) | 180 (37.7%) |
| 2 Vehicles | 0 (0.0%) | 224 (47.0%) |
| 3 or more Vehicles | 0 (0.0%) | 0 (0.0%) |
| Total | 38 (100.0%) | 477 (100.0%) |
Real Estate & Mortgages in March ARB
Real Estate and Mortgage Overview in March ARB
| Characteristic | Without Mortgage | With Mortgage |
| Housing Units | 38 | 0 |
| Median Property Value | $276,100 | $0 |
| Median Household Income | $2,499 | $0 |
| Monthly Housing Costs | - | - |
| Real Estate Taxes | - | - |
Property Value by Mortgage Status in March ARB
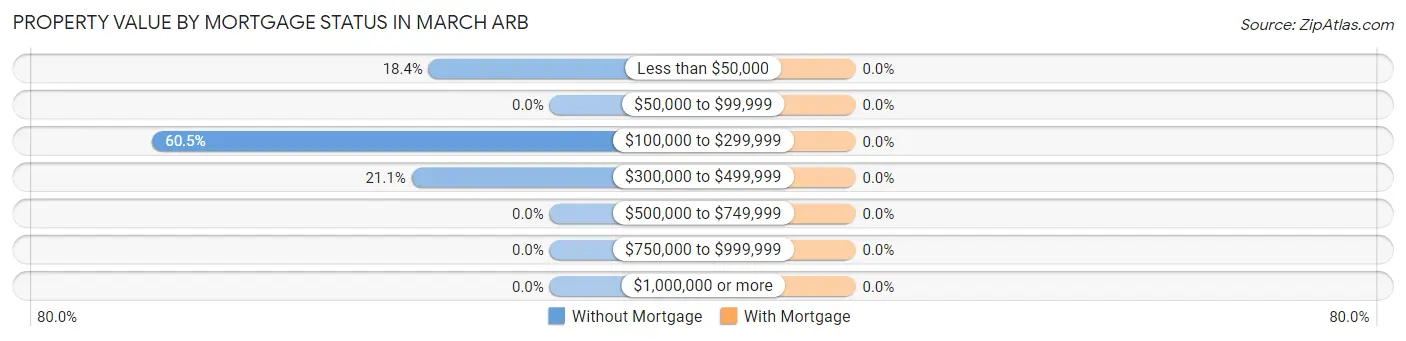
| Property Value | Without Mortgage | With Mortgage |
| Less than $50,000 | 7 (18.4%) | 0 (0.0%) |
| $50,000 to $99,999 | 0 (0.0%) | 0 (0.0%) |
| $100,000 to $299,999 | 23 (60.5%) | 0 (0.0%) |
| $300,000 to $499,999 | 8 (21.0%) | 0 (0.0%) |
| $500,000 to $749,999 | 0 (0.0%) | 0 (0.0%) |
| $750,000 to $999,999 | 0 (0.0%) | 0 (0.0%) |
| $1,000,000 or more | 0 (0.0%) | 0 (0.0%) |
| Total | 38 (100.0%) | 0 (0.0%) |
Household Income by Mortgage Status in March ARB
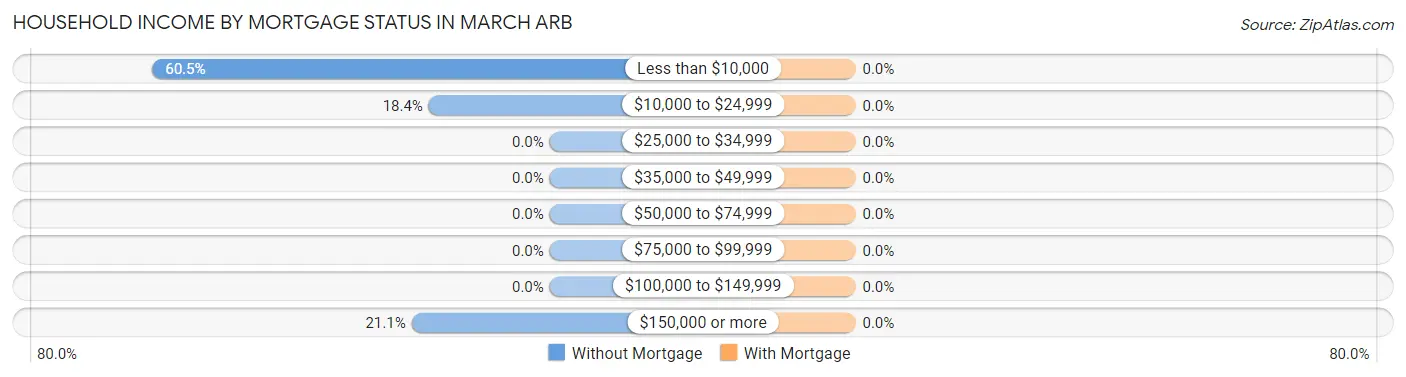
| Household Income | Without Mortgage | With Mortgage |
| Less than $10,000 | 23 (60.5%) | 0 (0.0%) |
| $10,000 to $24,999 | 7 (18.4%) | 0 (0.0%) |
| $25,000 to $34,999 | 0 (0.0%) | 0 (0.0%) |
| $35,000 to $49,999 | 0 (0.0%) | 0 (0.0%) |
| $50,000 to $74,999 | 0 (0.0%) | 0 (0.0%) |
| $75,000 to $99,999 | 0 (0.0%) | 0 (0.0%) |
| $100,000 to $149,999 | 0 (0.0%) | 0 (0.0%) |
| $150,000 or more | 8 (21.0%) | 0 (0.0%) |
| Total | 38 (100.0%) | 0 (0.0%) |
Property Value to Household Income Ratio in March ARB
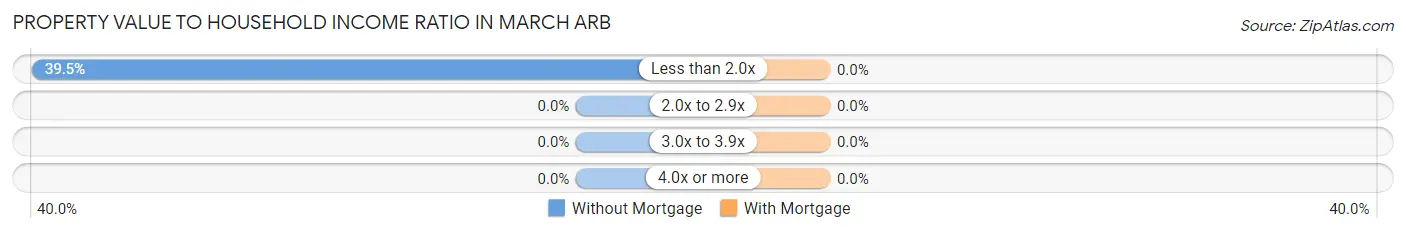
| Value-to-Income Ratio | Without Mortgage | With Mortgage |
| Less than 2.0x | 15 (39.5%) | 0 (0.0%) |
| 2.0x to 2.9x | 0 (0.0%) | 0 (0.0%) |
| 3.0x to 3.9x | 0 (0.0%) | 0 (0.0%) |
| 4.0x or more | 0 (0.0%) | 0 (0.0%) |
| Total | 38 (100.0%) | 0 (0.0%) |
Real Estate Taxes by Mortgage Status in March ARB
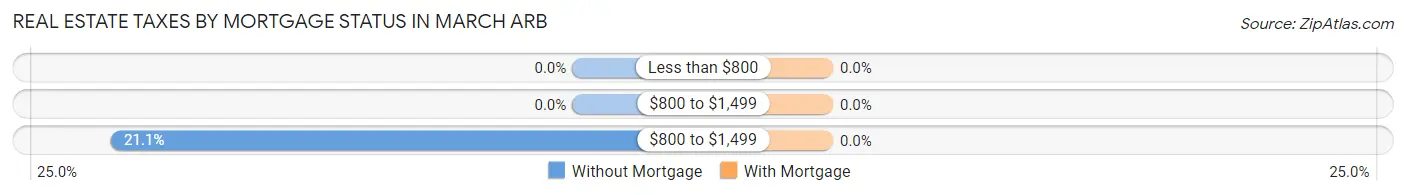
| Property Taxes | Without Mortgage | With Mortgage |
| Less than $800 | 0 (0.0%) | 0 (0.0%) |
| $800 to $1,499 | 0 (0.0%) | 0 (0.0%) |
| $800 to $1,499 | 8 (21.0%) | 0 (0.0%) |
| Total | 38 (100.0%) | 0 (0.0%) |
Health & Disability in March ARB
Health Insurance Coverage by Age in March ARB
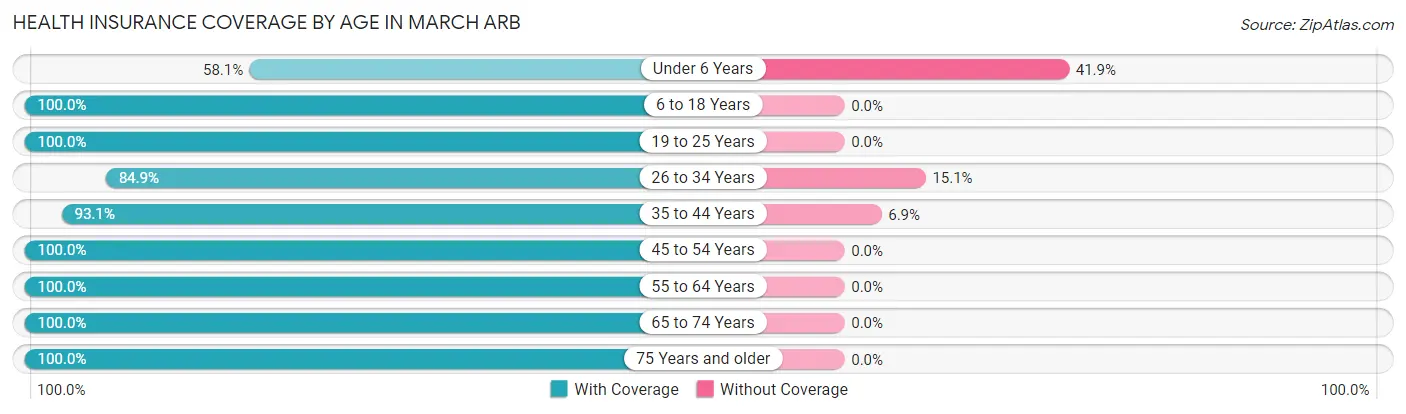
| Age Bracket | With Coverage | Without Coverage |
| Under 6 Years | 25 (58.1%) | 18 (41.9%) |
| 6 to 18 Years | 292 (100.0%) | 0 (0.0%) |
| 19 to 25 Years | 18 (100.0%) | 0 (0.0%) |
| 26 to 34 Years | 129 (84.9%) | 23 (15.1%) |
| 35 to 44 Years | 162 (93.1%) | 12 (6.9%) |
| 45 to 54 Years | 49 (100.0%) | 0 (0.0%) |
| 55 to 64 Years | 27 (100.0%) | 0 (0.0%) |
| 65 to 74 Years | 89 (100.0%) | 0 (0.0%) |
| 75 Years and older | 275 (100.0%) | 0 (0.0%) |
| Total | 1,066 (95.3%) | 53 (4.7%) |
Health Insurance Coverage by Citizenship Status in March ARB
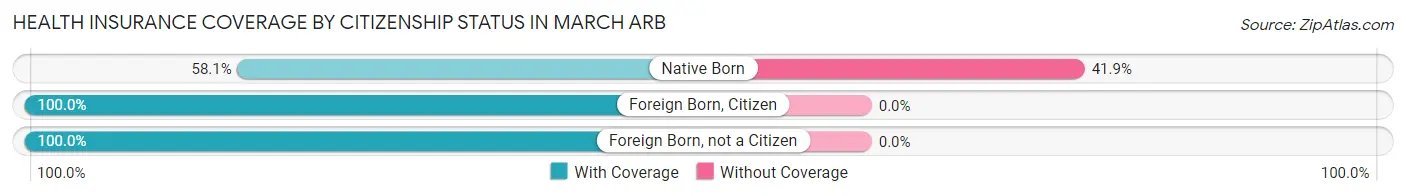
| Citizenship Status | With Coverage | Without Coverage |
| Native Born | 25 (58.1%) | 18 (41.9%) |
| Foreign Born, Citizen | 292 (100.0%) | 0 (0.0%) |
| Foreign Born, not a Citizen | 18 (100.0%) | 0 (0.0%) |
Health Insurance Coverage by Household Income in March ARB
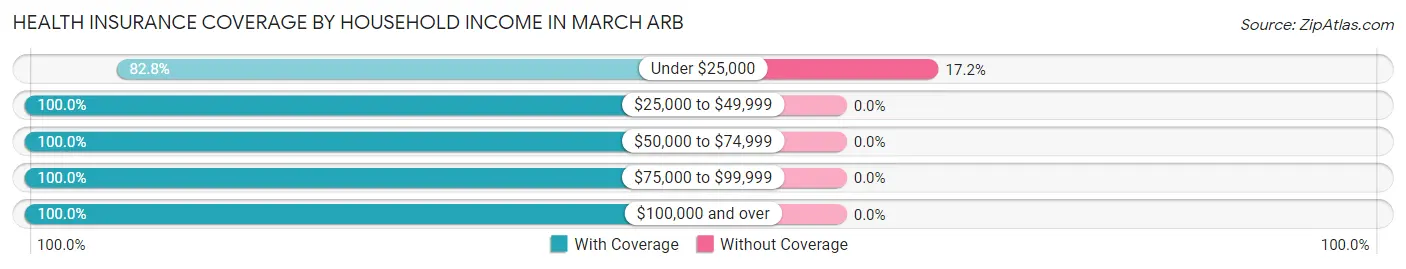
| Household Income | With Coverage | Without Coverage |
| Under $25,000 | 255 (82.8%) | 53 (17.2%) |
| $25,000 to $49,999 | 101 (100.0%) | 0 (0.0%) |
| $50,000 to $74,999 | 14 (100.0%) | 0 (0.0%) |
| $75,000 to $99,999 | 206 (100.0%) | 0 (0.0%) |
| $100,000 and over | 472 (100.0%) | 0 (0.0%) |
Public vs Private Health Insurance Coverage by Age in March ARB
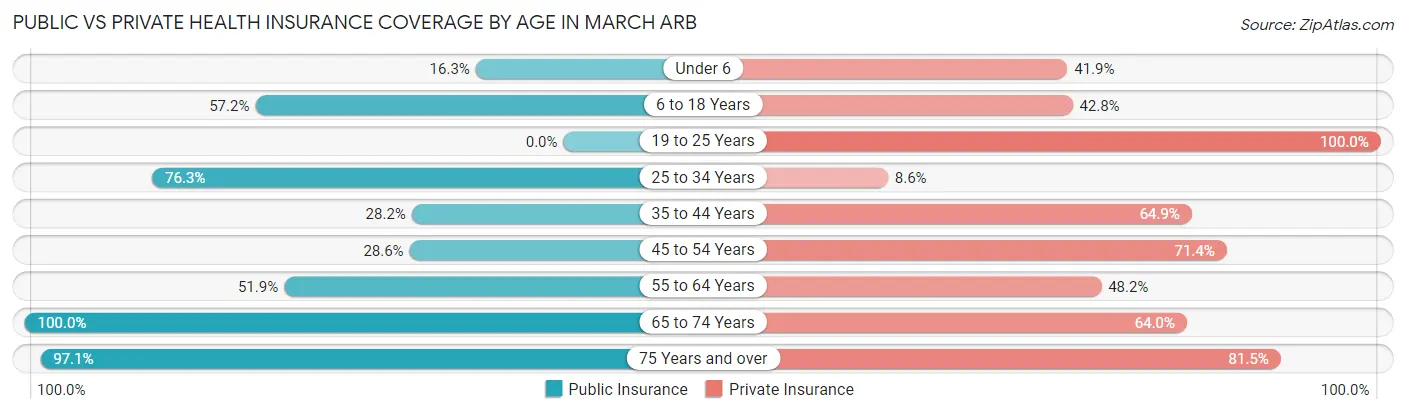
| Age Bracket | Public Insurance | Private Insurance |
| Under 6 | 7 (16.3%) | 18 (41.9%) |
| 6 to 18 Years | 167 (57.2%) | 125 (42.8%) |
| 19 to 25 Years | 0 (0.0%) | 18 (100.0%) |
| 25 to 34 Years | 116 (76.3%) | 13 (8.6%) |
| 35 to 44 Years | 49 (28.2%) | 113 (64.9%) |
| 45 to 54 Years | 14 (28.6%) | 35 (71.4%) |
| 55 to 64 Years | 14 (51.8%) | 13 (48.1%) |
| 65 to 74 Years | 89 (100.0%) | 57 (64.0%) |
| 75 Years and over | 267 (97.1%) | 224 (81.5%) |
| Total | 723 (64.6%) | 616 (55.0%) |
Disability Status by Sex by Age in March ARB
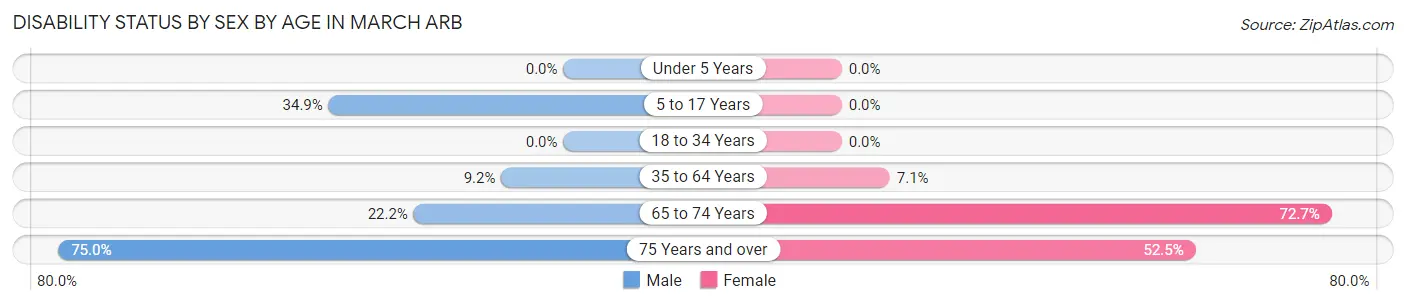
| Age Bracket | Male | Female |
| Under 5 Years | 0 (0.0%) | 0 (0.0%) |
| 5 to 17 Years | 61 (34.9%) | 0 (0.0%) |
| 18 to 34 Years | 0 (0.0%) | 0 (0.0%) |
| 35 to 64 Years | 14 (9.2%) | 7 (7.1%) |
| 65 to 74 Years | 10 (22.2%) | 32 (72.7%) |
| 75 Years and over | 102 (75.0%) | 73 (52.5%) |
Disability Class by Sex by Age in March ARB
Disability Class: Hearing Difficulty
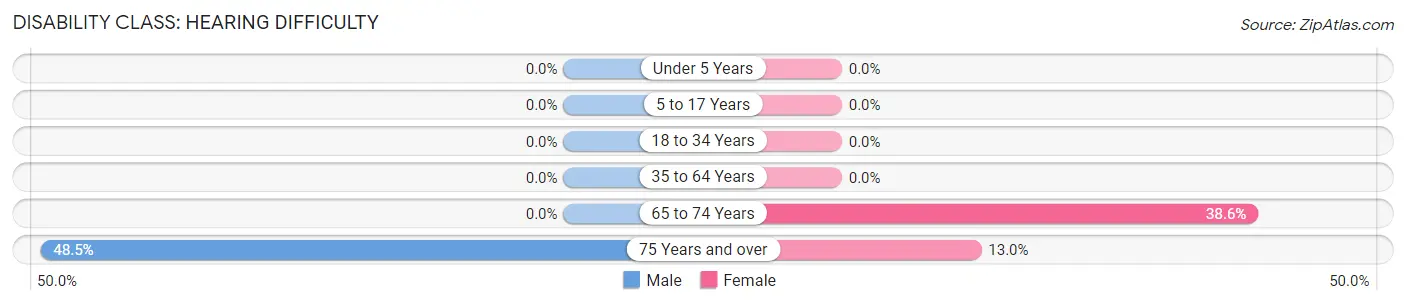
| Age Bracket | Male | Female |
| Under 5 Years | 0 (0.0%) | 0 (0.0%) |
| 5 to 17 Years | 0 (0.0%) | 0 (0.0%) |
| 18 to 34 Years | 0 (0.0%) | 0 (0.0%) |
| 35 to 64 Years | 0 (0.0%) | 0 (0.0%) |
| 65 to 74 Years | 0 (0.0%) | 17 (38.6%) |
| 75 Years and over | 66 (48.5%) | 18 (13.0%) |
Disability Class: Vision Difficulty
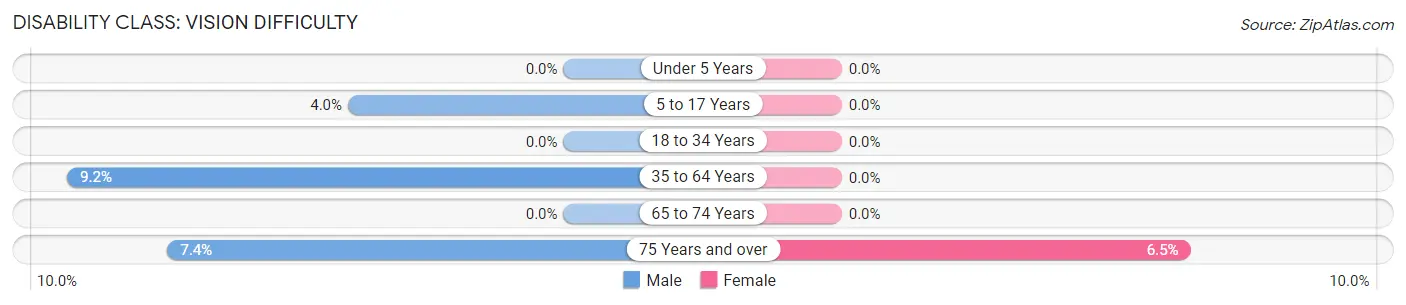
| Age Bracket | Male | Female |
| Under 5 Years | 0 (0.0%) | 0 (0.0%) |
| 5 to 17 Years | 7 (4.0%) | 0 (0.0%) |
| 18 to 34 Years | 0 (0.0%) | 0 (0.0%) |
| 35 to 64 Years | 14 (9.2%) | 0 (0.0%) |
| 65 to 74 Years | 0 (0.0%) | 0 (0.0%) |
| 75 Years and over | 10 (7.3%) | 9 (6.5%) |
Disability Class: Cognitive Difficulty
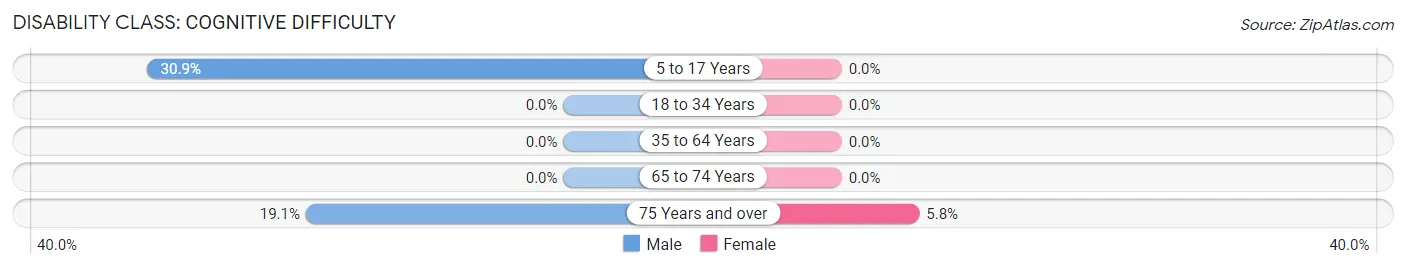
| Age Bracket | Male | Female |
| 5 to 17 Years | 54 (30.9%) | 0 (0.0%) |
| 18 to 34 Years | 0 (0.0%) | 0 (0.0%) |
| 35 to 64 Years | 0 (0.0%) | 0 (0.0%) |
| 65 to 74 Years | 0 (0.0%) | 0 (0.0%) |
| 75 Years and over | 26 (19.1%) | 8 (5.8%) |
Disability Class: Ambulatory Difficulty
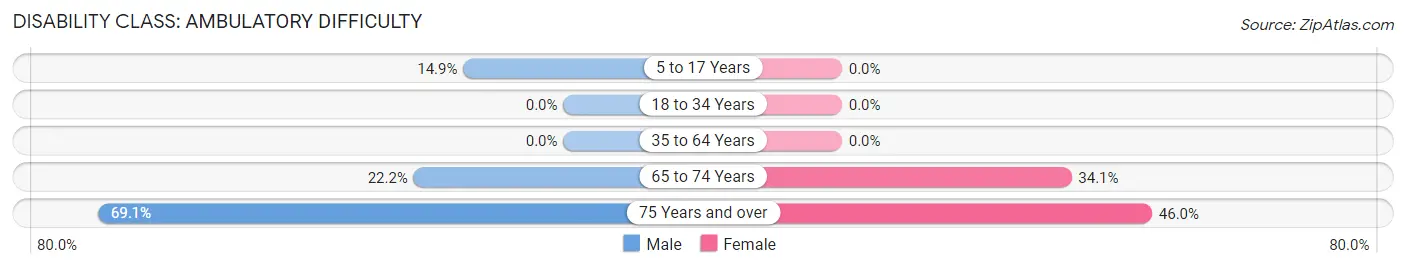
| Age Bracket | Male | Female |
| 5 to 17 Years | 26 (14.9%) | 0 (0.0%) |
| 18 to 34 Years | 0 (0.0%) | 0 (0.0%) |
| 35 to 64 Years | 0 (0.0%) | 0 (0.0%) |
| 65 to 74 Years | 10 (22.2%) | 15 (34.1%) |
| 75 Years and over | 94 (69.1%) | 64 (46.0%) |
Disability Class: Self-Care Difficulty
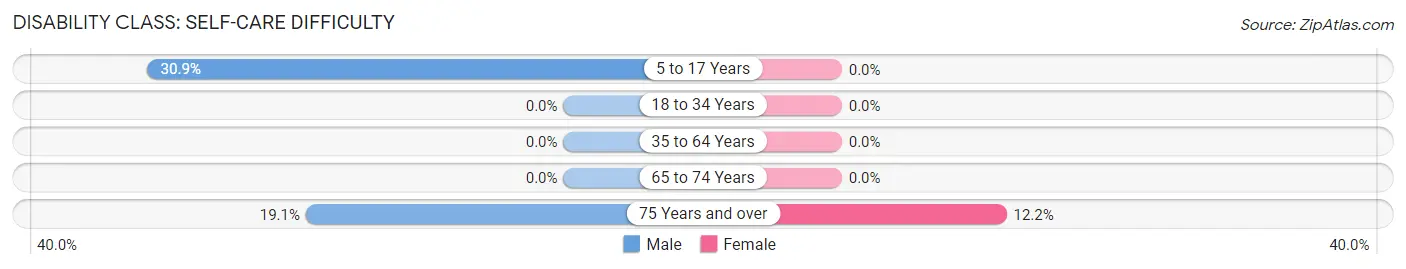
| Age Bracket | Male | Female |
| 5 to 17 Years | 54 (30.9%) | 0 (0.0%) |
| 18 to 34 Years | 0 (0.0%) | 0 (0.0%) |
| 35 to 64 Years | 0 (0.0%) | 0 (0.0%) |
| 65 to 74 Years | 0 (0.0%) | 0 (0.0%) |
| 75 Years and over | 26 (19.1%) | 17 (12.2%) |
Technology Access in March ARB
Computing Device Access in March ARB
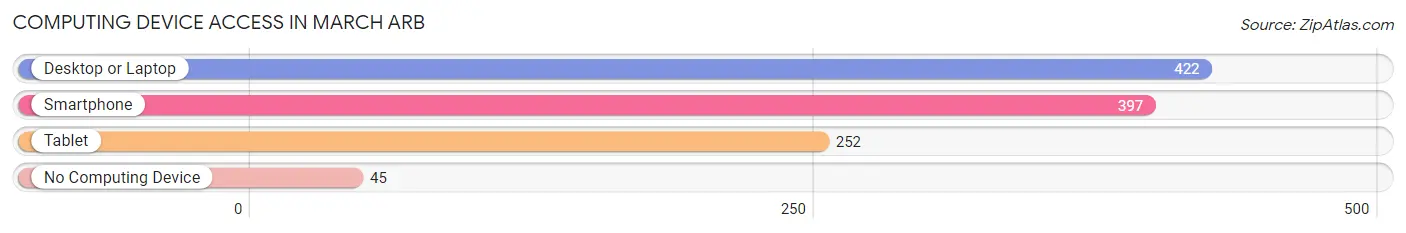
| Device Type | # Households | % Households |
| Desktop or Laptop | 422 | 81.9% |
| Smartphone | 397 | 77.1% |
| Tablet | 252 | 48.9% |
| No Computing Device | 45 | 8.7% |
| Total | 515 | 100.0% |
Internet Access in March ARB
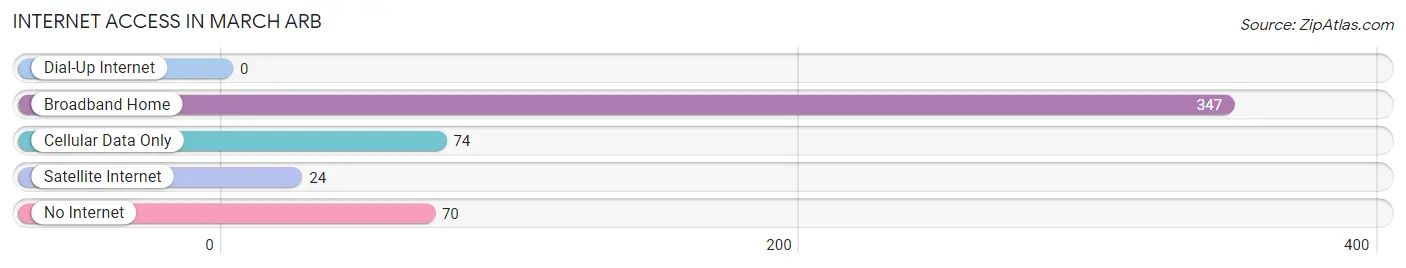
| Internet Type | # Households | % Households |
| Dial-Up Internet | 0 | 0.0% |
| Broadband Home | 347 | 67.4% |
| Cellular Data Only | 74 | 14.4% |
| Satellite Internet | 24 | 4.7% |
| No Internet | 70 | 13.6% |
| Total | 515 | 100.0% |
March ARB Summary
March Arb is a census-designated place located in Riverside County, California. It is situated in the San Bernardino Valley, approximately 8 miles east of San Bernardino and 60 miles east of Los Angeles. The population of March Arb was 2,521 at the 2010 census.
History
March Arb was originally part of the San Bernardino Valley, which was inhabited by the Serrano and Cahuilla Native American tribes. The area was first explored by Spanish missionaries in the late 1700s. In 1845, the area was granted to the Lugo family, who established a large ranch in the area. The ranch was later sold to the March family in 1876, and the area became known as March Field.
In 1918, the United States Army established a military base in the area, which was named March Field. The base was used as a training facility during World War I and World War II. After the war, the base was renamed March Air Force Base. The base was used as a strategic air command base during the Cold War and was the home of the Air Force's first jet fighter squadron.
In 1996, the base was renamed March Air Reserve Base. Today, the base is home to the 452nd Air Mobility Wing, which is part of the Air Force Reserve Command.
Geography
March Arb is located at 34°5'25"N 117°14'25"W. It is situated in the San Bernardino Valley, approximately 8 miles east of San Bernardino and 60 miles east of Los Angeles. The area is mostly flat, with an elevation of 1,068 feet.
Economy
March Arb is primarily a military town, with the March Air Reserve Base being the main source of employment. The base is home to the 452nd Air Mobility Wing, which is part of the Air Force Reserve Command. The base is also home to a number of other military units, including the Air Force Reserve Command's 4th Air Force, the Air National Guard's 163rd Reconnaissance Wing, and the California Air National Guard's 146th Airlift Wing.
The base also houses a number of other businesses, including a shopping center, a movie theater, a bowling alley, and a golf course. In addition, the base is home to a number of restaurants, hotels, and other businesses.
Demographics
As of the 2010 census, there were 2,521 people, 845 households, and 645 families residing in March Arb. The population density was 1,845.3 people per square mile. The racial makeup of the town was 73.2% White, 11.2% African American, 0.7% Native American, 5.2% Asian, 0.2% Pacific Islander, 5.2% from other races, and 4.3% from two or more races. Hispanic or Latino of any race were 15.2% of the population.
The median income for a household in March Arb was $50,938, and the median income for a family was $60,938. The per capita income for the town was $21,938. About 6.2% of families and 8.2% of the population were below the poverty line, including 10.2% of those under age 18 and 4.2% of those age 65 or over.
Common Questions
What is Per Capita Income in March ARB?
Per Capita income in March ARB is $36,324.
What is the Median Family Income in March ARB?
Median Family Income in March ARB is $92,670.
What is the Median Household income in March ARB?
Median Household Income in March ARB is $82,375.
What is Inequality or Gini Index in March ARB?
Inequality or Gini Index in March ARB is 0.45.
What is the Total Population of March ARB?
Total Population of March ARB is 1,175.
What is the Total Male Population of March ARB?
Total Male Population of March ARB is 572.
What is the Total Female Population of March ARB?
Total Female Population of March ARB is 603.
What is the Ratio of Males per 100 Females in March ARB?
There are 94.86 Males per 100 Females in March ARB.
What is the Ratio of Females per 100 Males in March ARB?
There are 105.42 Females per 100 Males in March ARB.
What is the Median Population Age in March ARB?
Median Population Age in March ARB is 38.6 Years.
What is the Average Family Size in March ARB
Average Family Size in March ARB is 3.2 People.
What is the Average Household Size in March ARB
Average Household Size in March ARB is 2.2 People.
How Large is the Labor Force in March ARB?
There are 224 People in the Labor Forcein in March ARB.
What is the Percentage of People in the Labor Force in March ARB?
26.0% of People are in the Labor Force in March ARB.