Carnelian Bay, CA Map & Demographics
Carnelian Bay Map
Carnelian Bay Overview
$74,155
PER CAPITA INCOME
$130,750
AVG HOUSEHOLD INCOME
45.1%
WAGE / INCOME GAP [ % ]
54.9¢/ $1
WAGE / INCOME GAP [ $ ]
0.26
INEQUALITY / GINI INDEX
534
TOTAL POPULATION
262
MALE POPULATION
272
FEMALE POPULATION
96.32
MALES / 100 FEMALES
103.82
FEMALES / 100 MALES
40.3
MEDIAN AGE
2.7
AVG FAMILY SIZE
2.1
AVG HOUSEHOLD SIZE
336
LABOR FORCE [ PEOPLE ]
70.3%
PERCENT IN LABOR FORCE
Carnelian Bay Zip Codes
Income in Carnelian Bay
Income Overview in Carnelian Bay
| Characteristic | Number | Measure |
| Per Capita Income | 534 | $74,155 |
| Median Family Income | 117 | $0 |
| Mean Family Income | 117 | $159,019 |
| Median Household Income | 254 | $130,750 |
| Mean Household Income | 254 | $151,784 |
| Income Deficit | 117 | $0 |
| Wage / Income Gap (%) | 534 | 45.07% |
| Wage / Income Gap ($) | 534 | 54.93¢ per $1 |
| Gini / Inequality Index | 534 | 0.26 |
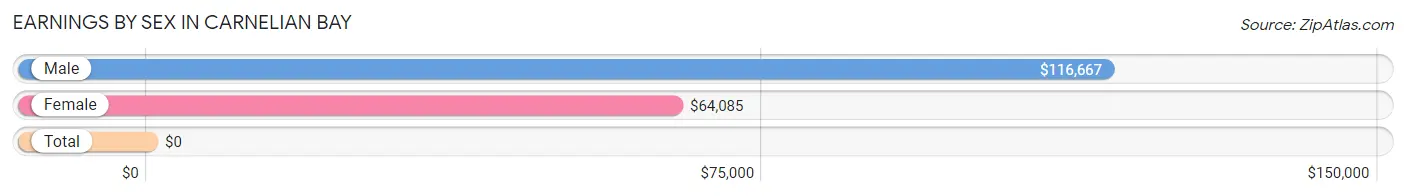
Earnings by Sex in Carnelian Bay
| Sex | Number | Average Earnings |
| Male | 192 (55.5%) | $116,667 |
| Female | 154 (44.5%) | $64,085 |
| Total | 346 (100.0%) | $0 |
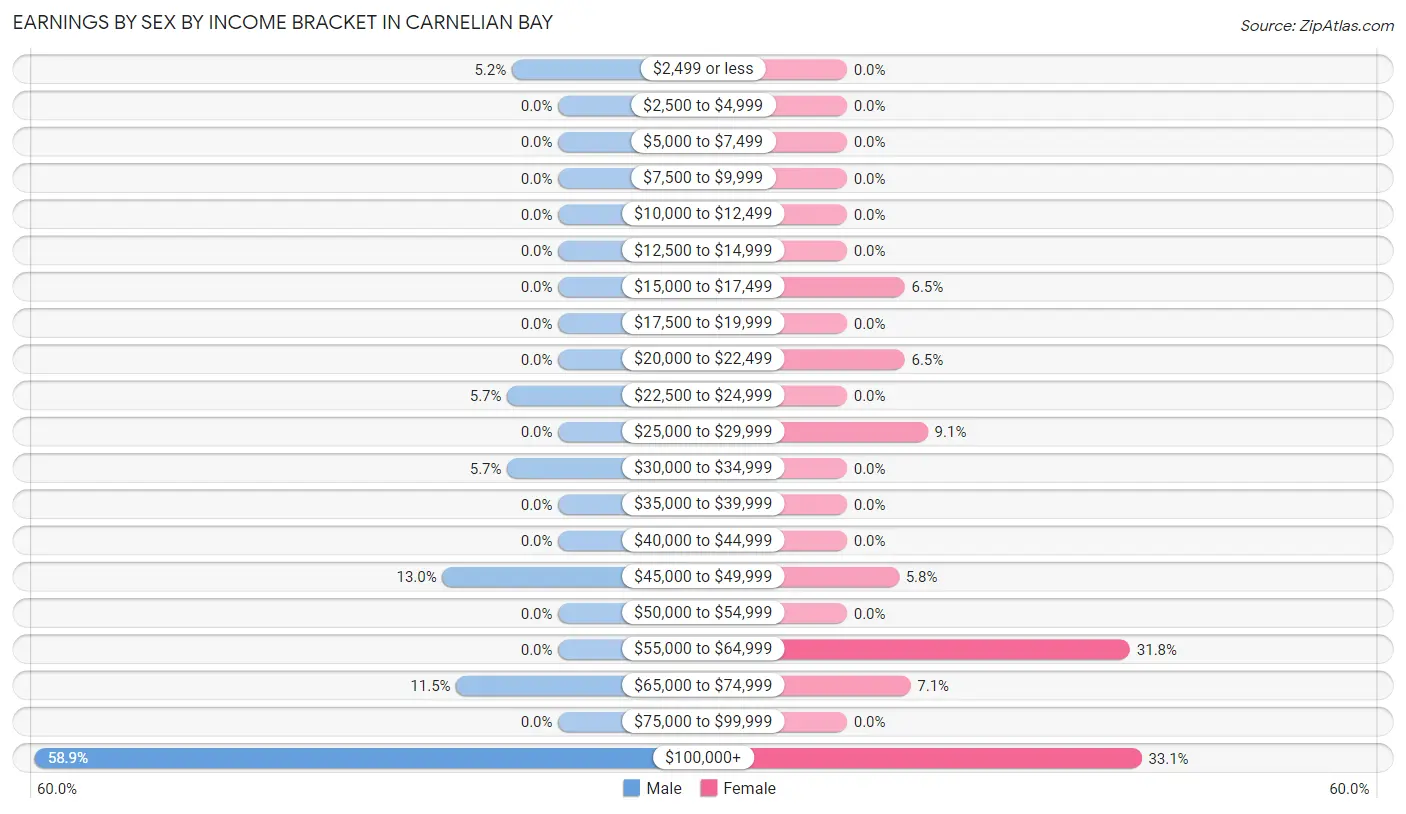
Earnings by Sex by Income Bracket in Carnelian Bay
The most common earnings brackets in Carnelian Bay are $100,000+ for men (113 | 58.9%) and $100,000+ for women (51 | 33.1%).
| Income | Male | Female |
| $2,499 or less | 10 (5.2%) | 0 (0.0%) |
| $2,500 to $4,999 | 0 (0.0%) | 0 (0.0%) |
| $5,000 to $7,499 | 0 (0.0%) | 0 (0.0%) |
| $7,500 to $9,999 | 0 (0.0%) | 0 (0.0%) |
| $10,000 to $12,499 | 0 (0.0%) | 0 (0.0%) |
| $12,500 to $14,999 | 0 (0.0%) | 0 (0.0%) |
| $15,000 to $17,499 | 0 (0.0%) | 10 (6.5%) |
| $17,500 to $19,999 | 0 (0.0%) | 0 (0.0%) |
| $20,000 to $22,499 | 0 (0.0%) | 10 (6.5%) |
| $22,500 to $24,999 | 11 (5.7%) | 0 (0.0%) |
| $25,000 to $29,999 | 0 (0.0%) | 14 (9.1%) |
| $30,000 to $34,999 | 11 (5.7%) | 0 (0.0%) |
| $35,000 to $39,999 | 0 (0.0%) | 0 (0.0%) |
| $40,000 to $44,999 | 0 (0.0%) | 0 (0.0%) |
| $45,000 to $49,999 | 25 (13.0%) | 9 (5.8%) |
| $50,000 to $54,999 | 0 (0.0%) | 0 (0.0%) |
| $55,000 to $64,999 | 0 (0.0%) | 49 (31.8%) |
| $65,000 to $74,999 | 22 (11.5%) | 11 (7.1%) |
| $75,000 to $99,999 | 0 (0.0%) | 0 (0.0%) |
| $100,000+ | 113 (58.9%) | 51 (33.1%) |
| Total | 192 (100.0%) | 154 (100.0%) |
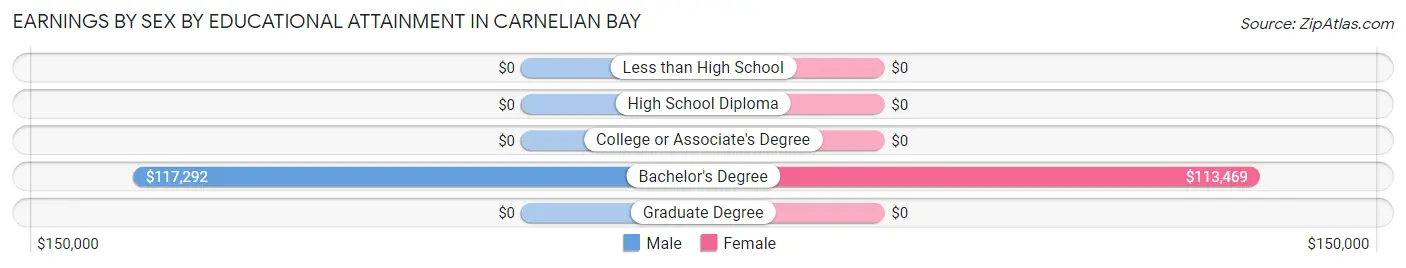
Earnings by Sex by Educational Attainment in Carnelian Bay
Average earnings in Carnelian Bay are $120,375 for men and $64,512 for women, a difference of 46.4%. Men with an educational attainment of bachelor's degree enjoy the highest average annual earnings of $117,292, while those with bachelor's degree education earn the least with $117,292. Women with an educational attainment of bachelor's degree earn the most with the average annual earnings of $113,469, while those with bachelor's degree education have the smallest earnings of $113,469.
| Educational Attainment | Male Income | Female Income |
| Less than High School | - | - |
| High School Diploma | - | - |
| College or Associate's Degree | - | - |
| Bachelor's Degree | $117,292 | $113,469 |
| Graduate Degree | - | - |
| Total | $120,375 | $64,512 |
Family Income in Carnelian Bay
Family Income Brackets in Carnelian Bay
According to the Carnelian Bay family income data, there are 52 families falling into the $200,000+ income range, which is the most common income bracket and makes up 44.4% of all families.
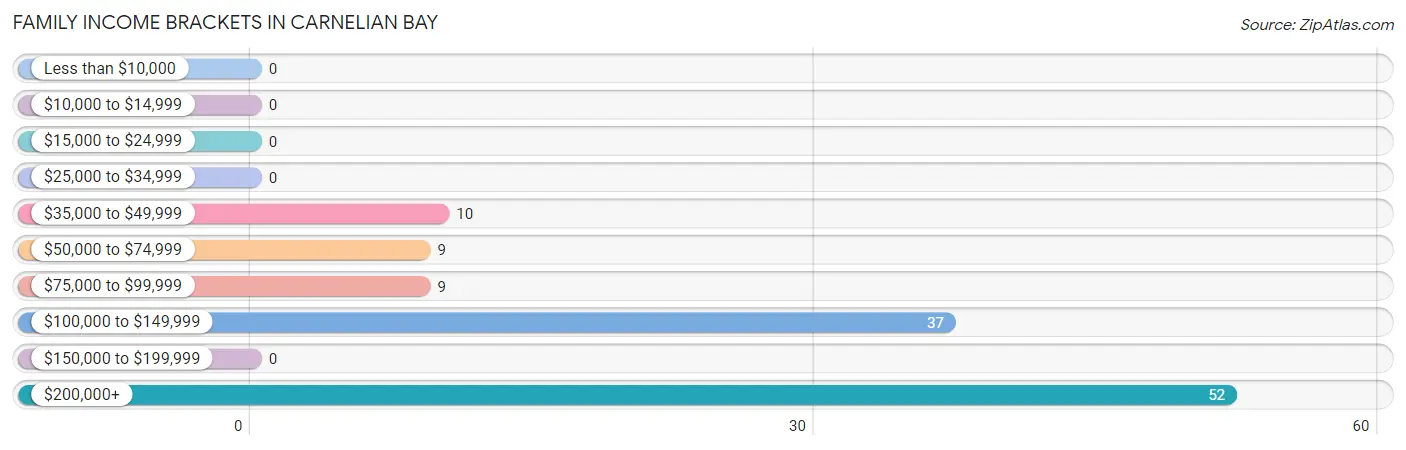
| Income Bracket | # Families | % Families |
| Less than $10,000 | 0 | 0.0% |
| $10,000 to $14,999 | 0 | 0.0% |
| $15,000 to $24,999 | 0 | 0.0% |
| $25,000 to $34,999 | 0 | 0.0% |
| $35,000 to $49,999 | 10 | 8.5% |
| $50,000 to $74,999 | 9 | 7.7% |
| $75,000 to $99,999 | 9 | 7.7% |
| $100,000 to $149,999 | 37 | 31.6% |
| $150,000 to $199,999 | 0 | 0.0% |
| $200,000+ | 52 | 44.4% |
Family Income by Famaliy Size in Carnelian Bay
2-person families (56 | 47.9%) account for the highest median family income in Carnelian Bay with $124,750 per family, while 2-person families (56 | 47.9%) have the highest median income of $62,375 per family member.
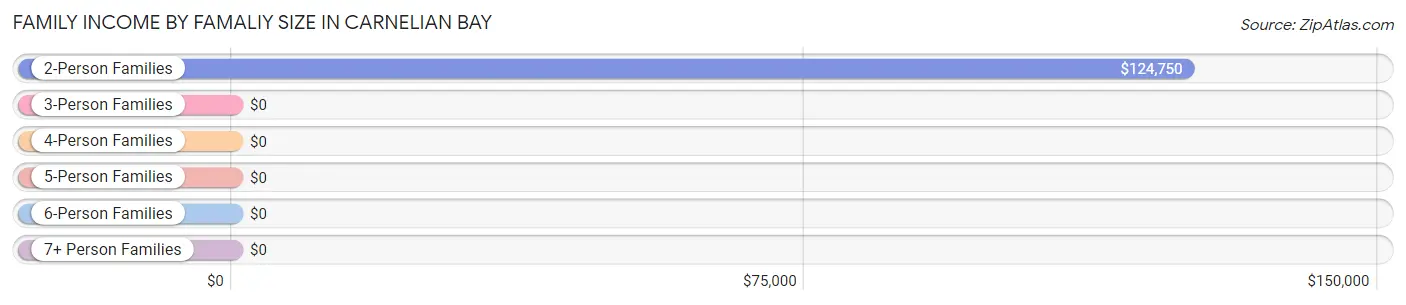
| Income Bracket | # Families | Median Income |
| 2-Person Families | 56 (47.9%) | $124,750 |
| 3-Person Families | 50 (42.7%) | $0 |
| 4-Person Families | 11 (9.4%) | $0 |
| 5-Person Families | 0 (0.0%) | $0 |
| 6-Person Families | 0 (0.0%) | $0 |
| 7+ Person Families | 0 (0.0%) | $0 |
| Total | 117 (100.0%) | $0 |
Family Income by Number of Earners in Carnelian Bay
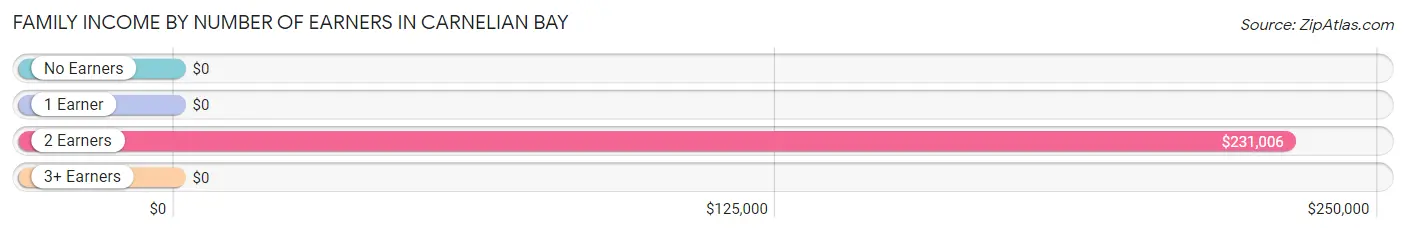
| Number of Earners | # Families | Median Income |
| No Earners | 26 (22.2%) | $0 |
| 1 Earner | 20 (17.1%) | $0 |
| 2 Earners | 71 (60.7%) | $231,006 |
| 3+ Earners | 0 (0.0%) | $0 |
| Total | 117 (100.0%) | $0 |
Household Income in Carnelian Bay
Household Income Brackets in Carnelian Bay
With 92 households falling in the category, the $200,000+ income range is the most frequent in Carnelian Bay, accounting for 36.2% of all households.
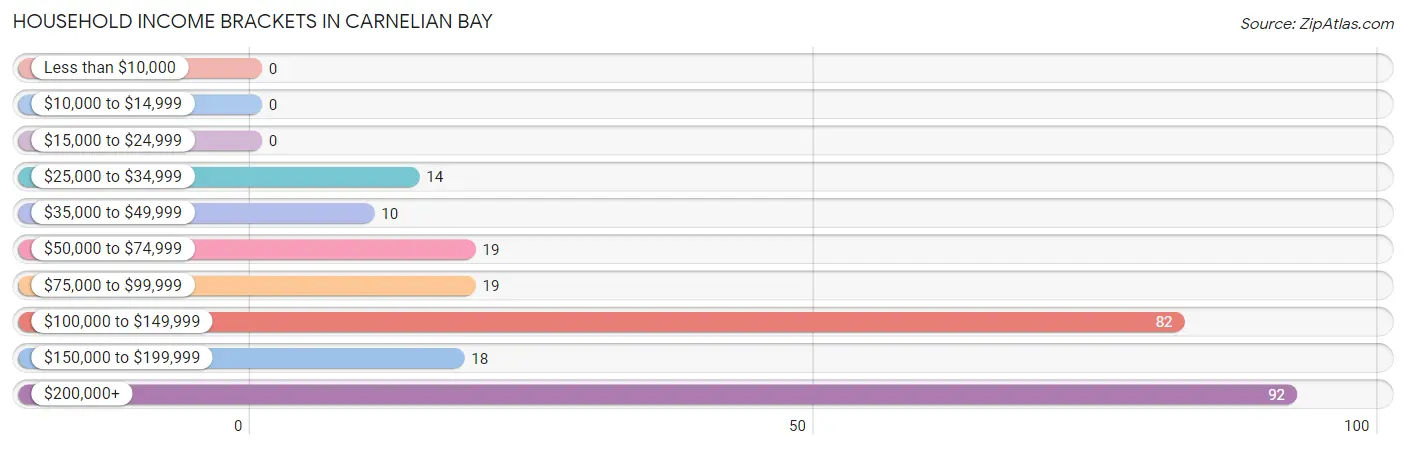
| Income Bracket | # Households | % Households |
| Less than $10,000 | 0 | 0.0% |
| $10,000 to $14,999 | 0 | 0.0% |
| $15,000 to $24,999 | 0 | 0.0% |
| $25,000 to $34,999 | 14 | 5.5% |
| $35,000 to $49,999 | 10 | 3.9% |
| $50,000 to $74,999 | 19 | 7.5% |
| $75,000 to $99,999 | 19 | 7.5% |
| $100,000 to $149,999 | 82 | 32.3% |
| $150,000 to $199,999 | 18 | 7.1% |
| $200,000+ | 92 | 36.2% |
Household Income by Householder Age in Carnelian Bay
The median household income in Carnelian Bay is $130,750, with the highest median household income of $230,915 found in the 25 to 44 years age bracket for the primary householder. A total of 132 households (52.0%) fall into this category.
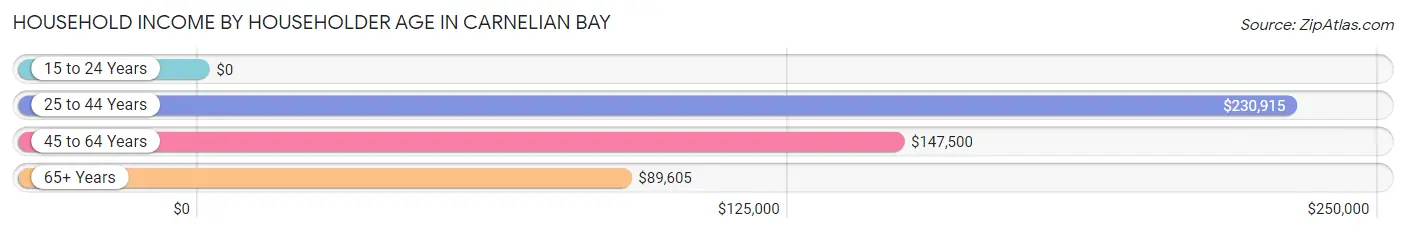
| Income Bracket | # Households | Median Income |
| 15 to 24 Years | 0 (0.0%) | $0 |
| 25 to 44 Years | 132 (52.0%) | $230,915 |
| 45 to 64 Years | 42 (16.5%) | $147,500 |
| 65+ Years | 80 (31.5%) | $89,605 |
| Total | 254 (100.0%) | $130,750 |
Poverty in Carnelian Bay
Income Below Poverty by Sex and Age in Carnelian Bay
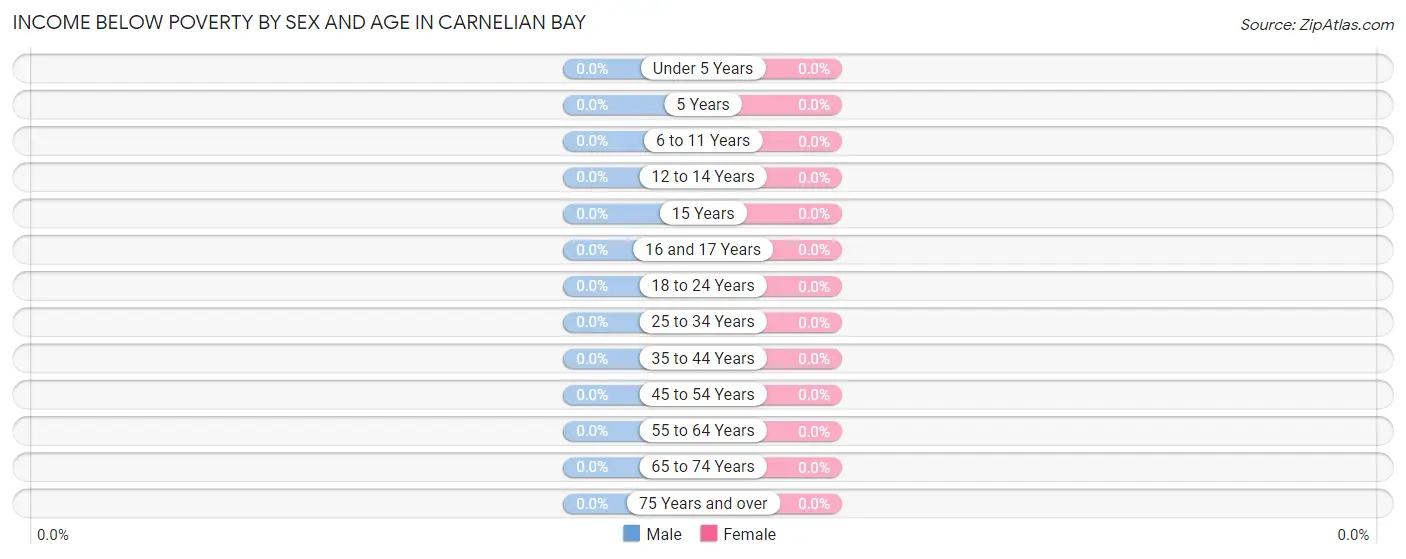
| Age Bracket | Male | Female |
| Under 5 Years | 0 (0.0%) | 0 (0.0%) |
| 5 Years | 0 (0.0%) | 0 (0.0%) |
| 6 to 11 Years | 0 (0.0%) | 0 (0.0%) |
| 12 to 14 Years | 0 (0.0%) | 0 (0.0%) |
| 15 Years | 0 (0.0%) | 0 (0.0%) |
| 16 and 17 Years | 0 (0.0%) | 0 (0.0%) |
| 18 to 24 Years | 0 (0.0%) | 0 (0.0%) |
| 25 to 34 Years | 0 (0.0%) | 0 (0.0%) |
| 35 to 44 Years | 0 (0.0%) | 0 (0.0%) |
| 45 to 54 Years | 0 (0.0%) | 0 (0.0%) |
| 55 to 64 Years | 0 (0.0%) | 0 (0.0%) |
| 65 to 74 Years | 0 (0.0%) | 0 (0.0%) |
| 75 Years and over | 0 (0.0%) | 0 (0.0%) |
| Total | 0 (0.0%) | 0 (0.0%) |
Income Above Poverty by Sex and Age in Carnelian Bay
According to the poverty statistics in Carnelian Bay, males aged 18 to 24 years and females aged 6 to 11 years are the age groups that are most secure financially, with 100.0% of males and 100.0% of females in these age groups living above the poverty line.
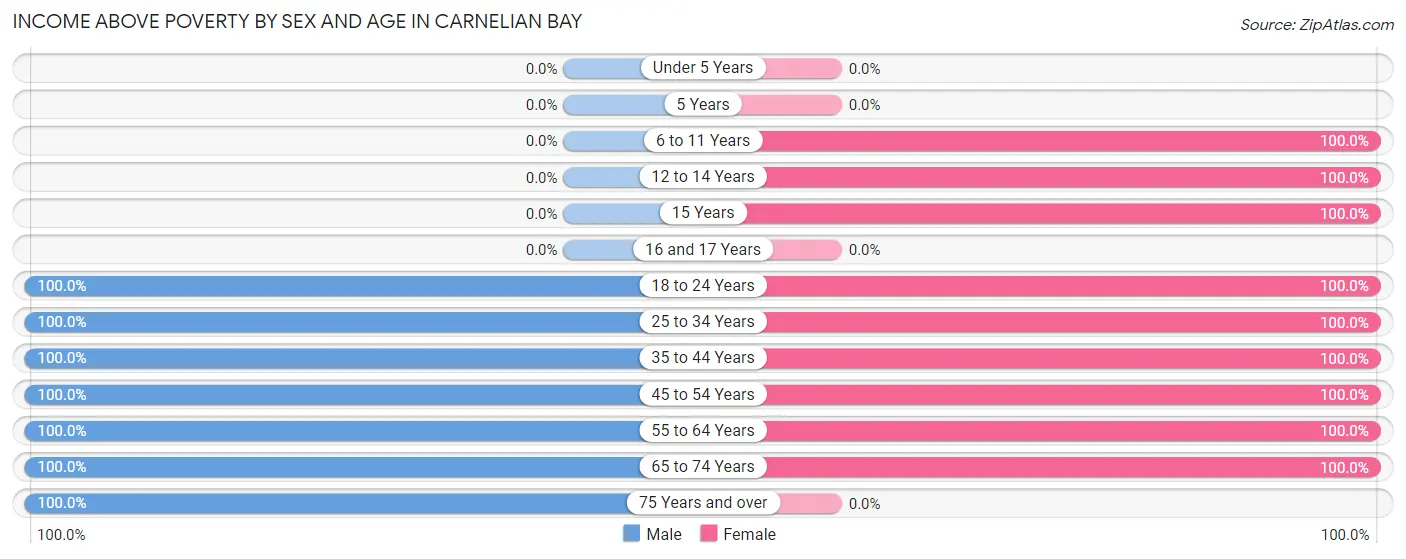
| Age Bracket | Male | Female |
| Under 5 Years | 0 (0.0%) | 0 (0.0%) |
| 5 Years | 0 (0.0%) | 0 (0.0%) |
| 6 to 11 Years | 0 (0.0%) | 11 (100.0%) |
| 12 to 14 Years | 0 (0.0%) | 10 (100.0%) |
| 15 Years | 0 (0.0%) | 35 (100.0%) |
| 16 and 17 Years | 0 (0.0%) | 0 (0.0%) |
| 18 to 24 Years | 11 (100.0%) | 28 (100.0%) |
| 25 to 34 Years | 33 (100.0%) | 71 (100.0%) |
| 35 to 44 Years | 55 (100.0%) | 49 (100.0%) |
| 45 to 54 Years | 60 (100.0%) | 20 (100.0%) |
| 55 to 64 Years | 23 (100.0%) | 12 (100.0%) |
| 65 to 74 Years | 31 (100.0%) | 36 (100.0%) |
| 75 Years and over | 49 (100.0%) | 0 (0.0%) |
| Total | 262 (100.0%) | 272 (100.0%) |
Income Below Poverty Among Married-Couple Families in Carnelian Bay
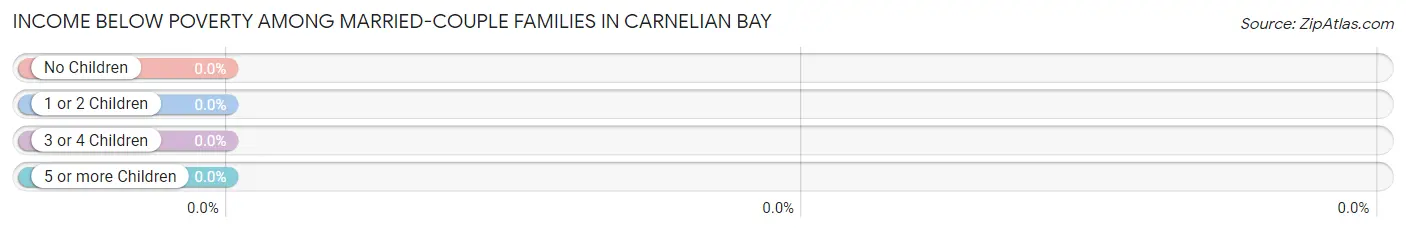
| Children | Above Poverty | Below Poverty |
| No Children | 46 (100.0%) | 0 (0.0%) |
| 1 or 2 Children | 52 (100.0%) | 0 (0.0%) |
| 3 or 4 Children | 0 (0.0%) | 0 (0.0%) |
| 5 or more Children | 0 (0.0%) | 0 (0.0%) |
| Total | 98 (100.0%) | 0 (0.0%) |
Income Below Poverty Among Single-Parent Households in Carnelian Bay
| Children | Single Father | Single Mother |
| No Children | 0 (0.0%) | 0 (0.0%) |
| 1 or 2 Children | 0 (0.0%) | 0 (0.0%) |
| 3 or 4 Children | 0 (0.0%) | 0 (0.0%) |
| 5 or more Children | 0 (0.0%) | 0 (0.0%) |
| Total | 0 (0.0%) | 0 (0.0%) |
Income Below Poverty Among Married-Couple vs Single-Parent Households in Carnelian Bay
| Children | Married-Couple Families | Single-Parent Households |
| No Children | 0 (0.0%) | 0 (0.0%) |
| 1 or 2 Children | 0 (0.0%) | 0 (0.0%) |
| 3 or 4 Children | 0 (0.0%) | 0 (0.0%) |
| 5 or more Children | 0 (0.0%) | 0 (0.0%) |
| Total | 0 (0.0%) | 0 (0.0%) |
Race in Carnelian Bay
The most populous races in Carnelian Bay are White / Caucasian (413 | 77.3%), Hispanic or Latino (112 | 21.0%), and Two or more Races (75 | 14.0%).
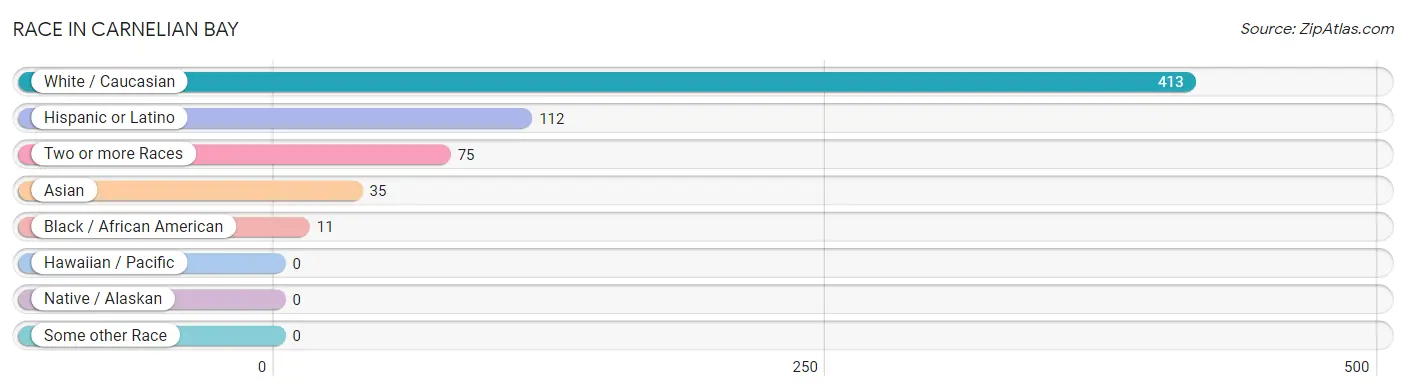
| Race | # Population | % Population |
| Asian | 35 | 6.6% |
| Black / African American | 11 | 2.1% |
| Hawaiian / Pacific | 0 | 0.0% |
| Hispanic or Latino | 112 | 21.0% |
| Native / Alaskan | 0 | 0.0% |
| White / Caucasian | 413 | 77.3% |
| Two or more Races | 75 | 14.0% |
| Some other Race | 0 | 0.0% |
| Total | 534 | 100.0% |
Ancestry in Carnelian Bay
The most populous ancestries reported in Carnelian Bay are German (134 | 25.1%), Irish (98 | 18.3%), English (89 | 16.7%), Italian (62 | 11.6%), and Mexican (43 | 8.1%), together accounting for 79.8% of all Carnelian Bay residents.
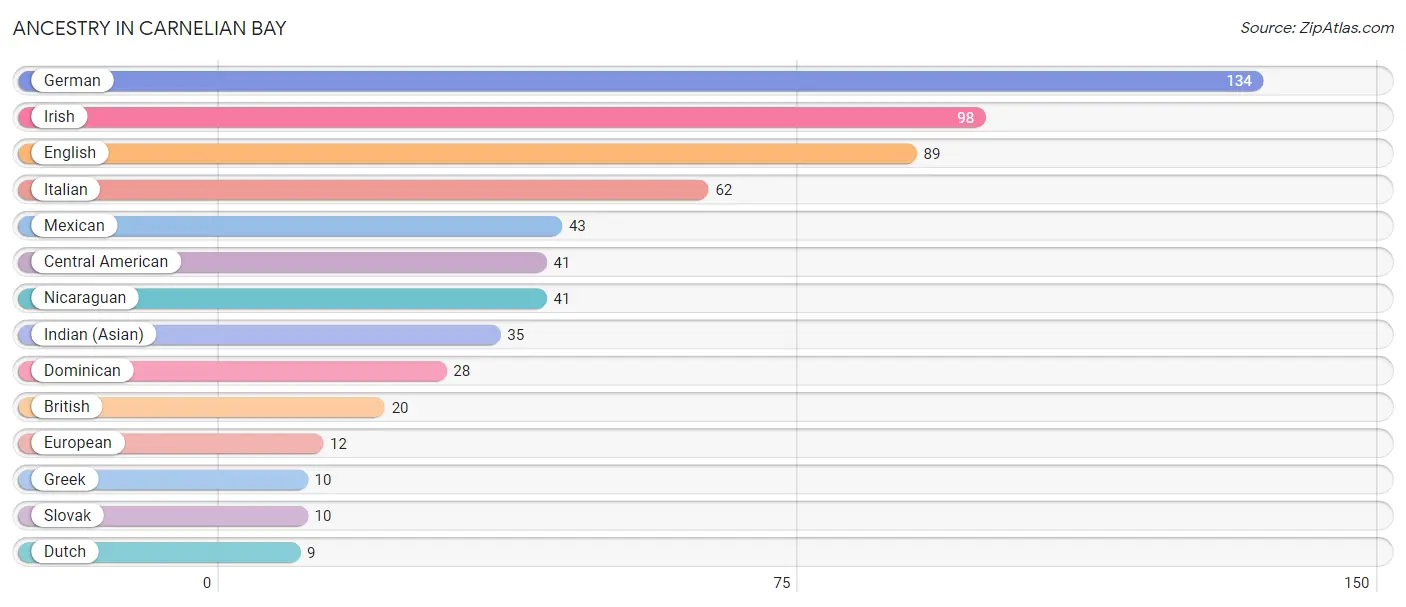
| Ancestry | # Population | % Population |
| British | 20 | 3.7% |
| Central American | 41 | 7.7% |
| Dominican | 28 | 5.2% |
| Dutch | 9 | 1.7% |
| English | 89 | 16.7% |
| European | 12 | 2.2% |
| German | 134 | 25.1% |
| Greek | 10 | 1.9% |
| Indian (Asian) | 35 | 6.6% |
| Irish | 98 | 18.3% |
| Italian | 62 | 11.6% |
| Mexican | 43 | 8.1% |
| Nicaraguan | 41 | 7.7% |
| Slovak | 10 | 1.9% | View All 14 Rows |
Immigrants in Carnelian Bay
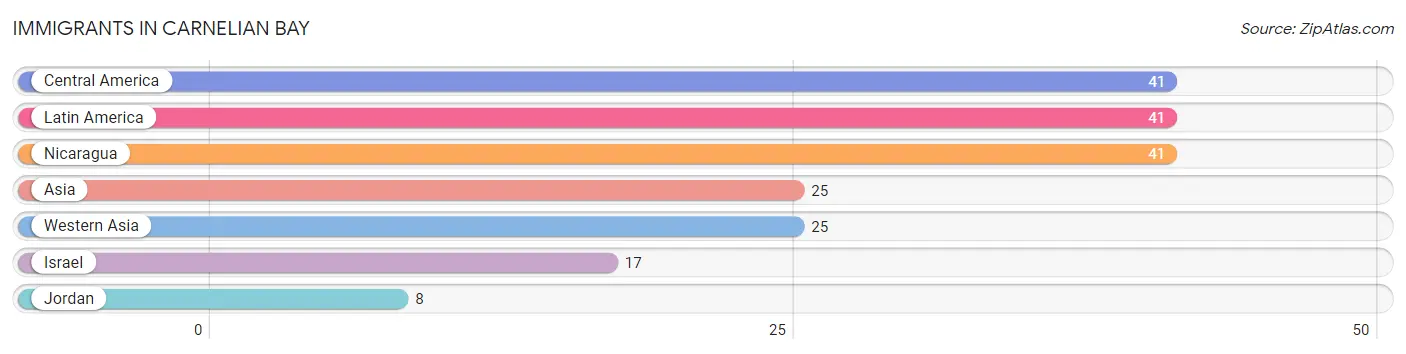
The most numerous immigrant groups reported in Carnelian Bay came from Central America (41 | 7.7%), Latin America (41 | 7.7%), Nicaragua (41 | 7.7%), Asia (25 | 4.7%), and Western Asia (25 | 4.7%), together accounting for 32.4% of all Carnelian Bay residents.
| Immigration Origin | # Population | % Population |
| Asia | 25 | 4.7% |
| Central America | 41 | 7.7% |
| Israel | 17 | 3.2% |
| Jordan | 8 | 1.5% |
| Latin America | 41 | 7.7% |
| Nicaragua | 41 | 7.7% |
| Western Asia | 25 | 4.7% | View All 7 Rows |
Sex and Age in Carnelian Bay
Sex and Age in Carnelian Bay
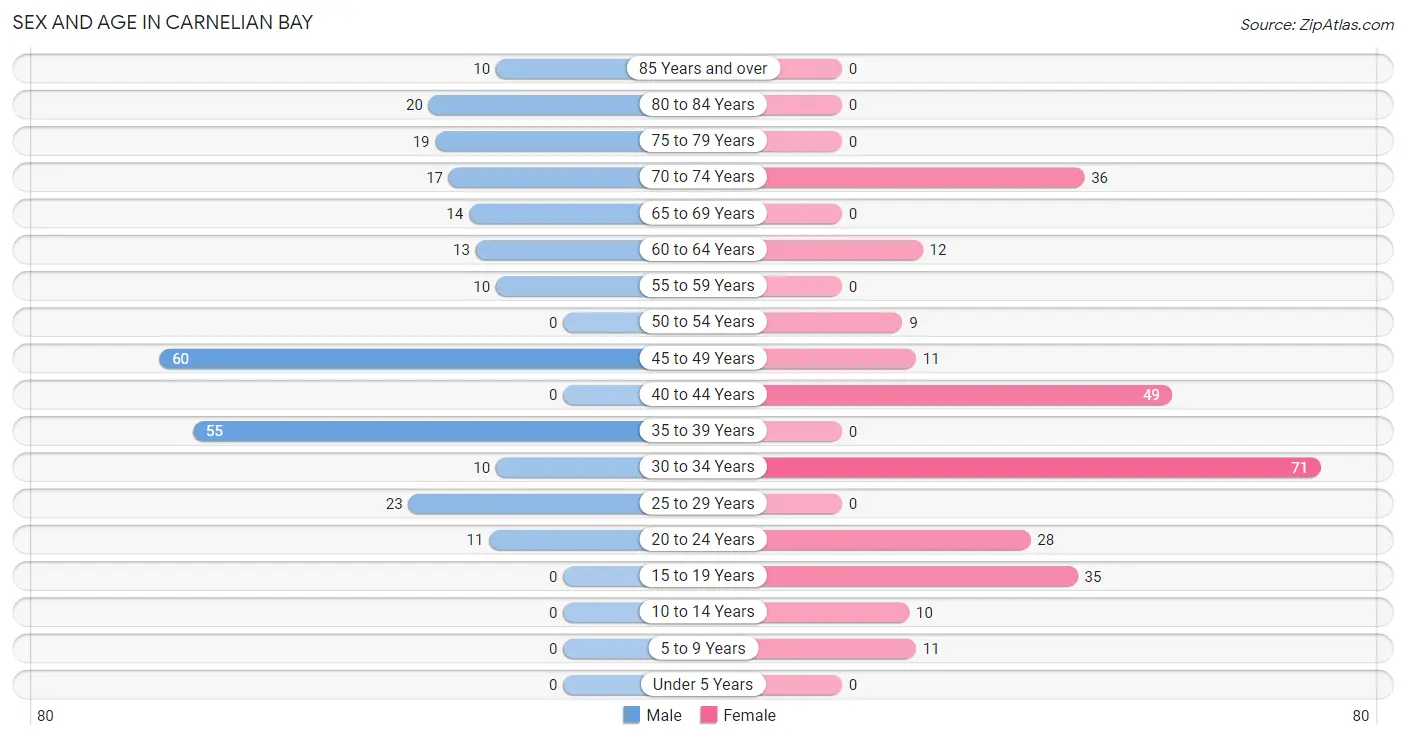
The most populous age groups in Carnelian Bay are 45 to 49 Years (60 | 22.9%) for men and 30 to 34 Years (71 | 26.1%) for women.
| Age Bracket | Male | Female |
| Under 5 Years | 0 (0.0%) | 0 (0.0%) |
| 5 to 9 Years | 0 (0.0%) | 11 (4.0%) |
| 10 to 14 Years | 0 (0.0%) | 10 (3.7%) |
| 15 to 19 Years | 0 (0.0%) | 35 (12.9%) |
| 20 to 24 Years | 11 (4.2%) | 28 (10.3%) |
| 25 to 29 Years | 23 (8.8%) | 0 (0.0%) |
| 30 to 34 Years | 10 (3.8%) | 71 (26.1%) |
| 35 to 39 Years | 55 (21.0%) | 0 (0.0%) |
| 40 to 44 Years | 0 (0.0%) | 49 (18.0%) |
| 45 to 49 Years | 60 (22.9%) | 11 (4.0%) |
| 50 to 54 Years | 0 (0.0%) | 9 (3.3%) |
| 55 to 59 Years | 10 (3.8%) | 0 (0.0%) |
| 60 to 64 Years | 13 (5.0%) | 12 (4.4%) |
| 65 to 69 Years | 14 (5.3%) | 0 (0.0%) |
| 70 to 74 Years | 17 (6.5%) | 36 (13.2%) |
| 75 to 79 Years | 19 (7.2%) | 0 (0.0%) |
| 80 to 84 Years | 20 (7.6%) | 0 (0.0%) |
| 85 Years and over | 10 (3.8%) | 0 (0.0%) |
| Total | 262 (100.0%) | 272 (100.0%) |
Families and Households in Carnelian Bay
Median Family Size in Carnelian Bay
The median family size in Carnelian Bay is 2.74 persons per family, with single female/mother families (9 | 7.7%) accounting for the largest median family size of 4.11 persons per family. On the other hand, single male/father families (10 | 8.6%) represent the smallest median family size with 2.30 persons per family.
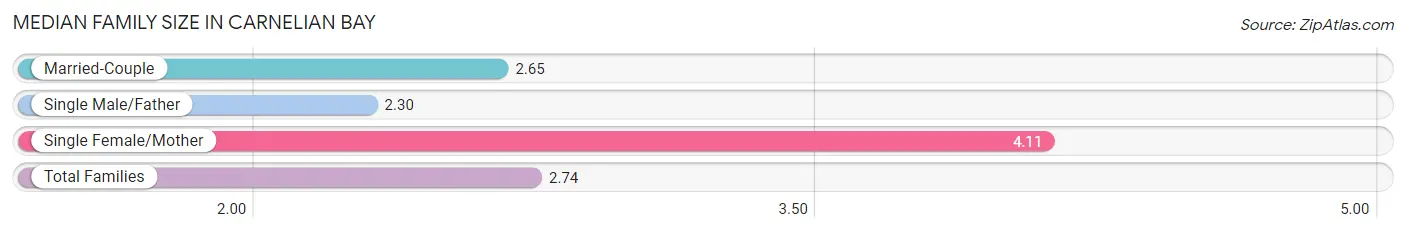
| Family Type | # Families | Family Size |
| Married-Couple | 98 (83.8%) | 2.65 |
| Single Male/Father | 10 (8.6%) | 2.30 |
| Single Female/Mother | 9 (7.7%) | 4.11 |
| Total Families | 117 (100.0%) | 2.74 |
Median Household Size in Carnelian Bay
The median household size in Carnelian Bay is 2.10 persons per household, with single female/mother households (9 | 3.5%) accounting for the largest median household size of 4.11 persons per household. non-family households (137 | 53.9%) represent the smallest median household size with 1.48 persons per household.
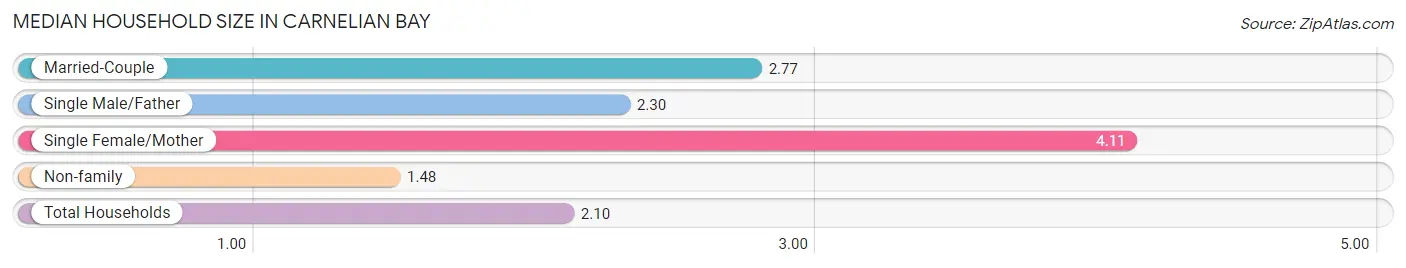
| Household Type | # Households | Household Size |
| Married-Couple | 98 (38.6%) | 2.77 |
| Single Male/Father | 10 (3.9%) | 2.30 |
| Single Female/Mother | 9 (3.5%) | 4.11 |
| Non-family | 137 (53.9%) | 1.48 |
| Total Households | 254 (100.0%) | 2.10 |
Household Size by Marriage Status in Carnelian Bay
Out of a total of 254 households in Carnelian Bay, 117 (46.1%) are family households, while 137 (53.9%) are nonfamily households. The most numerous type of family households are 3-person households, comprising 60, and the most common type of nonfamily households are 2-person households, comprising 69.
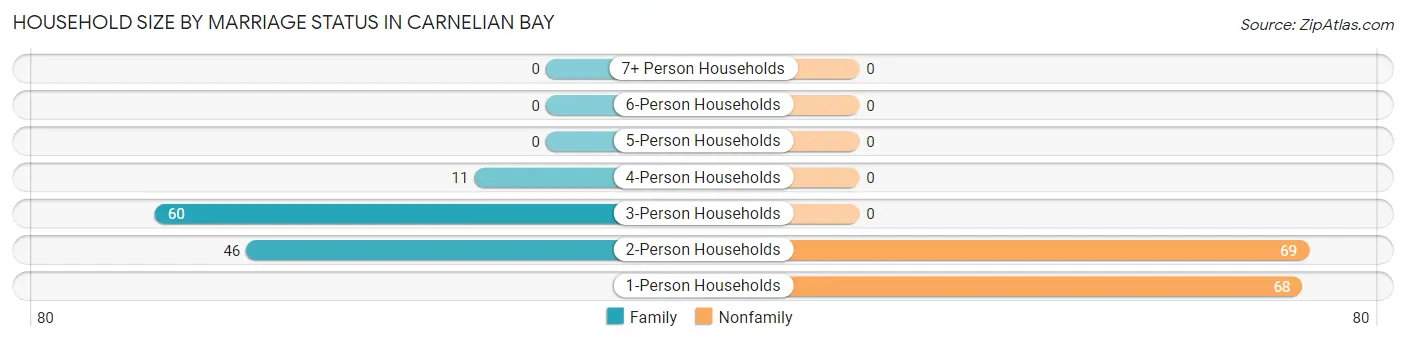
| Household Size | Family Households | Nonfamily Households |
| 1-Person Households | - | 68 (26.8%) |
| 2-Person Households | 46 (18.1%) | 69 (27.2%) |
| 3-Person Households | 60 (23.6%) | 0 (0.0%) |
| 4-Person Households | 11 (4.3%) | 0 (0.0%) |
| 5-Person Households | 0 (0.0%) | 0 (0.0%) |
| 6-Person Households | 0 (0.0%) | 0 (0.0%) |
| 7+ Person Households | 0 (0.0%) | 0 (0.0%) |
| Total | 117 (46.1%) | 137 (53.9%) |
Female Fertility in Carnelian Bay
Fertility by Age in Carnelian Bay
| Age Bracket | Women with Births | Births / 1,000 Women |
| 15 to 19 years | 0 (0.0%) | 0.0 |
| 20 to 34 years | 0 (0.0%) | 0.0 |
| 35 to 50 years | 0 (0.0%) | 0.0 |
| Total | 0 (0.0%) | 0.0 |
Fertility by Age by Marriage Status in Carnelian Bay
| Age Bracket | Married | Unmarried |
| 15 to 19 years | 0 (0.0%) | 0 (0.0%) |
| 20 to 34 years | 0 (0.0%) | 0 (0.0%) |
| 35 to 50 years | 0 (0.0%) | 0 (0.0%) |
| Total | 0 (0.0%) | 0 (0.0%) |
Fertility by Education in Carnelian Bay
| Educational Attainment | Women with Births | Births / 1,000 Women |
| Less than High School | 0 (0.0%) | 0.0 |
| High School Diploma | 0 (0.0%) | 0.0 |
| College or Associate's Degree | 0 (0.0%) | 0.0 |
| Bachelor's Degree | 0 (0.0%) | 0.0 |
| Graduate Degree | 0 (0.0%) | 0.0 |
| Total | 0 (0.0%) | 0.0 |
Fertility by Education by Marriage Status in Carnelian Bay
| Educational Attainment | Married | Unmarried |
| Less than High School | 0 (0.0%) | 0 (0.0%) |
| High School Diploma | 0 (0.0%) | 0 (0.0%) |
| College or Associate's Degree | 0 (0.0%) | 0 (0.0%) |
| Bachelor's Degree | 0 (0.0%) | 0 (0.0%) |
| Graduate Degree | 0 (0.0%) | 0 (0.0%) |
| Total | 0 (0.0%) | 0 (0.0%) |
Employment Characteristics in Carnelian Bay
Employment by Class of Employer in Carnelian Bay
Among the 336 employed individuals in Carnelian Bay, private company employees (219 | 65.2%), local government employees (104 | 30.9%), and self-employed (not incorporated) (13 | 3.9%) make up the most common classes of employment.
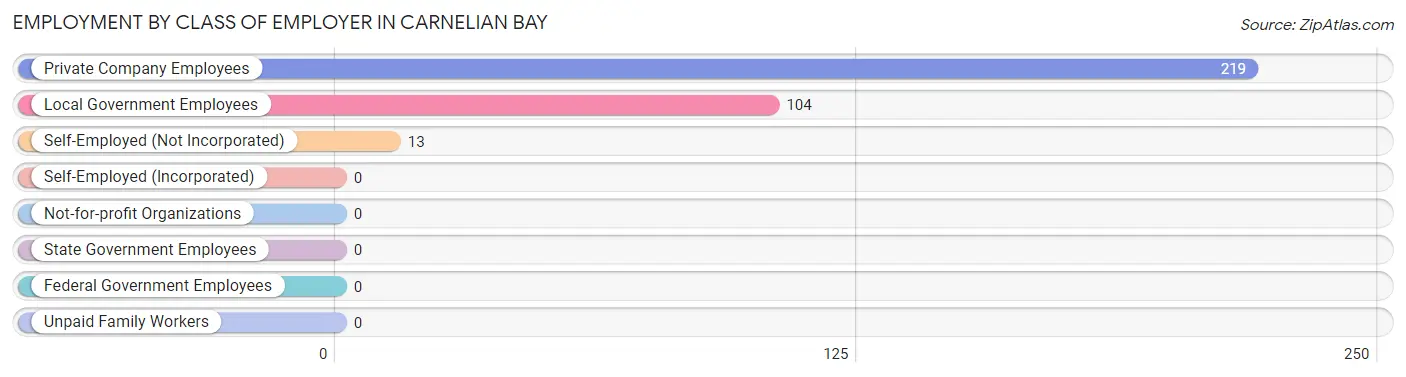
| Employer Class | # Employees | % Employees |
| Private Company Employees | 219 | 65.2% |
| Self-Employed (Incorporated) | 0 | 0.0% |
| Self-Employed (Not Incorporated) | 13 | 3.9% |
| Not-for-profit Organizations | 0 | 0.0% |
| Local Government Employees | 104 | 30.9% |
| State Government Employees | 0 | 0.0% |
| Federal Government Employees | 0 | 0.0% |
| Unpaid Family Workers | 0 | 0.0% |
| Total | 336 | 100.0% |
Employment Status by Age in Carnelian Bay
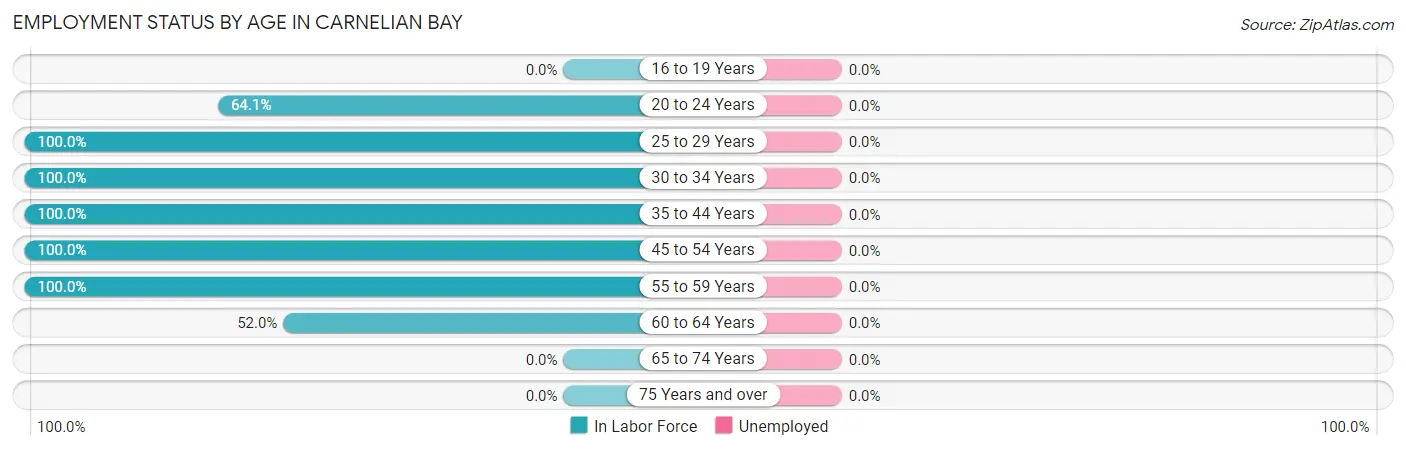
| Age Bracket | In Labor Force | Unemployed |
| 16 to 19 Years | 0 (0.0%) | 0 (0.0%) |
| 20 to 24 Years | 25 (64.1%) | 0 (0.0%) |
| 25 to 29 Years | 23 (100.0%) | 0 (0.0%) |
| 30 to 34 Years | 81 (100.0%) | 0 (0.0%) |
| 35 to 44 Years | 104 (100.0%) | 0 (0.0%) |
| 45 to 54 Years | 80 (100.0%) | 0 (0.0%) |
| 55 to 59 Years | 10 (100.0%) | 0 (0.0%) |
| 60 to 64 Years | 13 (52.0%) | 0 (0.0%) |
| 65 to 74 Years | 0 (0.0%) | 0 (0.0%) |
| 75 Years and over | 0 (0.0%) | 0 (0.0%) |
| Total | 336 (70.3%) | 0 (0.0%) |
Employment Status by Educational Attainment in Carnelian Bay
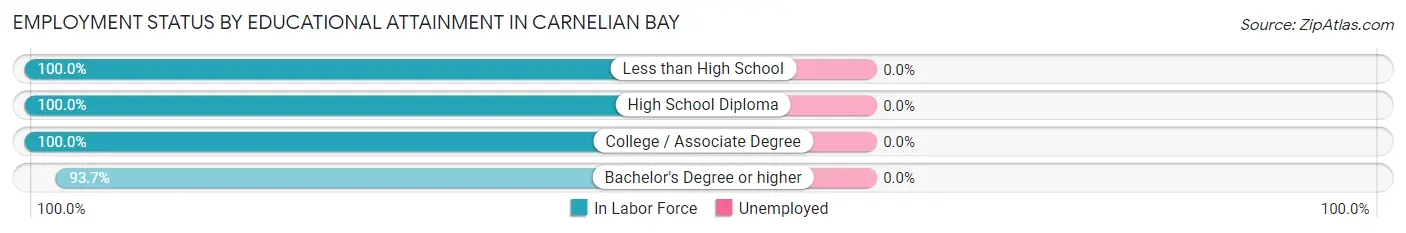
| Educational Attainment | In Labor Force | Unemployed |
| Less than High School | 10 (100.0%) | 0 (0.0%) |
| High School Diploma | 48 (100.0%) | 0 (0.0%) |
| College / Associate Degree | 75 (100.0%) | 0 (0.0%) |
| Bachelor's Degree or higher | 178 (93.7%) | 0 (0.0%) |
| Total | 311 (96.3%) | 0 (0.0%) |
Employment Occupations by Sex in Carnelian Bay
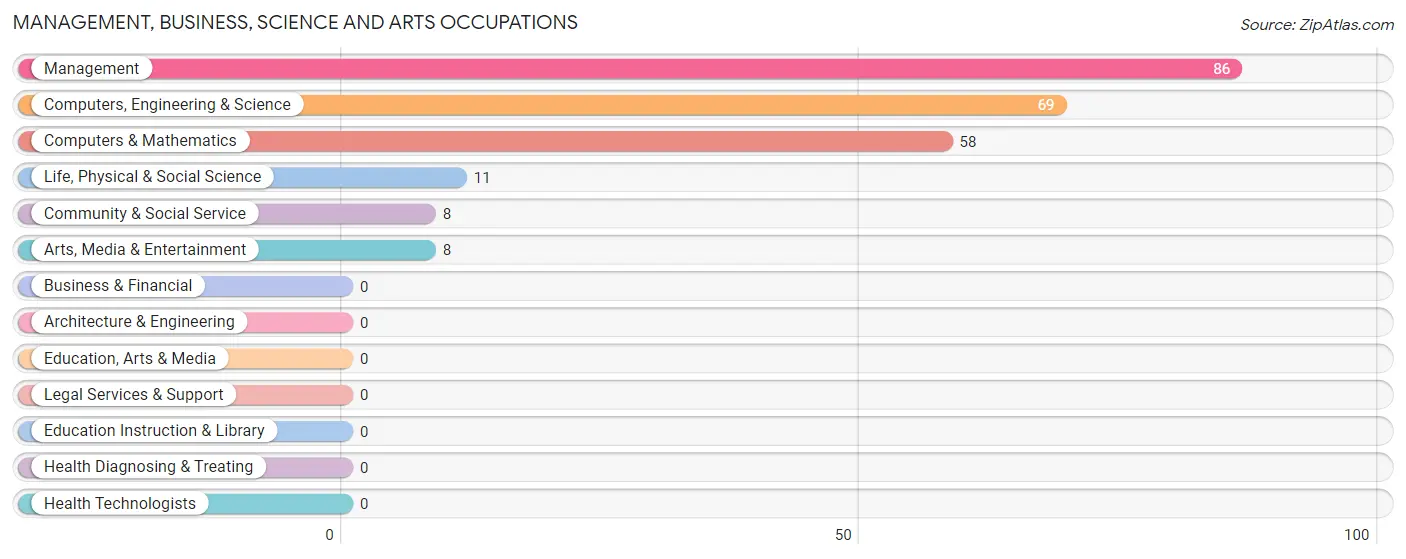
Management, Business, Science and Arts Occupations
The most common Management, Business, Science and Arts occupations in Carnelian Bay are Management (86 | 25.6%), Computers, Engineering & Science (69 | 20.5%), Computers & Mathematics (58 | 17.3%), Life, Physical & Social Science (11 | 3.3%), and Community & Social Service (8 | 2.4%).
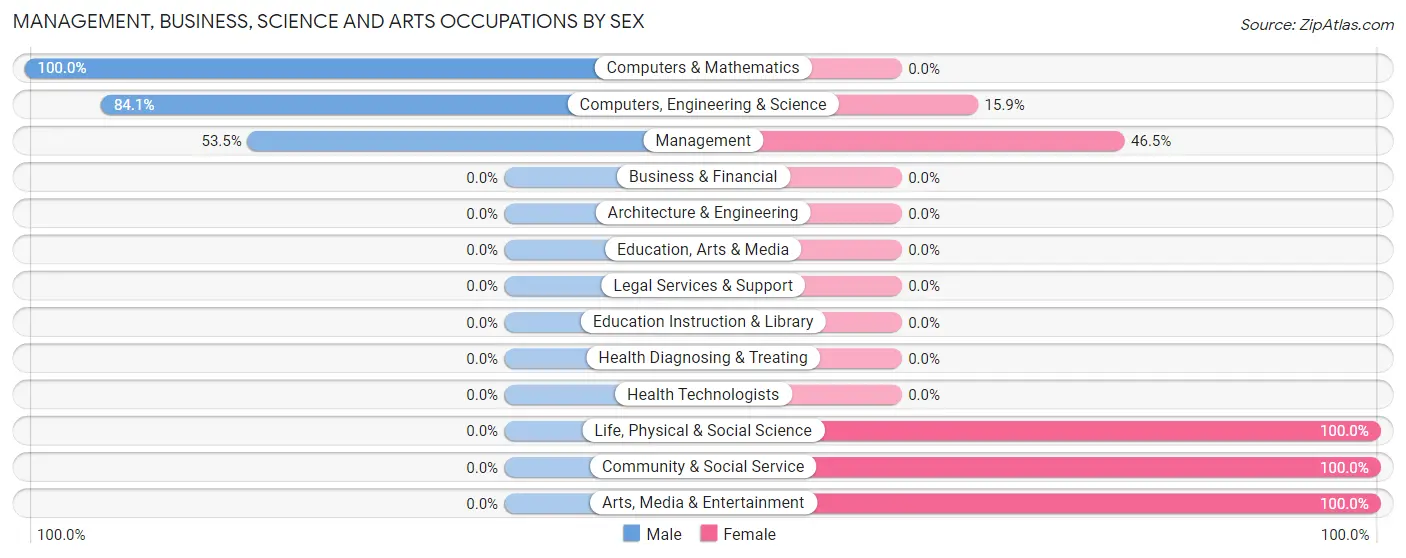
Management, Business, Science and Arts Occupations by Sex
Within the Management, Business, Science and Arts occupations in Carnelian Bay, the most male-oriented occupations are Computers & Mathematics (100.0%), Computers, Engineering & Science (84.1%), and Management (53.5%), while the most female-oriented occupations are Life, Physical & Social Science (100.0%), Community & Social Service (100.0%), and Arts, Media & Entertainment (100.0%).
| Occupation | Male | Female |
| Management | 46 (53.5%) | 40 (46.5%) |
| Business & Financial | 0 (0.0%) | 0 (0.0%) |
| Computers, Engineering & Science | 58 (84.1%) | 11 (15.9%) |
| Computers & Mathematics | 58 (100.0%) | 0 (0.0%) |
| Architecture & Engineering | 0 (0.0%) | 0 (0.0%) |
| Life, Physical & Social Science | 0 (0.0%) | 11 (100.0%) |
| Community & Social Service | 0 (0.0%) | 8 (100.0%) |
| Education, Arts & Media | 0 (0.0%) | 0 (0.0%) |
| Legal Services & Support | 0 (0.0%) | 0 (0.0%) |
| Education Instruction & Library | 0 (0.0%) | 0 (0.0%) |
| Arts, Media & Entertainment | 0 (0.0%) | 8 (100.0%) |
| Health Diagnosing & Treating | 0 (0.0%) | 0 (0.0%) |
| Health Technologists | 0 (0.0%) | 0 (0.0%) |
| Total (Category) | 104 (63.8%) | 59 (36.2%) |
| Total (Overall) | 182 (54.2%) | 154 (45.8%) |
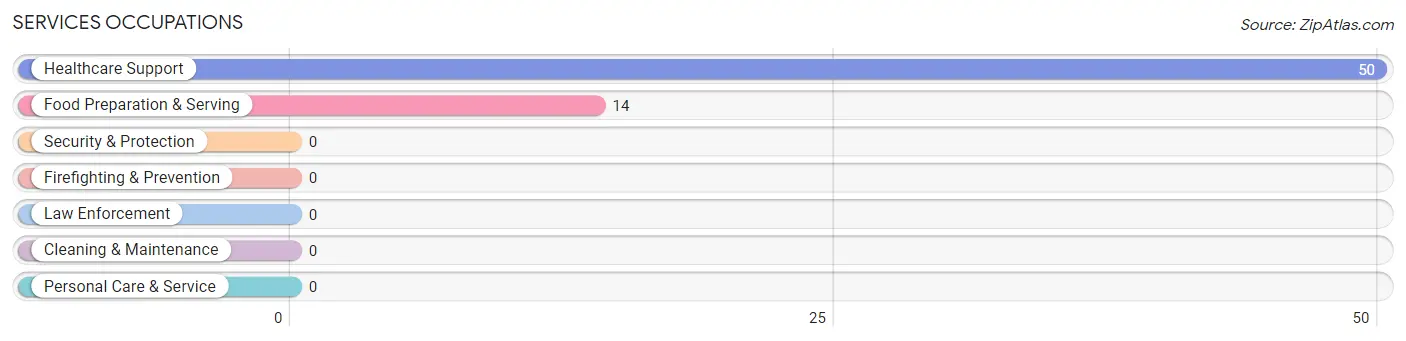
Services Occupations
The most common Services occupations in Carnelian Bay are Healthcare Support (50 | 14.9%), and Food Preparation & Serving (14 | 4.2%).
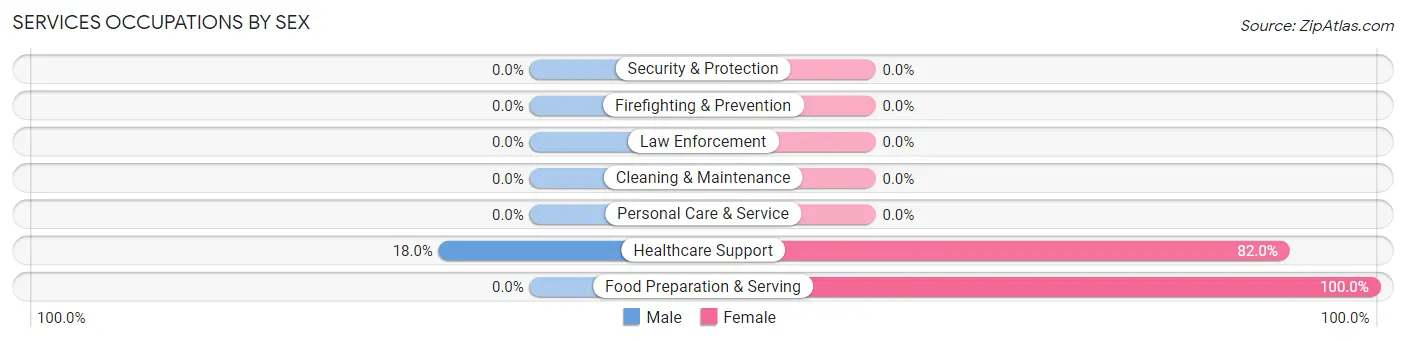
Services Occupations by Sex
| Occupation | Male | Female |
| Healthcare Support | 9 (18.0%) | 41 (82.0%) |
| Security & Protection | 0 (0.0%) | 0 (0.0%) |
| Firefighting & Prevention | 0 (0.0%) | 0 (0.0%) |
| Law Enforcement | 0 (0.0%) | 0 (0.0%) |
| Food Preparation & Serving | 0 (0.0%) | 14 (100.0%) |
| Cleaning & Maintenance | 0 (0.0%) | 0 (0.0%) |
| Personal Care & Service | 0 (0.0%) | 0 (0.0%) |
| Total (Category) | 9 (14.1%) | 55 (85.9%) |
| Total (Overall) | 182 (54.2%) | 154 (45.8%) |
Sales and Office Occupations
The most common Sales and Office occupations in Carnelian Bay are Office & Administration (30 | 8.9%), and Sales & Related (22 | 6.6%).
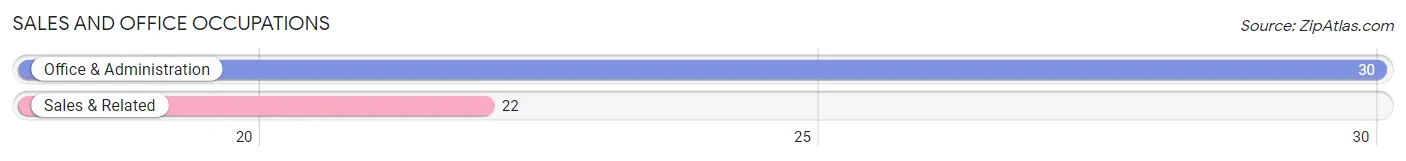
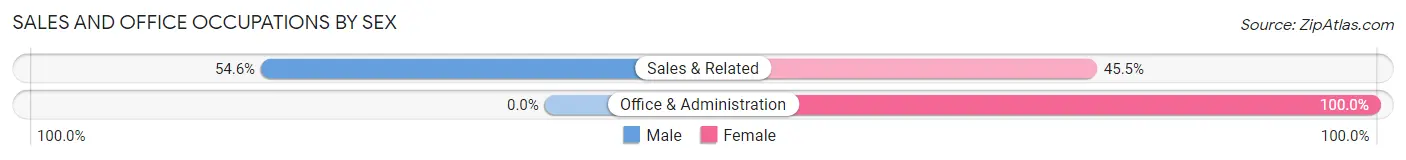
Sales and Office Occupations by Sex
| Occupation | Male | Female |
| Sales & Related | 12 (54.5%) | 10 (45.5%) |
| Office & Administration | 0 (0.0%) | 30 (100.0%) |
| Total (Category) | 12 (23.1%) | 40 (76.9%) |
| Total (Overall) | 182 (54.2%) | 154 (45.8%) |
Natural Resources, Construction and Maintenance Occupations
The most common Natural Resources, Construction and Maintenance occupations in Carnelian Bay are Construction & Extraction (23 | 6.9%), and Farming, Fishing & Forestry (12 | 3.6%).
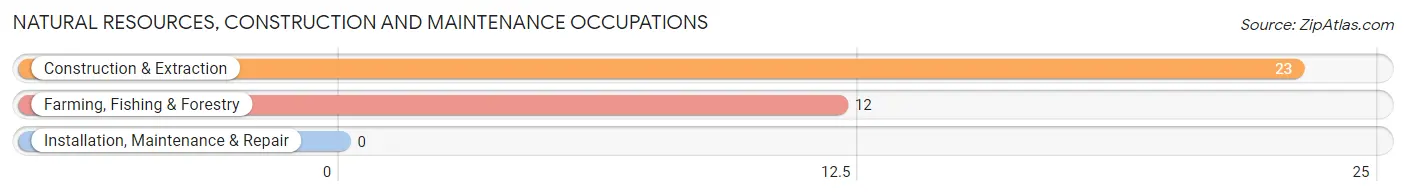
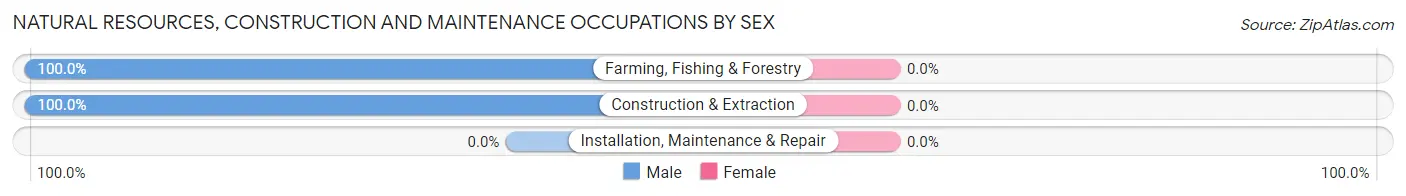
Natural Resources, Construction and Maintenance Occupations by Sex
| Occupation | Male | Female |
| Farming, Fishing & Forestry | 12 (100.0%) | 0 (0.0%) |
| Construction & Extraction | 23 (100.0%) | 0 (0.0%) |
| Installation, Maintenance & Repair | 0 (0.0%) | 0 (0.0%) |
| Total (Category) | 35 (100.0%) | 0 (0.0%) |
| Total (Overall) | 182 (54.2%) | 154 (45.8%) |
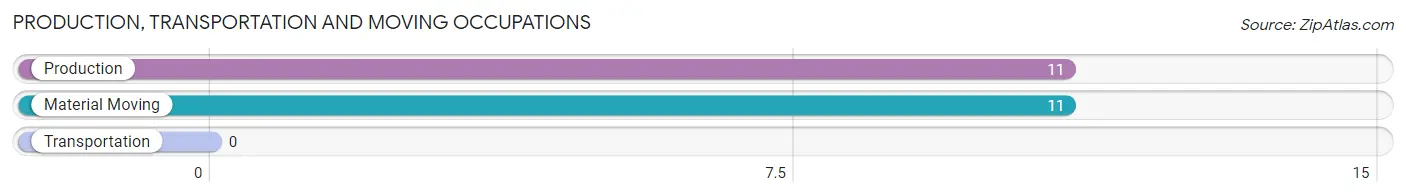
Production, Transportation and Moving Occupations
The most common Production, Transportation and Moving occupations in Carnelian Bay are Production (11 | 3.3%), and Material Moving (11 | 3.3%).
Production, Transportation and Moving Occupations by Sex
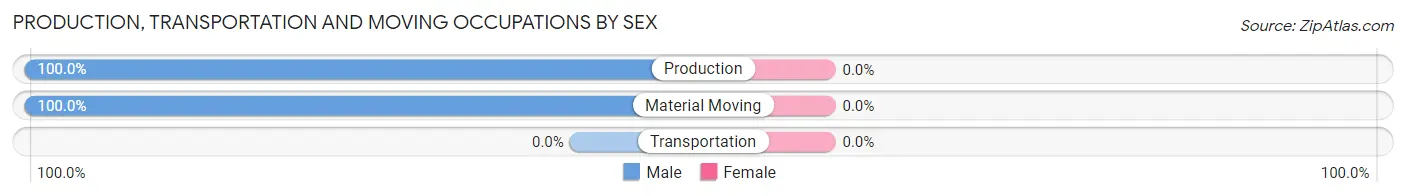
| Occupation | Male | Female |
| Production | 11 (100.0%) | 0 (0.0%) |
| Transportation | 0 (0.0%) | 0 (0.0%) |
| Material Moving | 11 (100.0%) | 0 (0.0%) |
| Total (Category) | 22 (100.0%) | 0 (0.0%) |
| Total (Overall) | 182 (54.2%) | 154 (45.8%) |
Employment Industries by Sex in Carnelian Bay
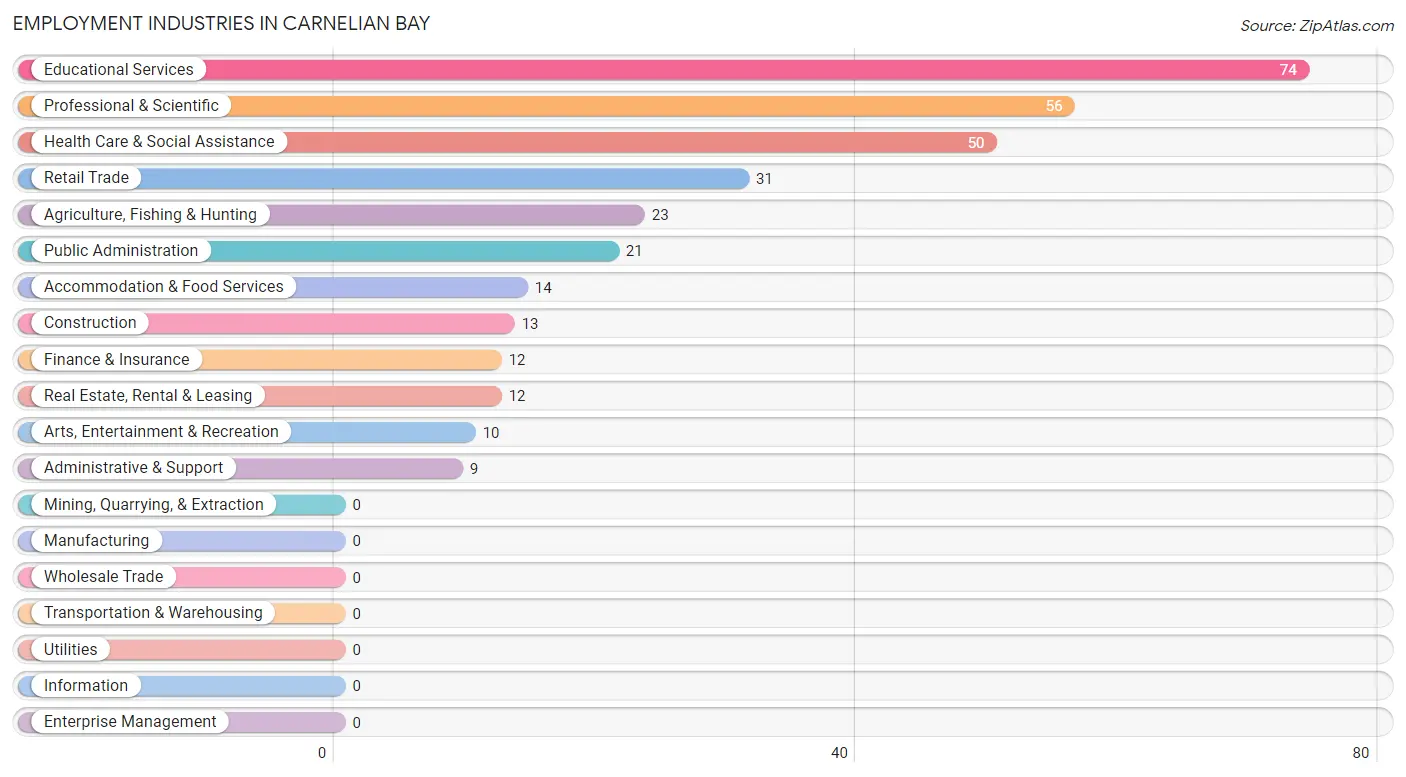
Employment Industries in Carnelian Bay
The major employment industries in Carnelian Bay include Educational Services (74 | 22.0%), Professional & Scientific (56 | 16.7%), Health Care & Social Assistance (50 | 14.9%), Retail Trade (31 | 9.2%), and Agriculture, Fishing & Hunting (23 | 6.9%).
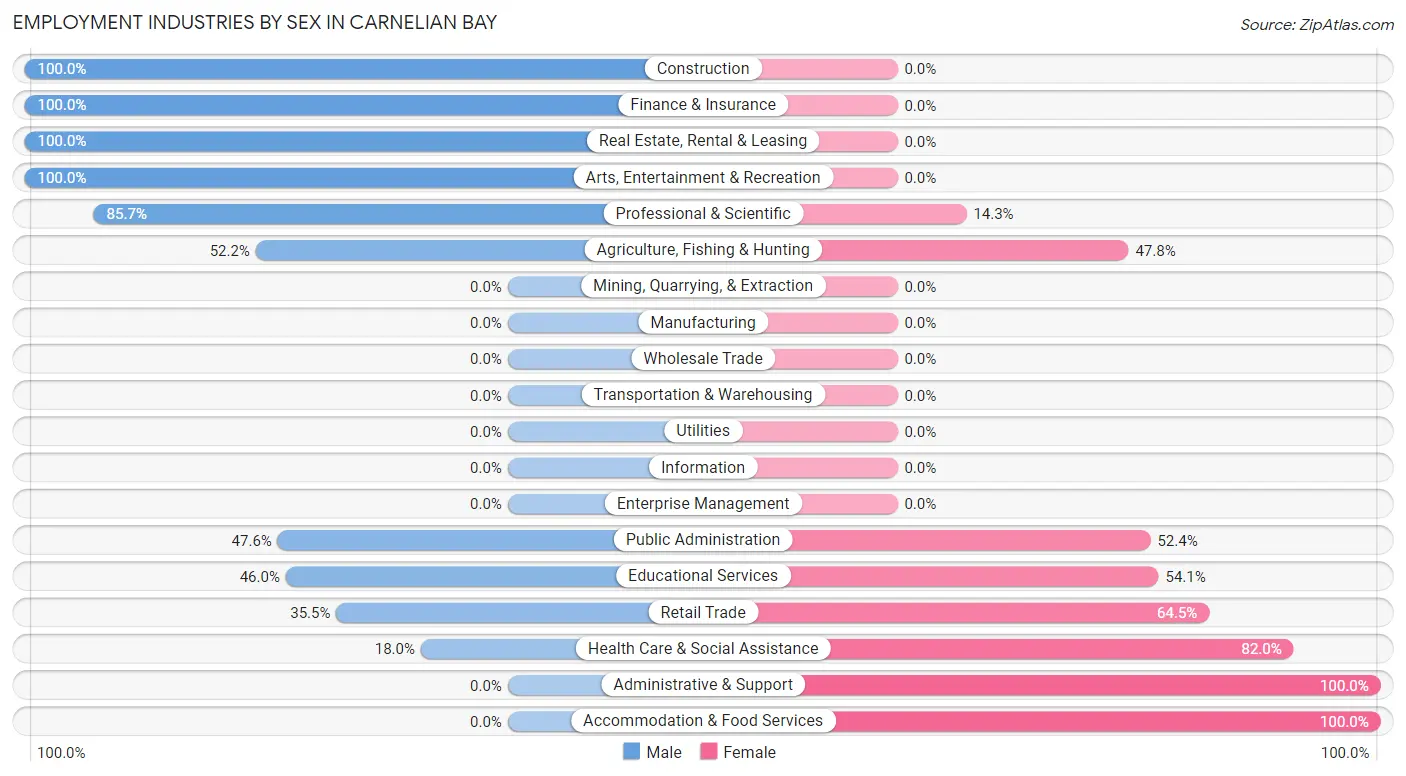
Employment Industries by Sex in Carnelian Bay
The Carnelian Bay industries that see more men than women are Construction (100.0%), Finance & Insurance (100.0%), and Real Estate, Rental & Leasing (100.0%), whereas the industries that tend to have a higher number of women are Administrative & Support (100.0%), Accommodation & Food Services (100.0%), and Health Care & Social Assistance (82.0%).
| Industry | Male | Female |
| Agriculture, Fishing & Hunting | 12 (52.2%) | 11 (47.8%) |
| Mining, Quarrying, & Extraction | 0 (0.0%) | 0 (0.0%) |
| Construction | 13 (100.0%) | 0 (0.0%) |
| Manufacturing | 0 (0.0%) | 0 (0.0%) |
| Wholesale Trade | 0 (0.0%) | 0 (0.0%) |
| Retail Trade | 11 (35.5%) | 20 (64.5%) |
| Transportation & Warehousing | 0 (0.0%) | 0 (0.0%) |
| Utilities | 0 (0.0%) | 0 (0.0%) |
| Information | 0 (0.0%) | 0 (0.0%) |
| Finance & Insurance | 12 (100.0%) | 0 (0.0%) |
| Real Estate, Rental & Leasing | 12 (100.0%) | 0 (0.0%) |
| Professional & Scientific | 48 (85.7%) | 8 (14.3%) |
| Enterprise Management | 0 (0.0%) | 0 (0.0%) |
| Administrative & Support | 0 (0.0%) | 9 (100.0%) |
| Educational Services | 34 (46.0%) | 40 (54.0%) |
| Health Care & Social Assistance | 9 (18.0%) | 41 (82.0%) |
| Arts, Entertainment & Recreation | 10 (100.0%) | 0 (0.0%) |
| Accommodation & Food Services | 0 (0.0%) | 14 (100.0%) |
| Public Administration | 10 (47.6%) | 11 (52.4%) |
| Total | 182 (54.2%) | 154 (45.8%) |
Education in Carnelian Bay
School Enrollment in Carnelian Bay
The most common levels of schooling among the 70 students in Carnelian Bay are high school (35 | 50.0%), college / undergraduate (14 | 20.0%), and kindergarten (11 | 15.7%).
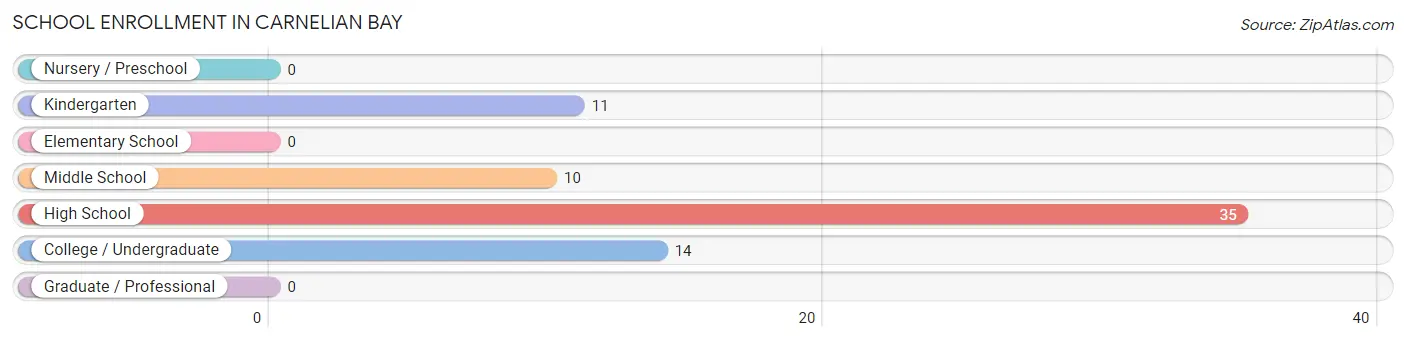
| School Level | # Students | % Students |
| Nursery / Preschool | 0 | 0.0% |
| Kindergarten | 11 | 15.7% |
| Elementary School | 0 | 0.0% |
| Middle School | 10 | 14.3% |
| High School | 35 | 50.0% |
| College / Undergraduate | 14 | 20.0% |
| Graduate / Professional | 0 | 0.0% |
| Total | 70 | 100.0% |
School Enrollment by Age by Funding Source in Carnelian Bay
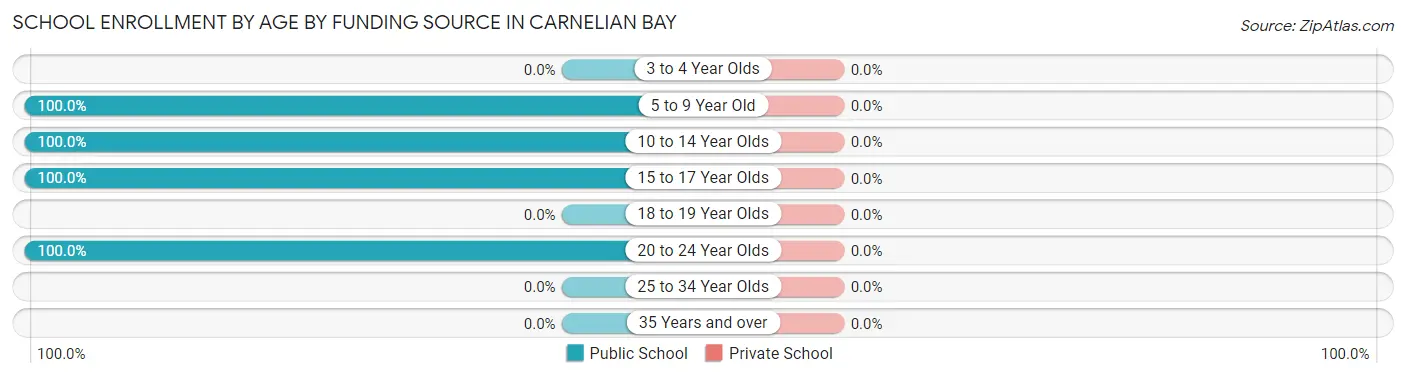
| Age Bracket | Public School | Private School |
| 3 to 4 Year Olds | 0 (0.0%) | 0 (0.0%) |
| 5 to 9 Year Old | 11 (100.0%) | 0 (0.0%) |
| 10 to 14 Year Olds | 10 (100.0%) | 0 (0.0%) |
| 15 to 17 Year Olds | 35 (100.0%) | 0 (0.0%) |
| 18 to 19 Year Olds | 0 (0.0%) | 0 (0.0%) |
| 20 to 24 Year Olds | 14 (100.0%) | 0 (0.0%) |
| 25 to 34 Year Olds | 0 (0.0%) | 0 (0.0%) |
| 35 Years and over | 0 (0.0%) | 0 (0.0%) |
| Total | 70 (100.0%) | 0 (0.0%) |
Educational Attainment by Field of Study in Carnelian Bay
Arts & humanities (69 | 22.2%), education (43 | 13.8%), business (40 | 12.9%), science & technology (36 | 11.6%), and physical & health sciences (31 | 10.0%) are the most common fields of study among 311 individuals in Carnelian Bay who have obtained a bachelor's degree or higher.
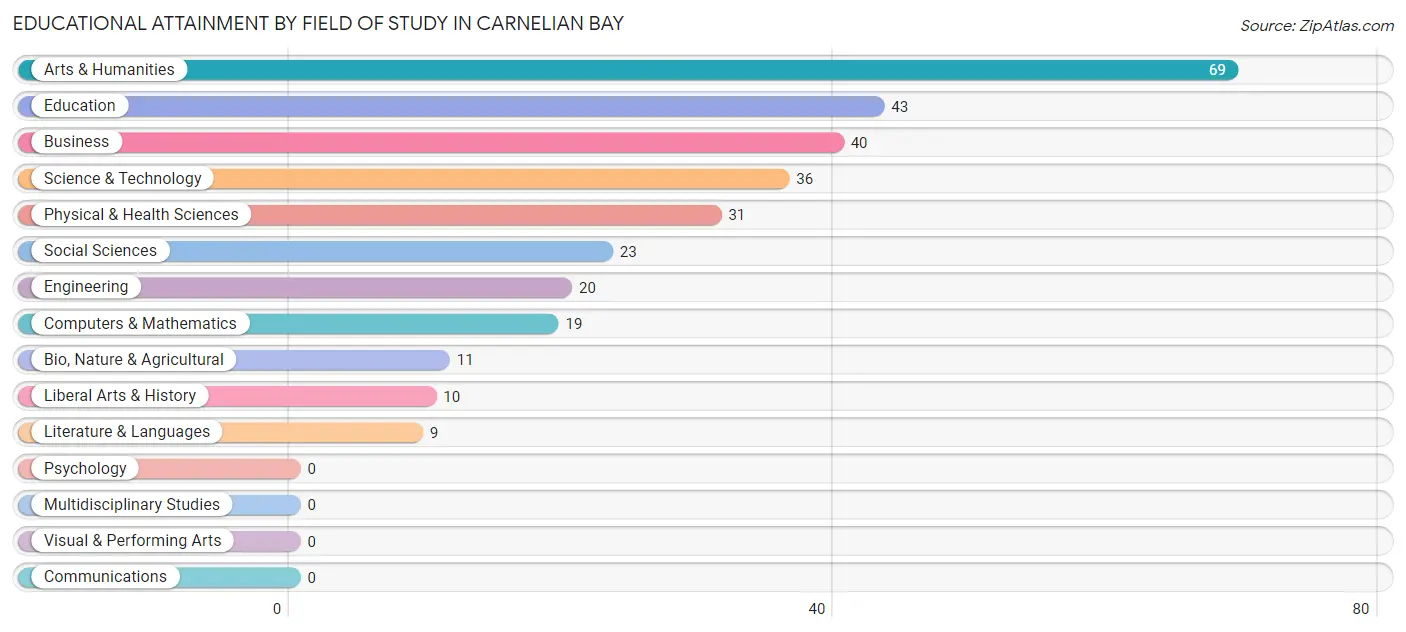
| Field of Study | # Graduates | % Graduates |
| Computers & Mathematics | 19 | 6.1% |
| Bio, Nature & Agricultural | 11 | 3.5% |
| Physical & Health Sciences | 31 | 10.0% |
| Psychology | 0 | 0.0% |
| Social Sciences | 23 | 7.4% |
| Engineering | 20 | 6.4% |
| Multidisciplinary Studies | 0 | 0.0% |
| Science & Technology | 36 | 11.6% |
| Business | 40 | 12.9% |
| Education | 43 | 13.8% |
| Literature & Languages | 9 | 2.9% |
| Liberal Arts & History | 10 | 3.2% |
| Visual & Performing Arts | 0 | 0.0% |
| Communications | 0 | 0.0% |
| Arts & Humanities | 69 | 22.2% |
| Total | 311 | 100.0% |
Transportation & Commute in Carnelian Bay
Vehicle Availability by Sex in Carnelian Bay
The most prevalent vehicle ownership categories in Carnelian Bay are males with 2 vehicles (135, accounting for 74.2%) and females with 2 vehicles (154, making up 87.7%).
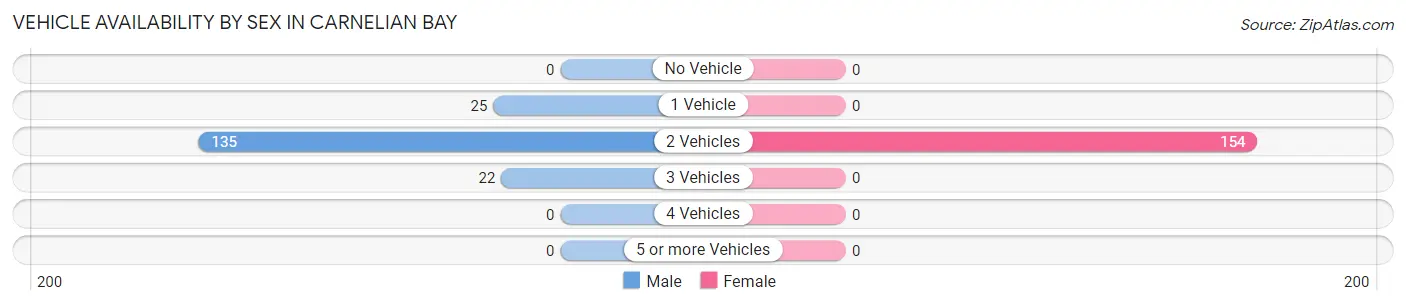
| Vehicles Available | Male | Female |
| No Vehicle | 0 (0.0%) | 0 (0.0%) |
| 1 Vehicle | 25 (13.7%) | 0 (0.0%) |
| 2 Vehicles | 135 (74.2%) | 154 (100.0%) |
| 3 Vehicles | 22 (12.1%) | 0 (0.0%) |
| 4 Vehicles | 0 (0.0%) | 0 (0.0%) |
| 5 or more Vehicles | 0 (0.0%) | 0 (0.0%) |
| Total | 182 (100.0%) | 154 (100.0%) |
Commute Time in Carnelian Bay
The most frequently occuring commute durations in Carnelian Bay are less than 5 minutes (33 commuters, 19.1%), 10 to 14 minutes (30 commuters, 17.3%), and 15 to 19 minutes (30 commuters, 17.3%).
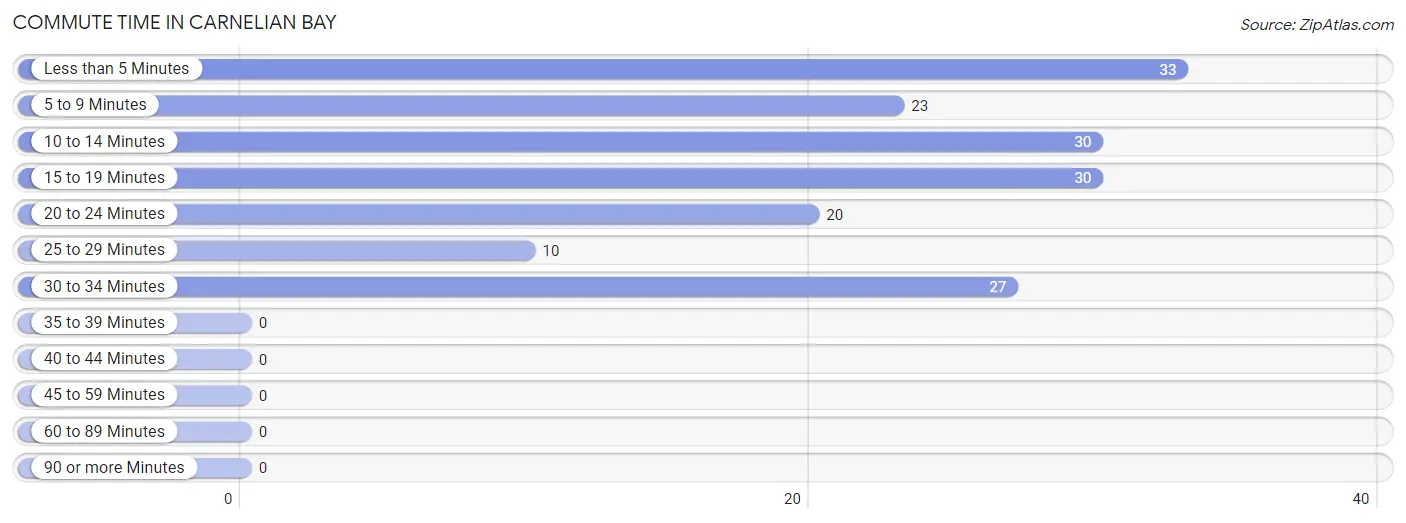
| Commute Time | # Commuters | % Commuters |
| Less than 5 Minutes | 33 | 19.1% |
| 5 to 9 Minutes | 23 | 13.3% |
| 10 to 14 Minutes | 30 | 17.3% |
| 15 to 19 Minutes | 30 | 17.3% |
| 20 to 24 Minutes | 20 | 11.6% |
| 25 to 29 Minutes | 10 | 5.8% |
| 30 to 34 Minutes | 27 | 15.6% |
| 35 to 39 Minutes | 0 | 0.0% |
| 40 to 44 Minutes | 0 | 0.0% |
| 45 to 59 Minutes | 0 | 0.0% |
| 60 to 89 Minutes | 0 | 0.0% |
| 90 or more Minutes | 0 | 0.0% |
Commute Time by Sex in Carnelian Bay
The most common commute times in Carnelian Bay are less than 5 minutes (23 commuters, 23.0%) for males and 10 to 14 minutes (18 commuters, 24.7%) for females.
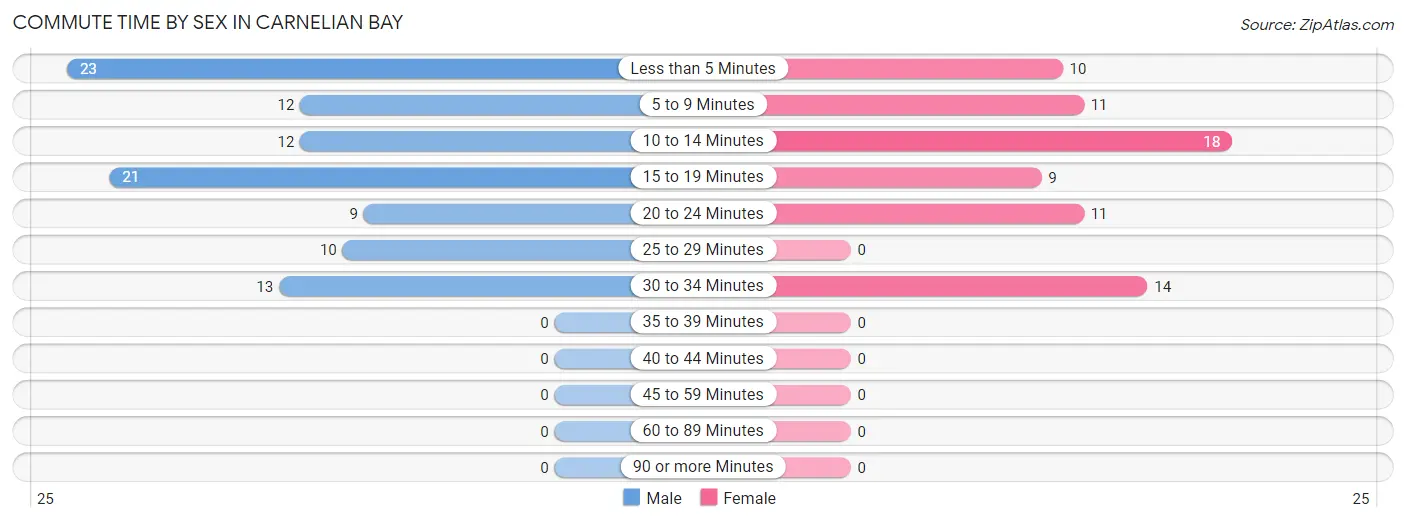
| Commute Time | Male | Female |
| Less than 5 Minutes | 23 (23.0%) | 10 (13.7%) |
| 5 to 9 Minutes | 12 (12.0%) | 11 (15.1%) |
| 10 to 14 Minutes | 12 (12.0%) | 18 (24.7%) |
| 15 to 19 Minutes | 21 (21.0%) | 9 (12.3%) |
| 20 to 24 Minutes | 9 (9.0%) | 11 (15.1%) |
| 25 to 29 Minutes | 10 (10.0%) | 0 (0.0%) |
| 30 to 34 Minutes | 13 (13.0%) | 14 (19.2%) |
| 35 to 39 Minutes | 0 (0.0%) | 0 (0.0%) |
| 40 to 44 Minutes | 0 (0.0%) | 0 (0.0%) |
| 45 to 59 Minutes | 0 (0.0%) | 0 (0.0%) |
| 60 to 89 Minutes | 0 (0.0%) | 0 (0.0%) |
| 90 or more Minutes | 0 (0.0%) | 0 (0.0%) |
Time of Departure to Work by Sex in Carnelian Bay
The most frequent times of departure to work in Carnelian Bay are 7:00 AM to 7:29 AM (23, 23.0%) for males and 10:00 AM to 10:59 AM (20, 27.4%) for females.
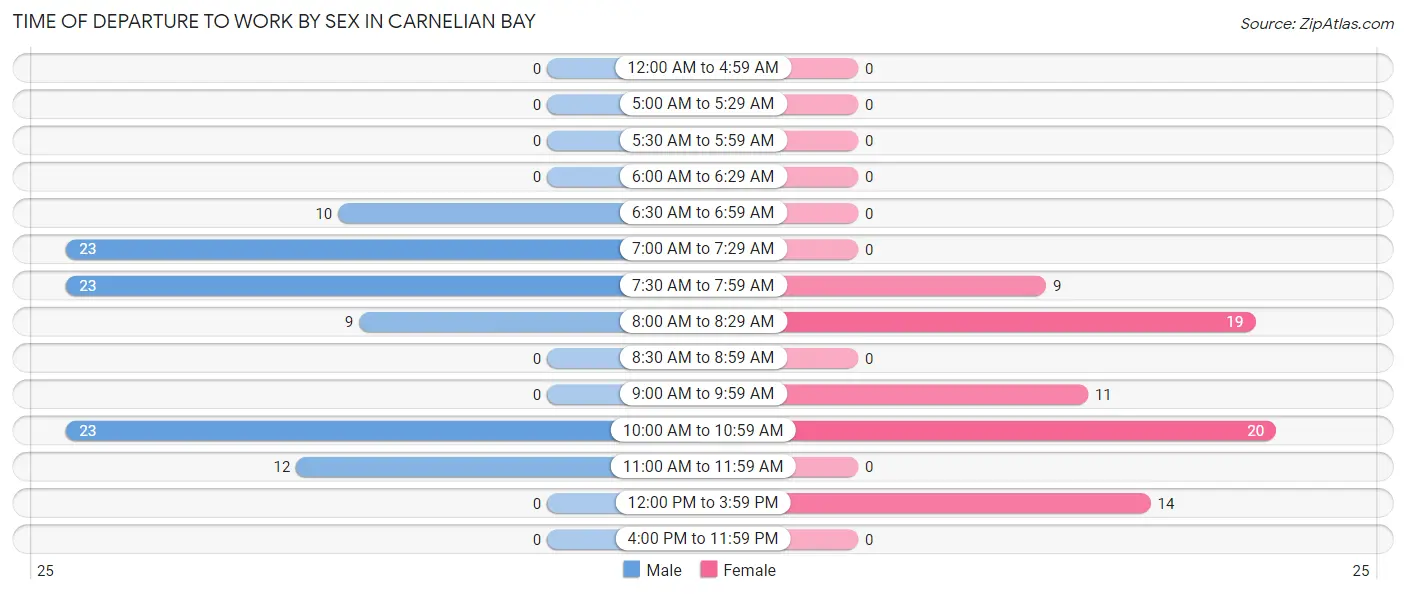
| Time of Departure | Male | Female |
| 12:00 AM to 4:59 AM | 0 (0.0%) | 0 (0.0%) |
| 5:00 AM to 5:29 AM | 0 (0.0%) | 0 (0.0%) |
| 5:30 AM to 5:59 AM | 0 (0.0%) | 0 (0.0%) |
| 6:00 AM to 6:29 AM | 0 (0.0%) | 0 (0.0%) |
| 6:30 AM to 6:59 AM | 10 (10.0%) | 0 (0.0%) |
| 7:00 AM to 7:29 AM | 23 (23.0%) | 0 (0.0%) |
| 7:30 AM to 7:59 AM | 23 (23.0%) | 9 (12.3%) |
| 8:00 AM to 8:29 AM | 9 (9.0%) | 19 (26.0%) |
| 8:30 AM to 8:59 AM | 0 (0.0%) | 0 (0.0%) |
| 9:00 AM to 9:59 AM | 0 (0.0%) | 11 (15.1%) |
| 10:00 AM to 10:59 AM | 23 (23.0%) | 20 (27.4%) |
| 11:00 AM to 11:59 AM | 12 (12.0%) | 0 (0.0%) |
| 12:00 PM to 3:59 PM | 0 (0.0%) | 14 (19.2%) |
| 4:00 PM to 11:59 PM | 0 (0.0%) | 0 (0.0%) |
| Total | 100 (100.0%) | 73 (100.0%) |
Housing Occupancy in Carnelian Bay
Occupancy by Ownership in Carnelian Bay
Of the total 254 dwellings in Carnelian Bay, owner-occupied units account for 215 (84.7%), while renter-occupied units make up 39 (15.3%).
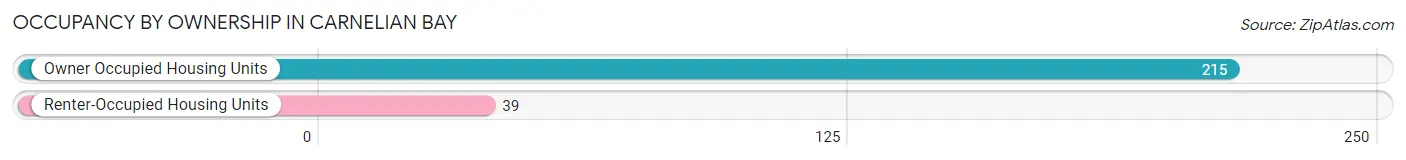
| Occupancy | # Housing Units | % Housing Units |
| Owner Occupied Housing Units | 215 | 84.7% |
| Renter-Occupied Housing Units | 39 | 15.3% |
| Total Occupied Housing Units | 254 | 100.0% |
Occupancy by Household Size in Carnelian Bay
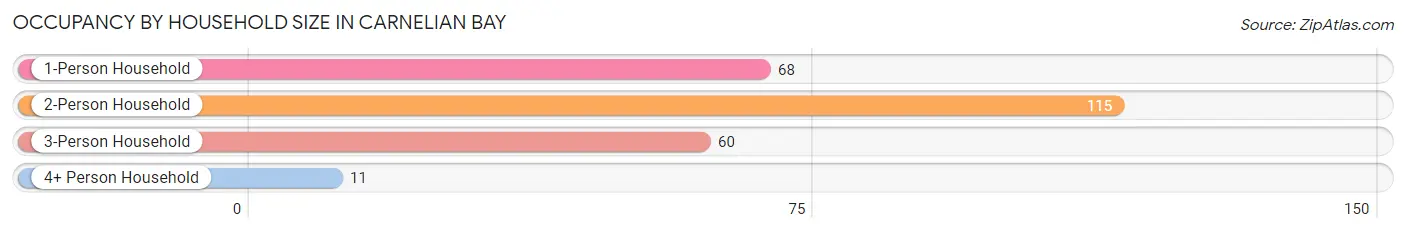
| Household Size | # Housing Units | % Housing Units |
| 1-Person Household | 68 | 26.8% |
| 2-Person Household | 115 | 45.3% |
| 3-Person Household | 60 | 23.6% |
| 4+ Person Household | 11 | 4.3% |
| Total Housing Units | 254 | 100.0% |
Occupancy by Ownership by Household Size in Carnelian Bay
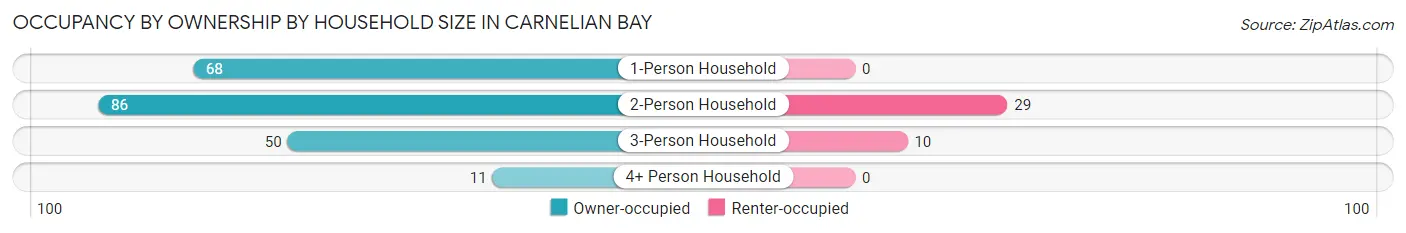
| Household Size | Owner-occupied | Renter-occupied |
| 1-Person Household | 68 (100.0%) | 0 (0.0%) |
| 2-Person Household | 86 (74.8%) | 29 (25.2%) |
| 3-Person Household | 50 (83.3%) | 10 (16.7%) |
| 4+ Person Household | 11 (100.0%) | 0 (0.0%) |
| Total Housing Units | 215 (84.7%) | 39 (15.3%) |
Occupancy by Educational Attainment in Carnelian Bay
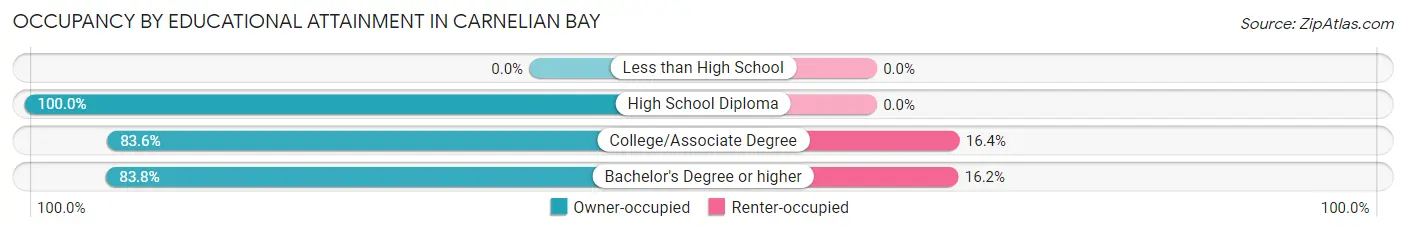
| Household Size | Owner-occupied | Renter-occupied |
| Less than High School | 0 (0.0%) | 0 (0.0%) |
| High School Diploma | 14 (100.0%) | 0 (0.0%) |
| College/Associate Degree | 51 (83.6%) | 10 (16.4%) |
| Bachelor's Degree or higher | 150 (83.8%) | 29 (16.2%) |
Occupancy by Age of Householder in Carnelian Bay
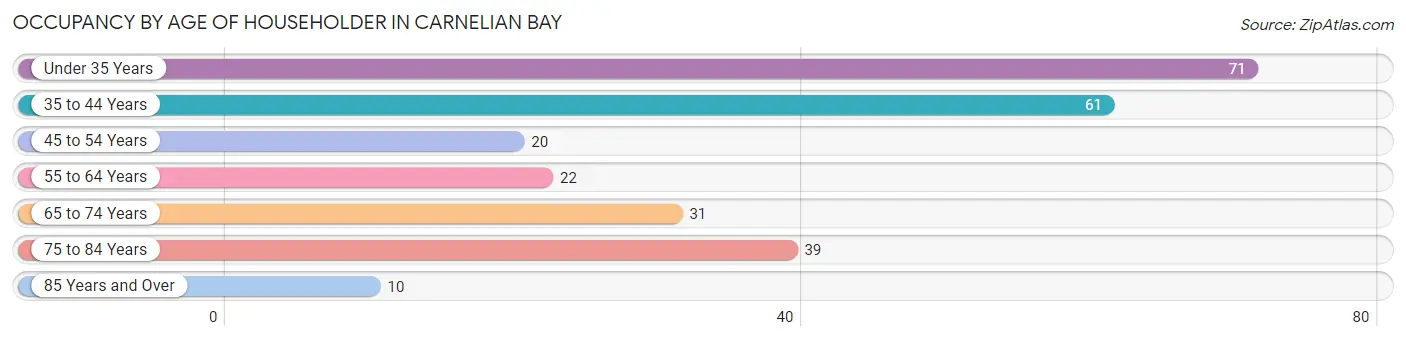
| Age Bracket | # Households | % Households |
| Under 35 Years | 71 | 28.0% |
| 35 to 44 Years | 61 | 24.0% |
| 45 to 54 Years | 20 | 7.9% |
| 55 to 64 Years | 22 | 8.7% |
| 65 to 74 Years | 31 | 12.2% |
| 75 to 84 Years | 39 | 15.3% |
| 85 Years and Over | 10 | 3.9% |
| Total | 254 | 100.0% |
Housing Finances in Carnelian Bay
Median Income by Occupancy in Carnelian Bay
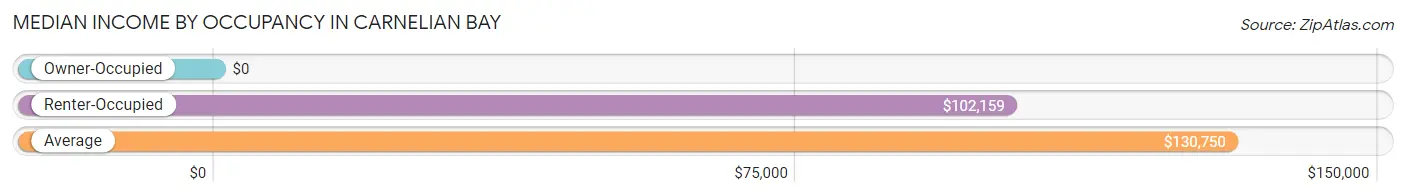
| Occupancy Type | # Households | Median Income |
| Owner-Occupied | 215 (84.7%) | $0 |
| Renter-Occupied | 39 (15.3%) | $102,159 |
| Average | 254 (100.0%) | $130,750 |
Occupancy by Householder Income Bracket in Carnelian Bay
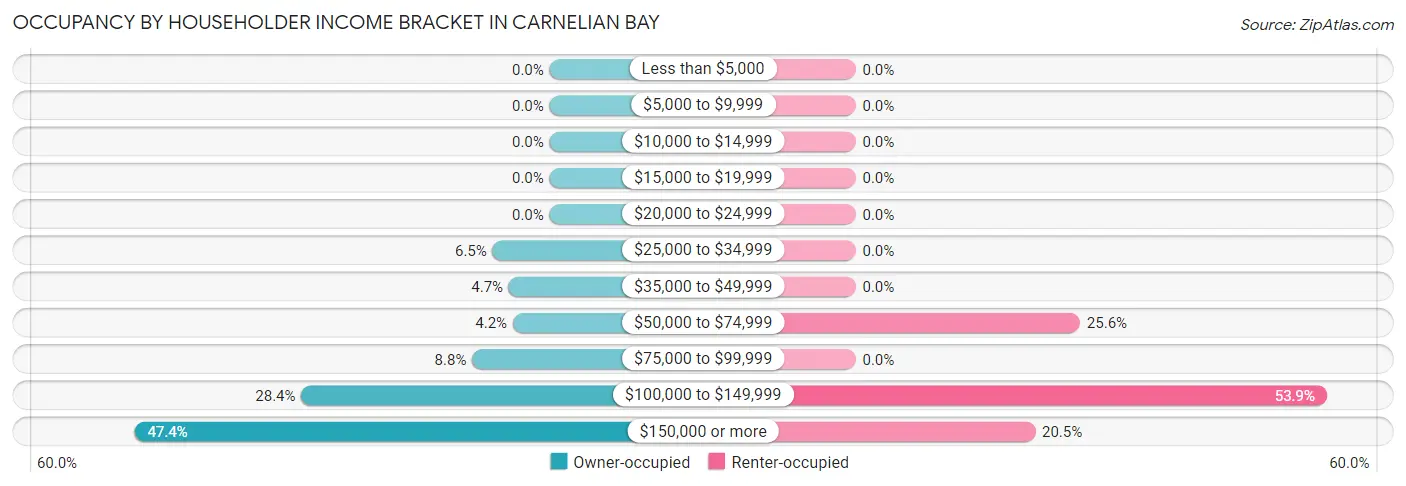
| Income Bracket | Owner-occupied | Renter-occupied |
| Less than $5,000 | 0 (0.0%) | 0 (0.0%) |
| $5,000 to $9,999 | 0 (0.0%) | 0 (0.0%) |
| $10,000 to $14,999 | 0 (0.0%) | 0 (0.0%) |
| $15,000 to $19,999 | 0 (0.0%) | 0 (0.0%) |
| $20,000 to $24,999 | 0 (0.0%) | 0 (0.0%) |
| $25,000 to $34,999 | 14 (6.5%) | 0 (0.0%) |
| $35,000 to $49,999 | 10 (4.6%) | 0 (0.0%) |
| $50,000 to $74,999 | 9 (4.2%) | 10 (25.6%) |
| $75,000 to $99,999 | 19 (8.8%) | 0 (0.0%) |
| $100,000 to $149,999 | 61 (28.4%) | 21 (53.8%) |
| $150,000 or more | 102 (47.4%) | 8 (20.5%) |
| Total | 215 (100.0%) | 39 (100.0%) |
Monthly Housing Cost Tiers in Carnelian Bay
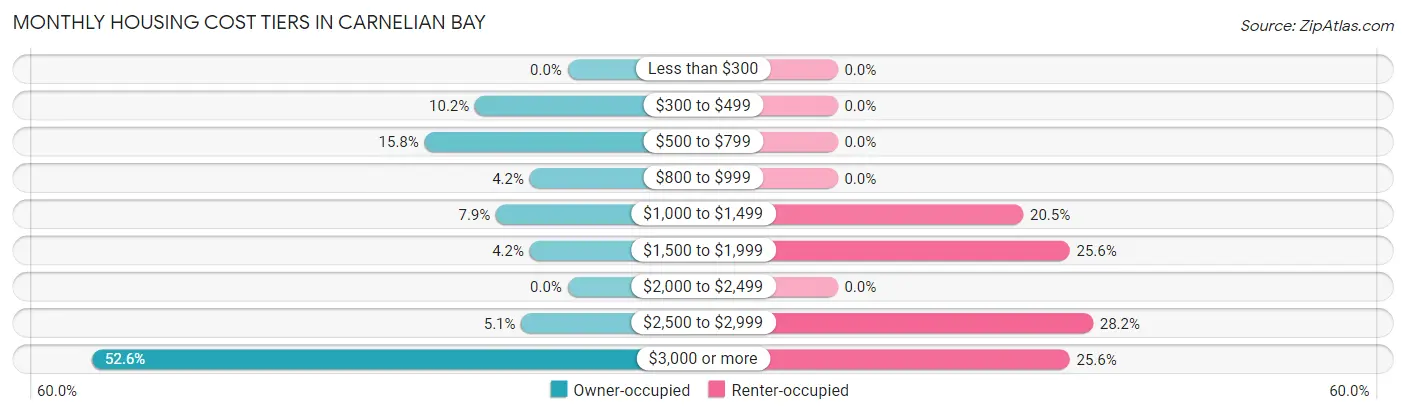
| Monthly Cost | Owner-occupied | Renter-occupied |
| Less than $300 | 0 (0.0%) | 0 (0.0%) |
| $300 to $499 | 22 (10.2%) | 0 (0.0%) |
| $500 to $799 | 34 (15.8%) | 0 (0.0%) |
| $800 to $999 | 9 (4.2%) | 0 (0.0%) |
| $1,000 to $1,499 | 17 (7.9%) | 8 (20.5%) |
| $1,500 to $1,999 | 9 (4.2%) | 10 (25.6%) |
| $2,000 to $2,499 | 0 (0.0%) | 0 (0.0%) |
| $2,500 to $2,999 | 11 (5.1%) | 11 (28.2%) |
| $3,000 or more | 113 (52.6%) | 10 (25.6%) |
| Total | 215 (100.0%) | 39 (100.0%) |
Physical Housing Characteristics in Carnelian Bay
Housing Structures in Carnelian Bay
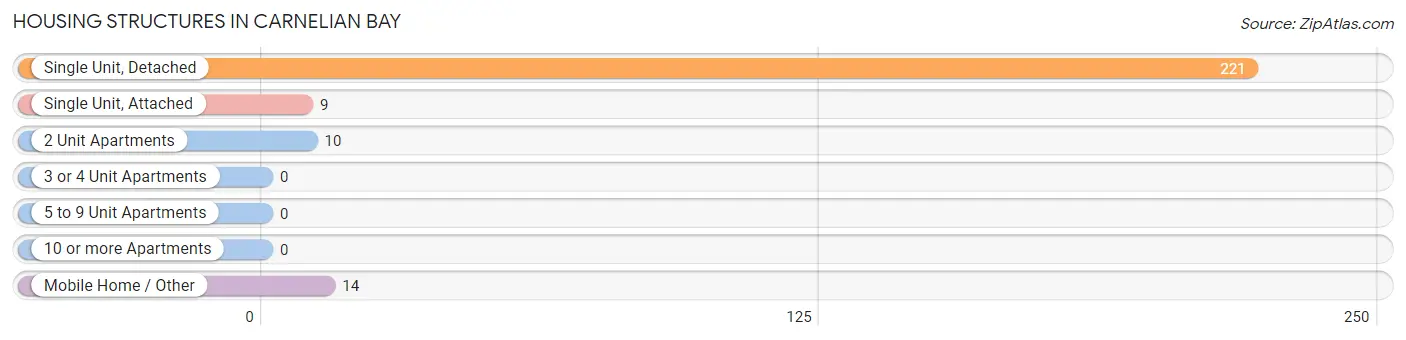
| Structure Type | # Housing Units | % Housing Units |
| Single Unit, Detached | 221 | 87.0% |
| Single Unit, Attached | 9 | 3.5% |
| 2 Unit Apartments | 10 | 3.9% |
| 3 or 4 Unit Apartments | 0 | 0.0% |
| 5 to 9 Unit Apartments | 0 | 0.0% |
| 10 or more Apartments | 0 | 0.0% |
| Mobile Home / Other | 14 | 5.5% |
| Total | 254 | 100.0% |
Housing Structures by Occupancy in Carnelian Bay
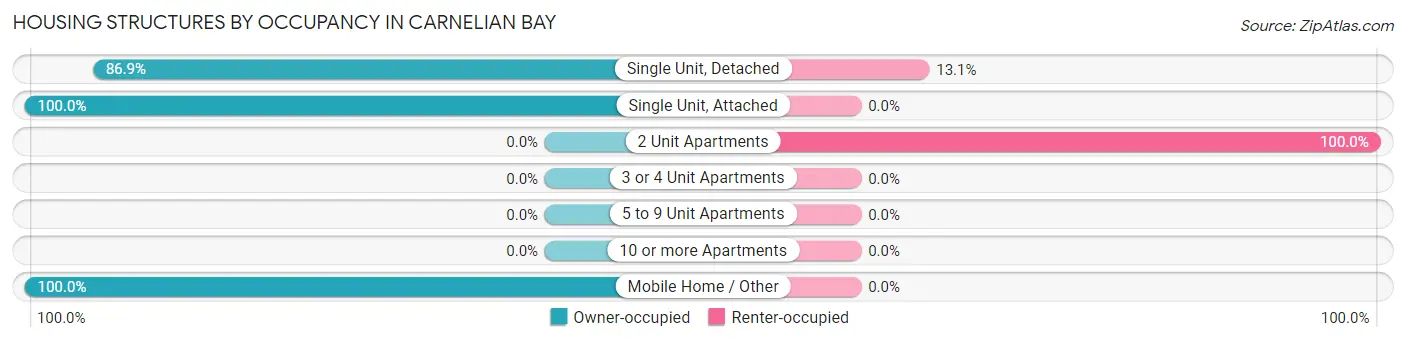
| Structure Type | Owner-occupied | Renter-occupied |
| Single Unit, Detached | 192 (86.9%) | 29 (13.1%) |
| Single Unit, Attached | 9 (100.0%) | 0 (0.0%) |
| 2 Unit Apartments | 0 (0.0%) | 10 (100.0%) |
| 3 or 4 Unit Apartments | 0 (0.0%) | 0 (0.0%) |
| 5 to 9 Unit Apartments | 0 (0.0%) | 0 (0.0%) |
| 10 or more Apartments | 0 (0.0%) | 0 (0.0%) |
| Mobile Home / Other | 14 (100.0%) | 0 (0.0%) |
| Total | 215 (84.7%) | 39 (15.3%) |
Housing Structures by Number of Rooms in Carnelian Bay
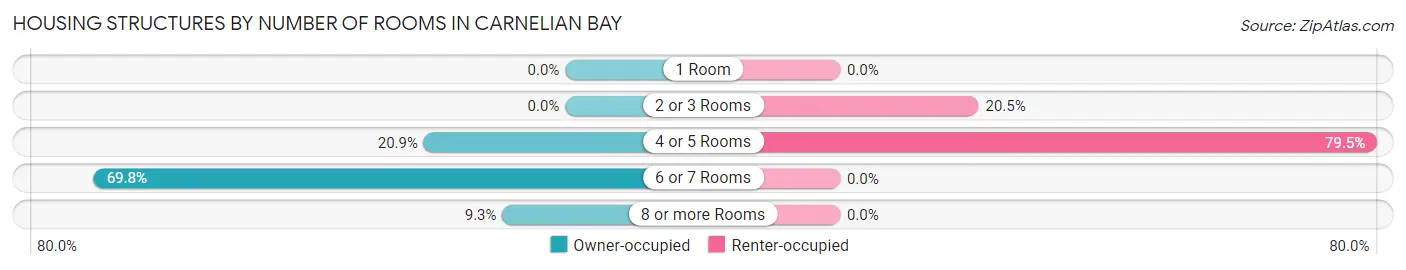
| Number of Rooms | Owner-occupied | Renter-occupied |
| 1 Room | 0 (0.0%) | 0 (0.0%) |
| 2 or 3 Rooms | 0 (0.0%) | 8 (20.5%) |
| 4 or 5 Rooms | 45 (20.9%) | 31 (79.5%) |
| 6 or 7 Rooms | 150 (69.8%) | 0 (0.0%) |
| 8 or more Rooms | 20 (9.3%) | 0 (0.0%) |
| Total | 215 (100.0%) | 39 (100.0%) |
Housing Structure by Heating Type in Carnelian Bay
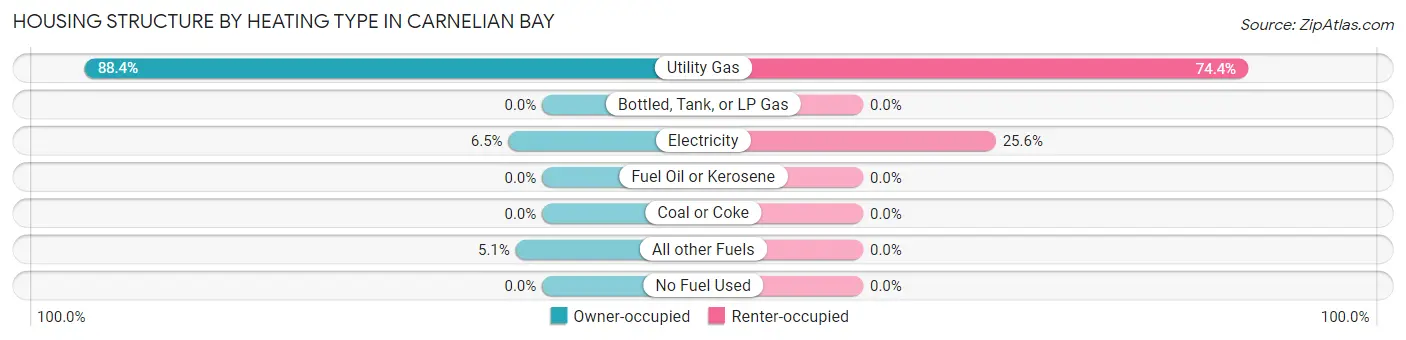
| Heating Type | Owner-occupied | Renter-occupied |
| Utility Gas | 190 (88.4%) | 29 (74.4%) |
| Bottled, Tank, or LP Gas | 0 (0.0%) | 0 (0.0%) |
| Electricity | 14 (6.5%) | 10 (25.6%) |
| Fuel Oil or Kerosene | 0 (0.0%) | 0 (0.0%) |
| Coal or Coke | 0 (0.0%) | 0 (0.0%) |
| All other Fuels | 11 (5.1%) | 0 (0.0%) |
| No Fuel Used | 0 (0.0%) | 0 (0.0%) |
| Total | 215 (100.0%) | 39 (100.0%) |
Household Vehicle Usage in Carnelian Bay
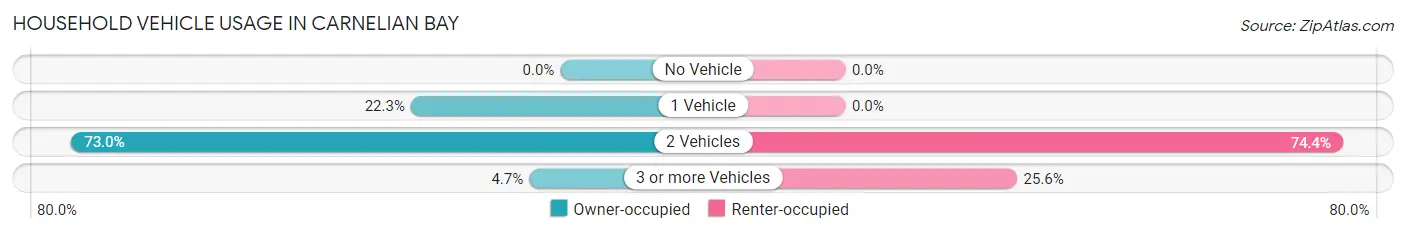
| Vehicles per Household | Owner-occupied | Renter-occupied |
| No Vehicle | 0 (0.0%) | 0 (0.0%) |
| 1 Vehicle | 48 (22.3%) | 0 (0.0%) |
| 2 Vehicles | 157 (73.0%) | 29 (74.4%) |
| 3 or more Vehicles | 10 (4.6%) | 10 (25.6%) |
| Total | 215 (100.0%) | 39 (100.0%) |
Real Estate & Mortgages in Carnelian Bay
Real Estate and Mortgage Overview in Carnelian Bay
| Characteristic | Without Mortgage | With Mortgage |
| Housing Units | 91 | 124 |
| Median Property Value | $762,500 | $745,200 |
| Median Household Income | $115,729 | $92 |
| Monthly Housing Costs | $748 | $113 |
| Real Estate Taxes | $2,500 | $0 |
Property Value by Mortgage Status in Carnelian Bay
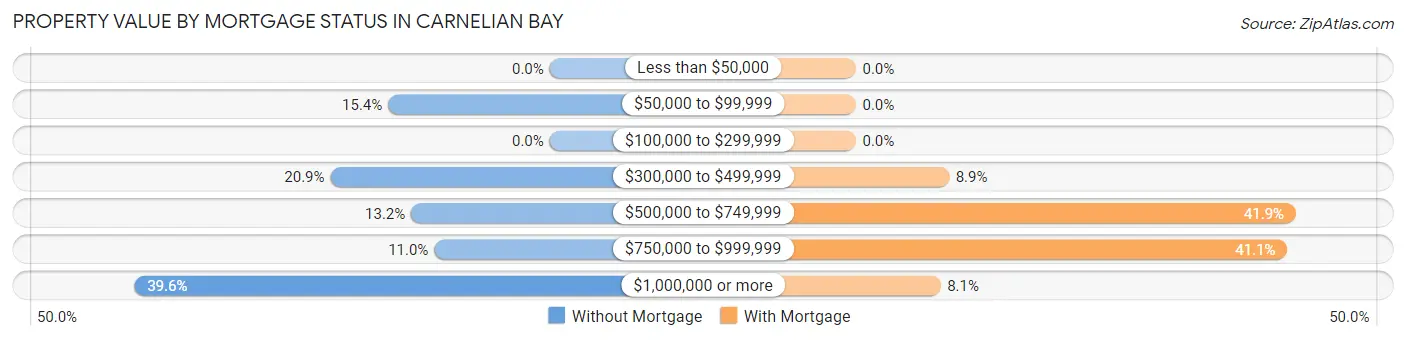
| Property Value | Without Mortgage | With Mortgage |
| Less than $50,000 | 0 (0.0%) | 0 (0.0%) |
| $50,000 to $99,999 | 14 (15.4%) | 0 (0.0%) |
| $100,000 to $299,999 | 0 (0.0%) | 0 (0.0%) |
| $300,000 to $499,999 | 19 (20.9%) | 11 (8.9%) |
| $500,000 to $749,999 | 12 (13.2%) | 52 (41.9%) |
| $750,000 to $999,999 | 10 (11.0%) | 51 (41.1%) |
| $1,000,000 or more | 36 (39.6%) | 10 (8.1%) |
| Total | 91 (100.0%) | 124 (100.0%) |
Household Income by Mortgage Status in Carnelian Bay
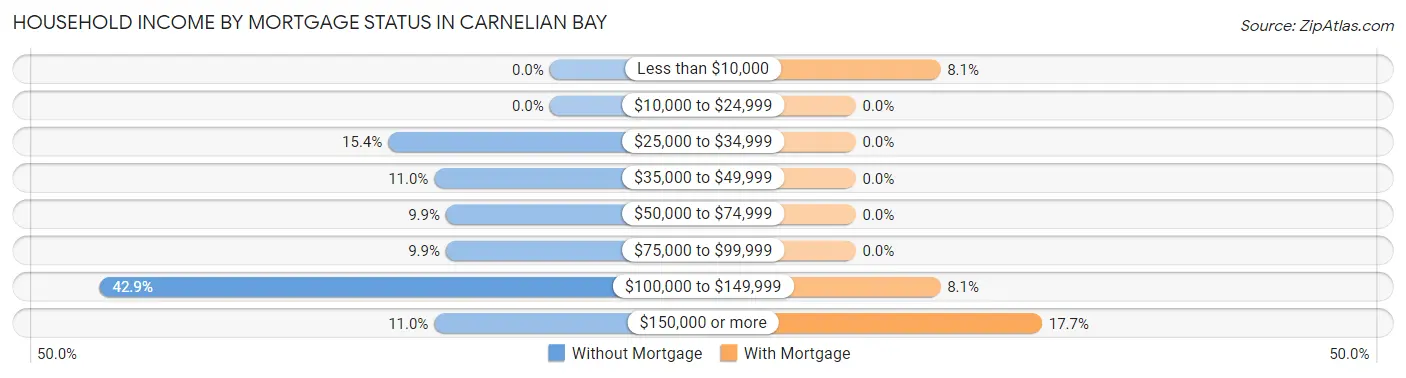
| Household Income | Without Mortgage | With Mortgage |
| Less than $10,000 | 0 (0.0%) | 10 (8.1%) |
| $10,000 to $24,999 | 0 (0.0%) | 0 (0.0%) |
| $25,000 to $34,999 | 14 (15.4%) | 0 (0.0%) |
| $35,000 to $49,999 | 10 (11.0%) | 0 (0.0%) |
| $50,000 to $74,999 | 9 (9.9%) | 0 (0.0%) |
| $75,000 to $99,999 | 9 (9.9%) | 0 (0.0%) |
| $100,000 to $149,999 | 39 (42.9%) | 10 (8.1%) |
| $150,000 or more | 10 (11.0%) | 22 (17.7%) |
| Total | 91 (100.0%) | 124 (100.0%) |
Property Value to Household Income Ratio in Carnelian Bay
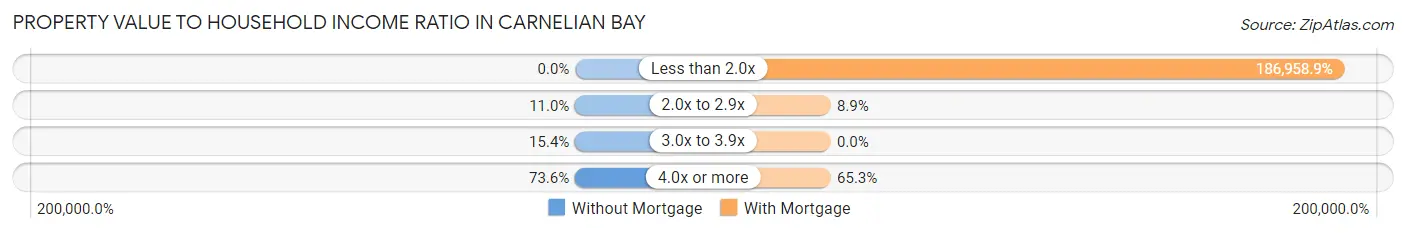
| Value-to-Income Ratio | Without Mortgage | With Mortgage |
| Less than 2.0x | 0 (0.0%) | 231,829 (186,958.9%) |
| 2.0x to 2.9x | 10 (11.0%) | 11 (8.9%) |
| 3.0x to 3.9x | 14 (15.4%) | 0 (0.0%) |
| 4.0x or more | 67 (73.6%) | 81 (65.3%) |
| Total | 91 (100.0%) | 124 (100.0%) |
Real Estate Taxes by Mortgage Status in Carnelian Bay
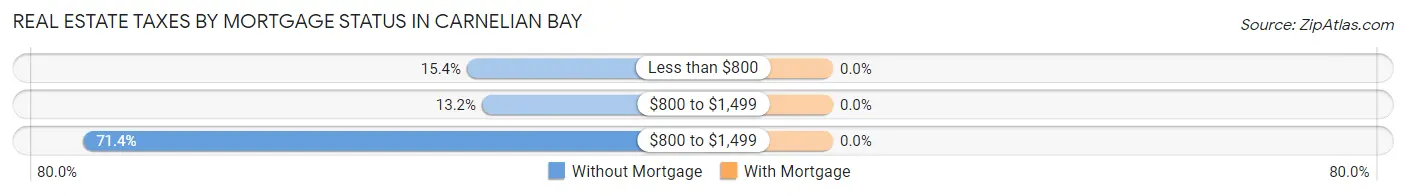
| Property Taxes | Without Mortgage | With Mortgage |
| Less than $800 | 14 (15.4%) | 0 (0.0%) |
| $800 to $1,499 | 12 (13.2%) | 0 (0.0%) |
| $800 to $1,499 | 65 (71.4%) | 0 (0.0%) |
| Total | 91 (100.0%) | 124 (100.0%) |
Health & Disability in Carnelian Bay
Health Insurance Coverage by Age in Carnelian Bay
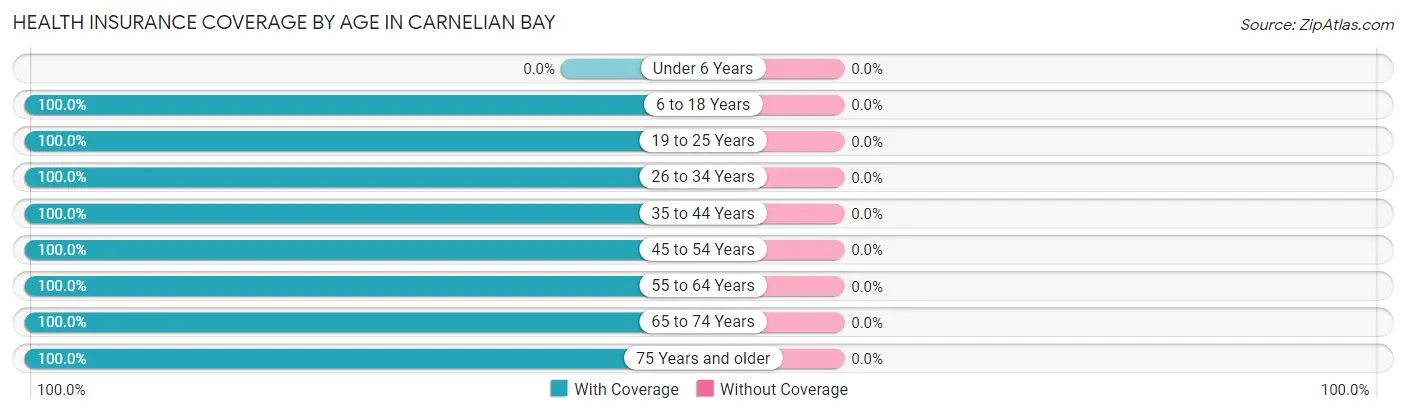
| Age Bracket | With Coverage | Without Coverage |
| Under 6 Years | 0 (0.0%) | 0 (0.0%) |
| 6 to 18 Years | 56 (100.0%) | 0 (0.0%) |
| 19 to 25 Years | 39 (100.0%) | 0 (0.0%) |
| 26 to 34 Years | 104 (100.0%) | 0 (0.0%) |
| 35 to 44 Years | 104 (100.0%) | 0 (0.0%) |
| 45 to 54 Years | 80 (100.0%) | 0 (0.0%) |
| 55 to 64 Years | 35 (100.0%) | 0 (0.0%) |
| 65 to 74 Years | 67 (100.0%) | 0 (0.0%) |
| 75 Years and older | 49 (100.0%) | 0 (0.0%) |
| Total | 534 (100.0%) | 0 (0.0%) |
Health Insurance Coverage by Citizenship Status in Carnelian Bay
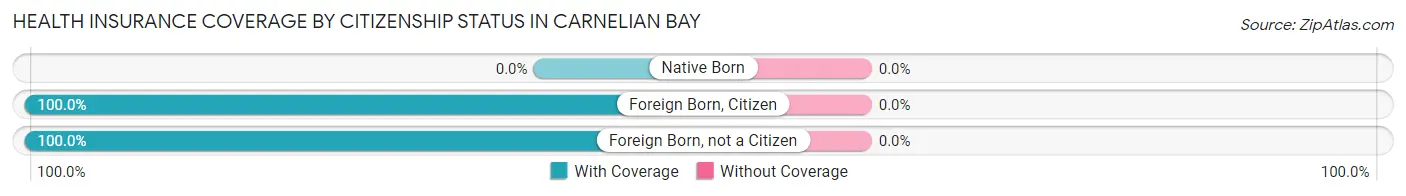
| Citizenship Status | With Coverage | Without Coverage |
| Native Born | 0 (0.0%) | 0 (0.0%) |
| Foreign Born, Citizen | 56 (100.0%) | 0 (0.0%) |
| Foreign Born, not a Citizen | 39 (100.0%) | 0 (0.0%) |
Health Insurance Coverage by Household Income in Carnelian Bay
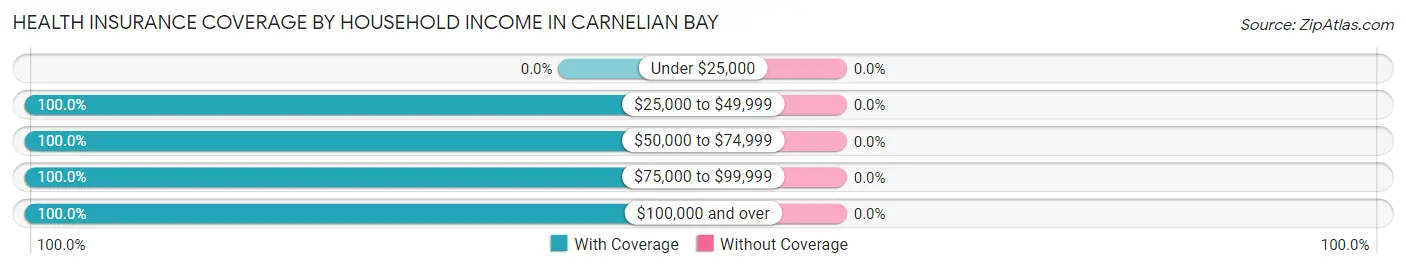
| Household Income | With Coverage | Without Coverage |
| Under $25,000 | 0 (0.0%) | 0 (0.0%) |
| $25,000 to $49,999 | 24 (100.0%) | 0 (0.0%) |
| $50,000 to $74,999 | 68 (100.0%) | 0 (0.0%) |
| $75,000 to $99,999 | 28 (100.0%) | 0 (0.0%) |
| $100,000 and over | 414 (100.0%) | 0 (0.0%) |
Public vs Private Health Insurance Coverage by Age in Carnelian Bay
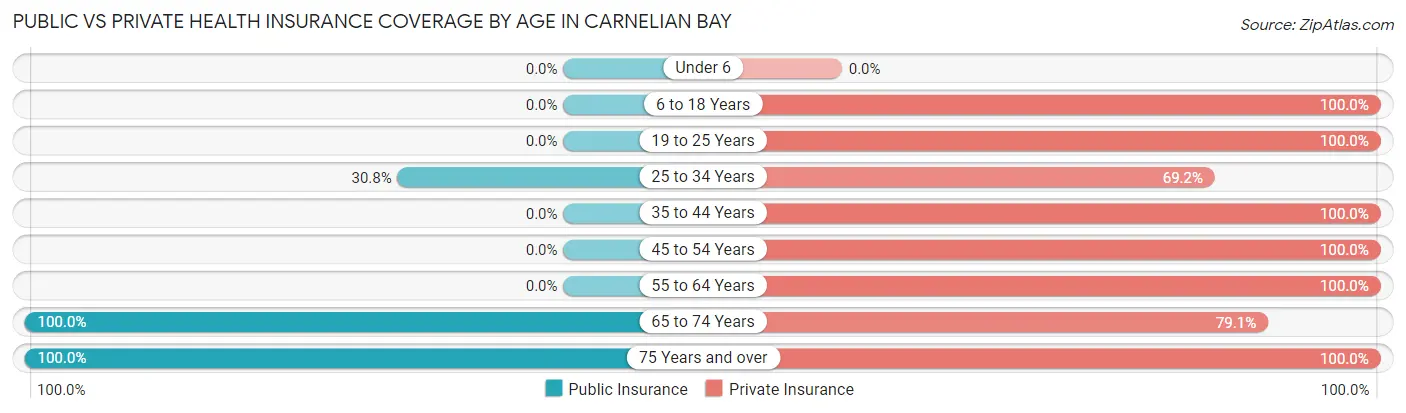
| Age Bracket | Public Insurance | Private Insurance |
| Under 6 | 0 (0.0%) | 0 (0.0%) |
| 6 to 18 Years | 0 (0.0%) | 56 (100.0%) |
| 19 to 25 Years | 0 (0.0%) | 39 (100.0%) |
| 25 to 34 Years | 32 (30.8%) | 72 (69.2%) |
| 35 to 44 Years | 0 (0.0%) | 104 (100.0%) |
| 45 to 54 Years | 0 (0.0%) | 80 (100.0%) |
| 55 to 64 Years | 0 (0.0%) | 35 (100.0%) |
| 65 to 74 Years | 67 (100.0%) | 53 (79.1%) |
| 75 Years and over | 49 (100.0%) | 49 (100.0%) |
| Total | 148 (27.7%) | 488 (91.4%) |
Disability Status by Sex by Age in Carnelian Bay
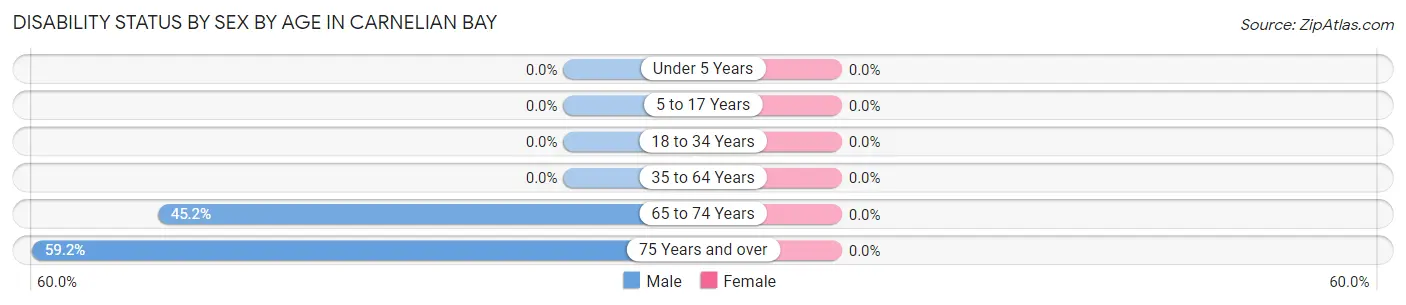
| Age Bracket | Male | Female |
| Under 5 Years | 0 (0.0%) | 0 (0.0%) |
| 5 to 17 Years | 0 (0.0%) | 0 (0.0%) |
| 18 to 34 Years | 0 (0.0%) | 0 (0.0%) |
| 35 to 64 Years | 0 (0.0%) | 0 (0.0%) |
| 65 to 74 Years | 14 (45.2%) | 0 (0.0%) |
| 75 Years and over | 29 (59.2%) | 0 (0.0%) |
Disability Class by Sex by Age in Carnelian Bay
Disability Class: Hearing Difficulty
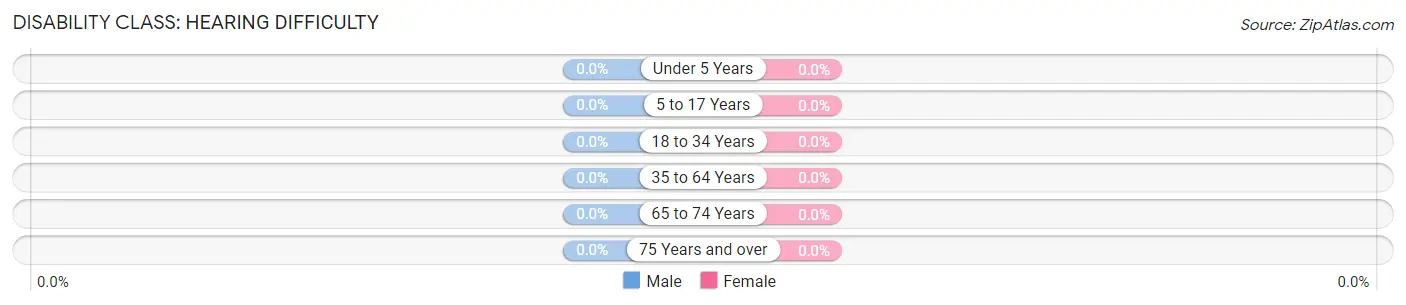
| Age Bracket | Male | Female |
| Under 5 Years | 0 (0.0%) | 0 (0.0%) |
| 5 to 17 Years | 0 (0.0%) | 0 (0.0%) |
| 18 to 34 Years | 0 (0.0%) | 0 (0.0%) |
| 35 to 64 Years | 0 (0.0%) | 0 (0.0%) |
| 65 to 74 Years | 0 (0.0%) | 0 (0.0%) |
| 75 Years and over | 0 (0.0%) | 0 (0.0%) |
Disability Class: Vision Difficulty
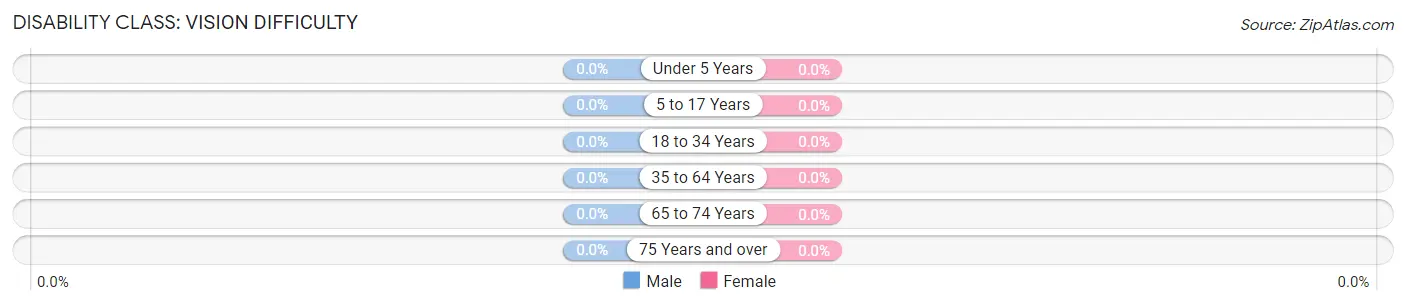
| Age Bracket | Male | Female |
| Under 5 Years | 0 (0.0%) | 0 (0.0%) |
| 5 to 17 Years | 0 (0.0%) | 0 (0.0%) |
| 18 to 34 Years | 0 (0.0%) | 0 (0.0%) |
| 35 to 64 Years | 0 (0.0%) | 0 (0.0%) |
| 65 to 74 Years | 0 (0.0%) | 0 (0.0%) |
| 75 Years and over | 0 (0.0%) | 0 (0.0%) |
Disability Class: Cognitive Difficulty
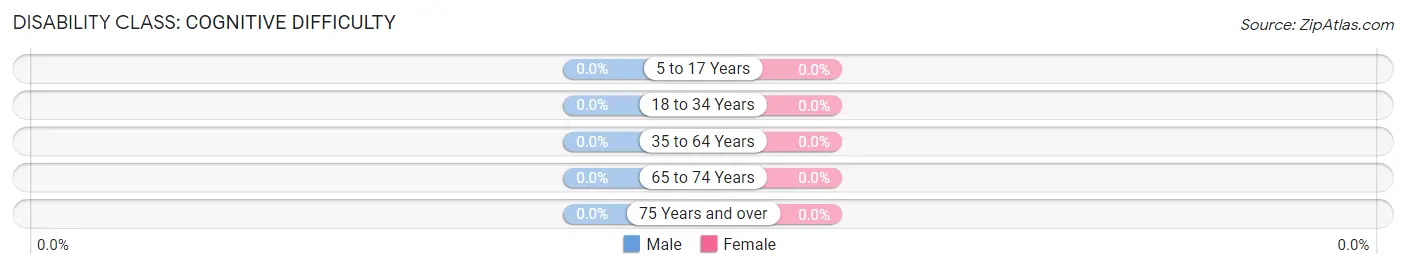
| Age Bracket | Male | Female |
| 5 to 17 Years | 0 (0.0%) | 0 (0.0%) |
| 18 to 34 Years | 0 (0.0%) | 0 (0.0%) |
| 35 to 64 Years | 0 (0.0%) | 0 (0.0%) |
| 65 to 74 Years | 0 (0.0%) | 0 (0.0%) |
| 75 Years and over | 0 (0.0%) | 0 (0.0%) |
Disability Class: Ambulatory Difficulty
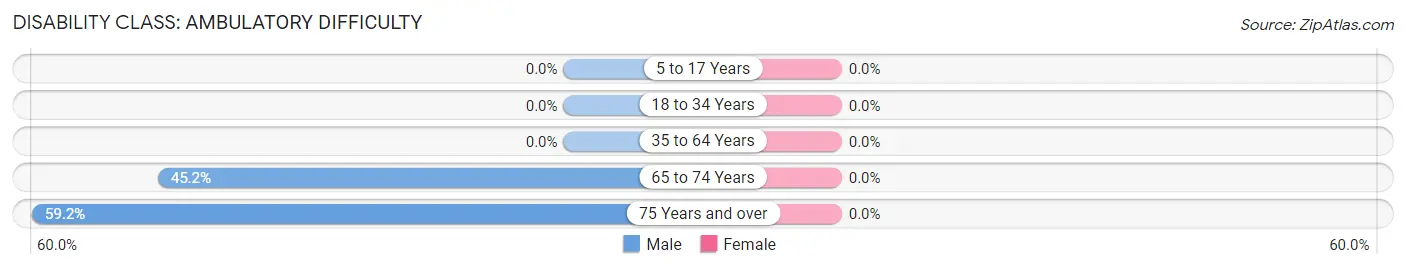
| Age Bracket | Male | Female |
| 5 to 17 Years | 0 (0.0%) | 0 (0.0%) |
| 18 to 34 Years | 0 (0.0%) | 0 (0.0%) |
| 35 to 64 Years | 0 (0.0%) | 0 (0.0%) |
| 65 to 74 Years | 14 (45.2%) | 0 (0.0%) |
| 75 Years and over | 29 (59.2%) | 0 (0.0%) |
Disability Class: Self-Care Difficulty
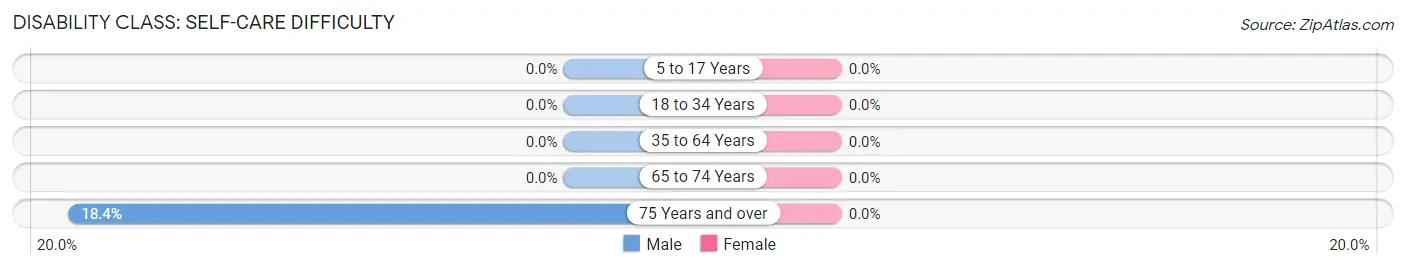
| Age Bracket | Male | Female |
| 5 to 17 Years | 0 (0.0%) | 0 (0.0%) |
| 18 to 34 Years | 0 (0.0%) | 0 (0.0%) |
| 35 to 64 Years | 0 (0.0%) | 0 (0.0%) |
| 65 to 74 Years | 0 (0.0%) | 0 (0.0%) |
| 75 Years and over | 9 (18.4%) | 0 (0.0%) |
Technology Access in Carnelian Bay
Computing Device Access in Carnelian Bay
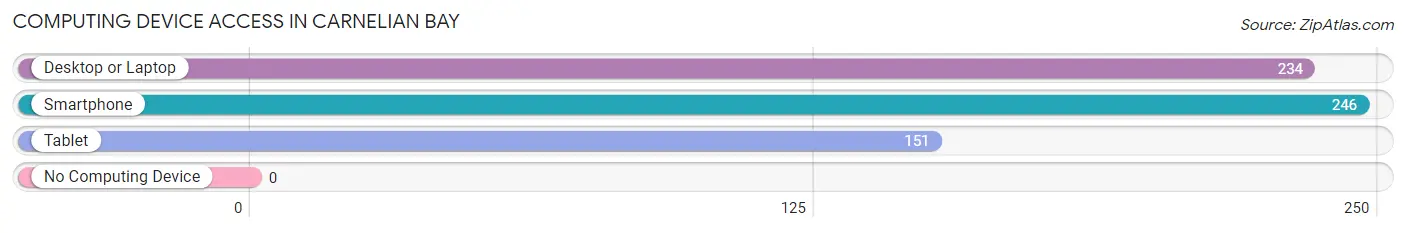
| Device Type | # Households | % Households |
| Desktop or Laptop | 234 | 92.1% |
| Smartphone | 246 | 96.9% |
| Tablet | 151 | 59.5% |
| No Computing Device | 0 | 0.0% |
| Total | 254 | 100.0% |
Internet Access in Carnelian Bay
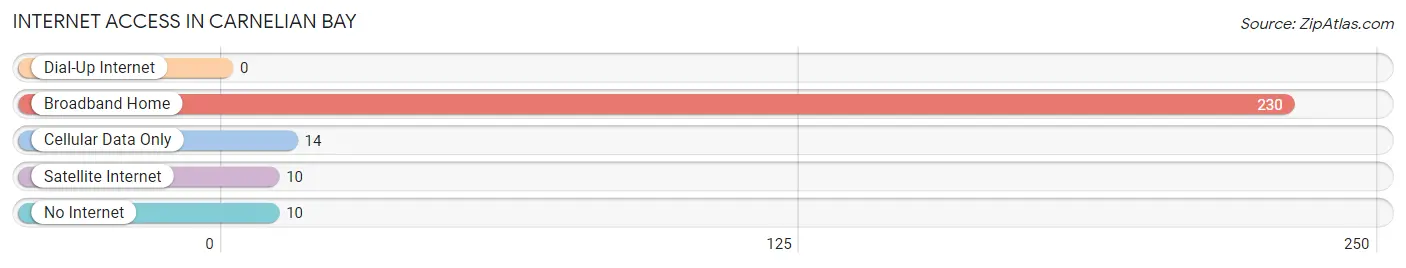
| Internet Type | # Households | % Households |
| Dial-Up Internet | 0 | 0.0% |
| Broadband Home | 230 | 90.5% |
| Cellular Data Only | 14 | 5.5% |
| Satellite Internet | 10 | 3.9% |
| No Internet | 10 | 3.9% |
| Total | 254 | 100.0% |
Carnelian Bay Summary
Carnelian Bay is a small unincorporated community located in Placer County, California, United States. It is situated on the north shore of Lake Tahoe, approximately 25 miles (40 km) northwest of the city of Reno, Nevada. The population of Carnelian Bay was 1,845 at the 2010 census.
History
The area that is now Carnelian Bay was originally inhabited by the Washoe people, who lived in the area for thousands of years before the arrival of European settlers. The first European settlers arrived in the area in the mid-1800s, and the town of Carnelian Bay was established in 1864. The town was named after the semi-precious stone carnelian, which was found in abundance in the area.
In the early 1900s, the town became a popular tourist destination, with visitors coming to enjoy the area’s natural beauty and recreational activities. The town was also home to a number of resorts, including the Carnelian Bay Hotel, which was built in 1906 and is still in operation today.
Geography
Carnelian Bay is located in Placer County, California, at an elevation of 6,200 feet (1,890 m). It is situated on the north shore of Lake Tahoe, approximately 25 miles (40 km) northwest of the city of Reno, Nevada. The town is surrounded by the Sierra Nevada mountain range to the east and the Carson Range to the west.
The town of Carnelian Bay covers an area of 2.2 square miles (5.7 km2), all of which is land. The town is located in a temperate climate zone, with an average annual temperature of 50°F (10°C).
Economy
The economy of Carnelian Bay is largely based on tourism and recreation. The town is home to a number of resorts, including the Carnelian Bay Hotel, which was built in 1906 and is still in operation today. The town is also home to a number of restaurants, bars, and shops, as well as a marina and boat launch.
The town is also home to a number of businesses that provide services to the local community, such as a post office, a library, and a medical clinic. The town is also home to a number of art galleries and studios, as well as a number of outdoor recreation activities, such as skiing, snowboarding, and hiking.
Demographics
As of the 2010 census, the population of Carnelian Bay was 1,845. The racial makeup of the town was 94.3% White, 0.7% African American, 0.3% Native American, 0.7% Asian, 0.1% Pacific Islander, 1.2% from other races, and 2.9% from two or more races. Hispanic or Latino of any race were 4.2% of the population.
The median household income in Carnelian Bay was $60,938, and the median family income was $68,750. The per capita income for the town was $35,945. About 8.3% of families and 10.2% of the population were below the poverty line, including 14.3% of those under age 18 and 4.2% of those age 65 or over.
Common Questions
What is Per Capita Income in Carnelian Bay?
Per Capita income in Carnelian Bay is $74,155.
What is the Median Household income in Carnelian Bay?
Median Household Income in Carnelian Bay is $130,750.
What is Income or Wage Gap in Carnelian Bay?
Income or Wage Gap in Carnelian Bay is 45.1%.
Women in Carnelian Bay earn 54.9 cents for every dollar earned by a man.
What is Inequality or Gini Index in Carnelian Bay?
Inequality or Gini Index in Carnelian Bay is 0.26.
What is the Total Population of Carnelian Bay?
Total Population of Carnelian Bay is 534.
What is the Total Male Population of Carnelian Bay?
Total Male Population of Carnelian Bay is 262.
What is the Total Female Population of Carnelian Bay?
Total Female Population of Carnelian Bay is 272.
What is the Ratio of Males per 100 Females in Carnelian Bay?
There are 96.32 Males per 100 Females in Carnelian Bay.
What is the Ratio of Females per 100 Males in Carnelian Bay?
There are 103.82 Females per 100 Males in Carnelian Bay.
What is the Median Population Age in Carnelian Bay?
Median Population Age in Carnelian Bay is 40.3 Years.
What is the Average Family Size in Carnelian Bay
Average Family Size in Carnelian Bay is 2.7 People.
What is the Average Household Size in Carnelian Bay
Average Household Size in Carnelian Bay is 2.1 People.
How Large is the Labor Force in Carnelian Bay?
There are 336 People in the Labor Forcein in Carnelian Bay.
What is the Percentage of People in the Labor Force in Carnelian Bay?
70.3% of People are in the Labor Force in Carnelian Bay.