Cities with the Highest Percentage of Population Employed in Computer, Engineering & Science in North Dakota
RELATED REPORTS & OPTIONS
Computer, Engineering & Science
North Dakota
Compare Cities
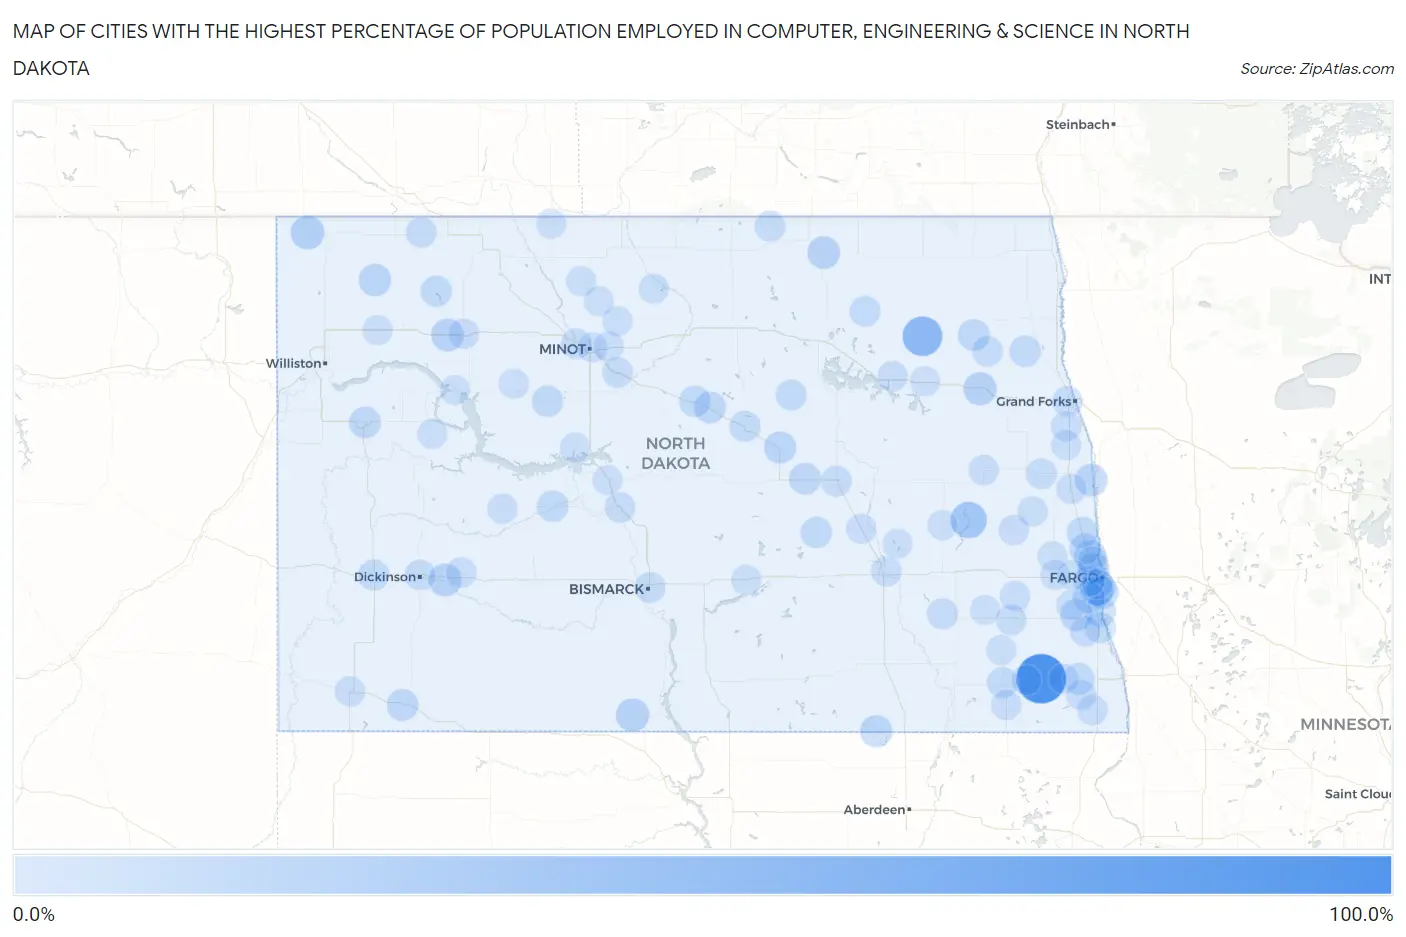
Map of Cities with the Highest Percentage of Population Employed in Computer, Engineering & Science in North Dakota
0.0%
100.0%
Cities with the Highest Percentage of Population Employed in Computer, Engineering & Science in North Dakota
| City | % Employed | vs State | vs National | |
| 1. | De Lamere | 100.0% | 4.7%(+95.3)#1 | 6.8%(+93.2)#18 |
| 2. | Lawton | 50.0% | 4.7%(+45.3)#2 | 6.8%(+43.2)#73 |
| 3. | Sibley | 33.3% | 4.7%(+28.6)#3 | 6.8%(+26.6)#168 |
| 4. | Prairie Rose | 28.6% | 4.7%(+23.9)#4 | 6.8%(+21.8)#249 |
| 5. | Fortuna | 20.8% | 4.7%(+16.1)#5 | 6.8%(+14.1)#518 |
| 6. | Selfridge | 18.2% | 4.7%(+13.5)#6 | 6.8%(+11.4)#711 |
| 7. | Niagara | 17.6% | 4.7%(+12.9)#7 | 6.8%(+10.9)#759 |
| 8. | Gladstone | 17.1% | 4.7%(+12.4)#8 | 6.8%(+10.4)#817 |
| 9. | Ross | 16.3% | 4.7%(+11.6)#9 | 6.8%(+9.58)#913 |
| 10. | Rocklake | 15.9% | 4.7%(+11.2)#10 | 6.8%(+9.14)#971 |
| 11. | Brooktree Park | 14.8% | 4.7%(+10.1)#11 | 6.8%(+8.05)#1,173 |
| 12. | Caledonia | 14.7% | 4.7%(+9.99)#12 | 6.8%(+7.94)#1,196 |
| 13. | Wildrose | 14.5% | 4.7%(+9.83)#13 | 6.8%(+7.78)#1,229 |
| 14. | Kindred | 13.4% | 4.7%(+8.72)#14 | 6.8%(+6.67)#1,508 |
| 15. | Fessenden | 13.3% | 4.7%(+8.61)#15 | 6.8%(+6.57)#1,533 |
| 16. | Forbes | 13.3% | 4.7%(+8.61)#16 | 6.8%(+6.57)#1,542 |
| 17. | Briarwood | 12.9% | 4.7%(+8.18)#17 | 6.8%(+6.14)#1,663 |
| 18. | Reile S Acres | 12.6% | 4.7%(+7.93)#18 | 6.8%(+5.88)#1,738 |
| 19. | Watford City | 12.0% | 4.7%(+7.30)#19 | 6.8%(+5.26)#1,928 |
| 20. | Sykeston | 12.0% | 4.7%(+7.28)#20 | 6.8%(+5.24)#1,942 |
| 21. | Anamoose | 11.8% | 4.7%(+7.05)#21 | 6.8%(+5.00)#2,021 |
| 22. | Reeder | 11.5% | 4.7%(+6.82)#22 | 6.8%(+4.77)#2,101 |
| 23. | Lankin | 11.1% | 4.7%(+6.39)#23 | 6.8%(+4.35)#2,321 |
| 24. | Frontier | 10.8% | 4.7%(+6.06)#24 | 6.8%(+4.02)#2,475 |
| 25. | Barney | 10.7% | 4.7%(+5.99)#25 | 6.8%(+3.95)#2,515 |
| 26. | Horace | 10.7% | 4.7%(+5.98)#26 | 6.8%(+3.94)#2,525 |
| 27. | Oxbow | 10.5% | 4.7%(+5.78)#27 | 6.8%(+3.74)#2,639 |
| 28. | Hazen | 10.4% | 4.7%(+5.63)#28 | 6.8%(+3.59)#2,726 |
| 29. | Drake | 10.2% | 4.7%(+5.47)#29 | 6.8%(+3.42)#2,827 |
| 30. | Ryder | 9.8% | 4.7%(+5.04)#30 | 6.8%(+2.99)#3,108 |
| 31. | Gardner | 9.8% | 4.7%(+5.04)#31 | 6.8%(+2.99)#3,110 |
| 32. | Powers Lake | 9.6% | 4.7%(+4.85)#32 | 6.8%(+2.80)#3,267 |
| 33. | Woodworth | 9.5% | 4.7%(+4.80)#33 | 6.8%(+2.76)#3,296 |
| 34. | Argusville | 9.5% | 4.7%(+4.79)#34 | 6.8%(+2.74)#3,309 |
| 35. | Forest River | 9.4% | 4.7%(+4.71)#35 | 6.8%(+2.67)#3,364 |
| 36. | Harvey | 8.8% | 4.7%(+4.06)#36 | 6.8%(+2.02)#3,915 |
| 37. | Christine | 8.7% | 4.7%(+4.02)#37 | 6.8%(+1.97)#3,951 |
| 38. | Belfield | 8.6% | 4.7%(+3.83)#38 | 6.8%(+1.79)#4,122 |
| 39. | Gwinner | 8.4% | 4.7%(+3.63)#39 | 6.8%(+1.59)#4,314 |
| 40. | West Fargo | 8.1% | 4.7%(+3.34)#40 | 6.8%(+1.30)#4,616 |
| 41. | Maddock | 7.7% | 4.7%(+3.02)#41 | 6.8%(+0.977)#5,018 |
| 42. | Starkweather | 7.7% | 4.7%(+2.97)#42 | 6.8%(+0.928)#5,093 |
| 43. | St John | 7.6% | 4.7%(+2.90)#43 | 6.8%(+0.854)#5,172 |
| 44. | Litchville | 7.5% | 4.7%(+2.83)#44 | 6.8%(+0.782)#5,252 |
| 45. | Carrington | 7.5% | 4.7%(+2.76)#45 | 6.8%(+0.714)#5,322 |
| 46. | Washburn | 7.0% | 4.7%(+2.25)#46 | 6.8%(+0.200)#6,002 |
| 47. | Sawyer | 6.7% | 4.7%(+1.95)#47 | 6.8%(-0.098)#6,452 |
| 48. | Columbus | 6.7% | 4.7%(+1.95)#48 | 6.8%(-0.098)#6,461 |
| 49. | Mayville | 6.6% | 4.7%(+1.90)#49 | 6.8%(-0.140)#6,506 |
| 50. | Bismarck | 6.4% | 4.7%(+1.71)#50 | 6.8%(-0.334)#6,811 |
| 51. | Burlington | 6.4% | 4.7%(+1.63)#51 | 6.8%(-0.411)#6,938 |
| 52. | Dickinson | 6.3% | 4.7%(+1.60)#52 | 6.8%(-0.442)#7,004 |
| 53. | Enderlin | 6.2% | 4.7%(+1.43)#53 | 6.8%(-0.611)#7,293 |
| 54. | Fordville | 6.2% | 4.7%(+1.43)#54 | 6.8%(-0.611)#7,298 |
| 55. | Fargo | 5.9% | 4.7%(+1.18)#55 | 6.8%(-0.864)#7,777 |
| 56. | Walcott | 5.8% | 4.7%(+1.09)#56 | 6.8%(-0.958)#7,981 |
| 57. | Grand Forks | 5.7% | 4.7%(+0.991)#57 | 6.8%(-1.05)#8,164 |
| 58. | Hankinson | 5.5% | 4.7%(+0.779)#58 | 6.8%(-1.27)#8,526 |
| 59. | Taylor | 5.5% | 4.7%(+0.775)#59 | 6.8%(-1.27)#8,538 |
| 60. | Crary | 5.5% | 4.7%(+0.735)#60 | 6.8%(-1.31)#8,625 |
| 61. | Jamestown | 5.4% | 4.7%(+0.662)#61 | 6.8%(-1.38)#8,781 |
| 62. | Stanley | 5.3% | 4.7%(+0.596)#62 | 6.8%(-1.45)#8,897 |
| 63. | Hillsboro | 5.1% | 4.7%(+0.371)#63 | 6.8%(-1.67)#9,364 |
| 64. | Forman | 5.1% | 4.7%(+0.331)#64 | 6.8%(-1.71)#9,455 |
| 65. | Golden Valley | 5.0% | 4.7%(+0.280)#65 | 6.8%(-1.76)#9,580 |
| 66. | Pingree | 5.0% | 4.7%(+0.280)#66 | 6.8%(-1.76)#9,594 |
| 67. | Bowman | 4.8% | 4.7%(+0.111)#67 | 6.8%(-1.93)#9,945 |
| 68. | Page | 4.8% | 4.7%(+0.042)#68 | 6.8%(-2.00)#10,115 |
| 69. | Harwood | 4.7% | 4.7%(+0.017)#69 | 6.8%(-2.03)#10,155 |
| 70. | Finley | 4.7% | 4.7%(-0.022)#70 | 6.8%(-2.07)#10,238 |
| 71. | Galesburg | 4.7% | 4.7%(-0.069)#71 | 6.8%(-2.11)#10,363 |
| 72. | Thompson | 4.6% | 4.7%(-0.138)#72 | 6.8%(-2.18)#10,503 |
| 73. | Upham | 4.5% | 4.7%(-0.174)#73 | 6.8%(-2.22)#10,598 |
| 74. | Alice | 4.5% | 4.7%(-0.174)#74 | 6.8%(-2.22)#10,611 |
| 75. | Mantador | 4.5% | 4.7%(-0.174)#75 | 6.8%(-2.22)#10,612 |
| 76. | Dazey | 4.4% | 4.7%(-0.275)#76 | 6.8%(-2.32)#10,831 |
| 77. | Mapleton | 4.4% | 4.7%(-0.314)#77 | 6.8%(-2.36)#10,919 |
| 78. | Steele | 4.4% | 4.7%(-0.316)#78 | 6.8%(-2.36)#10,923 |
| 79. | Davenport | 4.4% | 4.7%(-0.345)#79 | 6.8%(-2.39)#10,997 |
| 80. | Underwood | 4.3% | 4.7%(-0.446)#80 | 6.8%(-2.49)#11,241 |
| 81. | Plaza | 4.2% | 4.7%(-0.509)#81 | 6.8%(-2.55)#11,423 |
| 82. | Reynolds | 4.2% | 4.7%(-0.536)#82 | 6.8%(-2.58)#11,497 |
| 83. | Sherwood | 4.2% | 4.7%(-0.553)#83 | 6.8%(-2.60)#11,545 |
| 84. | Mandaree | 4.1% | 4.7%(-0.602)#84 | 6.8%(-2.65)#11,663 |
| 85. | Surrey | 4.1% | 4.7%(-0.604)#85 | 6.8%(-2.65)#11,668 |
| 86. | Deering | 4.1% | 4.7%(-0.638)#86 | 6.8%(-2.68)#11,763 |
| 87. | Garrison | 4.1% | 4.7%(-0.644)#87 | 6.8%(-2.69)#11,778 |
| 88. | Lansford | 4.0% | 4.7%(-0.720)#88 | 6.8%(-2.76)#11,970 |
| 89. | Amenia | 4.0% | 4.7%(-0.720)#89 | 6.8%(-2.76)#11,973 |
| 90. | Milnor | 4.0% | 4.7%(-0.729)#90 | 6.8%(-2.77)#11,995 |
| 91. | Lisbon | 4.0% | 4.7%(-0.756)#91 | 6.8%(-2.80)#12,074 |
| 92. | Lakota | 3.9% | 4.7%(-0.819)#92 | 6.8%(-2.86)#12,247 |
| 93. | Wyndmere | 3.9% | 4.7%(-0.829)#93 | 6.8%(-2.87)#12,268 |
| 94. | Glenburn | 3.9% | 4.7%(-0.836)#94 | 6.8%(-2.88)#12,293 |
| 95. | Casselton | 3.9% | 4.7%(-0.849)#95 | 6.8%(-2.89)#12,340 |
| 96. | Minot | 3.8% | 4.7%(-0.897)#96 | 6.8%(-2.94)#12,469 |
| 97. | Spiritwood Lake | 3.8% | 4.7%(-0.910)#97 | 6.8%(-2.96)#12,519 |
| 98. | New Town | 3.7% | 4.7%(-0.988)#98 | 6.8%(-3.03)#12,721 |
| 99. | Nome | 3.7% | 4.7%(-1.02)#99 | 6.8%(-3.06)#12,824 |
| 100. | Ray | 3.7% | 4.7%(-1.06)#100 | 6.8%(-3.11)#12,939 |
Common Questions
What are the Top 10 Cities with the Highest Percentage of Population Employed in Computer, Engineering & Science in North Dakota?
Top 10 Cities with the Highest Percentage of Population Employed in Computer, Engineering & Science in North Dakota are:
What city has the Highest Percentage of Population Employed in Computer, Engineering & Science in North Dakota?
De Lamere has the Highest Percentage of Population Employed in Computer, Engineering & Science in North Dakota with 100.0%.
What is the Percentage of Population Employed in Computer, Engineering & Science in the State of North Dakota?
Percentage of Population Employed in Computer, Engineering & Science in North Dakota is 4.7%.
What is the Percentage of Population Employed in Computer, Engineering & Science in the United States?
Percentage of Population Employed in Computer, Engineering & Science in the United States is 6.8%.