Cities with the Highest Percentage of Population Employed in Computer, Engineering & Science in New Jersey
RELATED REPORTS & OPTIONS
Computer, Engineering & Science
New Jersey
Compare Cities
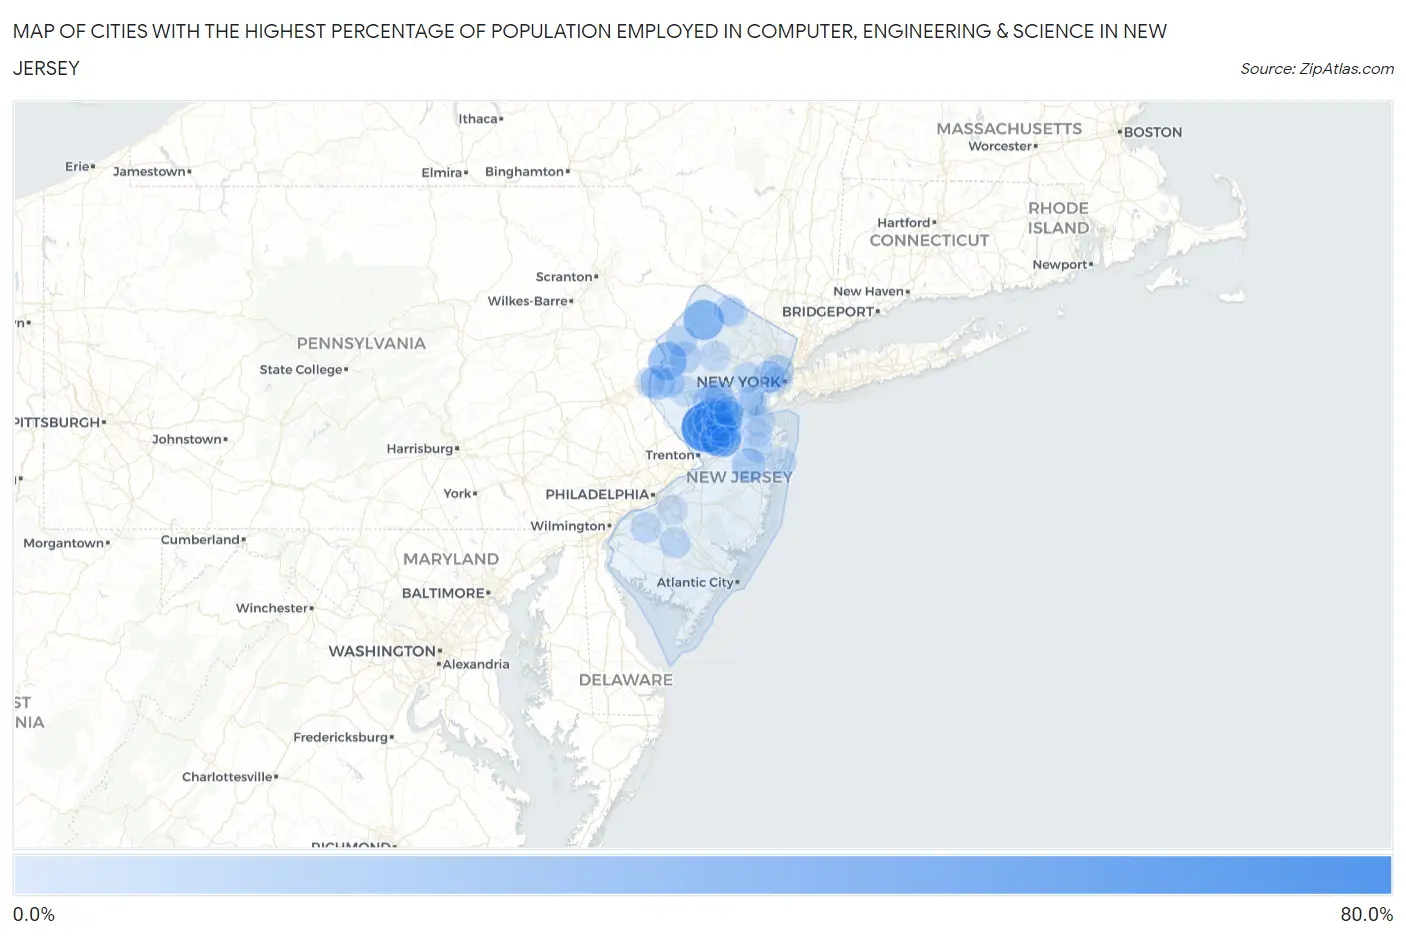
Map of Cities with the Highest Percentage of Population Employed in Computer, Engineering & Science in New Jersey
0.0%
80.0%
Cities with the Highest Percentage of Population Employed in Computer, Engineering & Science in New Jersey
| City | % Employed | vs State | vs National | |
| 1. | Blawenburg | 60.6% | 7.7%(+52.9)#1 | 6.8%(+53.8)#40 |
| 2. | Forsgate | 45.3% | 7.7%(+37.6)#2 | 6.8%(+38.5)#91 |
| 3. | Monroe Manor | 42.2% | 7.7%(+34.5)#3 | 6.8%(+35.4)#105 |
| 4. | Nesco | 40.4% | 7.7%(+32.8)#4 | 6.8%(+33.7)#115 |
| 5. | Ross Corner | 36.8% | 7.7%(+29.2)#5 | 6.8%(+30.1)#137 |
| 6. | Princeton Meadows | 36.1% | 7.7%(+28.4)#6 | 6.8%(+29.3)#144 |
| 7. | Bridgeville | 32.3% | 7.7%(+24.6)#7 | 6.8%(+25.5)#182 |
| 8. | Belle Mead | 31.9% | 7.7%(+24.3)#8 | 6.8%(+25.2)#183 |
| 9. | Oldwick | 31.4% | 7.7%(+23.7)#9 | 6.8%(+24.6)#194 |
| 10. | Deans | 29.3% | 7.7%(+21.6)#10 | 6.8%(+22.5)#234 |
| 11. | Six Mile Run | 25.9% | 7.7%(+18.2)#11 | 6.8%(+19.1)#310 |
| 12. | Plainsboro Center | 24.2% | 7.7%(+16.5)#12 | 6.8%(+17.4)#353 |
| 13. | Heathcote | 23.8% | 7.7%(+16.1)#13 | 6.8%(+17.1)#367 |
| 14. | Upper Stewartsville | 22.9% | 7.7%(+15.2)#14 | 6.8%(+16.1)#407 |
| 15. | Vista Center | 22.0% | 7.7%(+14.4)#15 | 6.8%(+15.3)#443 |
| 16. | Bradley Gardens | 21.8% | 7.7%(+14.1)#16 | 6.8%(+15.1)#456 |
| 17. | Skillman | 21.5% | 7.7%(+13.9)#17 | 6.8%(+14.8)#472 |
| 18. | Franklin Park | 21.1% | 7.7%(+13.5)#18 | 6.8%(+14.4)#496 |
| 19. | Pine Brook | 21.1% | 7.7%(+13.4)#19 | 6.8%(+14.4)#498 |
| 20. | Troy Hills | 20.9% | 7.7%(+13.2)#20 | 6.8%(+14.1)#517 |
| 21. | Parsippany | 19.9% | 7.7%(+12.3)#21 | 6.8%(+13.2)#556 |
| 22. | Secaucus | 19.8% | 7.7%(+12.1)#22 | 6.8%(+13.0)#565 |
| 23. | Oceanville | 19.4% | 7.7%(+11.8)#23 | 6.8%(+12.7)#599 |
| 24. | Green Knoll | 19.2% | 7.7%(+11.5)#24 | 6.8%(+12.5)#615 |
| 25. | Neshanic | 19.2% | 7.7%(+11.5)#25 | 6.8%(+12.4)#616 |
| 26. | Lake Hiawatha | 19.0% | 7.7%(+11.3)#26 | 6.8%(+12.2)#641 |
| 27. | Pleasant Plains | 18.6% | 7.7%(+11.0)#27 | 6.8%(+11.9)#670 |
| 28. | Rutgers University-Livingston Campus | 18.1% | 7.7%(+10.5)#28 | 6.8%(+11.4)#716 |
| 29. | Princeton | 18.1% | 7.7%(+10.4)#29 | 6.8%(+11.3)#718 |
| 30. | Mount Royal | 17.9% | 7.7%(+10.3)#30 | 6.8%(+11.2)#736 |
| 31. | Seaside Heights Borough | 17.5% | 7.7%(+9.83)#31 | 6.8%(+10.7)#771 |
| 32. | Monmouth Junction | 17.4% | 7.7%(+9.71)#32 | 6.8%(+10.6)#789 |
| 33. | Hillsborough | 17.3% | 7.7%(+9.68)#33 | 6.8%(+10.6)#792 |
| 34. | The Hills | 17.2% | 7.7%(+9.58)#34 | 6.8%(+10.5)#802 |
| 35. | Harlingen | 17.2% | 7.7%(+9.52)#35 | 6.8%(+10.4)#809 |
| 36. | Ten Mile Run | 17.1% | 7.7%(+9.45)#36 | 6.8%(+10.4)#816 |
| 37. | Dayton | 16.7% | 7.7%(+9.04)#37 | 6.8%(+9.94)#868 |
| 38. | Iselin | 16.7% | 7.7%(+8.99)#38 | 6.8%(+9.90)#879 |
| 39. | Bridgewater Center | 16.4% | 7.7%(+8.75)#39 | 6.8%(+9.65)#900 |
| 40. | Vienna | 16.4% | 7.7%(+8.72)#40 | 6.8%(+9.63)#906 |
| 41. | Marksboro | 16.2% | 7.7%(+8.50)#41 | 6.8%(+9.41)#939 |
| 42. | Neshanic Station | 15.9% | 7.7%(+8.24)#42 | 6.8%(+9.15)#969 |
| 43. | Victory Lakes | 15.7% | 7.7%(+8.04)#43 | 6.8%(+8.95)#1,003 |
| 44. | Blackwells Mills | 15.6% | 7.7%(+7.97)#44 | 6.8%(+8.88)#1,014 |
| 45. | New Gretna | 15.5% | 7.7%(+7.86)#45 | 6.8%(+8.77)#1,029 |
| 46. | Windsor | 15.4% | 7.7%(+7.71)#46 | 6.8%(+8.62)#1,058 |
| 47. | Mullica Hill | 15.3% | 7.7%(+7.61)#47 | 6.8%(+8.52)#1,088 |
| 48. | Kendall Park | 15.1% | 7.7%(+7.47)#48 | 6.8%(+8.38)#1,113 |
| 49. | Franklin Center | 15.1% | 7.7%(+7.44)#49 | 6.8%(+8.35)#1,118 |
| 50. | Avenel | 15.0% | 7.7%(+7.37)#50 | 6.8%(+8.28)#1,132 |
| 51. | Harrison | 15.0% | 7.7%(+7.29)#51 | 6.8%(+8.20)#1,143 |
| 52. | East Freehold | 14.7% | 7.7%(+7.05)#52 | 6.8%(+7.96)#1,191 |
| 53. | Kenvil | 14.7% | 7.7%(+7.03)#53 | 6.8%(+7.93)#1,199 |
| 54. | Lebanon Borough | 14.7% | 7.7%(+7.00)#54 | 6.8%(+7.91)#1,203 |
| 55. | Short Hills | 14.6% | 7.7%(+6.97)#55 | 6.8%(+7.87)#1,208 |
| 56. | Annandale | 14.6% | 7.7%(+6.88)#56 | 6.8%(+7.79)#1,226 |
| 57. | Woodcliff Lake Borough | 14.4% | 7.7%(+6.68)#57 | 6.8%(+7.59)#1,259 |
| 58. | Cliffwood Beach | 14.3% | 7.7%(+6.59)#58 | 6.8%(+7.49)#1,285 |
| 59. | River Edge Borough | 14.3% | 7.7%(+6.58)#59 | 6.8%(+7.49)#1,286 |
| 60. | Voorhees | 14.1% | 7.7%(+6.45)#60 | 6.8%(+7.35)#1,307 |
| 61. | West Belmar | 14.0% | 7.7%(+6.34)#61 | 6.8%(+7.25)#1,331 |
| 62. | Highland Park Borough | 14.0% | 7.7%(+6.34)#62 | 6.8%(+7.24)#1,332 |
| 63. | Fair Lawn Borough | 13.9% | 7.7%(+6.27)#63 | 6.8%(+7.18)#1,345 |
| 64. | Silver Lake Cdp Warren County | 13.9% | 7.7%(+6.27)#64 | 6.8%(+7.17)#1,346 |
| 65. | Garwood Borough | 13.9% | 7.7%(+6.26)#65 | 6.8%(+7.16)#1,351 |
| 66. | Caldwell Borough | 13.9% | 7.7%(+6.22)#66 | 6.8%(+7.13)#1,358 |
| 67. | Absecon Highlands | 13.9% | 7.7%(+6.21)#67 | 6.8%(+7.12)#1,365 |
| 68. | Edgewater Borough | 13.8% | 7.7%(+6.09)#68 | 6.8%(+7.00)#1,403 |
| 69. | Shrewsbury Borough | 13.8% | 7.7%(+6.09)#69 | 6.8%(+7.00)#1,405 |
| 70. | Chatham Borough | 13.7% | 7.7%(+6.02)#70 | 6.8%(+6.92)#1,424 |
| 71. | Wood Ridge Borough | 13.7% | 7.7%(+6.01)#71 | 6.8%(+6.92)#1,425 |
| 72. | Asbury | 13.7% | 7.7%(+6.01)#72 | 6.8%(+6.92)#1,426 |
| 73. | Robbinsville Center | 13.7% | 7.7%(+6.01)#73 | 6.8%(+6.92)#1,428 |
| 74. | Delaware Park | 13.6% | 7.7%(+5.96)#74 | 6.8%(+6.87)#1,438 |
| 75. | Jersey City | 13.6% | 7.7%(+5.89)#75 | 6.8%(+6.80)#1,463 |
| 76. | Martinsville | 13.5% | 7.7%(+5.80)#76 | 6.8%(+6.71)#1,486 |
| 77. | Whippany | 13.5% | 7.7%(+5.80)#77 | 6.8%(+6.70)#1,492 |
| 78. | Cedar Knolls | 13.3% | 7.7%(+5.66)#78 | 6.8%(+6.57)#1,531 |
| 79. | Vernon Center | 13.3% | 7.7%(+5.63)#79 | 6.8%(+6.54)#1,548 |
| 80. | Cranbury | 13.3% | 7.7%(+5.60)#80 | 6.8%(+6.50)#1,557 |
| 81. | Dunellen Borough | 13.2% | 7.7%(+5.53)#81 | 6.8%(+6.44)#1,573 |
| 82. | Pennington Borough | 13.1% | 7.7%(+5.45)#82 | 6.8%(+6.36)#1,593 |
| 83. | East Rutherford Borough | 13.1% | 7.7%(+5.42)#83 | 6.8%(+6.33)#1,604 |
| 84. | Old Tappan Borough | 12.8% | 7.7%(+5.08)#84 | 6.8%(+5.99)#1,708 |
| 85. | New Providence Borough | 12.6% | 7.7%(+4.94)#85 | 6.8%(+5.84)#1,749 |
| 86. | Demarest Borough | 12.5% | 7.7%(+4.82)#86 | 6.8%(+5.73)#1,777 |
| 87. | Mountainside Borough | 12.5% | 7.7%(+4.81)#87 | 6.8%(+5.72)#1,781 |
| 88. | Echelon | 12.5% | 7.7%(+4.81)#88 | 6.8%(+5.72)#1,782 |
| 89. | Morganville | 12.4% | 7.7%(+4.70)#89 | 6.8%(+5.61)#1,816 |
| 90. | Somerville Borough | 12.2% | 7.7%(+4.53)#90 | 6.8%(+5.44)#1,886 |
| 91. | Somerset | 12.2% | 7.7%(+4.51)#91 | 6.8%(+5.42)#1,898 |
| 92. | Highland Lakes | 12.2% | 7.7%(+4.49)#92 | 6.8%(+5.40)#1,903 |
| 93. | Lakeside-Beebe Run | 12.1% | 7.7%(+4.45)#93 | 6.8%(+5.36)#1,910 |
| 94. | Barrington Borough | 12.0% | 7.7%(+4.38)#94 | 6.8%(+5.28)#1,925 |
| 95. | Princeton Junction | 12.0% | 7.7%(+4.35)#95 | 6.8%(+5.26)#1,929 |
| 96. | Jobstown | 11.9% | 7.7%(+4.27)#96 | 6.8%(+5.18)#1,960 |
| 97. | Springfield | 11.9% | 7.7%(+4.26)#97 | 6.8%(+5.17)#1,964 |
| 98. | Metuchen Borough | 11.9% | 7.7%(+4.22)#98 | 6.8%(+5.13)#1,982 |
| 99. | Maywood Borough | 11.7% | 7.7%(+3.98)#99 | 6.8%(+4.89)#2,057 |
| 100. | Pleasantdale | 11.5% | 7.7%(+3.88)#100 | 6.8%(+4.78)#2,094 |
Common Questions
What are the Top 10 Cities with the Highest Percentage of Population Employed in Computer, Engineering & Science in New Jersey?
Top 10 Cities with the Highest Percentage of Population Employed in Computer, Engineering & Science in New Jersey are:
#1
60.6%
#2
36.8%
#3
36.1%
#4
32.3%
#5
31.9%
#6
25.9%
#7
24.2%
#8
23.8%
#9
22.9%
#10
22.0%
What city has the Highest Percentage of Population Employed in Computer, Engineering & Science in New Jersey?
Blawenburg has the Highest Percentage of Population Employed in Computer, Engineering & Science in New Jersey with 60.6%.
What is the Percentage of Population Employed in Computer, Engineering & Science in the State of New Jersey?
Percentage of Population Employed in Computer, Engineering & Science in New Jersey is 7.7%.
What is the Percentage of Population Employed in Computer, Engineering & Science in the United States?
Percentage of Population Employed in Computer, Engineering & Science in the United States is 6.8%.